Journal of Water Resource and Protection
Vol.06 No.13(2014), Article ID:50208,7 pages
10.4236/jwarp.2014.613111
Spatial Distribution of Surface Soil Moisture in a Small Forested Catchment
Shoji Noguchi1*, Yoshio Tsuboyama1, Roy C. Sidle2,3, Tayoko Kubota4
1Forestry and Forest Products Research Institute, Tsukuba, Japan
2Ecosystems Research Division, US Environmental Protection Agency, Athens, USA
3University of the Sunshine Coast, Sunshine Coast, Brisbane, Australia
4Tohoku Research Center, Forestry and Forest Products Research Institute, Iwate, Japan
Email: *noguchi@ffpri.affrc.go.jp
Copyright © 2014 by authors and Scientific Research Publishing Inc.
This work is licensed under the Creative Commons Attribution International License (CC BY).
http://creativecommons.org/licenses/by/4.0/


Received 23 July 2014; revised 21 August 2014; accepted 14 September 2014
ABSTRACT
Predicting the spatial distribution of soil moisture is an important hydrological question. We measured the spatial distribution of surface soil moisture (upper 6 cm) using an Amplitude Domain Reflectometry sensor at the plot scale (2 × 2 m) and small catchment scale (0.84 ha) in a temperate forest. The spatial variation of soil water content was higher during dry conditions than that during wet conditions. Results indicated 3.1 samples at the plot scale were sufficient to estimate mean soil water content when the precision was 0.1. Soil water content increased with increasing topographic index (TI) and soil-topographic index (STI) at the small catchment scale. The correlation between soil water content and TI was higher than that between soil water content and STI. This suggests that topography is more important for estimating surface soil moisture than soil depth as formation of surface soil moisture occurs at ≤6 cm.
Keywords:
ADR Sensor, Soil Water Content, Spatial Heterogeneity, Temperate Forest, Topographic Index

1. Introduction
Variations in soil moisture affect hydrological processes such as evapotranspiration, transport of water and solutes in soils, and runoff response to rainfall. Predicting the spatial and temporal distribution of soil moisture at the catchment scale is an important hydrological concern and it is affected by climate, topography, groundwater level, soil physical properties, and surface cover (vegetation) [1] .
TOPMODEL described by Beven and Kirkby [2] is a widely applied hydrological model due to its parsimonious nature and mathematical simplicity [3] - [5] . TOPMODEL allows simulation of the spatial distribution of soil water content for each modeling time step. The topographic index (TI) or the soil-topographic index (STI) is used as an index of hydrological similarity within TOPMODEL. However, there has been no investigation of the relationship between these indices and soil moisture in forested catchments.
The purpose of this study was to analyze: 1) the spatial distribution of surface soil moisture at the plot scale and 2) the relationship between both TI and STI with soil moisture at the small catchment scale.
2. Materials and Methods
2.1. Site Description
The study was conducted at the Hitachi Ohta Experimental Watershed in Japan (36˚34'N; 140˚35'E; 280 - 340 m elevation; Figure 1). Based on 11 years of records at the site, mean annual precipitation is 1485 mm. Prior to the 20th century, the watershed was covered with a natural hardwood forest. In the early 1900s, clear-cutting began in various forest blocks, and the cutover sites were replanted with Sugi (Cryptomeria japonica) and Hinoki (Chamaecyparis obtusa) around 1920. Hardwood and various understory species coexist in gaps within the conifer forest. Soils are derived from volcanic ash, have a clay loam texture, and are classified as Inceptisols. Saturated hydraulic conductivities based on small core samples (400 cm3) ranged from 2.94 × 10⁻⁵ to 7.37 × 10⁻⁴ m∙s−1 [6] . Surficial geology is metamorphic, primarily a highly fractured schist and amphibolite with minor intrusions of quartzite.
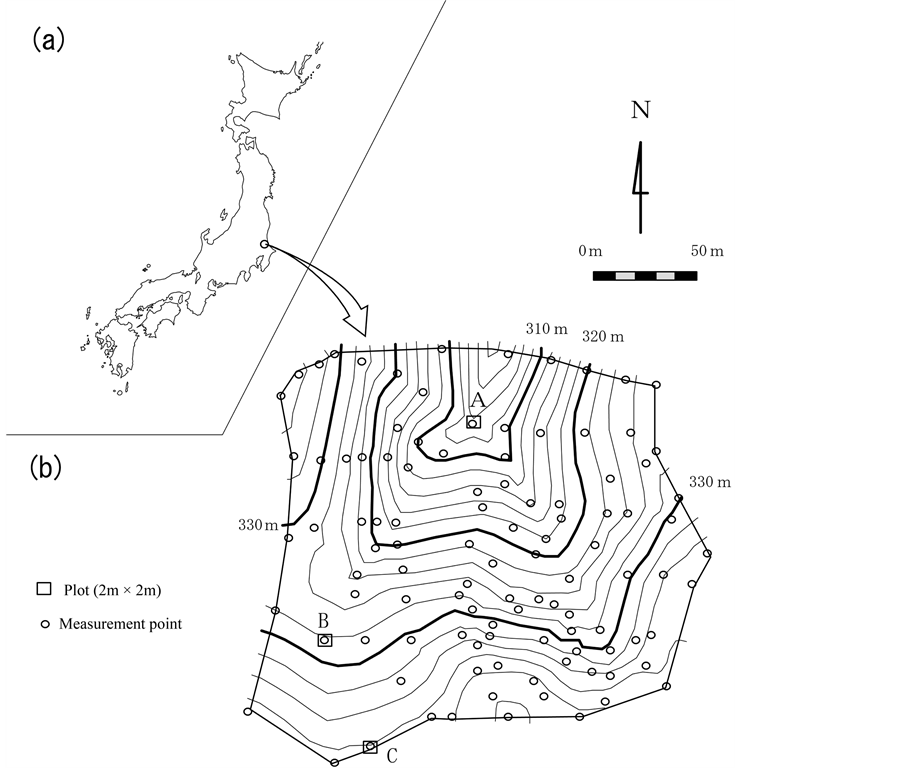
Figure 1. (a) Location of the Hitach Ohta Experimental Watershed; (b) Topography of the research basin HA and measurement points.
2.2. Measurement of Soil Water Content
Soil water content (SWC) was measured using an Amplitude Domain Reflectrometry (ADR) sensor (Delta-T Devices Ltd., Theta Probe type ML2). The sensor had a signal rod and three shield rods of 3 mm diameter and 60 mm length to create a defined cylindrical zone of measurement, 60 mm deep × 26.5 mm diameter. Five measurements were made at each of the 107 sampling points in the 0.84 ha basin (Figure 1). Soil water content was also measured at 20 cm intervals (121 points) within each of the three 2 × 2 m plots located at the lower (Plot A), middle (Plot B) and upper (Plot C) portions of the basin slopes (Figure 1).
Antecedent precipitation index (APIn) was used to represent soil water as it is the most widely used index for representing soil moisture condition. It is defined as follows:
 (1)
(1)
where Pi is daily precipitation (mm) and i is days beforehand [7] . The measurements of September 7th (API30 = 5.8 mm; API5 = 0.9 mm) and November 19th (API30 = 18.1 mm; API5 = 9.5 mm) in 1999 were defined as the dry and wet conditions, respectively.
The ADR sensor was calibrated in laboratory experiments by comparison with SWC measurements from nine soil samples collected in the basin. The relationship between the output voltage of the ADR sensor and the SWC of the field samples can be fitted by a 3rd order polynomial:
 (2)
(2)
where y is soil water content (m3∙m−3) and x is output voltage of the ADR sensor (Figure 2). The output voltage of the ADR sensor was converted into SWC using this expression.
2.3. Calculation of Indices
Soil depth was measured using a portable dynamic cone penetrometer [8] . The Nc values were measured by counting the number of drops it took of a 5 kg weight from a 50 cm height to drive the cone 10 cm into the soil. In this study, the Nc value was used to define total soil depth (D: 0 ≤ Nc ≤ 50). The total soil depth ranged from 0.36 to 5.75 m with an arithmetic mean and standard deviation of 2.08 and 1.12 m, respectively. The TI and STI at soil moisture measurement points in the basin were calculated as follows [9] :
 (3)
(3)
 (4)
(4)
where a is the upslope area, per unit contour length, tanb is the local slope angle and D is total soil depth. TI ranged from 1.60 to 8.32 with an arithmetic mean (SD) of 3.98 (1.39). STI ranged from 0.65 to 8.50 with an arithmetic mean (SD) of 3.36 (1.42).
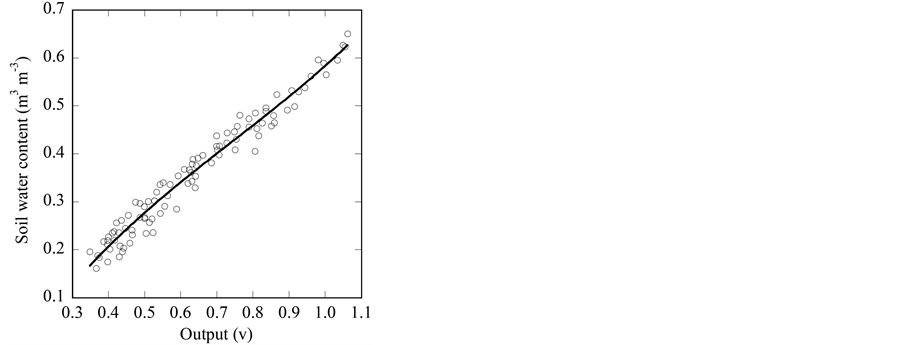
Figure 2. Calibration of the ADR sensor using regression analysis.
2.4. Analysis
The statistical analysis was conducted using SPSS 17.0 (SPSS Inc. Japan). The Mann-Whitney U test was applied to test the significance of difference between two groups. Analysis of variance (ANOVA) was used to test for statistically significant differences among three groups and when the appropriate Mann-Whitney U test with a Bonferroni correction was applied.
3. Results and Discussion
3.1. Spatial Distribution of Soil Moisture at a Small Scale
Box plots of soil water content for the 2 × 2 m field plots during dry and wet conditions reveal that the lower whiskers are longer than the upper whiskers, indicating the wider range of values below the median (Figure 3). In addition, outliers are located below the lower values. Low SWC corresponded with porous sites with low soil hardness. The coefficient of variation (CV: Plot A = 0.278, B = 0.160, C = 0.269) during the dry condition was higher than during the wet condition (CV: Plot A = 0.202, B = 0.154, C = 0.207). Similar results have been previously observed in paddy fields [10] and grasslands [11] .
The SWC during both wet and dry conditions differed significantly among Plots A, B, and C (Kruskal-Wallis test, P < 0.001). Differences between plots A and C as well as between Plots B and C were significant (Mann-Whitney U test, P < 0.001) during both wet and dry conditions. On the other hand, the difference between Plot A and B was not significant during wet (P = 0.953) or dry (P = 0.941) conditions. Each plot within the basin was located at a different site with different TI (Plot A = 7.97, B = 5.74, C = 2.36) and STI (Plot A = 8.20, B = 4.46, C = 1.99) (Figure 1). As such, it is likely that differences in TI and STI contributed strongly to the statistically significant differences in soil moisture among plots.
Considerable spatial heterogeneity of soil water content occurred at the plot scale with wet areas appearing on all plots even in dry conditions (Figure 4). These wet areas in individual plots, expand during wet conditions, suggesting greater of interconnectivity of flow paths with increasing water content [12] - [14] . Soil water repellency causes preferential infiltration [15] and it has been shown that soil water repellency increases with decreasing soil moisture [16] . Preferential infiltration including via macropores within the soil matrix was observed in a slope segment of this forested catchment based on dye tests [6] and hydrological observations [12] - [14] . These previous results support findings of the present study.
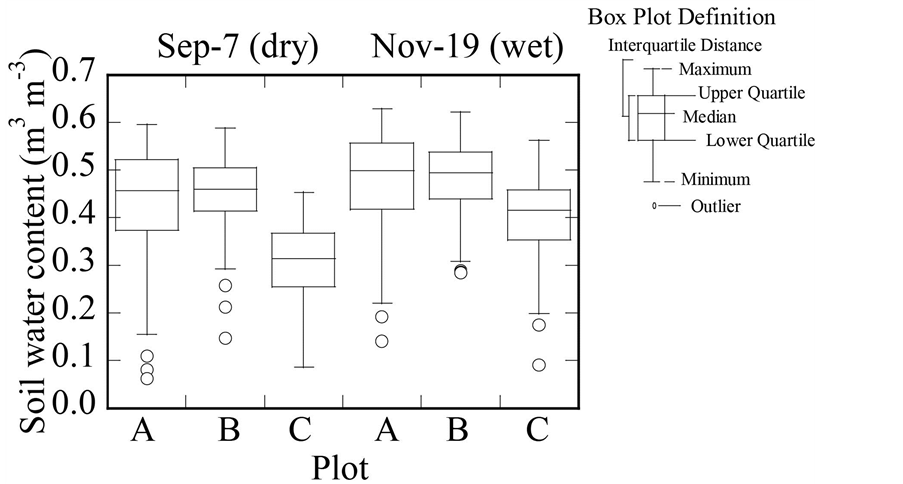
Figure 3. Box-plot indicating the relationship between soil water content on a 2 × 2 m plot scale (Plots A, B, and C) during dry and wet conditions. Box plot features shown include the following: median, inter-quartile range (rectangle), 10th and 90th percentiles (whiskers), and outliers (circles).
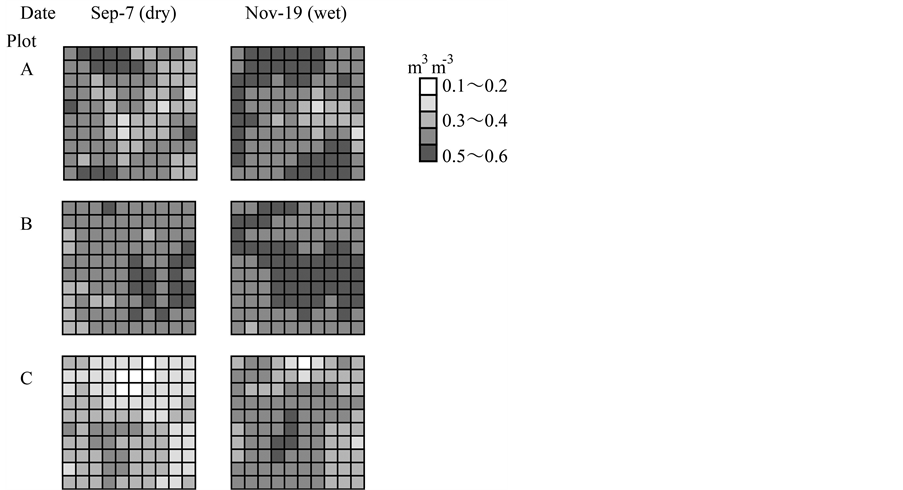
Figure 4. Spatial distribution of soil water content (SWC) on a 2 × 2 m plot scale. Each cell (20 × 20 cm) indicates the average SWC at each node.
3.2. Representative Sampling at a Small Scale
Equation (5) provides useful information for determining how much a given sample can tell about the mean of the population:
 (5)
(5)
where  is the minimal number of samples,
  for
for  (95% certainty),
  is the demanded precision and is the standard deviation of the population [17] . The standard deviation was estimated in this study as the standard deviation of the sample population. When the demanded precision changed from 0.01 to 0.2, the average
  at each plot ranged from 307.7 to 0.8 (Table 1). Therefore, 3.1 samples should be sufficient to estimate the mean soil water content when the demanded precision is 0.1.
Macropores into the soil caused by root channels, subsurface erosion and soil fauna were observed at this study site [18] .About 70% of the described macropores in organic-rich layer was estimated to be formed by root channels. The root systems play an important role in forming macropore systems in most forested sites [18] , and the macropores have affected the soil hardness. This result suggests that the existence of macropores in the forest soil may affect the number of samples for the demanded precision when we measure soil moisture.
3.3. Spatial Distribution of Soil Moisture at the Small Catchment Scale
Within the small catchment, SWC ranged from 0.038 to 0.577 m3∙m−3 with an arithmetic mean (SD) of 0.370 (0.119) m3∙m−3 in dry conditions and from 0.178 to 0.617 m3∙m−3 with an arithmetic mean (SD) of 0.436 (0.105) m3∙m−3 in wet conditions; these differences were significant (Mann-Whitney U test, P < 0.001). The CV during dry conditions (0.322) was larger than during the wet conditions (0.241). The soil water content increased logarithmically with increasing TI and STI (Figure 5). The relationship between the SWC and these indices were more highly correlated during wet conditions (TI: r2 = 0.355, P < 0.001; STI: r2 = 0.269, P < 0.001) than during dry conditions (TI: r2 = 0.348, P < 0.001; STI: r2 = 0.243, P < 0.001). This is because the spatial variation of soil matrix potential increased with increasing soil tension [17] . The correlation between SWC and TI was higher than between SWC and STI. Ohta [19] showed that bedrock topography played an important role in the generation and development of the saturated zone, suggesting that soil depth is an important factor that affects SWC. However, results from our study indicate that surface topography is more important in affecting surface soil moisture (soil depth ≤ 6 cm) than bedrock topography.
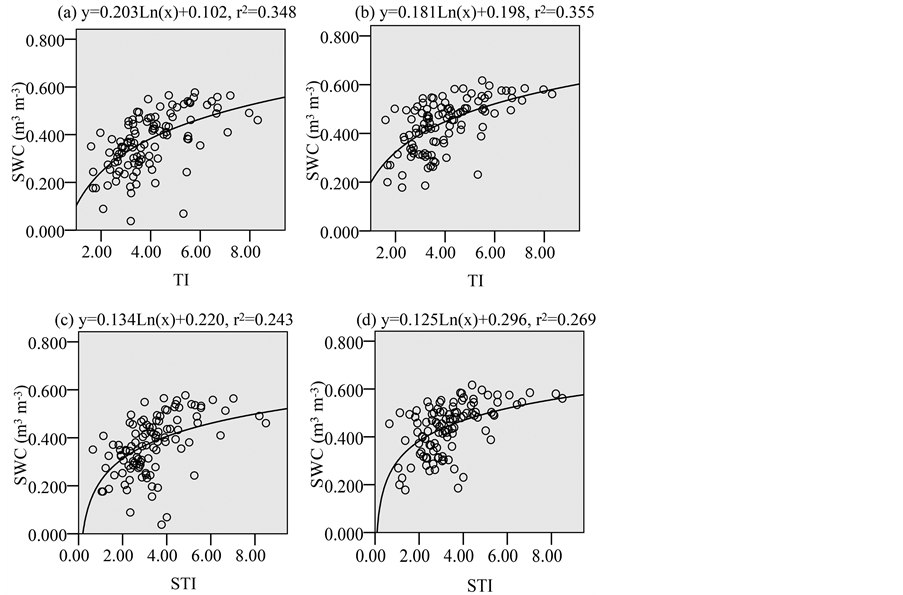
Figure 5. Relationship between soil water content (SWC) and the topographic index (TI) (a) during dry conditions and (b) during wet conditions and soil topographic index (STI) (c) during dry conditions and (d) during wet conditions.

Table 1. The minimal number of samples for the demanded precision.
Water repellency could also affect the water flow in forest soils not only at the plot scale but also at a slope scale [16] , although at larger scales this effect is likely diminished [20] . The effect of stemflow on groundwater recharge has been shown to be relatively large in forests due to preferential infiltration [21] [22] . Canopy structure controls the distribution of throughfall [23] , which also causes preferential infiltration. Tree roots also play an important role in affecting suburface water pathways and variations in soil moisture [24] [25] . Soil moisture has been shown to decrease more rapidly with increasing root density in proximity to trees during dry spells [22] . These results suggest that preferential infiltration and pathways as well as variation of tree root uptake cause spatial heterogeneities in soil moisture content in forested catchments. As such, improved knowledge of these processes is required to more adequately predict and model the effects of the spatial distribution of soil water content. This area of research has strong implications related to runoff generation, plant ecology and physiology, and fate and transport of contaminants in the environment.
4. Conclusion
The spatial distribution of surface soil moisture (upper 6 cm) was measured using an ADR sensor in the Hitachi Ohta Experimental Watershed, Japan. The spatial variation was higher during dry conditions than that during wet conditions. When the demanded precision changed from 0.1, the minimal number of samples at the plot scale (2 × 2 m) ranged from 2.0 to 5.5 with an arithmetic mean of 3.1. Soil water content increased with increasing TI and STI at the small catchment scale (0.84 ha). Topography is more important for estimating surface soil moisture than soil depth because the formation of surface soil moisture occurs at ≤6 cm. This is because the correlation between soil water content and TI was higher than that between soil water content and STI. These results are useful in clarifying the surface soil moisture in the small catchment. The soil depth ranged from 0.36 to 5.75 m with an arithmetic mean of 2.08 in the catchment. Therefore, the role of TI and STI for determining the spatial distribution of soil moisture at deep soil layer needs to be further studied.
Acknowledgements
This study was partly funded by the Forestry and Forest Product Institute and the Japan Society for the Promotion of Science (JSPS) for KAKENHI grant number 23221009. This document has been reviewed in accordance with U.S Environmental Protection Agency policy and approved for publication. Mention of trade names or commercial products does not constitute an endorsement or recommendation for use.
References
- Wilson, D.J., Western, A.W. and Grayson, R.B. (2004) Identifying and Quantifying Sources of Variability in Temporal and Spatial Soil Moisture Observations. Water Resources Research, 40, W02507.0-W02507.10. http://dx.doi.org/10.1029/2003WR002306
- Beven, K.J. and Kirkby, M.J. (1979) A Physically Based Variable Contributing Area Model of Catchment Hydrology. Hydrological Sciences Bulletin, 6, 279-298.
- Quinn, P.F. and Beven, K.J. (1993) Spatial and Temporal Predictions of Soil Moisture Dynamics, Runoff, Variatble Source Areas and Evapotranspiration for Plynlimon, Mid-Wales. Hydrological Processes, 7, 425-448. http://dx.doi.org/10.1002/hyp.3360070407
- Quinn, P.F., Beven, K.J. and Chevallier, P. (1991) The Prediction of Hillslope Flow Paths for Distributed Hydrological Modeling Using Digital Terrain Models. Hydrological Processes, 5, 59-79. http://dx.doi.org/10.1002/hyp.3360050106
- Lamb, R., Beven, K.J. and Myrabø, S. (1997) Discharge and Water Table Predictions Using a Generalized Topmodel Formulation. Hydrological Processes, 11, 1145-1167. http://dx.doi.org/10.1002/(SICI)1099-1085(199707)11:9<1145::AID-HYP550>3.0.CO;2-C
- Noguchi, S., Tsuboyama, Y., Sidle, R.C. and Hosoda, I. (1999) Morphological Characteristics of Macropores and the Distribution of Preferential Flow Pathways in a Forested Slope Segment. Soil Science Society of America Journal, 63, 1413-1423. http://dx.doi.org/10.2136/sssaj1999.6351413x
- Mosley, M.P. (1982) Subsurface Flow Velocities through Selected Forest Soils, South Island, New Zealand. Journal of Hydrology, 55, 65-92. http://dx.doi.org/10.1016/0022-1694(82)90121-4
- Tsuboyama, Y. (2006) An Experimental Study on Temporal and Spatial Variability of Flow Pathways in a Small Forested Catchment. Bulletin of FFPRI, 399, 135-174.
- Quinn, P.F., Beven, K.J. and Lamb, R. (1995) The ln(a/tanb) Index: How to Calculate and How to Use It within the Topmodel Framework. Hydrological Processes, 9, 161-182. http://dx.doi.org/10.1002/hyp.3360090204
- Sunada, K., Itoh, T. and Miyano, Y. (1995) Characteristics of Spatial Distribution of Surface Soil Moisture in Bare Fields (in Japanese with English Summary). Journal Of Japan Society Of Hydrology And Water Resources, 8, 210-216. http://dx.doi.org/10.3178/jjshwr.8.210
- Moroizumi, T., Sata, Y. and Sato, K. (2002) Spatial Variability of Surface Soil Moisture and Investigation of the Local Sampling Sites Exhibiting Field Average in a Slope Grassland Field. Transactions of the Japanese Society of Irrigation, Drainage and Rural Engineering, 220, 447-455. (In Japanese)
- Tsuboyama, Y., Sidle, R.C., Noguchi, S. and Hosoda, I. (1994) Flow and Solute Transport through the Soil Matrix and Macropores of a Hillslope Segment. Water Resources Research, 30, 879-890. http://dx.doi.org/10.1029/93WR03245
- Sidle, R.C., Tsuboyama, Y., Noguchi, S., Hosoda, I., Fujieda, M. and Shimizu, T. (2000) Stormflow Generation in Steep Forested Headwaters: A Linked Hydrogeomorphic Paradigm. Hydrological Processes, 14, 369-385. http://dx.doi.org/10.1002/(SICI)1099-1085(20000228)14:3<369::AID-HYP943>3.0.CO;2-P
- Noguchi, S., Tsuboyama, Y., Sidle, R.C. and Hosoda, I. (2001) Subsurface Runoff Characteristics from a Forest Hill- slope Soil Profile Including Macropores, Hitachi Ohta, Japan. Hydrological Processes, 15, 2131-2149. http://dx.doi.org/10.1002/hyp.278
- Miyata, S., Kosugi, K., Nishi, Y., Gomi, T., Sidle, R.C. and Mizuyama, T. (2010) Spatial Pattern of Infiltration Rate and Its Effect on Hydrological Processes in a Small Headwater Catchment. Hydrological Processes, 24, 535-549. http://dx.doi.org/10.1002/hyp.7549
- Kobayashi, M., Tsurita, T., Itoh, Y. and Kato, M. (2006) Spatial Distribution of Soil Water Repellency in a Japanese Cypress Plantation and an Adjacent Deciduous Broad-Leaved Forest. Journal of the Japanese Forest Society, 88, 354- 362. http://dx.doi.org/10.4005/jjfs.88.354
- Göttlein, A. and Manderscheid, B. (1998) Spatial Heterogeneity and Temporal Dynamics of Soil Water Tension in a Mature Norway Spruce Stand. Hydrological Processes, 12, 417-428. http://dx.doi.org/10.1002/(SICI)1099-1085(19980315)12:3<417::AID-HYP583>3.0.CO;2-B
- Noguchi, S., Tsuboyama, Y., Sidle, R.C. and Hosoda, I. (1997) Spatially Distributed Morphological Characteristics of Macropores in Forest Soils of Hitachi Ohta Experimental Watershed, Japan. Journal of Forest Research, 2, 207-215. http://dx.doi.org/10.1007/BF02348317
- Ohta, T. (1988) Storm Runoff Mechanism on Forested Slopes. Journal of Japan Society of Hydrology and Water Resources, 1, 75-82. (In Japanese) http://dx.doi.org/10.3178/jjshwr.1.75
- Sidle, R.C., Hirano, T., Gomi, T. and Terajima, T. (2007) Hortonian Overland Flow from Japanese Forest Plantations—An Aberration, the Real Thing, or Something in between? Hydrological Processes, 21, 3237-3247. http://dx.doi.org/10.1002/hyp.6876
- Taniguchi, M., Tsujimura, M. and Tanaka, T. (1996) Significance of Stremflow in Groundwater Recharge. 1: Evaluation of the Stemflow Contribution to Recharge Using a Mass Balance Approach. Hydrological Processes, 10, 71-80. http://dx.doi.org/10.1002/(SICI)1099-1085(199601)10:1<71::AID-HYP301>3.0.CO;2-Q
- Tsuboyama, Y., Hosoda, I. and Noguchi, S. (1990) Heat and Water Transfer in Surface Soil Layer of Forest (II) Horizontal Distribution of Soil Moisture Near a Tree. Transactions of the 101th Annual Meeting of the Japanese Forest Society, Kyoto, 2-4 April 1990, 597-600. (In Japanese)
- Konishi, M., Tani, M., Kosugi, Y., Takanashi, S., Sahat, M.M., Nik, A.R., Niiyama, K. and Okuda, T. (2006) Characteristics of Spatial Distribution of Throughfall in a Lowland Tropical Rainforest, Peninsular Malaysia. Forest Ecology and Management, 224, 19-25. http://dx.doi.org/10.1016/j.foreco.2005.12.005
- Noguchi, S., Nik, A.R., Baharuddin, K., Tani, M., Sammori, T. and Morisada, K. (1997) Soil Physical Properties and Preferential Flow Pathways in Tropical Rain Forest, Bukit Tarek, Peninsular Malaysia. Journal of Forest Research, 2, 115-120. http://dx.doi.org/10.1007/BF02348479
- Ghestem, M., Sidle, R.C. and Stokes, A. (2011) The Influence of Plant Root Systems on Subsurface Flow: Implications for Slope Stability. BioScience, 61, 869-879. http://dx.doi.org/10.1525/bio.2011.61.11.6
NOTES

*Corresponding author.