Journal of Water Resource and Protection
Vol. 5 No. 9A (2013) , Article ID: 37448 , 14 pages DOI:10.4236/jwarp.2013.59A002
One-Dimensional Modeling of Sedimentation Impacts for the Mississippi River at the West Bay Diversion
USACE Engineering Research and Development Center, Coastal and Hydraulics Lab, Vicksburg, USA
Email: jeremy.a.sharp@usace.army.mil
Copyright © 2013 Jeremy A. Sharp et al. This is an open access article distributed under the Creative Commons Attribution License, which permits unrestricted use, distribution, and reproduction in any medium, provided the original work is properly cited.
Received July 23, 2013; revised August 25, 2013; accepted September 24, 2013
Keywords: Diversion; Dredging; Mississippi River; Navigation; Sediment
ABSTRACT
The Coastal Wetlands Planning, Protection and Restoration Act (CWPPRA) funded construction of the West Bay Sediment Diversion Project (WBSD) on the west bank of the Mississippi River for the purpose of coastal restoration. A multi-tiered sediment study for the WBSD was conducted to determine impacts to the adjacent navigation channel and to the Pilottown Anchorage Area (PAA). One tier of the study is the implementation of HEC-6T, a one-dimensional (1-D) sediment model, to evaluate the regional impacts of the WBSD. The HEC-6T model results shows the long-term channel changes associated with the WBSD to be increasing shoaling in the adjacent areas on the order of 10% - 20%, as compared to the no WBSD condition. However, it is extremely difficult to isolate the impacts associated with a single diversion due to multiple diversions in the region. From a holistic vantage point, the 1-D model shows the necessity to examine, on a regional scale, the lower Mississippi River as a single congruent system on a regional scale.
1. Introduction
West Bay Sediment Diversion Project (WBSD) is located on the west bank of the Mississippi River in Plaquemines Parish, Louisiana, 24803.15 ft (7.56 km) above Head of Passes, Figure 1 [1]. The project included the excavation of an uncontrolled diversion channel through the rightdescending bank of the Mississippi River. Construction was completed in November 2003. The project objective is to restore and maintain approximately 9830 acres (3978 ha) of fresh water to brackish marsh in the West Bay area by diverting both fresh water and sediment from the Mississippi River over the 20-year project life [2]. Thus, helping to alleviate the rapid erosion, which is on the order of 15.4 - 29.7 mi2/year (40 - 77 km2/year) [3,4] in coastal Louisiana.
Along the West Bay reach of the Mississippi River, the Pilottown Anchorage Area (PAA) is parallel to the navigation channel. The PAA is a US Coast Guard designated safe harbor outside the federally maintained navigation channel. The area is located along the right descending bank of the river from River Miles (RM) 6.7 to 1.5 (River Kilometer (RK) 10.8 to 2.4). Concerns about increased sediment deposition and subsequent increased dredging in the PAA and navigation channel prompted the Coastal Wetlands Planning, Protection and Restoration Act (CWPPRA) Task Force to authorize this study to evaluate the impacts of the WBSD. In response to, the Corps of Engineers’ Engineer Research and Development Center, Coastal and Hydraulics Laboratory (ERDC-CHL) developed a work plan that included 4 primary tasks: comprehensive channel geometry, discharge, suspended sediment, and bed material data collection program; a detailed geomorphic assessment; onedimensional (1-D) modeling which is the focus of this paper; and multi-dimensional modeling of the reach and WBSD. The multi-prong study further explores the impacts of diversions on the Lower Mississippi River which are not well understood [5].
A diversion of water without an appropriate amount of diverted sediment increases the potential for induced sediment deposition in the main channel [6-8]. If the diverted sediment-to-water ratio is less than that of the main channel, then a disproportionate amount of water is being diverted relative to sediment. By reducing the sediment transport capacity in the main channel without a corresponding reduction in sediment load will result in downstream deposition along the main channel [8]. Ref. [8], though not including WBSD, found that increases in upstream divert flows will increase maintenance dredging, 30,000 - 70,000 cu yd annually, in PAA. This is a critical

Figure 1. West Bay diversion project location map.
issue on the Mississippi River, where increased sediment deposition has an adverse impact on both commercial navigation and flood control.
2. WBSD History
The WBSD was first initiated with the excavation of an uncontrolled diversion channel through the right descending bank of the Mississippi River. The initial channel was excavated during the fall of 2003. This channel was constructed 24.9 ft (7.6 m) deep by 194.9 ft (59.4 m) wide using a hydraulic cutterhead dredge. The channel was designed to convey an average discharge of 20,000 cfs (570 cm) at the 50 percent duration stage at the Venice, LA gage. However, measured discharge in 2004 and 2005 indicated that the excavated channel passed only approximately 14,000 cfs (400 cm). A second phase of excavation planned to expand the channel conveyance to 50,000 cfs (1400 cm). This second phase excavation has not been constructed. However, the channel has been naturally enlarging since the initial construction in 2003, but has not reached the planned capacity. Measured discharge in 2007 and 2008 indicated that the diversion had almost doubled in capacity to approximately 27,000 cfs (760 cm).
Even during planning, sponsors realized the diversion could induce shoaling in the main navigation channel of the Mississippi River and the adjacent PAA. The US Army Corps of Engineers’ ongoing Operations and Maintenance Program is responsible for dredging of the main navigation channel. Additional dredging of the PAA would be an added feature to this program and would be a cost to the WBSD. After detailed negotiations with the navigation industry, an agreement for maintaining the PAA and navigation channel was developed and executed. The Cost Sharing Agreement executed between the State of Louisiana and the Corps of Engineers and the budget approved by the CWPPRA Task Force in 2002 state:
Included as a Project feature is the maintenance of the outermost (eastern) 250-ft-wide strip of the PAA and the entire width of the adjoining access area between this strip of the PAA and the Mississippi River navigation channel. Advanced maintenance of the PAA area shall be undertaken to account for the anticipated shoaling induced by the Project.
Thus channel maintenance is a direct project cost through the project life, 2023. However, initial advance maintenance dredging was conducted in the PAA in 2003; bathymetric surveys indicated a shoaling tendency prior to the opening of the WBSD. Subsequent maintenance dredging was conducted in both 2006 and 2009. The Task Force wanted to know the percentage of shoaling being caused by the diversion and the percentage being caused by other effects. ERDC-CHL developed a multitask work plan to address the shoaling issue.
3. 1-Dimensional Analysis
Using the HEC-6T numerical model software package, 1-D model, estimates the long term river responses to the diversion and the upstream sediment boundary conditions for the multi-dimensional models.
3.1. Model Background
The Engineering Research and Development Center (ERDC) conducted an investigation with the HEC-6T 1-D model. The effort established the usability and potential impact of the WBSD on dredging above head of passes, and evaluated the sensitivity of the model to key input parameters. An initial effort in studying the West Bay Diversion is documented in [9]. The ERDC model is based on the validated Vicksburg District, MVK, regional scale model. Changes from the MVK model to the ERDC model are discussed here and [9] along with key aspects critical for the model description. For a complete account of the MVK regional model see Copeland and Lombard (2009).
3.2. HEC-6T Model
The HEC-6T software is an enhanced version of HEC-6. HEC-6 is “a 1-D movable boundary open channel flow numerical model designed to simulate and predict changes in river profiles resulting from scour and/or deposition over moderate time periods, typically years” [10]. Model input requirements include: channel geometry, subsidence rates by cross-section, boundary conditions, bed material gradations, distributary outflow and sediment concentration, water temperature, and user specified sediment transport functions [10].
Flow conditions are specified by a series of sequential steady state flow discharges where water surface elevations at each cross-section are calculated with the standard step method, Method II [11,12]. Thus, from the user defined hydrograph HEC-6T calculates velocity and depths. Then, in a decoupled manner at each timestep, the calculated parameters (depth, velocity, and discharge) are then applied to determine the sediment transport potential. For a complete description of the governing equation see HEC-6 user manual [10,13]. The computed transport potential is compared to the available sediment supply in the water column and the river bed to determine bed erosion or deposition. Finally, these bathymetric changes are applied within the movable bed limits and the next flow condition is calculated repeating the process.
HEC-6T offers four capabilities needed for the evaluation of WBSD. First, HEC-6T allows for long-term simulations. For the WBSD evaluation, 50 year simulations were conducted to describe a broad range of potential flow events. Secondly, the model has the ability to simulate dredging activities. Dredging in both the navigation channel and in the PAA is required for the WBSD study. For the ERDC Phase II model, modifications were made to the code by MBH to allow multiple dredging templates at any cross-section, so adjacent sites can be dredged concurrently or at different times for varying widths and depths at the same cross-section. Additionally, HEC-6T allows for the diversion of both water and sediment, and calculates the downstream impacts of the diverted flux. Finally, it directly accounts for subsidence and sea level rise, important factors in the Gulf region for a long term simulation.
The primary disadvantage is that HEC-6T is a 1-D model which uses average hydraulic and sediment parameters to simulate 3-dimensional processes. HEC-6T includes no provision for specifying either a lateral distribution of sediment load or a bed material gradation across a cross-section. Additionally, HEC-6T does not consider salinity or the impacts or organics on fine sediment transport. Furthermore, in HEC-6T the standard procedure for deposition and scour is to move each cross section point, within the movable bed limits, an equal amount (the area that is shifted vertically during each time step due to sediment movement i.e. deposition or scour). For ERDC Phase I & II models, the $GR 3 option was selected that preferentially deposits sediment within the dredging template before deposition is distributed over the rest of the moveable bed portion of the crosssection. This prevents the artificial building of levees along the dredged channel, but does not necessarily distribute the sediment laterally in a realistic manner in all situations.
3.3. Modeling Approach
Two scenarios, each running the same 50 yr hydrograph, represent conditions with and without the WBSD. Comparisons of the two scenarios provide a means to identify both temporal and spatial changes in the sedimentation rates for both with and without WBSD alternatives.
The MVK model is part of a regional model being developed by the Mississippi River and Tributaries (MR & T) Project to identify long term channel maintenance sites within the Lower Mississippi River. Since the MVK model was developed for regional use, modifications were made for the WBSD evaluation, ERDC model modifications include:
a) Additional cross-sections downstream of Belle Chase with the highest density of cross sections within the PAA (River Mile, RM 1.5 to RM 6.7).
b) Subsidence and sea level rise rates were estimated and incorporated into the model.
c) Implementing the ERDC multi-dimensional model study and field data collection effort to refine sediment diversion ratios, flow diversion, sediment concentration, and bed material gradation. If needed, MVK Model values were modified.
d) Code modifications for multiple dredging templates were made to represent dredging in the Navigation channel and the PAA.
e) A typical discharge hydrograph which provides a plausible range of future flows is selected and duplicated as needed to create a projected 50 year hydrograph and its corresponding tailwater elevations.
For validation, the hydrograph prior to WBSD, 1991- 2002, was simulated. The MVK model was validated for the same time period, so for every change in the ERDC model comparisons were made to the MVK model to verify validation. The checks were primarily in the form of water surface elevations, dredging comparisons, and sediment load. Then sensitivity testing evaluated the impacts of varying sediment diversion ratios, sea level rise, subsidence, and sediment transport functions.
3.4. ERDC HEC-6T Model Input
The ERDC model extends from Vicksburg, MS to the Gulf. The primary focus was on the Belle Chasse, LA RM 75 to Head of Passes RM 0 reach. Key aspects of the MVK model were changed/modified to re-focus the model to the study area. With all changes to model input a congruent model validation was maintained.
3.4.1. Cross-Sections
The model provided by MVK extends about 455 miles from Vicksburg, Mississippi RM 437 .3 to Pilots’ Station in Southwest Pass at RM -18.0. The extended model allows for sediment adjustments prior to entering the study area, thus reducing bias from the inputted sediment load at Vicksburg. Model cross-sections are derived from the 1992 Mississippi River comprehensive hydrographic survey. The MVK model originally contained 201 crosssections, but the ERDC modifications added 28 crosssections between Belle Chasse and Head of Passes to better define the channel geometry within the study reach. The greatest increase in cross-section density occurred from Venice at RM 10.6 to Head of Passes RM 0, which includes the PAA. The average cross-section spacing through the PAA reach is 0.42 mi (0.68 km).
Within the Head of Passes (RM 0) to Venice (RM 10.6) reach, the ERDC model contains 19 cross sections which provide an average cross section spacing of 0.56 miles. The Pilottown PAA extends from RM 1.5 to RM 6.7. Through that reach, the ERDC model contains 12 cross sections. Eight of those sections are located downstream of the WBSD. The average cross section spacing through the PAA reach is 0.43 miles. The data for all cross-sections added to the model were obtained directly from the 1992 comprehensive hydrographic survey.
3.4.2. Boundary Conditions
Model computed sediment loads, deposition and erosion locations, and trends can vary if larger floods or drier periods occur more frequently than contained in the typical hydrograph. For water discharge, a typical average daily flow hydrograph is constructed. This hydrograph includes the 25-year period from 1 January 1984 to 31 December 2008. The period contains several higher flow years (1984, 1991, 1997, 2005, and 2008) as well as several lower water years (1988, 2000, and 2007). The highest flow in the hydrograph occurred during 2008, which approached the 50 year frequency flow. The 25-year hydrograph is simply repeated to create the 50-year typical hydrograph used for the simulations. The fifty year downstream water surface elevations are developed from 8:00 am daily stage data at Grand Isle East Point and match the same time period.
In south Louisiana, both subsidence and sea level rise are significant. Reported subsidence rates along the lower Mississippi River vary from different sources. The ERDC model subsidence rates were derived from NOAA Technical Report NOS/NGS 50 [14]. Subsidence rates vary from 0.87 in/year (22 mm/year) at RM 22.0 to 0.12 in/year (3 mm/year) at RM 306.00. The adopted subsidence rate from RM 16.0 (upstream of Venice, Louisiana) to the downstream end of the model is 0.63 in/year (16 mm/year). This rate equates to approximately 2.6 ft (0.8 m) of subsidence over the 50 year simulations. Subsidence rates in NOAA Technical Report NOS/NGS 50 were computed with a eustatic sea level rise of 0.05 in/ year (1.25 mm/year) at Grand Isle. The daily stages at the downstream boundary are increased at this rate for the 50 year simulations. Finally, incoming sediment loads are specified at the Vicksburg, MS gage.
3.4.3. Sediment Transport
The evaluation of transport capacity is calculated with a specified transport function. For the ERDC modeling effort, the Toffaleti function was applied. The Toffaleti equation was derived based on field data from the Lower Mississippi at Talbert Landing, Atchafalaya Rivers, five other river locations, and flume data from four data sets [15]. Data was collected over a broad range of flows for twelve years on the Mississippi River [16-18]. Other river data is from Mississippi River at St. Louis [19], Rio Grande at Bernalillo [20], Middle Loup [21], Niobrara [22]. The data included depths ranging from 0.98 ft - 49.2 ft (0.3 m - 15 m) with fine to medium sands [15]. The flume data was taken by [23-26], and USACE Waterways Experiment Station. Flume data was collected in flume widths ranging from 0.25 m - 2.4 m, flow depths ranging from 0.16 ft - 1.97 ft (0.05 m - 0.6 m), and sediment sizes of 0.01 in - 0.04 in (0.3 mm - 0.93 mm) [15]. The Toffaleti function was applied in this study since its main derivation was from large rivers.
While HEC-6T does not provide for the direct impact of salinity in the sediment transport functions, this impact can be approximated by varying the silt and clay shear threshold deposition coefficients. For the MVK model, the deposition coefficients for both silt and clay were increased downstream of Venice and the coefficient for clay was further increased in Southwest Pass to account for the effects of salinity on sediment deposition. The model allows for varying the threshold coefficients by reach but does not allow for varying the coefficients with discharge or stage. The salinity throughout the PAA varies greatly with discharge. During low flow, the salinity is much higher than during high flow periods.
Initial bed material gradations in the MVK model were derived from particle size distribution of bed sediments collected along the thalweg of the Mississippi River by Nordin and Queen in 1989 [27] (Copeland and Lombard 2009). One hundred seventy-six (176) samples were collected between Vicksburg, MS and Head of Passes. Of those samples, 25 were collected between Belle Chasse and Head of Passes [27]. Nordin did not collect any samples in Southwest Pass. Bed material samples were collected ERDC-CHL effort from RM 19.6 through Southwest Pass and comparisons made to the Nordin Data/ MVK model. Where vartiations occurred modifications were made to the ERDC models.
3.4.4. Diversions
In the HEC-6T model, the percentage of flow leaving the river through diversions compared to the flow in the river immediately upstream of that diversion is an input parameter. Flow distribution measurements were taken by ERDC at Baptiste Collette Bayou, Grand Pass, WBSD, Cubits Gap, Mississippi River upstream of Baptiste Collette Bayou, Mississippi River immediately upstream of WBSD, Mississippi River immediately downstream of WBSD, and in various small outlets in the bank of the Mississippi River between Venice and Head of Passes. Review of the diversion data, both from MVN and ERDC, indicates that for most flow conditions, Baptiste Collette and Grand Pass each diverts approximately 10 to 13 percent of the Mississippi River flow at Venice. Cubits Gap diverts approximately 13 to 18 percent of the flow and WBSD diverts approximately 5 percent of the flow. Figure 2 shows the flow distribution at WBSD by year. This plot shows the increase in flow over time as the WBSD has enlarged. For the ERDC model evaluation, the flow distribution at WBSD was set at the current rate of approximately 7 percent of the Mississippi River flow at Venice.
Table 1 provides the locations of the diversions contained in the ERDC model. The Davis Pond Diversion, WBSD, and Fort St. Philip Diversion were added to the ERDC model. For the diversions that were included, flow discharge through each diversion was modeled as a percentage of the discharge in the Mississippi River upstream from that diversion. When available, the percentages were estimated from measured data. When no measured data was available, the percentage of flow in the diversions was calculated (Copeland and Lombard 2009). For diversions added in ERDC Phase II the diversion ratios were estimated from a combination of ERDC field data and multi-dimensional model data.
3.4.5. Sediment Diversion Ratios
An advantage of the WBSD evaluation is that multi-dimensional modeling was being conducted concurrently with the 1-D model and was validated to field data. Multi-dimensional models have the ability to compute diverted sediment concentrations. For the WBSD, Grand Pass, and Baptiste Collette, the sediment diversion concentration ratios used in the ERDC model were derived from the Adaptive Hydraulics Model (AdH) a 2-D depthaveraged model. Cubits Gap sediment diversion ratios were determined from the ERDC field data collection effort. For all other diversions in the model, the ERDC model used the sediment concentration diversion ratios determined by MVK.
The lack of available accurate sediment concentrations for diverted flow is a weakness of previous 1-D modeling on the Lower Mississippi River. For the [28] HEC-6 model a sediment diversion ratio of 1 was used for silts and clays and 0.5 was used for sands. In the MVK
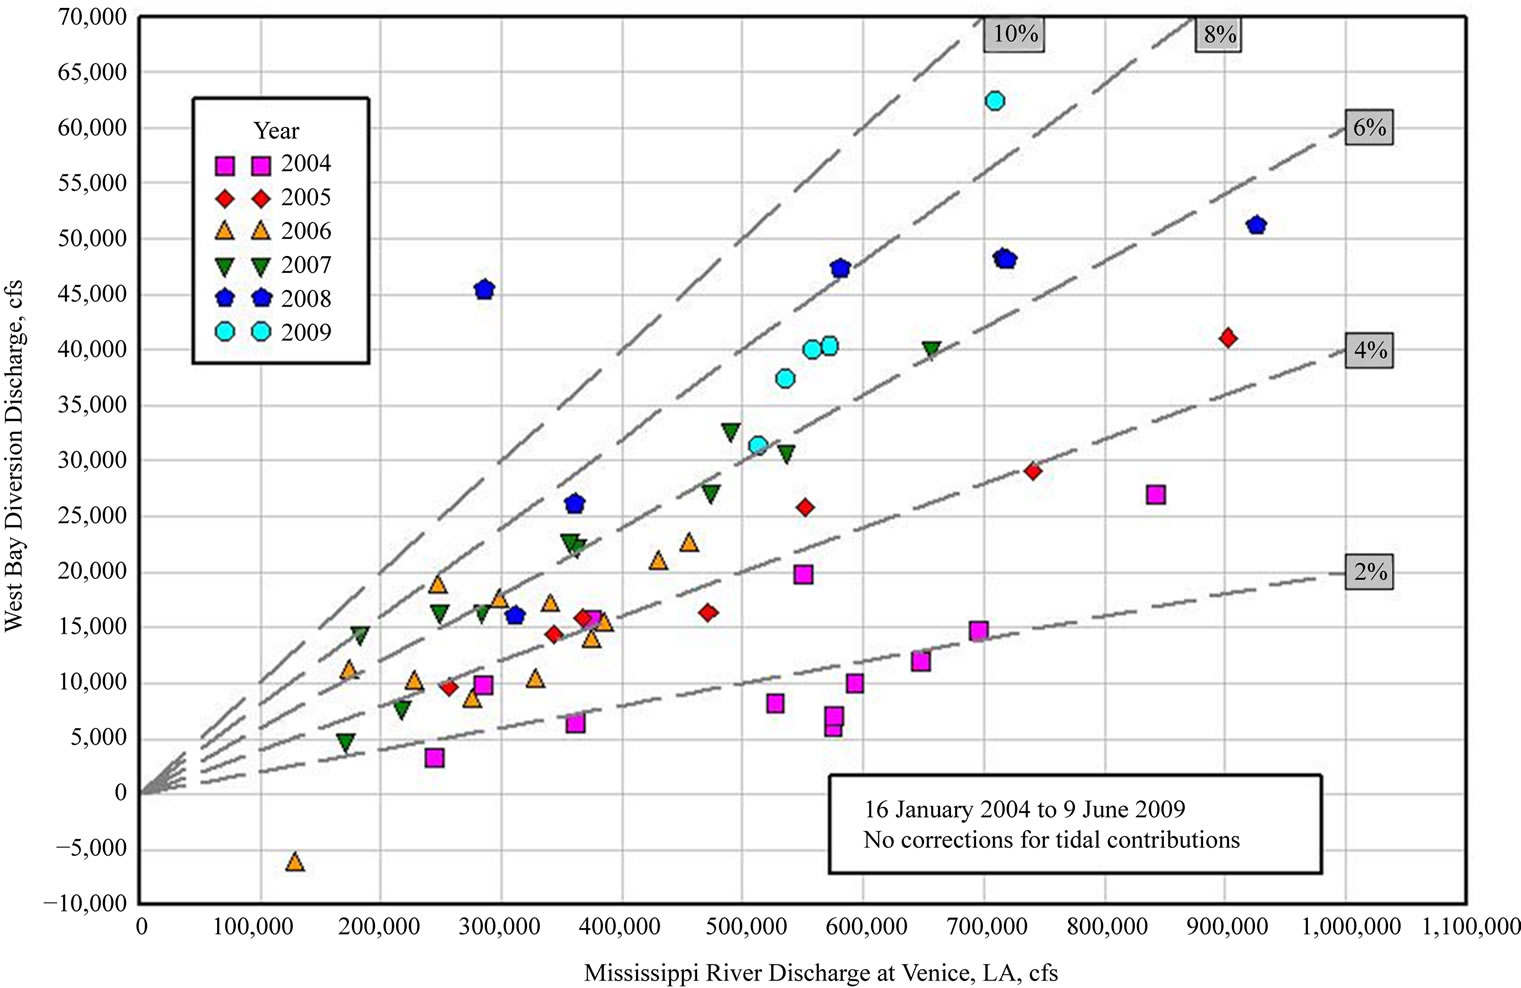
Figure 2. Measured flow distributions at West Bay diversion (2004-2009).
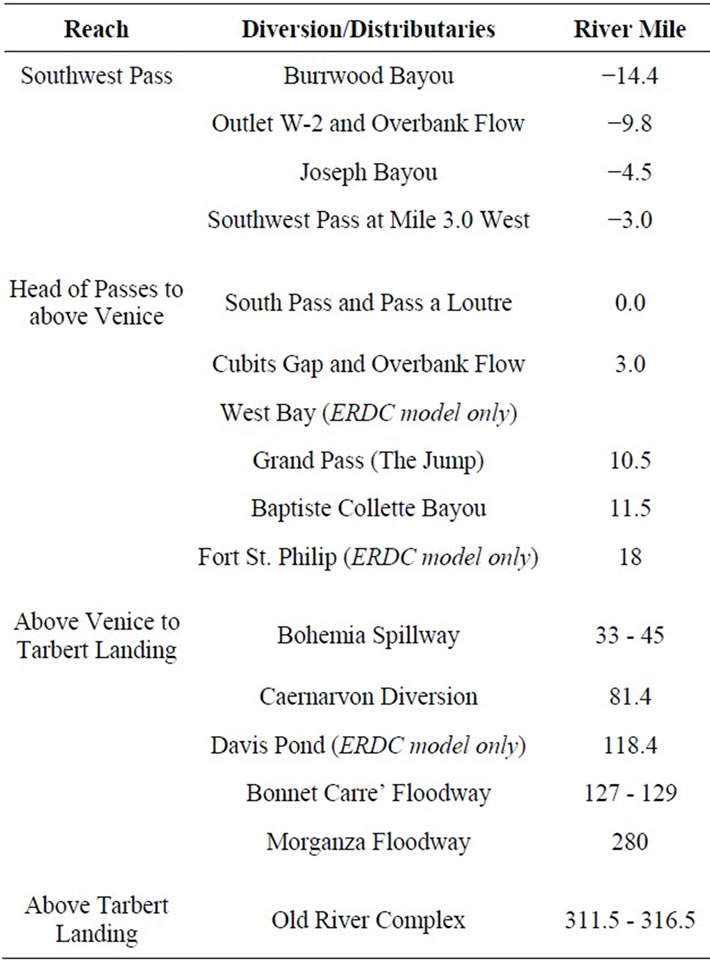
Table 1. Diversion/distributaries locations.
model, the Rouse equation was used to determine the sediment concentration for the diverted flow. This method estimates diverted sediment concentrations based on the sediment concentration profile in the river and the depth of the diversion inlet verses the average depth of the river. Current analysis of the collected field data indicates the true sediment diversion ratios might be greater than 1. Sensitivity analyses are usually conducted with sediment diversion concentration ratios varying from 0 to 1. A ratio of 0 means no sediment is diverted, while a ratio of 1 means the concentration in the diverted flow is equal to that in the river. However, the range of, 0.1 - 2.5, of the ratios was measured from field data. This illustrates the complex relationship between diverted sediment concentration, flow, and sediment grain size.
3.4.6. Dredging
Dredging is an additional model parameter that is utilized for the MVK and ERDC models. HEC-6T allows for dredging of the channel by specifying the bottom elevation and lateral extent of the dredge template. Dredging operations are conducted throughout the model simulation during user defined dredging windows. The reach of the Mississippi River through the PAA is unique. Currently, MVN maintains a 750 foot wide navigation channel adjacent to the 250 ft wide PAA. The navigation channel is dredged to an elevation of −51 feet to accommodate the −45 foot channel plus 6 feet of advance maintenance. Parts of the navigation channel, especially the reach from Cubits Gap to Head of Passes, require dredging annually or more frequently. A 250 foot wide section of the PAA along with its access area is dredged to various depths (−48, −44, and −41 feet located as upstream, mid, and downstream respectively) along its length.
Dredging in the PAA is conducted once every 3 years. Originally HEC-6T did not allow for separate dredging templates or for a complex template with varying depths in the same template. For the ERDC model modifications were made to the code such that multiple templates can be dredged in the same cross-section. This allows the PAA to be dredge on a three year cycle and the navigation channel on a six-month cycle.
Implementation of multiple dredging templates in allowed computation of cross-section shapes that were more realistic than before in [9]. However, there are no simple algorithmic methods currently available in HEC- 6T for distributing sediment deposition between the navigation and PAA dredging templates. After experimentation with a limited set of options, the following scheme was adopted:
a) After each 3-year dredging cycle (in which both the navigation channel and the PAA were dredged), deposition was distributed uniformly within both dredging templates. (Note all other factors being equal, crosssectional area will be at a maximum immediately after a 3-year dredging cycle thus deposition rates should be maximized. Actual model behavior is more complex since other factors, such as boundary forcings, are being varied throughout the simulation.)
b) After all other dredging cycles (in which only the navigation channel was dredged at 6-month intervals), deposition was distributed uniformly within the navigation dredging template.
c) Any deposition in excess of the volume required to fill the dredging template was distributed uniformly within the moveable bed limits, generally the entire river channel, including both dredging templates.
This scheme was successful in reproducing the relative quantities of dredging observed in the navigation channel and the PAA since creation of the West Bay Diversion in 2003. However, the historical record of dredging within the PAA is limited to events in 2003, 2006, and 2009.
4. Validation
A two phase validation was conducted for the ERDC model. The first phase of the validation was comparison of computed water surface profiles to observed profiles. This was accomplished by running the model in the fixed-bed mode for a range of steady-state discharges and adjusting Manning’s roughness coefficients so calculated water surface profiles matched measured stages at available gage locations. Water surface elevations were validated to observed data from 4 gage stations; Venice, Empire, West Pointe a la Hache, and New Orleans. At each gage, stages vs. discharge curves were generated from 1991-2011 data. Then a best fit function (see Figure 3), a forth degree polynomial which generated the largest r2 value, was fitted to the data.
For comparison to the best fit function four steadystate discharges were simulated both before and after a 1991-2002 simulation (see Figure 4). Each best fit point, observation, for the four steady state flows was taken from the fourth order polynomial. Then a range in discharge was visually estimated from the stage vs. dis-
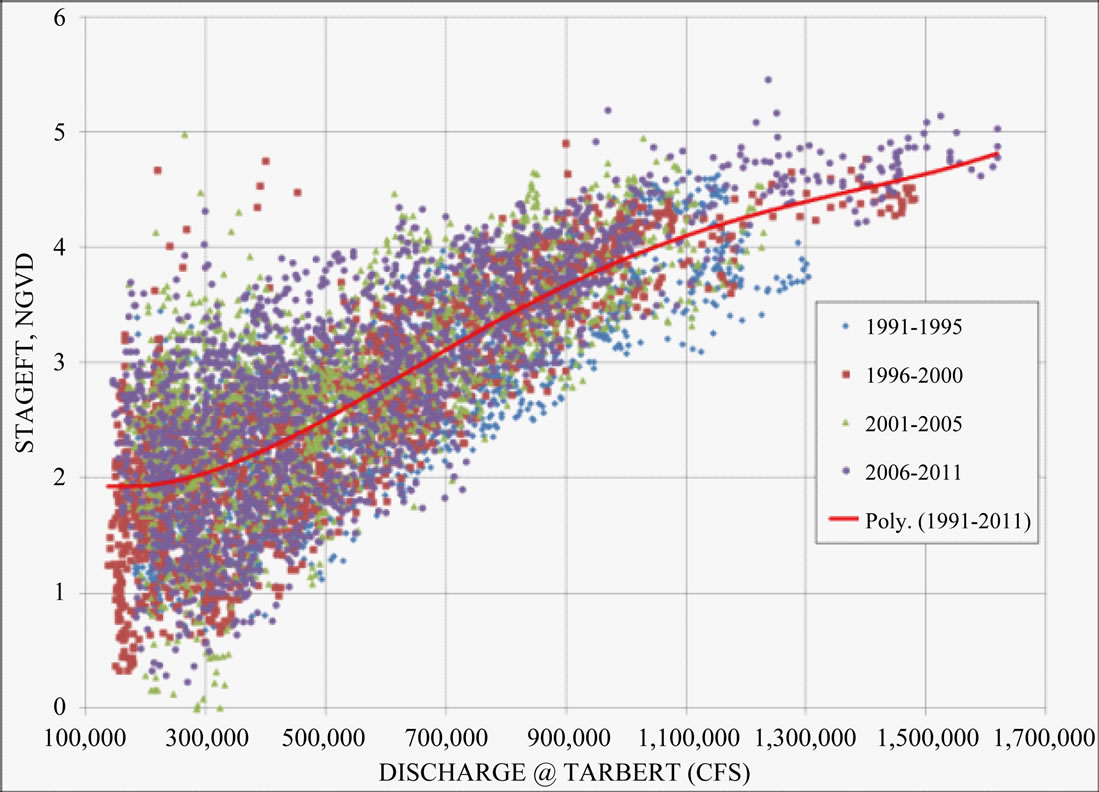
Figure 3. Stage vs. discharge curve at Venice.
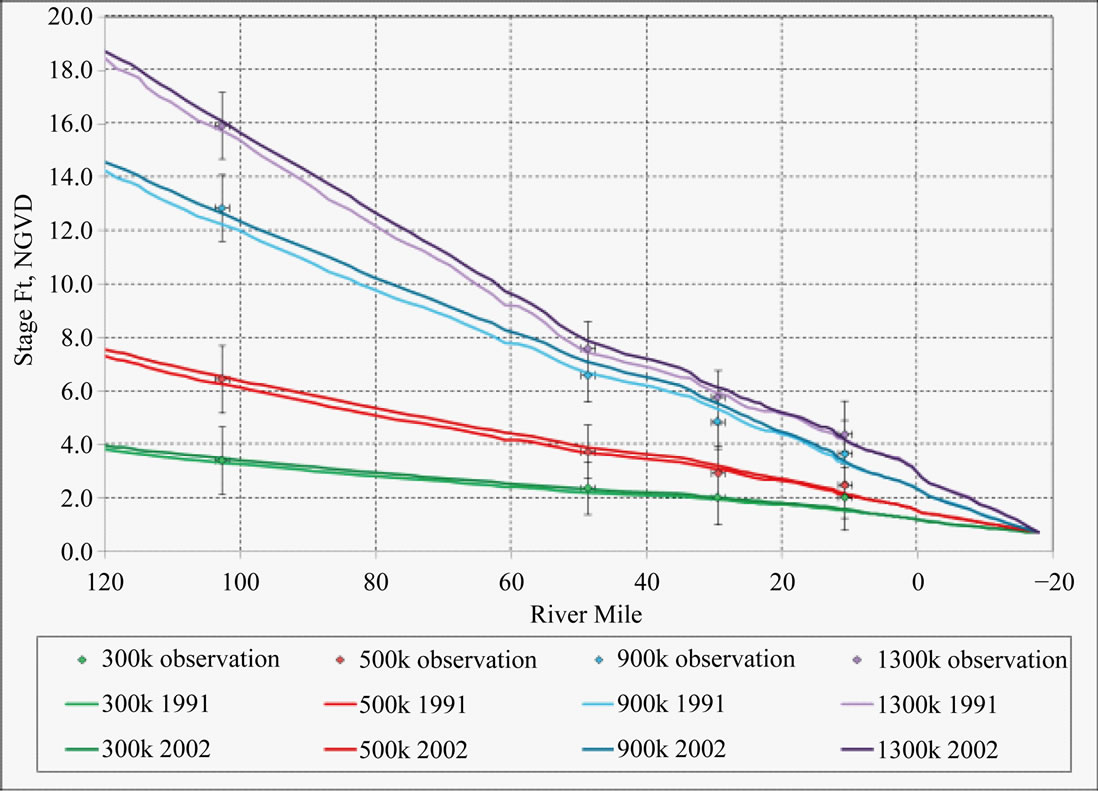
Figure 4. Water surface profile validation.
charge graphs and is denoted in Figure 4 as the whisker bars at each observation point. Reasonable validation was achieved with the calculated water surfaces from ERDC model with all flows falling within the scatter of the observed data.
Secondly, the sediment validation is accomplished using deposition, and sediment transport. For the ERDC model the annual average dredging estimated above head of passes is 4.9 m cy with a standard deviation of 2 m cy. Comparatively the reported average is 4.7 m cy with a standard deviation of 2.7 m cy. This agreement between the reported and calculated was assumed sufficient and deemed the model capable of determining the impacts on dredging due to WBSD in the vicinity of the PAA.
Figure 5 shows the total sediment load passing comparisons between the MVK and ERDC models. The variations between the two are primarily due to Ft. St. Philip and WBSD, thus the load passing does vary between the two models as would be expected.
For the ERDC model a check of the suspended sediment passing Belle Chase was done (see Figure 6). Reasonable agreement exists in the model verses the ob-
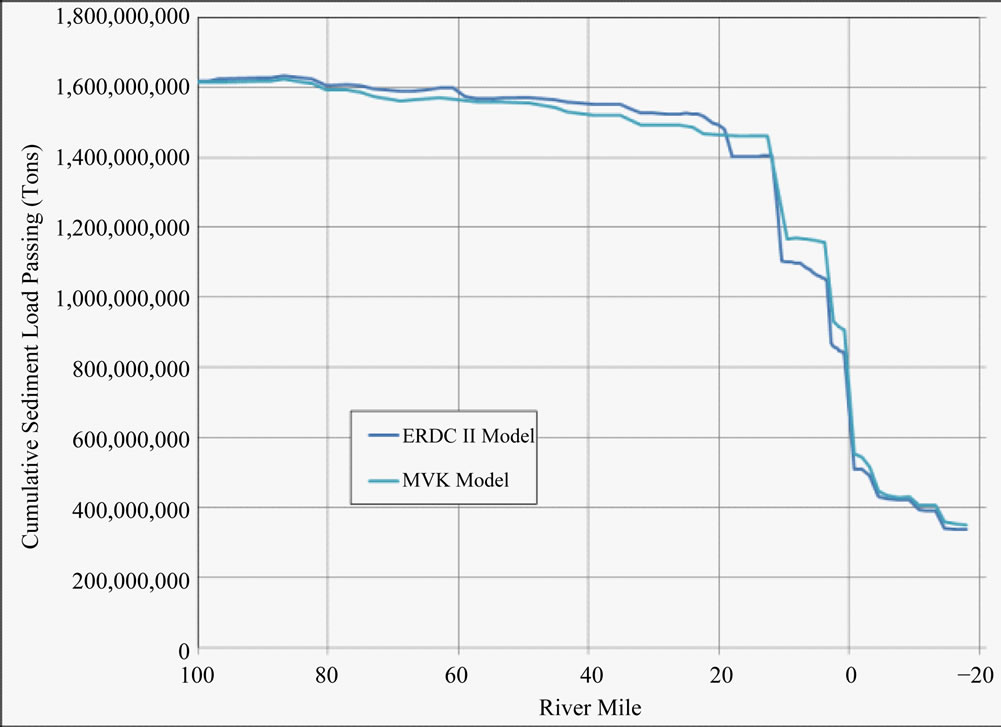
Figure 5. Sediment passing comparison, ERDC Phase II and MVK models.
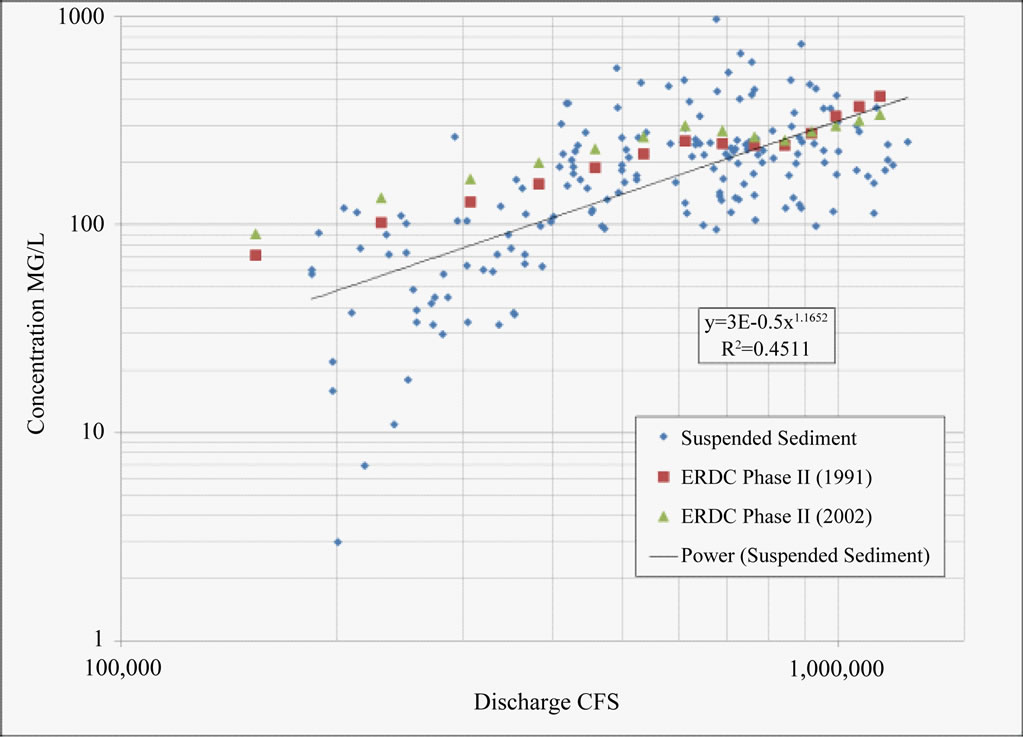
Figure 6. Suspended sediment concentration vs. ERDC model at Belle Chase.
served suspended sediment data at the 700,000 cfs flows and above. This is beneficial since the majority of the sediment transport occurs in the higher flows. Less agreement is achieved in the lower flows, 600,000 cfs and less. Here the tidal influences are a factor changing the behavior of the system, thus it is expected that less agreement would exist.
5. Results
For the ERDC model two scenarios were modeled:
1) With WBSD open and dredging in the Navigation and PAA template
2) With WBSD closed and dredging in the Navigation and PAA template
Currently the model behaves appropriately in the area of interest, since dredging volumes calculated above Head of Passes are close to reported values.
The attributable dredging in the navigation channel and PAA due to WBSD being open for 50 yr simulation is 14% and 26% respectively. Analyzing by 9, 10, and 12 year periods over the 50 year hydrograph shows the variability of these numbers. The navigation channel behavior is relatively consistent with 10% - 20% of dredging attributable to the WBSD. However, the PAA has a broader scale, ranging from −5% - 40% of dredging attributable due to WBSD being open.
While a net increase in PAA dredging of 36% was computed over the entire 50-year simulation, variations between individual 3-year dredging events were relatively large and for three of the 3-year cycles, dredging in the PAA decreased. Changes in the first decade and to a lesser extent during the second decade showed the influence of relatively rapid adjustments in cross-section shape that may not be representative of long-term channel responses, thus producing less dredging.
As compared to [9], ERDC Phase I model, of navigation channel dredging, the current ERDC model, ERDC Phase II model, showed a reduction in the quantity of dredging attributable to the WBSD. Since navigation channel dredging is approximately an order of magnitude greater than PAA dredging, the portion of the total dredging (navigation channel and PAA) attributable to the WBSD, Figure 7, tends to mirror the response of the navigation channel.
Figure 8 shows the total sediment load passing at each cross section normalized to RM 12.5. As stated previously, Ft. St. Philip diversion was not in the ERDC Phase I effort, for the ERDC Phase II effort it was included and generates approximately a 5% reduction in sediment passing. Baptiste Collette and Grand Pass combine to generate a 20% reduction in sediment passing. Again, just as the case for Phase I, WBSD indicated a 7% decrease in sediment load passing and Cubits Gap yields a 13% reduction in sediment passing. These diversions, with WBSD open, total to an approximant reduction of 54 % in sediment load from RM 18 to RM 0 (see Table 2). This is larger than the 46% estimated in the ERDC Phase I. For the Phase I effort the Ft. St. Philip Diversion was not included, thus indicating that there is a significant impact from Ft. St. Philip and the updated sediment diversion ratios.
Cross-sections 3.83 (see Figures 9 & 10) was selected
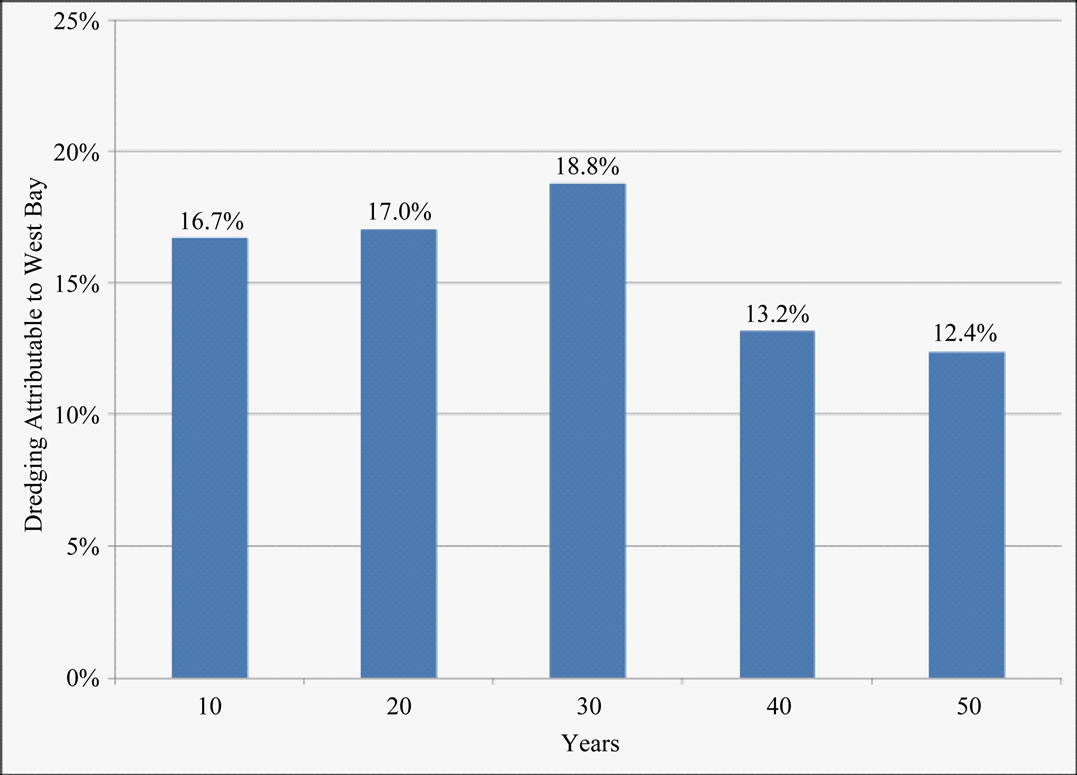
Figure 7. Combined templates.
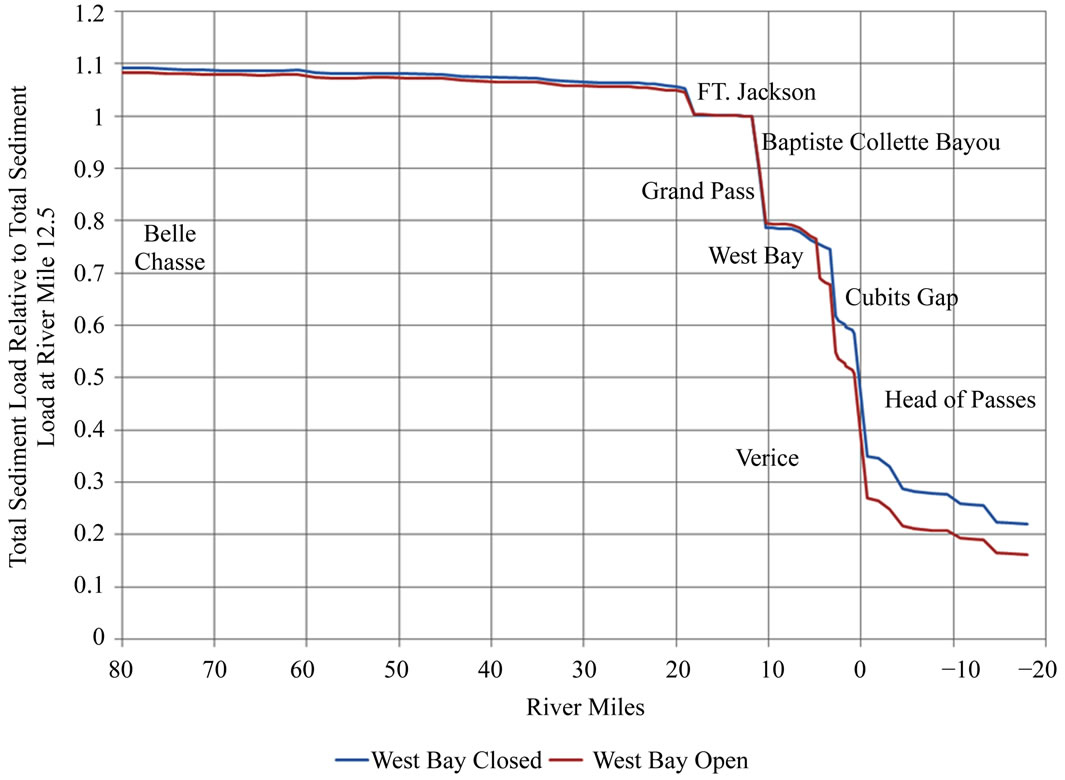
Figure 8. Total sediment load in the Mississippi River from RM 18 to the gulf computed by the ERDC Phase II Model relative to the total sediment load at the Venice discharge range (RM 12.5).
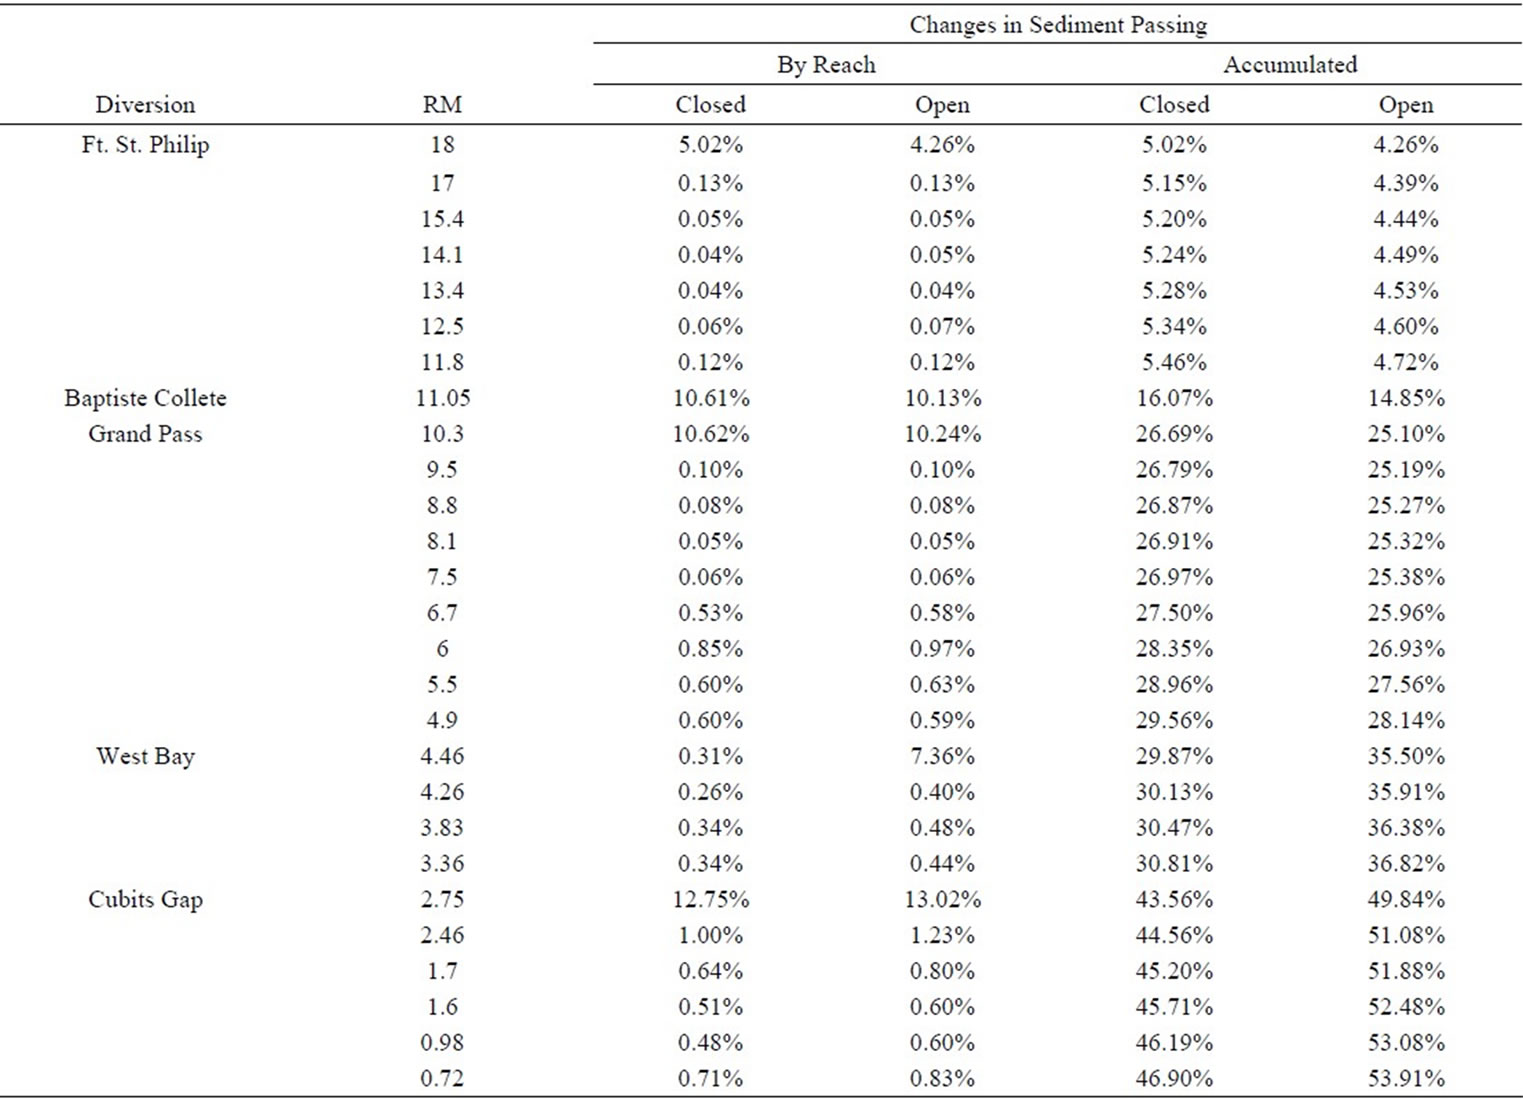
Table 2. Changes in total sediment load in the mississippi river computed by the ERDC Phase II model.
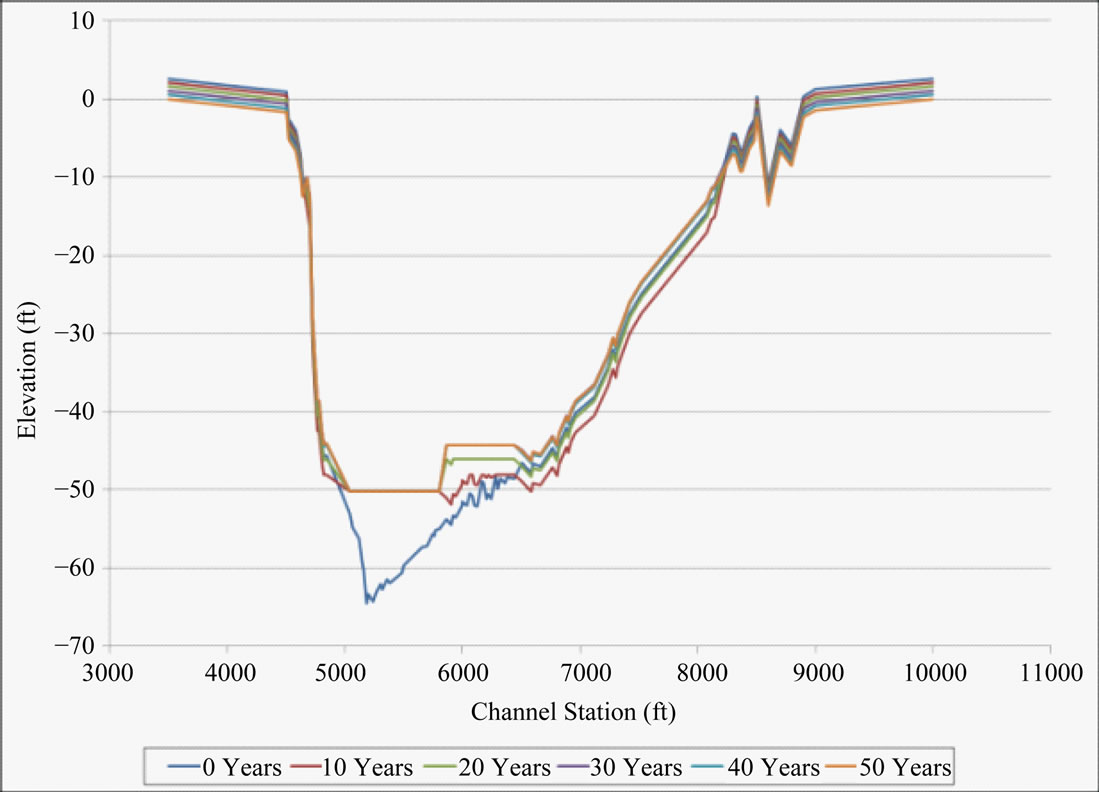
Figure 9. Channel cross section at river mile 3.83, west bay diversion closed.
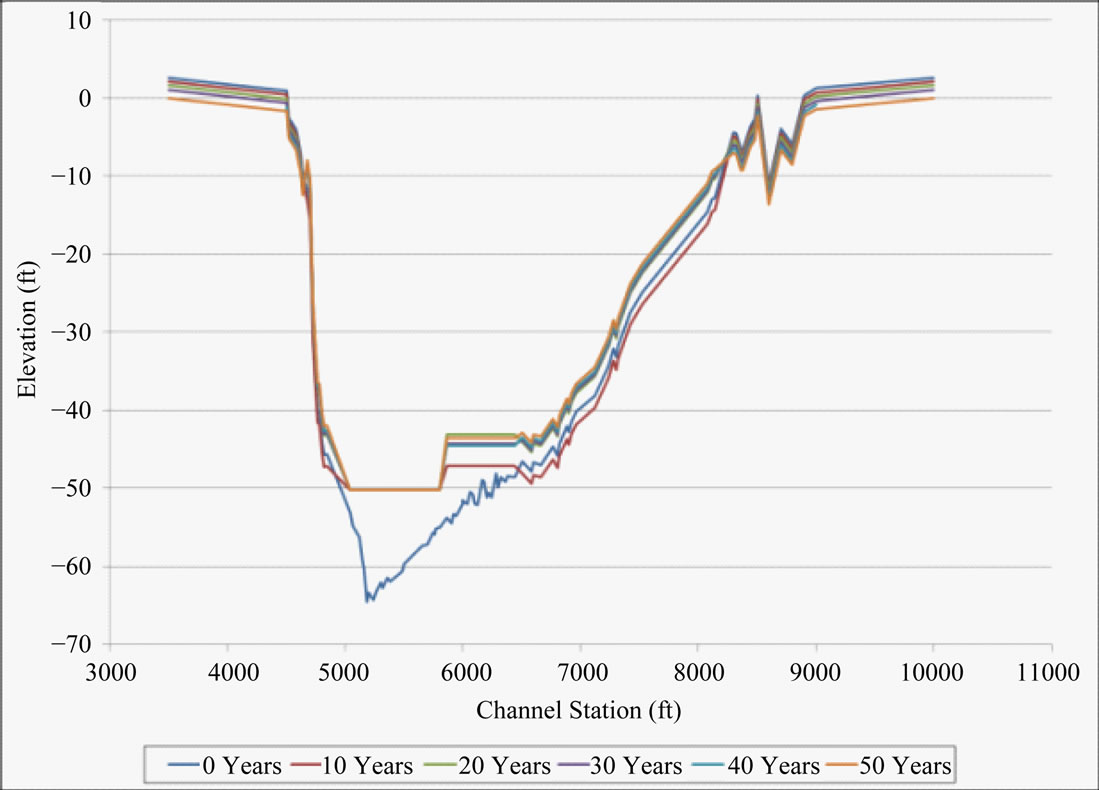
Figure 10. Channel cross section at river mile 3.83, west bay diversion open.
to illustrate the behavior of the model in PAA reach while the WBSD is both open and closed. There are four key features that are central. First, the plots clearly illustrate the impact of dredging the Navigation Channel and PAA separately. With the ERDC Phase I effort this unique cross-section geometry was not possible. Secondly, once the dredging template fills, uniform deposition occurs at every point in the cross-section that is within the moveable bed limits. Again this is a 1-dimensional model and does not have the ability to distribute sediment laterally. Thirdly, subsidence in the overbank area is clearly shown. Subsidence also reduces bed elevations within the channel partially counteracting computed deposition. Finally, there is an increase in deposition downstream of the diversion when WBSD is open that is also indicated in the multi-dimensional modeling effort.
6. Sensitivity Analysis
Five sensitivity tests were conducted by varying key input parameters to determine the impact of attributable dredging due to WBSD being open.
1) WBSD diversion ratios were varied both + & −50%.
2) Two sea level rise scenarios were run.
3) Baptist Collette Bayou diversion ratios were varied both + & −50%.
4) Both high and low subsidence rates were evaluated.
5) Implemented Yang and Ackers White transport function.
Results of the five sensitivity tests are shown in Table 3.
With variations in sediment diversion ratios it was imperative to quantify the potential impacts of changing them. Thus, both increases and decreases in the diversion ratios were applied at WBSD while all other model parameters were held constant. One simulation increased the sand class diversion ratios by 1.5 and the other decreased it by 0.5. Thereby, creating a plus and minus 50% sand diverted test at WBSD. For the smaller grain sizes (silts and clays) the ratios were held constant at 1. Decreasing the amount of diverted sand resulted in an attributable rate of 15.8% and 29.5% in the Navigation Channel and PAA respectively. Increasing the same values by 1.5 resulted in a decrease of the attributable rate of 11.9% and 21.6% in the Navigation Channel and PAA respectably. These ranges represent the variations due to changes in the sediment diversion ratios at WBSD.
If the sediment diversion ratio is viewed as a measure of sediment diversion efficiency, this sensitivity test demonstrates that increasing efficiency reduces dredging
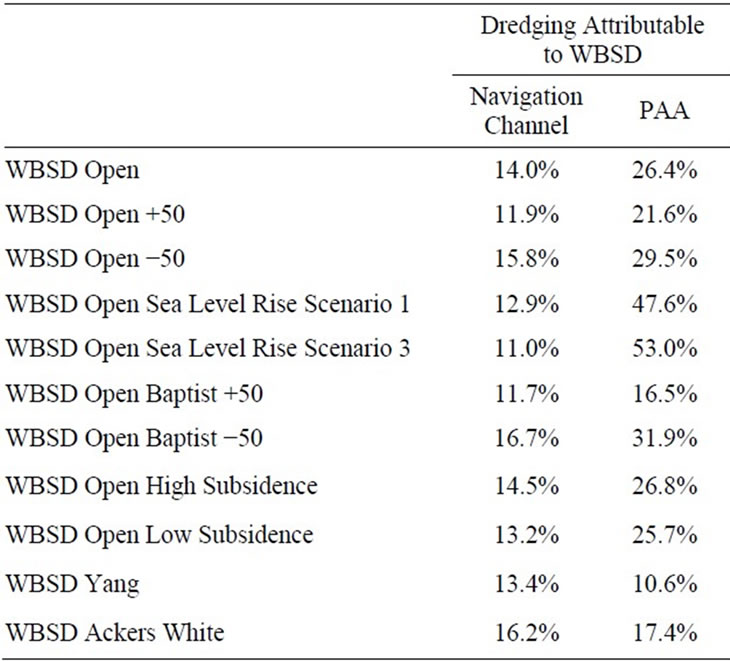
Table 3. Sensitivity test results.
by reducing the sediment supply downstream of the diversion. However, diverting water from the river also decreases the energy available to transport bed material sediments. Since here the downstream reach is already an efficient sediment trap, a ±50% change in efficiency produces less than a 3% change in total computed dredging above Head of Passes.
Eustatic sea level rise appears to have the greatest impact on attributable dredging in the PAA. The applied rates are based on the USACE guidelines. Scenario 1 acceleration rate is 0.0000271 m/yr and Scenario 3 acceleration rate is 0.000113 m/yr. Shown in Table 3 Scenario 1 has an attributable rate of 12.9 and 47.6% for the navigation channel and PAA respectively. Scenario 3 has an attributable rate of 11 and 53% for the navigation channel and PAA respectively. Again dredging volumes in the Navigation Channel are much greater than those in the PAA. Furthermore, the dramatic increase is due to the backwater curve extending further upstream due to the sea level rise. This causes the deposition that was occurring in the Southwest Pass to occur in the West Bay Reach.
Diversion impacts extend downstream and have the potential to change characteristics of other diversion. Baptiste Collette sediment ratios were also varied similar to the first sensitivity test. Baptiste Collette was selected since it is upstream of WBSD. All other parameters were held constant with a 50% increase and decrease in the sediment diversion ratios at Baptiste Collette. This range of sediment diversion ratios represents the potential variation that WBSD might experience if diversions upstream were to change. For the Navigation Channel the attributable amount due to WBSD ranged from 11% - 17%. While the PAA range was from 16% - 32%. The higher end in both ranges was from the reduction in sediment diversion ratios at Baptiste Collette.
Subsidence is counterproductive for land formation but potentially beneficial for navigation. Here two rates were evaluated, 8 mm/yr and 24 mm/yr. The production runs for the ERDC model used the rate of 16 mm/yr. These two new rates provided a 50% increase and decrease in subsidence. The low subsidence rate produced the least amount that is attributable to WBSD being open while the higher rate produced the most (see Table 3).
The final sensitivity test was varying the sediment transport functions. For this test two additional functions were applied, Yang and Ackers White. Both functions are standard use functions on the Mississippi River. By running different functions and holding all else the same, it tested the robustness of the model and the location. With both equations the attributable impact in the Navigation Channel did not change while PAA attributable did decrease.
7. Conclusions
The WBSD cannot be analyzed in isolation. It is part of a complex interacting system of diversions which influence the morphology of the Mississippi River and Passes. An understanding of the response of the system to changes at any one diversion requires an understanding of the response of the system to each and every significant diversion. Approximately 40% - 55% of the total flow and sediment passing the Venice discharge range at river mile 12.5 is diverted from the river upstream of Head of Passes at RM 0. This reach is aggradational with deposition increasing in the downstream direction and concentrated below Cubits Gap. Deposition and subsequent maintenance dredging in this reach constitute a relatively small fraction of the difference in total sediment load entering and exiting this reach.
The 1-D model performs well in reproduction of deposition and dredging locations but underestimates the best available estimates of dredging quantities in Southwest Pass. Average computed annual dredging rates during the 50-year model simulation, including the reach above Head of Passes, agree reasonably well with reported dredging rates over the last decade. From Cubits Gap downstream to Head of Passes, the navigation channel functions as an efficient sediment trap. Actions, such as dredging, that increases the width of the sediment trap increase the volumetric rate of deposition within this reach.
Although the WBSD diverts only 7% (as modeled) of the total flow, the computed impact on dredging is disproportionably large. The ERDC Phase II model consistently indicates that the West Bay Diversion accounts for a 10% - 15% of the dredging required in the Navigation Channel reach above Head of Passes, and WBSD accounts for 20% - 30% of dredging in the Pilottown Anchorage Area with a combined total rate of 10% - 20% for both the PAA and Navigation Channel.
Sedimentation processes in Southwest Pass, particularly those describing the behavior of cohesive sediments, are strongly influenced by tides and salinity intrusion. While these processes may be simulated to a limited extent by adjustment of model coefficients affecting cohesive sedimentation, a 3D or laterally averaged hydrodynamic/salinity/sedimentation model may be required to resolve the processes producing this deposition.
The left descending bank diversion immediately downstream of Fort St. Philip may be comparable in flow capacity to the WBSD. However, the Fort St. Philip diversion is located on the outside of a reveted bend where maximum river depths are 3 to 4 times greater than at the WBSD. Additional field investigations are needed to characterize the sediment diversion efficiency of the Fort St. Philip diversion.
8. Acknowledgements
The experiments described and results presented in this paper were obtained through research sponsored by the US Army Corps of Engineers New Orleans District. Special thanks are extended to the US Army Corp of Engineers Vicksburg District for providing the MVK HEC-6T model. Permission was granted by the Chief of Engineers to publish this information.
REFERENCES
- G. Miller, “Mississippi River—West Bay Sediment Diversion,” ASCE World Water Congress, 2004. US Army Corps of Engineers, New Orleans, LA.
- MBH Software, Inc., “Sedimentation in Stream Networks (HEC-6T) User Manual,” MBH Software, Inc., Clinton, 2009.
- J. Barras, S. Beville, D. Britsch, S. Hartley, S. Hawes, J. Johnston, P. Kemp, Q. Kinler, A. Martucci, J. Porthouse, D. Reed, K. Roy, S. Sapkota and J. Suhayda, “Historical and Projected Coastal Louisiana Land Changes: 1978- 2050,” USGS, US Department of Interior, Open File Report 03-334, 2003, 39 p.
- Louisiana Coastal Wetlands Conservation and Restoration Task Force, “Louisiana Coastal Wetlands Restoration Projects,” Evaluation Report to the US Congress, 1997.
- M. F. M. Bos, “The Morphological Effects of Sediment Diversions on the Lower Mississippi River,” MSc Thesis, Delft University of Technology, Delft, 2011.
- M. Davis, “Numerical Simulation of Unsteady Hydrodynamics in the Lower Mississippi River,” MSc Thesis, University of New Orleans, New Orleans, 2010.
- R. R. Copeland and W. A. Thomas, “Lower Mississippi River Tarbert Landing to East Jetty Sedimentation Study,” US Army Corps of Engineers, New Orleans District, 1992.
- D. E. Barbe, K. Fagot and J. A. McCorquodale, “Effects on Dredging Due to Diversions from the Lower Mississippi River,” Journal of Waterway, Port, Coastal and Ocean Engineering, Vol. 126, No. 3, 2002, pp. 121-129.
- R. E. Heath, J. A. Sharp and C. F. Pinkard Jr., “1-Dimesnional Modeling of Sedimentation Impacts for the Mississippi River at the West Bay Diversion,” 4th Federal Interagency Hydrologic Modeling Conference and the 9th Federal Interagency Sedimentation Conference, 2010.
- Hydrologic Engineering Center (HEC), “HEC-6 scour and Deposition in Rivers and Reservoirs, User Manual,” US Army Corps of Engineers, Davis, 1993.
- US Army Corps of Engineers, “Backwater Curves in River Channels,” 1959.
- US Army Corps of Engineers, “River Hydraulics,” 1993.
- Hydrologic Engineering Center (HEC), “HEC-6 Scour and Deposition in Rivers and Reservoirs. Users Manual,” US Army Corps of Engineers, Davis, 1977.
- K. D. Shinkle and R. K. Dokka, “Rates of Vertical Displacement at Benchmarks in the Lower Mississippi Valley and in the Northern Gulf Region,” NOAA Technical Report NOS/NGS 50, 2004.
- V. A. Vanoni, “Sedimentation Engineering,” American Society of Civil Engineers, New York, 1975.
- F. B. Toffaleti, “Deep River Velocity and Sediment Profiles and the Suspended Sand Load,” Paper No. 28, US Department of Agriculture, Federal Inter-Agency Sedimentation Conference, 1963.
- F. B. Toffaleti, “A Procedure for Computation of the Total River Sand Discharge and Detailed Distribution, Bed to Surface,” Technical Report No. 5, United States Army, Committee on Channel Stabilization, Corps of Engineers, Vicksburg, 1968.
- F. B. Toffaleti, “Definitive Computations of Sand Discharge in Rivers,” Journal of the Hydraulics Division, ASCE, Vol. 95, No. HY1, 1969, pp. 225-248.
- P. R. Jordan, “Fluvial Sediment of the Mississippi River at St. Louis, Missouri,” Water-Supply Paper 1802, United States Geological Survey, Washington DC, 1956.
- C. F. Nordin, “Aspects of Flow Resistance and Sediment Transport: Rio Grande near Bernalillo, New Mexico,” Water Supply Paper 1498-H, United States Geological Survey, Washington DC, 1964.
- D. W. Hubble and D. Q. Matejka, “Investigation of Sediment Transport, Middle Loup River at Dunning, Nebraska,” Water-Supply Paper No. 1476, United States Geological Survey, Washington DC, 1959.
- B. R. Colby and C. H. Hembree, “Computations of Total Sediment Discharge Niobrara River near Cody, Nebraska,” Water-Supply Paper 1357, United States Geological Survey, Washington DC.
- J. F. Kennedy, “Stationary Waves and Antidunes in Alluvial Channels,” Report KH-R-2, W. M. Keck Laboratory of Hydraulics and Water Resources, California Institute of Technology, Pasadena, 1961.
- V. A. Vanoni and N. H. Brooks, “Laboratory Studies of Roughness and Suspended Load of Alluvial Streams,” Sedimentation Laboratory Report No. E68, California Institute of Technology, Pasadena, 1957.
- H. A. Einstein and N. Chien, “Transport of Sediment Mixtures with Large Range of Grain Size, MRD Sediment Series No. 2,” United States Army Engineer Division, Missouri River, 1953.
- H. P. Guy, D. B. Simmons and E. V. Richardson, “Summary of Alluvial Channel Data Flume Experiments, 1956- 61,” Professional Paper 426-I, USGS, 1966.
- C. F. Nordin and B. S. Queen, “Particle Size Distributions of Bed Sediments along the Thalweg of the Mississippi River, Cairo, Illinois, to Head of Passes, September 1989,” Report CER9O-91CFN-BSQ3, Department of Civil Engineering, Engineering Research Center, Colorado State University, Fort Collins, 1991.
- W. R. White, H. Milli and A. D. Crabbe, “Sediment Transport: Appraisal of Available Methods,” Hydraulic Research Station, Wallingford, 1978.
Nomenclature
g = acceleration of gravity;
he = energy head loss;
V = average velocity at ends of reach;
WS = water surface elevation at ends of reach;
α = velocity distribution coefficient for flow at ends of reaches;
L = discharge weighted reach length;
 = representative friction slope for reach;
C = expansion or contraction.