Journal of Water Resource and Protection
Vol.6 No.1(2014), Article ID:41980,8 pages DOI:10.4236/jwarp.2014.61002
Influence of Constructed Wetland and Soil Filter Systems in the Dynamics of Phytoplankton Functional Groups of Two Subtropical Fish Farm Wastewaters
1Aquaculture Center, University of São Paulo State, Jaboticabal, Brazil
2Federal University of São Carlos, São Carlos, Brazil
Email: rodrigomillan@yahoo.com.br
Received May 17, 2013; revised June 19, 2013; accepted July 15, 2013
ABSTRACT
Environmental pressure, land utilization, and economic feasibility have resulted in the development of alternatives to treatment fish farm wastewater. We examined the influence of two water treatment systems—a constructed wetland (CW) and a soil filter system (SF)—on the constitution of the phytoplankton community analyzed through the functional grouping of species and nutrients removal of aquaculture farm. The CW provided high removal efficiency: 82.9% for ammonia, 87.0% for nitrate, 96.9% for nitrite, 85.5% for total phosphorus, 88.5% for SRP and 71.6% for BOD. Removal efficiency of SF was lower than CW, removing 82.1% of ammonia, 7.2% of total phosphorus, 45.9% of SRP and 39.4% of nitrite, but was satisfactory. The functional group F, made up of Chlorophyceae Dictyosphaerium pulchellum and Kirchneriella lunaris, was the most representative in both systems, followed by functional group P and constituted by Zygnemaphyceae Melosira sp. The number of functional groups decreased in the outlet of the two treatment systems, where S1, H1 and W1, characteristic of eutrophic environment, were retained. Data show that CW and the SF system are potentially applicable to the fish farm wastewater treatment and ensure an improvement in water quality.
Keywords:Wastewater Treatment; Microalgae; Removal Efficiency; Functional Groups
1. Introduction
Wastewater quality of the aquaculture farm is highly important when the environmental aspects of the production of water organisms are taken into account. This is due to the significant impact on the environment and natural resources caused by water discharged from these systems [1]. Eutrophication and other deleterious effects are thus produced in the receiving water bodies [2]. The production systems of aquatic organisms need the implantation of low cost strategies to mitigate the impacts caused by effluents, such as water treatment by natural or constructed wetlands [2-4].
The effects already known of nutrients, organic matter and suspended solids removal by biological treatments of wastewater are due to a combination of physical, chemical and biological processes which include sedimentation, precipitation, adsorption, assimilation by the plant tissues and microbial transformation [5]. However, relationships between abiotic and biotic environmental factors have been given only slight attention in systems featuring the biological treatment of wastewater [6].
Nutrients, organic matter and suspended solids decrease in wetlands due to a combination of physical and chemical parameters and biological processes which include sedimentation, precipitation, adsorption, assimilation by the plant tissues and microbial transformation [5].
Phytoplankton species should provide morphological and physiological adaptive strategies to survive the different environments and thus all aquatic habitats [7]. The interpretation of data on a phytoplankton community should take into account the environmental characteristics in which the community is inserted and the response of the algae to environmental variations. Reynolds et al. [8] employed physiological and morphological data of phytoplankton and grouped the species in functional categories that may dominate or co-dominate a given environment. These functional groups are often polyphyletic and share adaptive features, based on the physiological, morphological and ecological attributes of species [9]. Currently, the phytoplankton functional groups approach uses 38 assemblages that are identified by alpha-numeric codes according to their sensitivity and tolerance [10].
The dynamics of functional phytoplankton groups has been evaluated in two aquaculture wastewater treatments in current study. One treatment consisted of a surface flow constructed wetland with aquatic macrophytes; the other consisted of unplanted soil filter systems. The objective of this work was to analyze the effects of treatments on water quality and phytoplakton functional groups composition.
2. Material and Methods
2.1. Study Area
Research was undertaken on the small watershed situated in Jaboticabal city, São Paulo state, Brazil (21˚15'S, 48˚18'W) comprising a fish farm and a fee-fishing farm. The fish farm consists of 73 small ponds (c.a. 140 m2) with a continuous water flow and six large ponds, disposed in a sequence, ranging between 2306 and 9231 m2.
A semi-intensive production is conducted for research with an average stock density of 1 fish∙m−2 in a total area of the water surface of 36,195 m2 and mean depth of 1.50 m. The fee-fishing farm lies near the fish farm and displays three large ponds with continuous water flow and sequential disposition, varying between 1501 and 1850 m2, with intensive ponds for sports fishing and a stocking density of approximately 3 fish∙m−2 in a total area of 5000 m2 and mean depth of 1.50 m. The two systems discharge wastewater into the Jaboticabal creek (Figure 1).
Colossoma macropomum (tambaqui), Oreochromis niloticus (Nile tilapia) and Leporinus obtusidens (piauçu) are the main species in the two systems. The fish farm provides a daily ration of 130 kg composed of corn, soybean and fish meal (28% crude protein). In the fee-fishing farm, 60 kg of daily rations are available, with corn, soybean and fish meal (22% crude protein).
Current study employed two wastewater treatment systems: a surface flow constructed wetland (CW) with macrophytes at the final effluent of the fish farm and unplanted surface soil filter system (SF) at the final effluent of the fee-fishing unit. The CW measures 71 m long, 1.9 m wide and mean depth 0.3 m, and was provided with four types of macrophytes commom in the region: Cyperus giganteus (20 m2), Typha domingensis (13 m2), Eichhornia crassipes (10 m2) and Pontederia cordata (3 m2). The unplanted surface soil filter system was constructed in the fee-fishing area for the discharge
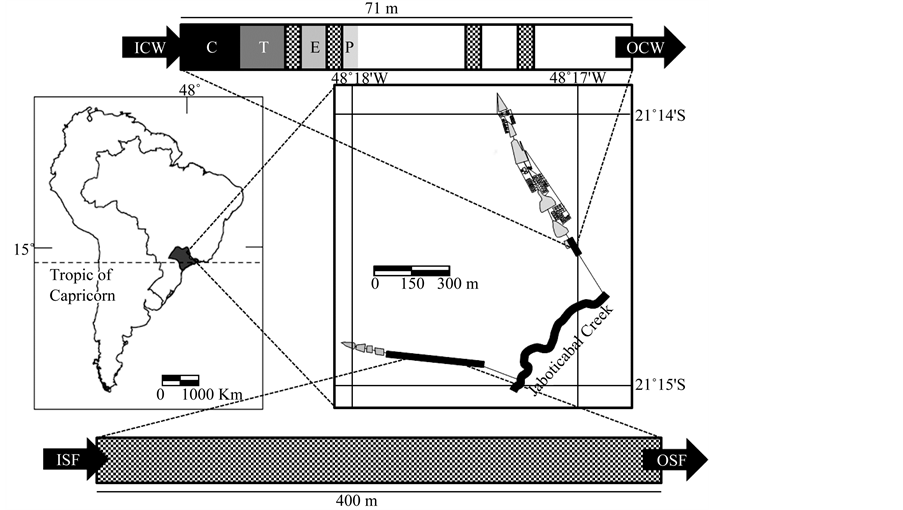
Figure 1. Detail of the map of Brazil, focusing on collection sites, with a scheme of the two treatment systems: ICW = inflow of constructed wetland; OCW = outflow of constructed wetland; ISF = inflow of the unplanted soil filter system; OSF = outflow of the unplanted soil filter system; C = Cyperus giganteus; T = Typha domingensis; E = Eichhornia crassipes; P = Pontederia cordata; squared rectangle = stones.
of water used in the ponds, reaching another agricultural farm with gravel stones. The SF measures approximately 400 m long, 3 m wide and maximum depth 0.4 m (Figure 1).
The climate in the region is subtropical Cwc [11], relatively dry in the winter (June to August) and rainy in the summer (December to March), with mean yearly temperature of 22˚C and mean yearly of rainfall 1424.6 mm.
2.2. Sampling Sites
Samples for abiotic and biotic variables determination were undertaken monthly from March 2009 to February 2010. Water and phytoplankton samples were evaluated in two sampling sites in each wastewater treatment: water inflow (ICW) and outflow (OCW) of constructed wetland and water inflow (ISF) and outflow (OSF) of unplanted soil filter system.
2.3. Data Collection
Water temperature (˚C), dissolved oxygen (mg∙L−1), pH and conductivity (µS∙cm−1) were taken with Horiba U-10 water quality checker. Total phosphorus, soluble phosphorus reactive, nitrate, nitrite and ammonia, were evaluated according to Golterman et al. [12] and Koloreff [13]. Chlorophyll-a and biochemical oxygen demand were quantified according to Nusch [14] and Boyd and Tucker [15], respectively.
The phytoplankton samples were sampled, fixed with 1% Lugol’s iodine solution and stored in amber glass vials. The quantitative phytoplankton samples were place in sedimentation chamber during 30 minutes, and the organisms (cells, colonies and filaments) were examined under 200× magnification [16]. At least 100 individuals of the most frequency species were counted (p < 0.05; [17]).
2.4. Data Analysis
The removal rate (RR) between inflow and outflow abiotics variables concentrations for each treatment was measured by the formula:

where Ci is the inflow concentration (µg∙L−1) and Co is the outflow concentration (µg∙L−1) [18].
Algae biovolume was calculated by the most adequate geometric formulae [19], in which fresh mass was estimated according to the proportion: 1 mm3∙L−1 = 1 mg∙L−1 [20]. Species which contributed by more than 5% of total biomass were grouped in functional groups [8,10].
Lillierfors and Bartlett tests and residual analyses were employed for abiotic variables to verify normality and homogeneity of variances at the significant level α = 0.05. Mann-Whitney non-parametric test was employed to compare the difference between inflow (ICW; ISF) and outflow (OCW; OSF) water for each wastewater treatment [21]. The set of abiotic data were evaluated by principal components analysis (PCA) and undertaken according to software Statistica 8.0 [22].
3. Results
Removal taxa of the main compounds related to water quality by both systems was evaluated by the characteristics of their inlet and outlet data. In the CW from fish farm, provided high removal efficiency: 82.9% for ammonia, 87.0% for nitrate, 96.9% for nitrite, 85.5% for total phosphorus, 88.5% for SRP and 71.6% for BOD. Removal efficiency of SF was lower than CW, removing 82.1% of ammonia, 7.2% of total phosphorus, 45.9% of SRP and 39.4% of nitrite, but was satisfactory. The ICW site showed the highest values of dissolved oxygen, conductivity, alkalinity, BOD5 and nutrients, differing significantly (p < 0.05) from ISF site. Outlet waters also differed (p < 0.05). Concentrations of pH, conductivity, alkalinity, BOD5 and nutrients in the OCW site were significantly (p < 0.05) higher than that in the OSF site (Table 1).
The principal components analysis (PCA) with 11 abiotic variables retained 94.1% of the original data variability in the first two axes (axis 1 = 75.9%; axis 2 = 18.2%). The ICW site and the most important variables were grouped on the negative side of axis 1: temperature (−0.76), conductivity (−0.99), alkalinity (−0.97), BOD5 (−0.99), nitrate (−0.99), nitrite (−0.98), total phosphorus (−0.99), ammonia (−0.95) and SRP (−0.99). The first component of the PCA indicated a trophic state in which ICW site on the negative side presented the worst water quality. The sites OCW and OSF were associated with lower concentrations of nutrients, DBO5 and conductivity. In the axis 2, pH (−0.93) and dissolved oxygen (−0.97) were the most relevant variables for ordination. The second principal component indicated lower pH and dissolved oxygen at the site ISF (Figure 2).
Ten descriptive phytoplankton species (>5% of total biomass) were identified in the constructed wetland and fitted in 7 functional groups. There were 13 descriptive species in the soil filter system, also distributed in 8 functional groups. Nineteen descriptive species, forming 11 functional groups, were identified (Table 2).
F was the principal phytoplankton functional group found at the ICW site, comprising the Chlorophyceae algae Dictyosphaerium pulchellum and Kirchneriella lunaris, with a variation between 55% and 83% in relative abundance. P was another important group in the constitution of the community, comprising Bacillariophyceae Melosira sp. and Zygnemaphyceae Closterium sp., with a variation between 8% and 34% (Table 2

Table 1. Means, standard deviations and results of Mann-Whitney’s test in and between the ecosystems, where ICW = inflow of the constructed wetland; OCW = outflow of the constructed wetland; RC = removal taxa of constructed wetland; ISF = inflow of the unplanted soil filter systems; OSF = outflow of the unplanted soil filter systems; RS = removal taxa of the unplanted soil filter system. Underlined letters to means indicate the result of statistical analysis in the ecosystems. NS: not significant; *: p<0.05; **: p<0.01; -: no removal occurred.
Table 2. Principal phytoplankton species with taxonomic and functional groups.
Figure 3).
Groups with the greatest representations at the OCW site as the same as those at the ICW site. However, group F also comprised the Chorophyceae algae Oocystis lacustris. An increase of relative contribution of group P has been observed at this site, exclusively during May when a peak in Cyanobacteria Microcystis sp. of the functional group M occurred in the following month (Figure 2). When the number of functional groups in ICW and OCW sites are compared, a decrease of functional groups at the OCW site may be observed, or rather, where groups W1, G and MP were not present (Table 2; Figure 3).
High participation of functional group F occurred in the phytoplankton functional groups at ISF site, although it was not so dominant as at the ICW site. Other groups were important for the constitution of the phytoplankton
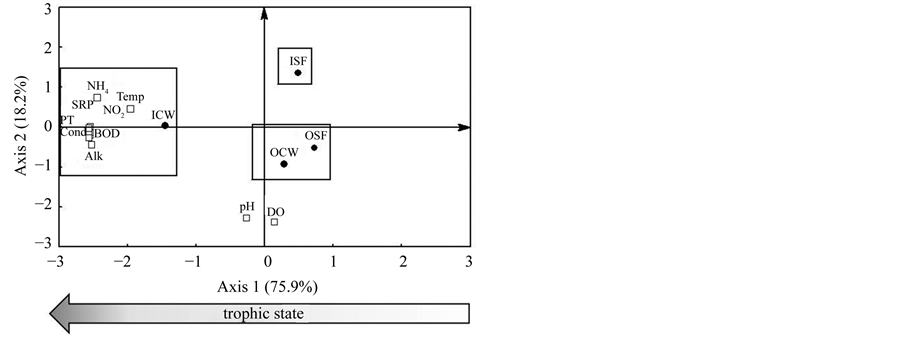
Figure 2. Biplot graph of principal components analysis (PCA) with ten environmental variables, where: open square = variables (NH4 = ammonia; Temp = temperature; BOD = biochemical oxygen demand; DO = dissolved oxygen; Cond = electrical conductivity; TP = total phosphorus; NO2 = nitrite; NO3 = nitrate; Alk = alkalinity; SRP = soluble phosphorus reactive; pH); close circle = collection sites (ICW = inflow of the constructed wetland; OCW = outflow of the constructed wetland; ISF= inflow of the unplanted soil filter system; OSF = outflow of the unplanted soil filter system).
community at ISF, such as P (composed of the Bacillariophyceae Melosira sp.) and NA (composed of the Zygnemaphyceae Groenbladia sp., Netrium digitus, Spirogyra sp.). Functional group H1, composed of the Cyanobacteria Anabaena sp. had peaks in October and November. They reached a relative abundance of 68%, immediately after the highest peak of group NA (Table 2, Figure 3).
Site OSF had a decrease in functional groups when compared to the previous one. Groups H1 (whose composition has already been described), S1 (composed of the Cyanobacteria Limnothrix sp.) and T (composed of the Zygnemaphyceae Mougeotia floridana) were not present. The importance of functional groups F, P and NA and the previous site ISF in the constitution of the phytoplankton community was replicated at this site (Table 2; Figure 3).
4. Discussion
In current study, the two evaluated systems had the same climate regimes since they lie in the same small watershed and had similar mean water temperature. However, the hydraulic flow of the CW is higher than SF. This is principally due to a greater agricultural production area from which comes most of the water and to the rain water discharge flow.
The CW provided highest removal efficiency when comparing to the SF, mainly for nitrate, nitrite, total phosphorus and soluble reactive phosphorus, maybe by presenting nutrient loads at inlet much higher. Furthermore, in the CW the absorption by plants may be considered the main form of nutrients removal [23]. Some studies have shown that macrophytes may improve the removal of compounds by sedimentation, filtering, nutrient assimilation, oxygenization and mechanisms of microbial fixation, such as nitrifying and denitrifying bacteria [24- 26]. On the other hand, other researches failed to detect any significant difference among the planted or nonplanted systems [27,28]. However, comparisons between different researches are difficult since they employ different types of substrates, rates of hydraulic flows and concentrations of different pollutants [25]. This is the case of current research. Although the two systems lie within the same small watershed, they have different sizes, hydraulic flows and concentration of compounds which affect the removal efficiency of each. Although comparison was difficult, it should be noted that the two systems for aquaculture wastewater treatment, were effective.
Functional group F, the most representative in all sampled sites, featured the Chlorophyceae microalgae Dictyosphaerium pulchellum, Kirchneriella lunaris and Oocystis lacustris, which characterized meso-eutrophic environments [8]. The replication of this functional group throughout the entire sampling period with high representativeness at all sites may indicate that the group is proper to fish farm wastewater. In fact, fish farm with continuous water flow receives great volumes of allochthonous matter, such as feed and fertilizers, with the consequent increase in trophic levels [29].
P was another highly important group. It is constituted by the filamentous Bacillariophyceae Melosira sp. found in turbulent waters, with high eutrophication [30]. At site OCW, during May, the P group was the only representative of the phytoplankton community. This fact may evidence a disturbance with great turbulence, with an increase in phosphorus rates and a decrease in nitrogenated forms. During the following month, an increase in nitrate concentration occurred which established conditions favorable to the proliferation of Cyanobacteria, a constituting factor of the functional group M, as reported by Borges et al. [31] in a tropical fish farm.
Macrophytes in the CW caused modifications in the phytoplankton structure of the community through the disappearance of groups W1, G and MP at the end of the system (OCW), principally some Euglenophyceae belong to group W1 and colonial Chlorophyceae of group G which displaced themselves close to the aquatic macrophytes [32].
The Euglenophyceae Lepocinclis sp. represented the functional group W1 in current research and characterized the fish culture ponds rich in organic matter. Eudorina sp, a Chlorophyceae with colonizing habits, inte-
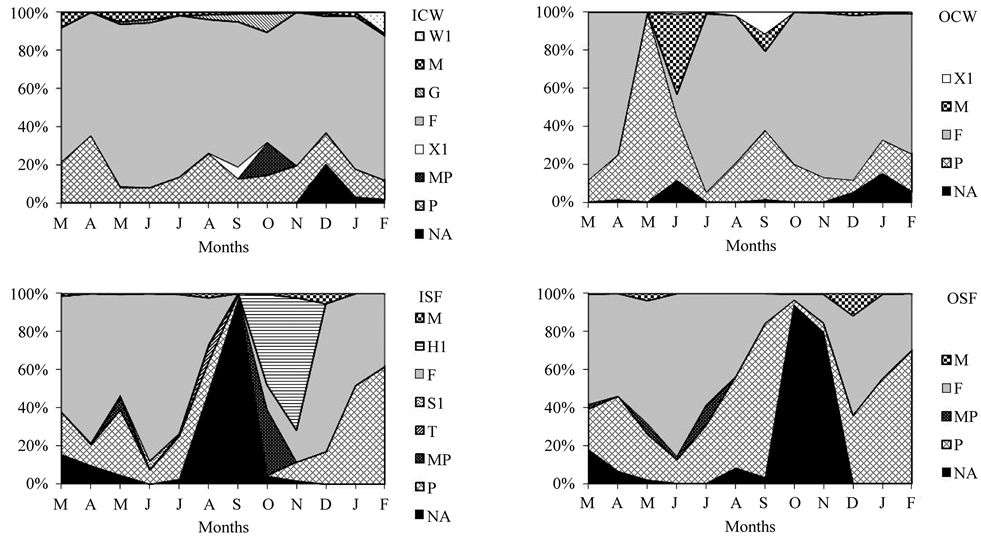
Figure 3. Relative abundance of phytoplankton functional groups at the sampled sites. Where: ICW = inflow of the constructed wetland; OCW = outflow of the constructed wetland; ISF = inflow of the unplanted soil filter system; OSF = outflow of the unplanted soil filter system.
grated group G and lived in nutrient-rich environments [8]. The disappearance of the two groups from OCW after the passage of water through the macrophytes, showed the effect positive of the treatment on water quality. Group MP was formed by the Zygnemaphyceae Desmidium sp. and by the Bacillariophyceae Surirella sp., typically proper to shallow and turbulent water environments [33], very much like the entrance to the constructed wetland (ICW).
The functional group NA comprises unicellular and filamentous Zygnemaphyceae adapted to oligo-mesotrophic environments [34]. An increase representativeness of the groups during its passage through the SF shows that improvement on the water quality and ecological conditions occurred. Improvement may be warranted by a decrease in the number of functional groups at OSF site, where groups H1 and S1, composed of Cyanobacteria, disappeared.
5. Conclusion
The CW had higher nutrient removal rates, perhaps due to the presence of the macrophytes. The phytoplankton functional groups were basically the same, with modifications at the initial stage and a decrease in species. Attention must be given to the design and size of wastewater treatments for successful application. The CW and SF showed an improvement capacity of the fish farm wastewaters, and the treated water could be recycled to the rearing fish ponds and resulted in water-saving for the farmer.
Acknowledgements
The authors would like to thank the “Coordination for the Improvement of Higher Level Personnel” (Capes) for scholarship and “São Paulo Research Foundation” (Fapesp) financial support (10/50478-6). We also acknowledge the working group of Limnology and Plankton Production Laboratory.
REFERENCES
- N. F. Schenone, L. Vackova and A. F. Cirelli, “FishFarming Water Quality and Environmental Concerns in Argentina: A Regional Approach,” Aquaculture International, Vol. 19, No. 5, 2011, pp. 855-863. http://dx.doi.org/10.1007/s10499-010-9404-x
- D. Konnerup, N. T. D. Trang and H. Brix, “Treatment of Fishpond Water by Recirculating Horizontal and Vertical Flow Constructed Wetlands in the Tropics,” Aquaculture, Vol. 313, No. 1-4, 2011, pp. 57-64.
- L. H. Sipaúba-Tavares and F. M. S. Braga, “Constructed Wetland in Wastewater Treatment,” Acta Scientiarum Biological Sciences, Vol. 30, No. 3, 2008, pp. 261-265. http://dx.doi.org/10.4025/actascibiolsci.v30i3.5002
- P. D. Sindilariu, A. Brinker and R. Reiter, “Factors Influencing the Efficiency of Constructed Wetlands Used for the Treatment of Intensive Trout Farm Effluent,” Ecological Engineering, Vol. 35, No. 5, 2009, pp. 711- 722. http://dx.doi.org/10.1016/j.ecoleng.2008.11.007
- J. L. G. Kumar and Y. Q. Zao, “A Review on Numerous Modeling Approaches for Effective, Economical and Ecological Treatment Wetlands,” Journal of Environmental Management, Vol. 92, No. 3, 2011, pp. 400-406. http://dx.doi.org/10.1016/j.jenvman.2010.11.012
- J. S. Thullen, S. M. Nelson, B. S. Cade and J. J. Sartoris, “Macrophyte Decomposition in a Surface-Flow AmmoniaDominated Constructed Wetland: Rates Associated with Environmental and Biotic Variables,” Ecological Engineering, Vol. 32, No. 3, 2008, pp. 281-290. http://dx.doi.org/10.1016/j.ecoleng.2007.12.003
- C. Kruk, E. T. H. M. Peeters, E. H. Van Nes, V. L. M. Huszar, L. S. Costa and M. Scheffer, “Phytoplankton Community Composition Can Be Predicted Best in Terms of Morphological Groups,” Limnology and Oceanography, Vol. 56, No. 1, 2011, pp. 110-118. http://dx.doi.org/10.4319/lo.2011.56.1.0110
- C. S. Reynolds, V. L. M. Huszar, C. Kruk, L. NaselliFlores and S. Melo, “Towards a Functional Classification of the Freshwater Phytoplankton,” Journal of Plankton Research, Vol. 24, No. 5, 2002, pp. 417-428. http://dx.doi.org/10.1093/plankt/24.5.417
- V. Becker, V. L. M. Huszar and L. O. Crosseti, “Responses of Phytoplankton Functional Groups to the Mixing Regime in a Deep Subtropical Reservoir,” Hydrobiologia, Vol. 628, No. 1, 2009, pp. 137-151. http://dx.doi.org/10.1007/s10750-009-9751-7
- J. Padisák, L. O. Crosseti and L. Naselli-Flores, “Use and Misuse in the Application of the Phytoplankton Functional Classification: A Critical Review with Updates,” Hydrobiologia, Vol. 621, No. 1, 2009, pp. 1-19. http://dx.doi.org/10.1007/s10750-008-9645-0
- M. C. Peel, B. L. Finlayson and T. A. Mcmahon, “Updated World Map of the Köppen-Geiger Climate Classification,” Hydrobiology and Earth System Sciences Discussion, Vol. 4, No. 1, 2007, pp. 439-473. http://dx.doi.org/10.5194/hessd-4-439-2007
- H. L. Golterman, R. S. Clymo and M. A. M. Ohsntad, “Methods for Physical and Chemical Analysis of Freshwater,” Blackwell Scientific Publications, Oxford, 1978.
- F. Koroleff, “Determination of Nutrients,” In: E. Grasshoff and E. Kremiling, Eds., Methods of Seawater Analysis, Verlag Chemie Weinhein, New York, 1976, pp 117- 181.
- E. A. Nusch, “Comparison on Different Methods for Chlorophyll and Phaeopigment Determination,” Archiv für Hydrobiologie Beihefte Ergebnisse Limnologie, Vol. 14, 1980, pp. 14-36.
- C. E. Boyd and C. S. Tucker, “Pond aquaculture water quality management,” Kluwer Academic Publisher, Massachussetts, 1998.
- America Public Health Association, “Standard Methods for Examination of Water and Wastewater,” APHA, Washington, 1998.
- J. W. G. Lund, C. Kipling and E. D. Lecren, “The Inverted Microscope Method of Estimating Algal Number and the Estimating Algal Number and the Statistical Bases of Estimating by Counting,” Hidrobiologia, Vol. 11, No. 1, 1958, pp. 143-170. http://dx.doi.org/10.1007/BF00007865
- R. H. Kadlec and S. D. Wallace, “Treatment Wetlands,” Taylor and Francis, Boca Raton, 2009.
- H. Hillebrand, C. D. Dürseles, D. Kirschtel, U. Pollingher and T. Zohary, “Biovolume Calculation for Pelagic and Benthic Microalgae,” Journal of Phycology, Vol. 35, No. 2, 1999, pp. 403-424. http://dx.doi.org/10.1046/j.1529-8817.1999.3520403.x
- R. G. Wetzel and G. E. Likens, “Limnological Analyses,” 3rd Edition, Springer-Verlag New York Inc, New York, 2000. http://dx.doi.org/10.1007/978-1-4757-3250-4
- S. Siegel, “Non-Parametric Statistic for Comportamental Sciences,” McGraw-Hill, São Paulo, 1975.
- StatSof Inc, “STATISTICA (Data Analysis Software System),” version 8, 2007. www.statsoft.com
- N. Gottschall, C. Boutin, A. Crolla, C. Kinsley and P. Champagne, “The Role of Plants in the Removal of Nutrients at a Constructed Wetland Treating Agricultural (Dairy) Wastewater, Ontario, Canada,” Ecological Engineering, Vol. 29, No. 2, 2007, pp. 154-163. http://dx.doi.org/10.1016/j.ecoleng.2006.06.004
- G. Merlin, J. L. Pajean and T. Lissoto, “Performances of Constructed Wetlands for Municipal Wastewater Treatment in Rural Mountainous Areas,” Hydrobiologia, Vol. 469, No. 1-3, 2002, pp. 87-98. http://dx.doi.org/10.1023/A:1015567325463
- A. D. Karathanasis, C. L. Potter and M. S. Coyne, “Vegetation Effects on Fecal Bacteria, BOD, and Suspended Solid Removal in Constructed Wetlands Treating Domestic Wastewater,” Ecological Engineering, Vol. 20, No. 2, 2003, pp. 157-169. http://dx.doi.org/10.1016/S0925-8574(03)00011-9
- H. J. Chen, “Surface-Flow Constructed Treatment Wetlands for Pollutant Removal: Applications and Perspectives,” Wetlands, Vol. 31, No. 4, 2011, pp. 805-814. http://dx.doi.org/10.1007/s13157-011-0186-3
- C. C. Tanner, J. S. Clayton and M. P. Upsdell, “Effect of Loading Rate and Planting on Treatment of Dairy Farm Wastewaters in Constructed Wetlands: Removal of Oxygen Demand, Suspended Solids and Fecal Coliforms,” Water Research, Vol. 29, No. 1, 1995, pp. 17-26. http://dx.doi.org/10.1016/0043-1354(94)00139-X
- M. E. Baldizon, R. Dolmus, J. Quintana, Y. Navarro and M. Donze, “Comparison of Conventional and Macrophyte-Based Systems for the Treatment of Domestic Wastewater,” Water Science and Technology, Vol. 45, No. 1, 2002, pp. 111-116.
- L. H. Sipaúba-Tavares, E. M. Lourenço and F. M. S. Braga, “Water Quality in Six Sequentially Disposed Fishponds with Continuous Water Flow,” Acta Scientiarum Biological Sciences, Vol. 32, No. 10, 2010, pp. 9-15. http://dx.doi.org/10.4025/actascibiolsci.v32i1.3436
- A. N. Moura, M. C. Bittencourt-Oliveira, E. W. Dantas and J. D. Toledo-Arruda-Neto, “Phytoplanktonic Associations: A Tool to Understanding Dominance Events in a Tropical Brazilian Reservoir,” Acta Botanica Brasiliensis, Vol. 21, No. 3, 2007, pp. 1-19. http://dx.doi.org/10.1590/S0102-33062007000300011
- P. A. F. Borges, S. Train, J. D. Dias and C. C. Bonecker, “Effects of Fish Farming on Plankton Structure in a Brazilian Tropical Reservoir,” Hydrobiologia, Vol. 649, No. 1, 2010, pp. 279-291. http://dx.doi.org/10.1007/s10750-010-0271-2
- C. S. Reynolds, “The Ecology of Phytoplankton,” Cambridge University Press, Cambridge, 2006. http://dx.doi.org/10.1017/CBO9780511542145
- J. Padisák, G. Borics, I. Grigorszky and É. Soróczki-Pintér, “Use of Phytoplankton Assemblages for Monitoring Ecological Status of Lakes within the Water Framework Directive: The Assemblage Index,” Hydrobiologia, Vol. 553, No. 1, 2006, pp. 1-14. http://dx.doi.org/10.1007/s10750-005-1393-9
- M. B. G. Souza, C. F. A. Barros, F. A. R. Barbosa, E. Hajnal and J. Padisák, “The Role of Atelomixis in Phytoplankton Assemblages’ Replacement in Dom Helvécio Lake, South-East Brazil,” Hydrobiologia, Vol. 607, No. 1, 2008, pp. 211-224. http://dx.doi.org/10.1007/s10750-008-9392-2