Journal of Water Resource and Protection
Vol.5 No.2(2013), Article ID:27681,9 pages DOI:10.4236/jwarp.2013.52014
Behavior of Cesium in Dam Reservior-Investigation Based on Sediment Columns
1Graduate School of Engineering, Gifu University, Gifu, Japan
2River Basin Research Center, Gifu University, Gifu, Japan
3Department of Chemical Engineering, Bung Hatta University, Padang, Indonesia
Email: *lifs@gifu-u.ac.jp
Received November 9, 2012; revised December 15, 2012; accepted December 27, 2012
Keywords: Cesium; Sediment; Sorption Capacity; Sorption Kinetics; Water Safety; Surface Water
ABSTRACT
To generate information for better understanding of the behavior of cesium in relatively closed water bodies, experiments using four columns consisted of the sediment phase and the overlying water phase, together with batch sorption experiments were conducted, and the kinetics and the binding potential of cesium by sediment were investigated. Through model analysis with both the first order and the pseudo-second order reaction models, the kinetic parameters of cesium within the four columns were determined. In addition, by analyzing batch equilibrium data with both Freundlich and Langmuir isotherm models, associated sorption parameters were also generated. Comparisons of the models’ suitability for description of both kinetics and binding capacity of cesium were thus made, and the effects of pH and EC on the binding capacity were also studied.
1. Introduction
The radioactive component 137Cs having a long half-life (t1/2 = 30.17 years) is mainly formed as a by-product of processing of uranium fuels and has been considered as a major constituent of high level nuclear wastes in many countries around the world. Due to the Fukushima nuclear disaster occurred in March 2011, a considerable amount of 137Cs was released into the environment, and has since become a great concern for public health, safety, and environmental ecosystems. The treatment of the huge volume of water used in attempting to cool the reactors is also a task needs many years of hard works. The pollution of land areas by cesium is also very serious, which requires effective cleaning and treatment. For this, a better understanding of the existence and interactions of cesium with different types of land coverage in the polluted areas is important and feasible cleaning and treatment technologies are urgently needed.
Rivers and lakes used as drinking water sources in the concerned areas are also polluted by cesium. Right after the Fukushima nuclear disaster, over 10,000 Bq/kg of cesium was detected from the sludge of a Fukushima water purification plant, and different levels of cesium were even detected in either water treatment sludge or wastewater treatment sludge from areas far away from Fukushima. Regarding drinking water sources, the major sources of cesium can be considered as those associated with the catchments because frequent rainfall and snow melting can bring cesium from the catchments into rivers and lakes in both suspended and dissolved forms. Even if the original source of cesium is in a form of dry powder of cesium chloride, which is a common chemical form of radioactive cesium, the hygroscopic powder will quickly attract water if there is moisture in the air. In case of rain, cesium will dissolve in a large volume of water [1]. The cesium after entering rivers and lakes may reveal different behaviors according to the physicochemical features of water, such as sorption onto suspended particles and microbial organisms, and binding with dissolved organic and inorganic constituents. Particularly for relatively closed water bodies, such as lakes and dam reservoirs, the longer retention time may lead to a longer presence of cesium. In addition, the large quantity of sediment gradually formed in relatively closed water bodies may become a considerable sink tank for cesium. On the other hand, cesium in the sediment may release into the overlying water phase based on the equilibration between water and sediment. The extent of release may change over time due to changes in the physicochemical and biological features of the sediment. For instance, in early spring and winter, sufficient DO can reach the sediment phase, and at least makes the top layer of the sediment exist under aerobic condition; however in summer and early autumn, bacteria in both water phase and sediment phase consume DO readily, therefore even for the top layer of sediment, it turns into anaerobic condition. Concerning the behavior and fate of cesium in relatively closed water bodies, little is known [2]. To generate useful information for this, the kinetics and binding capacity of cesium onto sediment of closed water bodies should be systematically studied.
The main objectives of this study included two aspects: one was to estimate the kinetic parameters of cesium from water phase to sediment phase, and the other one was to estimate the binding potentials of cesium onto sediment particles. To achieve these objectives, column experiments were conducted using four columns packed with sediment from a reservoir in Fukushima that have been running for years under either aerobic or anaerobic conditions. Batch experiments allowing determination of the binding potentials with frozen-dried sediment particles from the same reservoir were also conducted.
2. Materials and Methods
2.1. Cesium Solutions
Since 133Cs has a similar adsorption behavior with 137Cs, non-radioactive cesium chloride was widely applied as a surrogate of the radioactive 137Cs. Anhydrous cesium chloride (CsCl, 99.0%) was purchased from Wako Pure Chemical Industries, Ltd. The stock solution of cesium was adjusted by dissolving CsCl into pure water and was stored in refrigerator prior to use.
2.2. Sediment Source and Characteristics
Sediment samples were collected along the flow direction within the Ushikubiri pre-reservoir, a natural prereservoir of the Miharu Dam located in the northeastern Fukushima prefecture, Japan, at two sampling sites: St. A (located in the downstream) and St. B (located in the midstream), which is just 100 m upstream of St. A (Figure 1). The pre-reservoir has a storage capacity of about 214,000 m3, an average water depth of 6.5 m and a hydraulic retention time of about 22 days; and is separated from the main Miharu Dam by an overflow weir. Under normal weather conditions, a small river stream, namely the Ushikubiri River, which has a yearly mean flow rate about 0.11 m3/sec, is the sole surface water source to this pre-reservoir.
As the main reservoir, Miharu Dam was constructed in 1998 and has an effective storage capacity of 36-million tons. In addition to functioning as a flood prevention countermeasure, the dam also serves as a major water
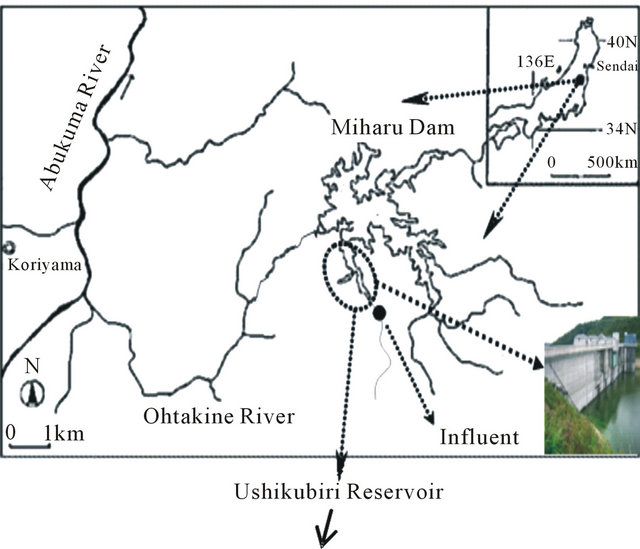
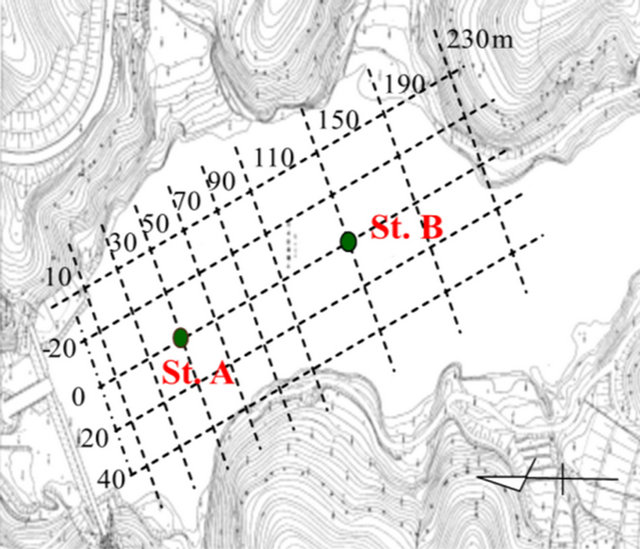
Figure 1. Location map of sampling sites for sediment in the Ushikubiri pre-reservoir of Miharu Dam.
source for irrigation and drinking water supplies within its associated basin area that extends for 226.4 km2. The land cover and usage information shows that about 60% of the total basin area is occupied by forest, with the remaining 40% in flatland being occupied by such categories as urban (with a total population of 34,000), agriculture (with a total area 41.9 km2) and stock raisings (with 360 heads of pigs and 7208 heads of cows).
The sediment collection was done using a gravity core sampler that enabled easy installation of sample cores, each having a diameter of 4 cm and a length of 50 cm. All collected core samples were transported to the laboratory using core containers. The basic physicochemical characteristics are summarized in Table 1. The particle size distribution of the sediment was determined using a Hybrid Particle Counter. Vertical distributions of water content, total organic carbon (total OC), total nitrogen (total N) and total phosphorus (total P) for all sliced sediment layers for the total depth of 30 cm of core samples are also measured. A large difference in the phys-
Table 1. Physicochemical characteristics of sediment mud.
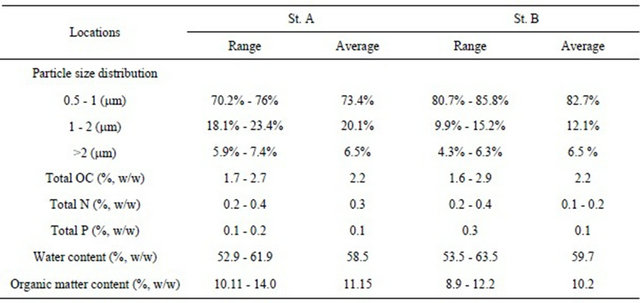
The range values show the differences along the vertical direction of sediment core.
icochemical features ofsediment between the two sites was not existent, with St. B having a relatively larger percentage for particles in the size range of 0.5 to 1 μm.
2.3. Sediment Columns and Experiments
Four columns consisted of 30 cm of sediment and 70 cm of overlying water, which were established originally for investigation of the behavior of estrogens and phosphorrus, were used for the purpose of this study. Two aerobic columns, referred to here as OC-A and OC-B, receiving not disturbed sediment from St. A and St. B respectively, were consistently supplied with wetted-air into the overlying water via air diffusers lowered to a level close to the sediment-water interface. By doing so, the system was maintained under any aerobic condition. On the other hand, two anaerobic columns with the configuretions identical to those of the aerobic columns, namely AC-A and AC-B, were also used. The anaerobic condition was maintained by consistently supplying wetted nitrogen (purity of 99.8%) to the overlying water through diffusers lowered to the level close to the sediment-water interface. Thus penetration of air to these two columns was fully prevented.
The column experiments by spiking cesium into the overlying phase of all four columns were conducted in a temperature controlled laboratory (20˚C). The column experiments setups are shown in Figure 2. Cesium was spiked into each column by adding a designated amount of its stock solution to the overlying water phase. Consistent supplying of either wetted-air or wetted-nitrogen ensured rapid and homogeneous distribution of the target element in the water phase of all columns. The time variance of pH, ORP and DO after replacement of the water in the columns with fresh water is displayed in Figure 3. The spiked initial concentration of cesium was
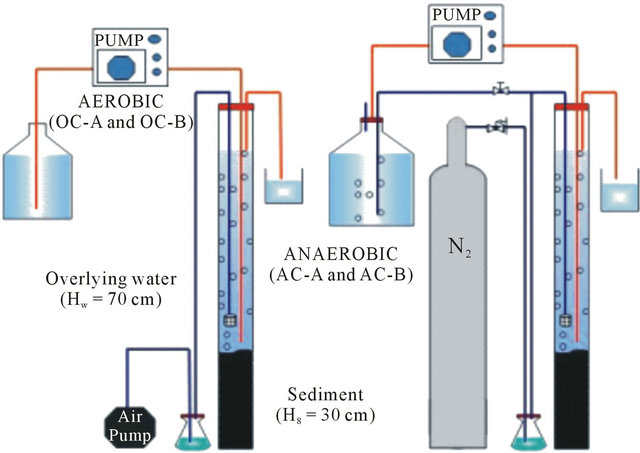
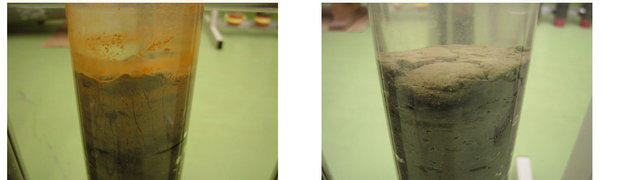
Figure 2. Sediment columns.
30 µg/L. From each sediment column, 10 ml of the overlying water sample was collected each time using a syringe. The collected samples were filtered through 0.45 µm PTFE filters. The obtained filtrate was then subjected to cesium quantification using ICP-MS (Agilent 7500 Series, Agilent). The instrument was calibrated by 0.05 and 0.1 µg/L Cs standard solutions before running samples. Each sample was analyzed for five times, and the average value was adopted. The relative standard deviation (RSD) of multiple measurements was less than 1.5% and in most cases, less than 1.0%.
2.4. Batch Adsorption Experiments
The soil sorption capacity was investigated in this study
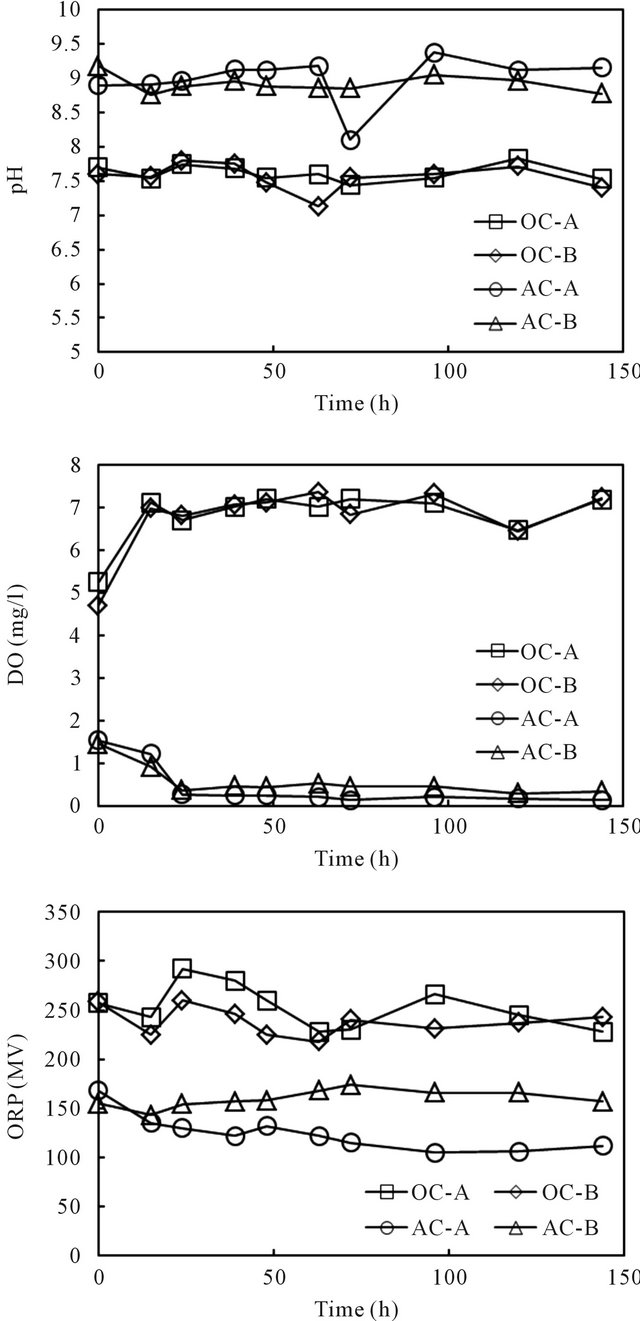
Figure 3. Vertical distributions of pH, DO and ORP in the overlying water of the sediment columns.
by batch method, for which the initial cesium concentration in the 100 ml plastic bottles was adjusted to 5, 10, 30, 50 and 100 µg/L. To each bottle, 0.1 g of frozen-dried sediment was added, followed by the addition of Nagara river water filtered by 0.2 µm membrane filters to make the sediment concentration at 1.0 g/L. Nagara river water was used because the general water quality indices were confirmed to be similar with those in the Ushikubiri reservoir where the sediment were sampled. To investigate the effects of pH and ionic strength on the binding capacity of cesium by sediment, batch experiments were conducted for nine different combinations of pH (5.0, 7.0, 9.0) and EC (130, 160, 190 µS/cm). The experiments were carried out at 20˚C for a contact time of 24 hours on a water bath shaker. Preliminary study confirmed that the contact time of 24 hours is sufficient for cesium to reach equilibration. After 24 hours, all the samples were centrifuged for 10 min at 3500 rpm, and the supernatants were then filtered through 0.45 µm PTFE filters. The obtained filtrates were then subjected to quantification by ICP-MS as mentioned earlier.
3. Results and Discussion
3.1. Sorption Rate Estimation
The cesium concentrations in the overlying water phase of all columns are shown in Figure 4. The result showed reductions of cesium concentrations in all 4 columns with the increases of time, with the reduction rate at the initial time period being significant. The initial fast reduction was probably due to higher driving force of sorption at higher concentrations.
Based on the initial concentration and the residual concentration in the water phase of each sampling time,
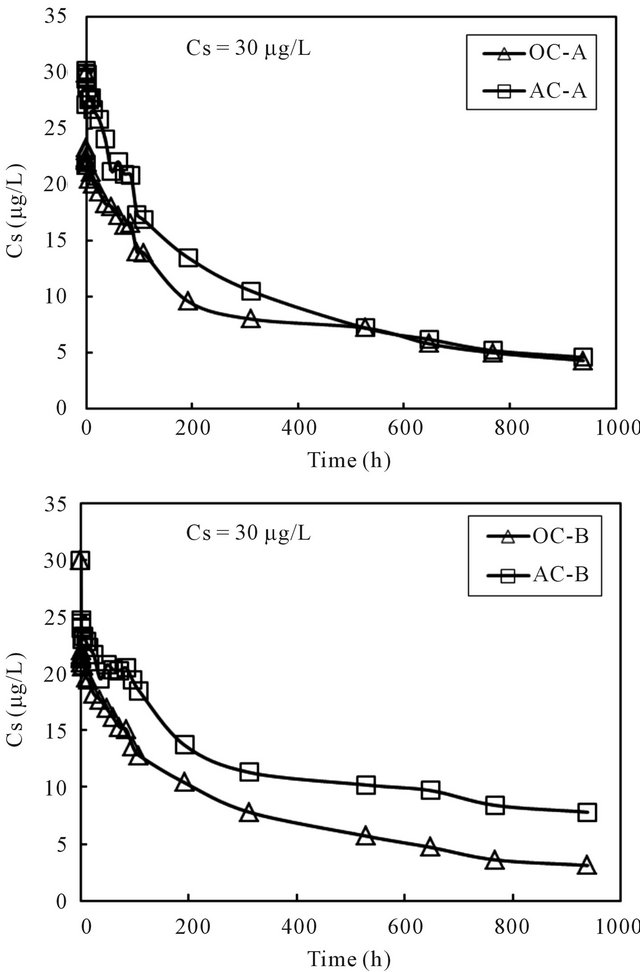
Figure 4. Changes of cesium concentration with time in the overlying water of sediment columns.
the sorption capacity to the sediment was computed using the mass balance equation. The generated time profiles of the sorption capacity to the sediment phase are displayed in Figure 5. For all four columns, the sorption capacity increased rapidly at the beginning and then reached nearly steady at the end of the running time for about 1000 hours. It was thus considered that the concentration of cesium in the overlying water phase has reached equilibration with the cesium concentration in the sediment phase within the running period. The last data point for each column was used as the equilibrium concentration of cesium in the column operation. Volchek et al. conducted sorption experiment of cesium onto cement, and reported that equilibration reached by about 300 hours [1]. The porous feature of cement mortar was considered as the reason that needed a longer reaction time.
Based on the observed sorption capacity profiles, kinetic analysis was performed. Two kinetic models, the first order reaction model and the pseudo-second order reaction model, as shown below, were used to compare their suitability to describe the behavior of cesium within the sediment columns, as did by others on sorption of cesium to solid materials [3-9].
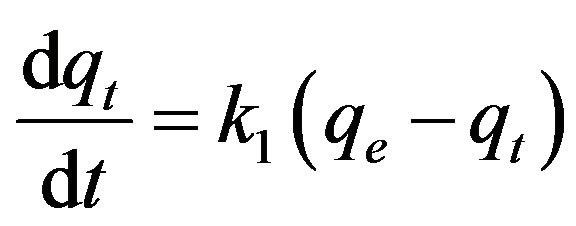 (1)
(1)
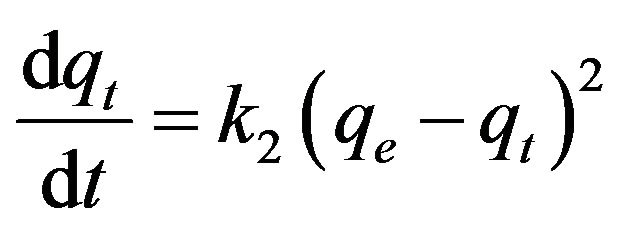 (2)
(2)
where t is time (h), qe is cesium concentration (µg/g) at equilibrium, and qt is the cesium concentration(µg/g) at time t. k1 and k2 are the first order and the pseudo-second order reaction constants (h−1 and g∙µg−1∙h−1), respectively.
By integrating Equations (1) and (2) over time t with the initial condition as qt = 0 at t = 0, the following linear equations can be obtained for the first order and the pseudo-second order models, respectively.
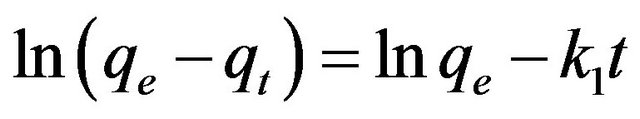 (3)
(3)
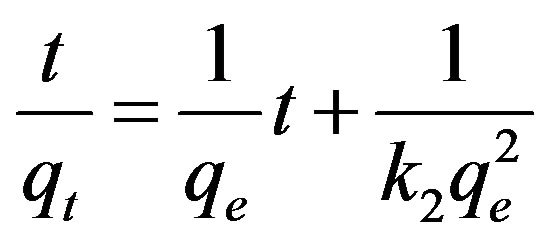 (4)
(4)
Equations (3) and (4) can be plotted as  vs. t and t/qt vs. t, respectively. A linear dependency would mean a good fit between experimental results and the model calculations. The result of model calculation with the first order reaction model is displayed in Figure 6 and that with the pseudo-second order reaction model is displayed in Figure 7.
Very high correlation coefficients, as could be seen from the figures, indicate that both models can fairly well describe the observations. Even so, it is better to point out that, compared to the first order reaction model that described the observations in the initial time period better than the later period, the second order reaction model described the later period better than the initial period. Wang et al. [10] and Tsai et al. [11] used the first order model to describe the adsorption of cesium on minerals such as laterite and granite. While Volchek, et al. [1], Bouzidi et al. [12], and Sheha and Metawally [2] reported that the pseudo-second order model fits well to the cement, soil and magnetite adsorption test.
The estimated values of kinetic parameters k1 and k2 are summarized in Table 2. For all 4 columns, the difference of estimated values was not apparent no matter
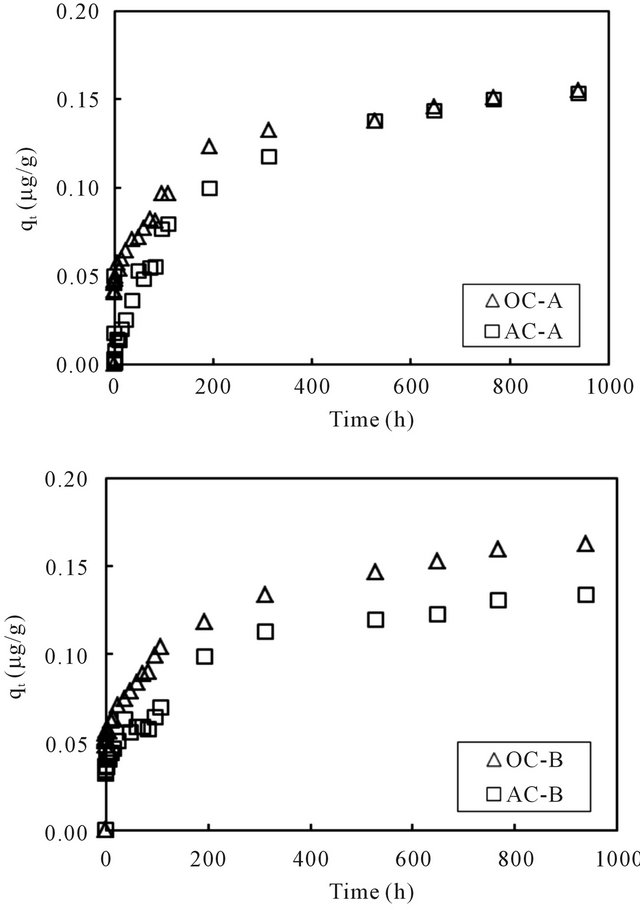
Figure 5. Changes of the sorption capacity of cesium with time in the overlying water of sediment columns.
Table 2. Estimated k1 and k2 values for cesium in sediment columns.
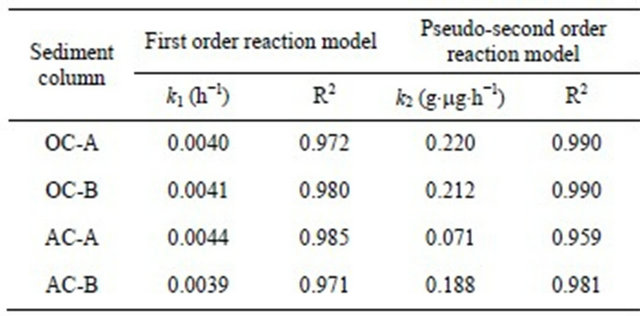
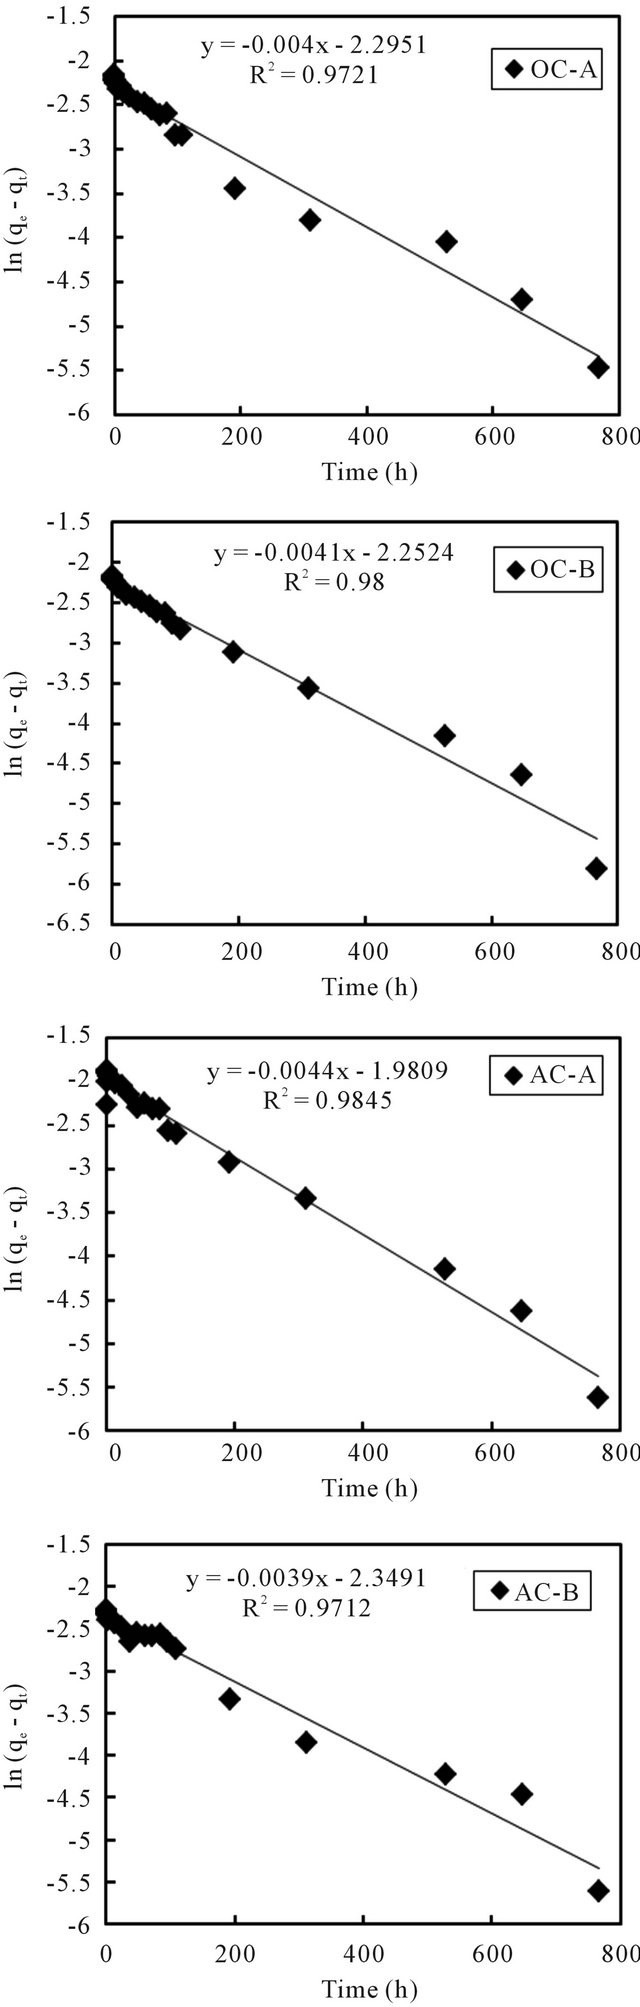
Figure 6. First order reaction model fit of data from sediment columns.
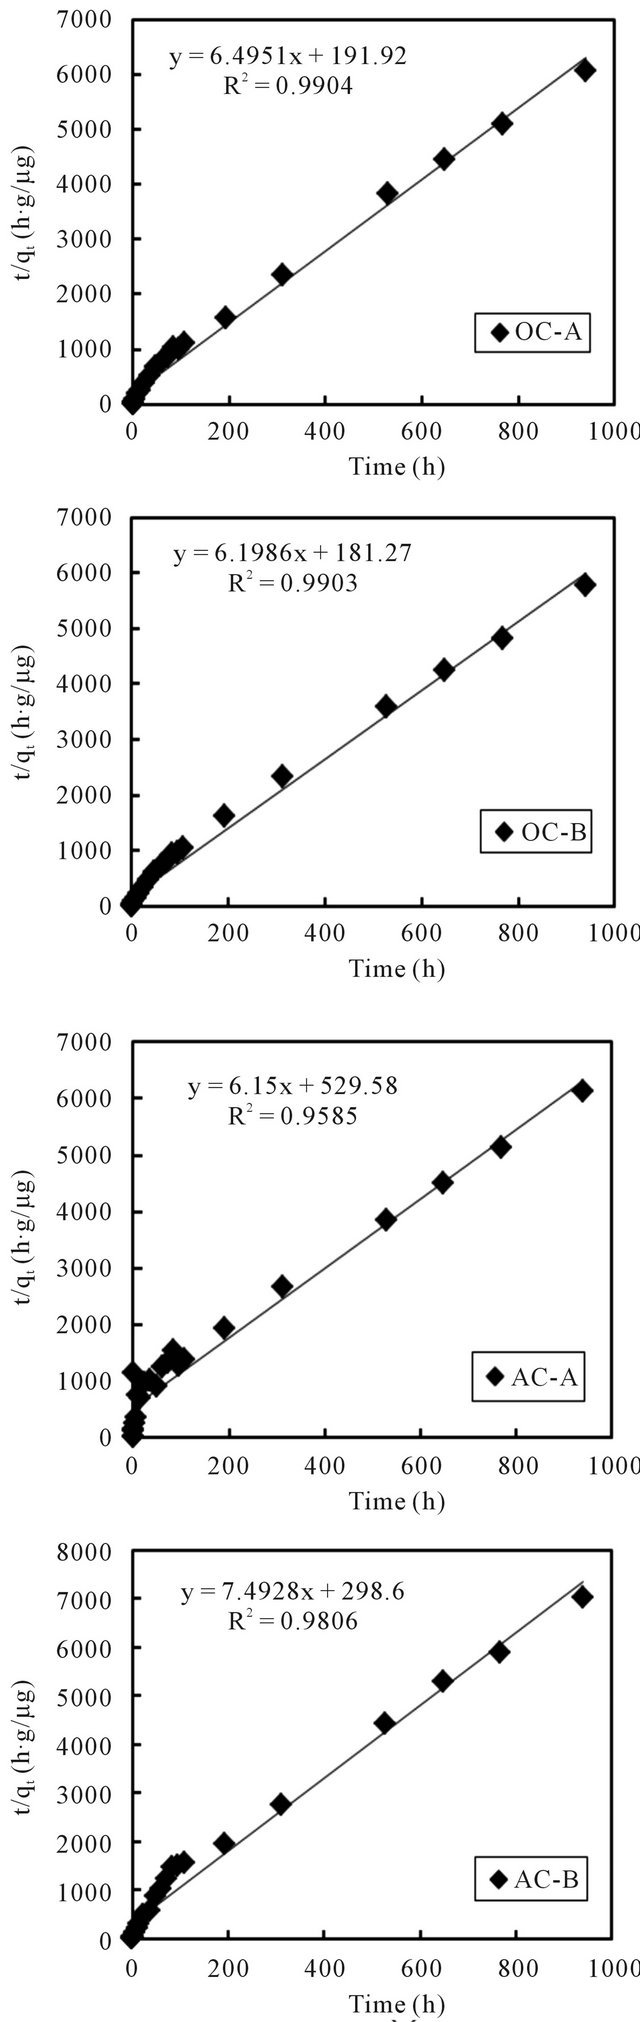
Figure 7. Pseudo-second order reaction model fit of data from sediment columns.
which model was applied. But, compared to the result of the first order reaction model, the second order reaction constants with the aerobic columns are slightly higher than those of the anaerobic columns. An exception was noticed for the AC-A column, whose k2 value was unexpectedly lower. The reason will be investigated in coming studies.
3.2. Binding Potentials of Cesium onto Sediment
The relationships between the amount of adsorbed cesium (qe) and its concentration in the solution (Ce) at equilibrium under pH 7 and different EC values are plotted in Figures 8 and 9 according to the well-used Lang-
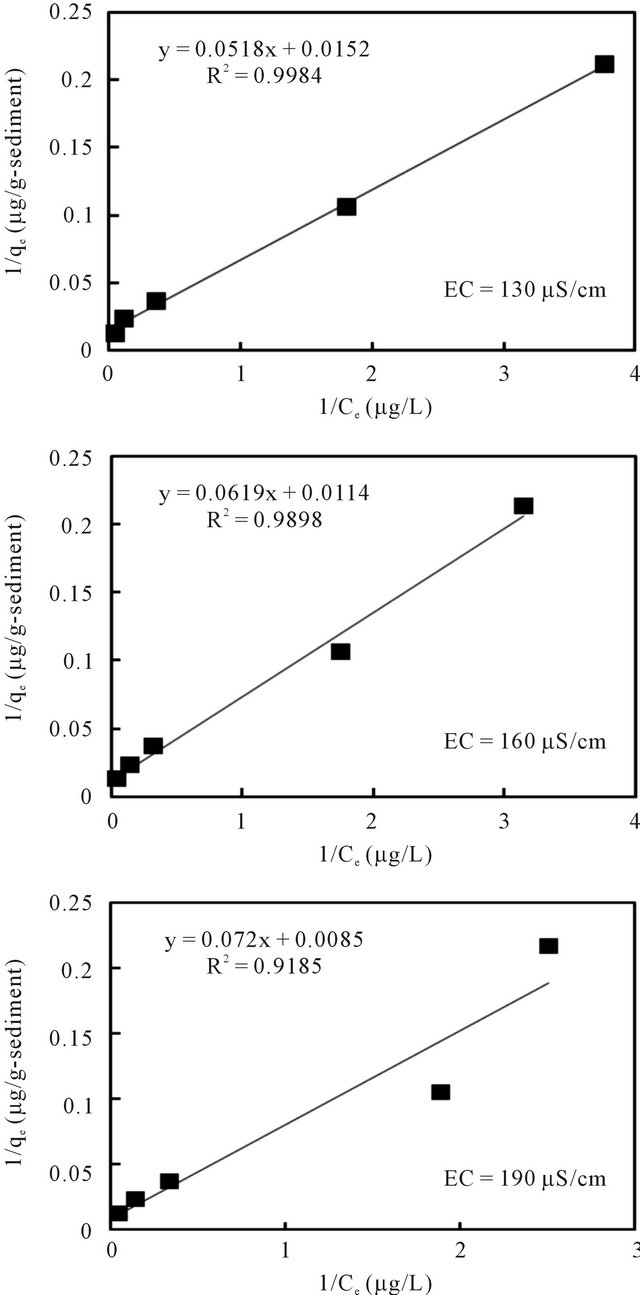
Figure 8. Langmuir isotherm model fit of batch experiment data at 20˚C and pH 7 with varied EC.
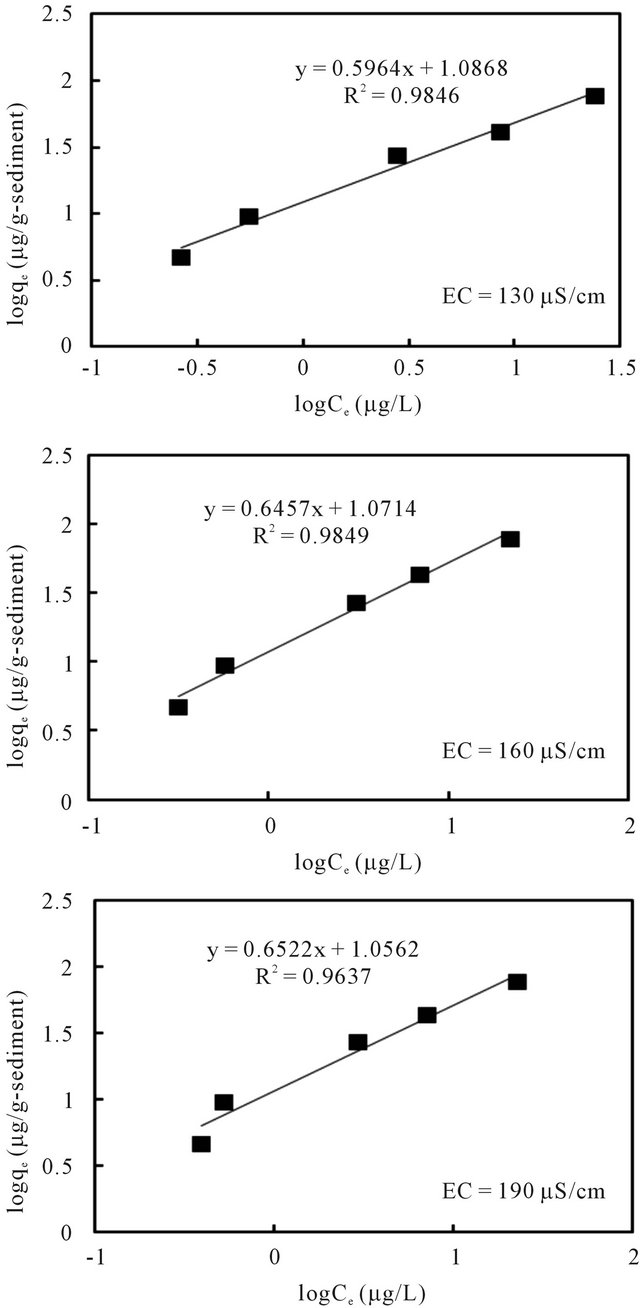
Figure 9. Freundlich isotherm model fit of batch experiment data at 20˚C and pH 7 with varied EC.
muir [13] and Freundlich models [14], respectively. The sorption parameters were then generated through linear analysis of the data with these two models. This was made in order to compare the fitness of both models.
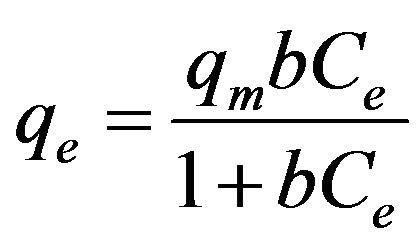 (5)
(5)
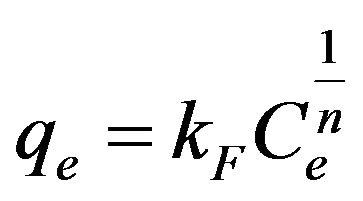 (6)
(6)
where b is the Langmuir constant and qm is the maximum saturation capacity; KF is the Freundlich constant and 1/n is the slope reflecting the affinity between the sorbent and adsorbate.
By linear approximation of the experimental data with the linear format of both models shown below, the parameters involved were generated.
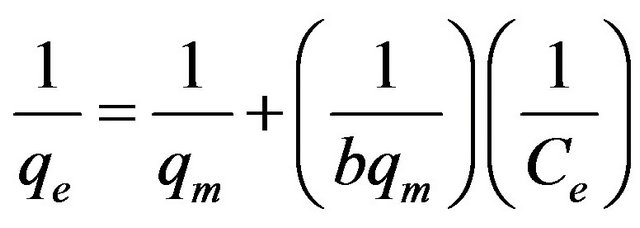 (7)
(7)
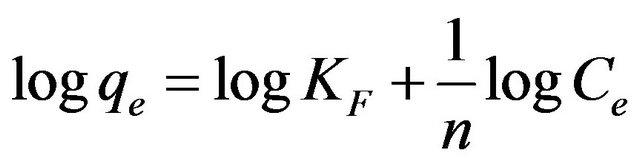 (8)
(8)
The linear analysis results are also displayed in Figures 8 and 9 as given by the solid lines. The estimated parameters are summarized in Table 3. From both Figures 8 and 9, we can see that, linear correlation coefficients are closed to be 1.0, with the coefficients with the Langmuir model being slightly higher. These results may imply that the sorption of the cesium ion onto sediment particles may take place due to both physical and chemical sorption, and double layer sorption might be possible because of the well description by Freundlich model. The sorption parameters revealed less significant difference, hence indicating that the pH variance in the examined range of 5 - 9 and the EC variance within the range of 130 - 190 μS/cm may not cause obvious effects on the binding capacity of cesium onto sediment particles. Data analysis based on the Herry equation was also conducted. But significant deviation of model calculations with observed data was confirmed for all experimental conditions.
Further study will be conducted to examine if some specific ions and larger polydisperse humic molecules coexisting in water affect the binding capacity due to competition.
4. Conclusion
The behavior of cesium in closed water bodies was investigated using sediment from a natural reservoir through column experiments and batch sorption experiments by focusing on comparisons of kinetic models and sorption capacity models. Both the first order and the pseudo-second order kinetic models could well describe the kinetics of cesium in sediment columns operated under both aerobic and anaerobic conditions. In addition, regarding the batch sorption studies, both the Freundlich model and the Langmuir model were found to be able to well describe the observed equilibration data. The generated equilibrium parameters showed that the effect of
Table 3. Parameters estimated by fitting batch experiment data with Langmuir and Freundlich models (20˚C).
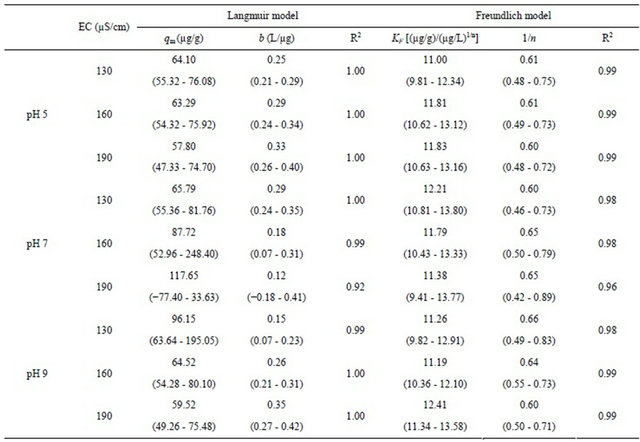
The range values in the parentheses represent the 95% confidence interval.
either pH or EC on the binding capability of cesium by sediment was less obvious in the respective ranges investigated in the study.
REFERENCES
- K. Volcheka, M. Y. Miah, W. Kuang, Z. DeMaleki and F. H. Tezel, “Adsorption of Cesium on Cement Mortar from Aqueous Solutions,” Journal of Hazardous Materials, Vol. 194, 2011, pp. 331-337. doi:10.1016/j.jhazmat.2011.07.111
- R. R. Sheha and E. Metwally, “Equilibrium Isotherm Modeling of Cesium Adsorption onto Magnetic Materials,” Journal of Hazardous Materials, Vol. 143, 2007, pp. 354- 361. doi:10.1016/j.jhazmat.2006.09.041
- S. Tsai, T. Wang, M. Li, Y. Wei and S. Teng, “Cesium Adsorption and Distribution onto Crushed Granite under Different Physicochemical Conditions,” Journal of Hazardous Materials, Vol. 161, 2009, pp. 854-861. doi:10.1016/j.jhazmat.2008.04.044
- A. K. Bhattacharya and C. Vekobachar, “Removal of Cadmium (II) by Low Cost Adsorbents,” Journal of Environmental Engineering, Vol. 110, No. 1, 1984, pp. 110- 122. doi:10.1061/(ASCE)0733-9372(1984)110:1(110)
- N. Roostai and F. H. Tezel, “Removal of Phenol from Aqueous Solutions by Adsorption,” Journal of Environmental Management, Vol. 70, No. 2, 2004, pp. 157-164. doi:10.1016/j.jenvman.2003.11.004
- N. Chiron, R. Guilet and E. Deydier, “Adsorption of Cu (II) and Pb(II) onto a Grafted Silica: Isotherms and Kinetic Models,” Water Research, Vol. 37, No. 13, 2003, pp. 3079-3086. doi:10.1016/S0043-1354(03)00156-8
- Y. S. Ho and A. E. Ofomaja, “Kinetic Studies of Copper Ion Adsorption on Palm Kernel Fiber,” Journal of Hazardous Materials, Vol. 137, No. 3, 2006, pp. 1796-1802. doi:10.1016/j.jhazmat.2006.05.023
- I. Nouri, I. Ghoudbane, O. Hamadaoui and M. Chiba, “Batch Sorption Dynamics and Equilibrium for the Removal of Cadmium Ions from Aqueous Phase Using Wheat Barn,” Journal of Hazardous Materials, Vol. 149, No. 1, 2007, pp. 115-125. doi:10.1016/j.jhazmat.2007.03.055
- N. Bektas, B. Akman and S. Kara, “Kinetic and Equilibrium Studies in Removing Lead Ions from Aqueous Solutions by Natural Sepiolite,” Journal of Hazardous Materials, Vol. 112, No. 1-2, 2004, pp. 115-122. doi:10.1016/j.jhazmat.2004.04.015
- T. H. Wang, M. H. Li, W. C. Yeh, Y. Y. Wei and S. P. Teng, “Removal of Cesium Ions from Aqueous Solution by Adsorption onto Local Taiwan Laterite,” Journal of Hazardous Materials, Vol. 160, No. 2-3, 2008, pp. 638- 642. doi:10.1016/j.jhazmat.2008.03.050
- S. Tsai, T. Wang, M. Li, Y. Wei and S. Teng, “Cesium Adsorption and Distribution onto Crushed Granite under Different Physicochemical Conditions,” Journal of Hazardous Materials, Vol. 161, No. 2-3, 2009, pp. 854-861. doi:10.1016/j.jhazmat.2008.04.044
- A. Bouzidi, F. Souahi and S. Hanini, “Sorption Behavior of Cesium on Aim Oussera Soil under Different Physicochemical Conditions,” Journal of Hazardous Materials, Vol. 184, No. 1-3, 2010, pp. 640-646. doi:10.1016/j.jhazmat.2010.08.084
- I. Langmuir, “The Adsorption of Gases on Plane Surfaces of Glass, Mica and Platinum,” Journal of the American Chemical Society, Vol. 40, No. 9, 1918, pp. 1361-1403. doi:10.1021/ja02242a004
- H. Freundlich, “Kapillarchemie,” Academishe Bibliotek, Leipzig, 1909.
NOTES
*Corresponding author.