Journal of Water Resource and Protection
Vol.4 No.9(2012), Article ID:22493,8 pages DOI:10.4236/jwarp.2012.49081
An Integrated Approach to Groundwater Exploration Using Remote Sensing and Geographic Information System
Faculty of Natural Resources and Environment, The Hashemite University, Zarqa, Jordan
Email: nezar@hu.edu.jo
Received July 8, 2012; revised August 10, 2012; accepted August 21, 2012
Keywords: Groundwater Exploration; Groundwater Potential Map; GIS; Sensitivity Analysis; Jordan
ABSTRACT
In this study, an integrated approach was implemented using Geographic Information System (GIS) and Remote Sensing technique for locating promising areas for groundwater exploration. This method is based evaluating a set of hydrological, geological and topographical parameters that influence the natural occurrence of groundwater. As a result, a ground water potential map (GPM) was generated by modeling these parameters. Groundwater potential map results were classified into three classes that describe the potentiality of each cell in the study area for groundwater exploration. These classes are; high, moderate and low groundwater potential area. It was found that about 7% of the study was classified as high potential areas which were found to be concentrated in the western part of the study area. About 79% of the study was classified as moderate potential for groundwater exploration. The rest of the study area (14%) was classified as low potential areas and concentrated in northeast and southeast part of the study area. These results were verified against existing well data and field observations. Furthermore, a sensitivity analysis was performed to study the effect of each parameter on the overall groundwater map using the effective weight and variation index. It was found that the slope parameter was the most effective among the five used parameters in the model.
1. Introduction
Jordan is one of the most water scarce countries in the world. Meeting water demand is challenge, and managing water resources is imperative (Ministry of Water and Irrigation [1]. Jordan is classified among a few countries of the world with limited water resources and it is one of the lowest on a per capita basis. About 94% of the country’s lands have arid to semi-arid climate with annual precipitation of less than 200 mm. The Problem of water scarcity is faced in all sectors particularly the agricultural sector. Agriculture in the highlands depends mainly on the limited groundwater resources which have been subjected to heavy abstraction and withdrawal in the last three decades. This has resulted in lowering the water table and deteriorating the water quality. According to Jordan’s Water Strategy for the years 2008 to 2022, the deficit in the available water resources was about 45% in 2005. And the projected deficit in 2022 is estimated around 30% assuming that additional sources of water are available [2]. The increase in water demand was observed as the population growth tended to continue. Water shortage is expected to increase from 204 MCM in the year 2000 to reach 408 MCM in the year 2020 [3].
Therefore, development of water resources is required to satisfy the increasing demand on water. Groundwater is considered as the major conventional water resource in Jordan. Aquifers contain hundreds of billions cubic meters of water distributed all over the country [4]. On average, groundwater contributes to more than 45% of the total water resources in Jordan [3]. Therefore, groundwater exploration requires an integrated work of geology, hydrogeology, hydrology and hydrochemistry studies besides some geophysical site investigation. These traditional methods of groundwater exploration consume time and money. Alternatively, Remote Sensing (RS) and Geographic Information System (GIS) tools can be used to detect areas with high potential for groundwater exploration [5,6].
The main advantages of using remote sensing and GIS techniques for groundwater exploration are the reduction of cost and time needed, the fast extraction of information on the occurrence of groundwater and the selection of promising areas for further groundwater exploration [7].
This study aims at assessing the potential sites for groundwater exploration in central parts of Jordan using GIS and Remote Sensing techniques.
Some researchers around the world have used GIS and remote sensing techniques for similar purpose. Reference [8] had analyzed the relationships between groundwater specific capacity (SPC) and its related hydrological factors to assess the sensitivity of each factor and map the regional groundwater potential for the area of Pohang City, Korea, using a geographic information system (GIS) and a probability model. Reference [9] had explored the groundwater availability for agriculture in the Musi basin. In their study, Remote sensing data and geographic information system were used to locate potential zones for groundwater. Based on hydro-geomorphological conditions, the groundwater availability of the basin was qualitatively classified into different classes (i.e., very good, good, moderate, poor and nil).
Reference [10] had developed a GIS based model to delineate groundwater exploration potential sites in WadiAraba. In this study, the groundwater occurrence was assessed based on a set of hydrological, geological and topographical parameters. Reference [11] had used panchromatic and multispectral images to infer lineaments and faults to identify the location of interconnected lineaments below buried pediment plains in the hard rock area for targeting sub-surface water resources.
2. Study Area
The study area is located in the central part of Jordan (Figure 1) which belongs to Mujib surface water basin—one of the major surface basins in Jordan (Figure 2). The total area of Mujib Basin is about 6600 km2. The topography of the study area varies in altitude from about 589 m (asl) in the western parts of the region, to 968m in the southwest of the study area.
The study area lies within the Mediterranean climatic region that is characterized by semi-arid to arid climate. An essential feature of this climate is receiving rainfall during the cool winter season (October-April) and having drought summer. Rainfall is demonstrably low, and occurs almost wholly in winter, sometimes as snow. In general, most of the study area receives less than 200 mm/y as long-term average rainfall [1]. There is a high diurnal temperature variation, moderately low winter temperatures, and moderately high summer temperatures are indicated. Evaporation is high, relative humidity generally low, and the wind may raises dust especially in winter and spring.
3. Geology of the Study Area
In the study area, the rock sequence is a succession of shallow marine deposits originally lying in the southern depressions of the Tethyanocean, and largely consisting of carbonates, which have been tectonically deformed

Figure 1. Location map of the study area.
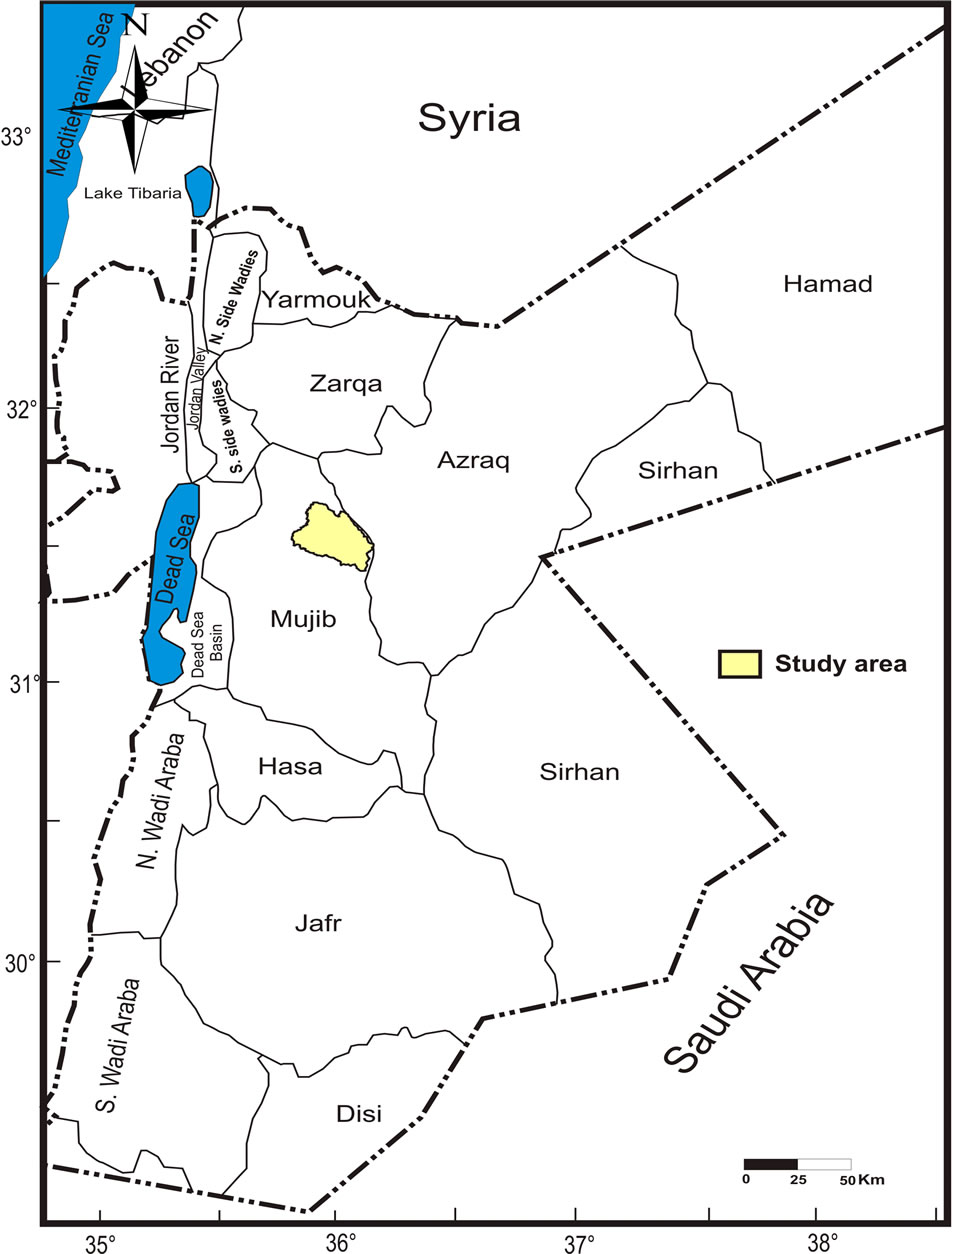
Figure 2. Surface water Basins in Jordan (MWI, 2010).
after regression of the sea at the end of the Paleocene, and later eroded by fluvial processes following uplift [12].
The exposed rocks in the area investigated are wholly sedimentary in origin, belonging to Belqa Group and range in age from Upper Cretaceous (Campanian) to Eocene. Superficial deposits which cover a large area of the study area are Pleistocene to Recent in age. The Upper Cretaceous (Campanian) Amman Silicified Limestone Formation (ASL) is the oldest rock unit exposed in the study area, occurring in a several small outcrops in the mountainous central area in the west-center of the study area [13]. Al HisaPhosphorite Formation (AHP) outcrops are restricted to the central and western part of the study area, where they lie within prominent domal structures. Al HisaPhosphorite Formation is overlain by the Muwaqqar Chalk-Marl Formation (MCM) outcropping in the south west and southern parts of the study area. The upper Paleocene to Eocene Um RijamChert Limestone Formation (URC) outcrops along the eastern and western part of the study area. This formation is the youngest in the study area (Figure 3).
4. Methodology
A groundwater potential model (GPM) was implemented based on a set of parameters that describe the natural occurrence of groundwater. This include; lineament length-
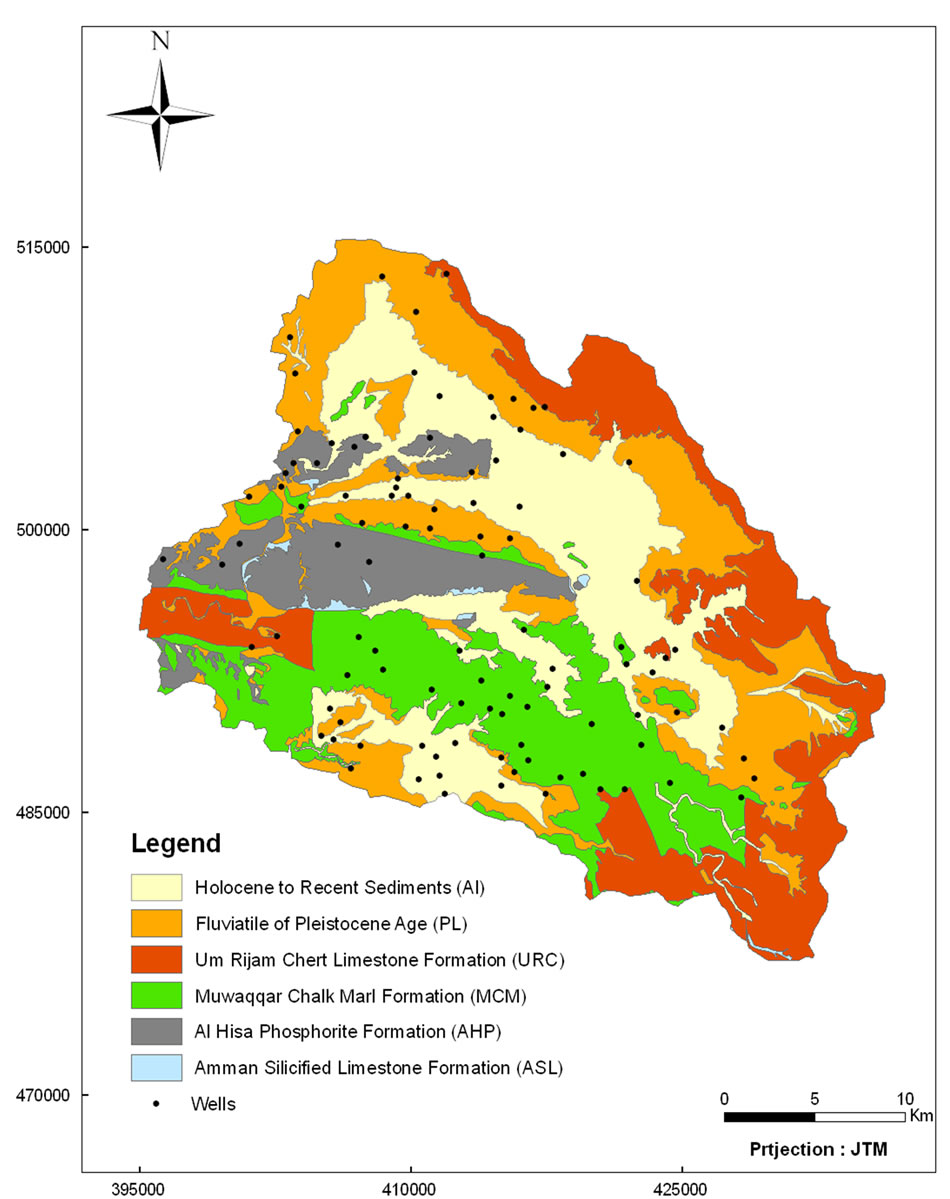
Figure 3. Geological map of the study area.
density, drainage length density, geological formations, elevation and slope steepness.
Lineament and drainage densities were extracted using a digital elevation model (DEM) and orthorectified Landsat 7 ETM+. DEM with spatial resolution of 90 m was obtained from NASA’s Shuttle Topography Radar Mission (STRM). The DEM was used to delineate sub-watershed boundary of the study area, derive slope and drainage network maps.
Landsat 7 ETM+ imagery covering the study area was obtained from Global Ortho-rectified Landsat data. Band 8 of this image which has a spatial resolution of 15 meter was used to extract lineament features in the study area using PCI Geomatica 9.1 software.
Geological maps with a scale 1:50,000 were obtained from Natural Resources Authority (NRA). Lineament and geological map were derived from digitizing the geological maps. These data sets were processed to have a uniform projection system (Jordan Transverse Mercator (JTM)) and stored in raster format for further analysis.
These data sets are going to be scored and weighted to describe their contribution in the natural occurrence of groundwater. Based on these parameters, weighted overlay model is going to be implemented to generate a map for groundwater potential (GPM). Results of GPM are going to be analyzed and classified. These results will be verified using existing well data and field observations. A sensitivity analysis will be performed to study the effect of each parameter on the overall groundwater map using the effective weight and variation index. Figure 4 shows the different stages and data flows for the adopted methodology in this study.
5. Groundwater Potential Model (GPM)
A GIS model was implemented using weighted overlay technique to derive the groundwater promising areas that
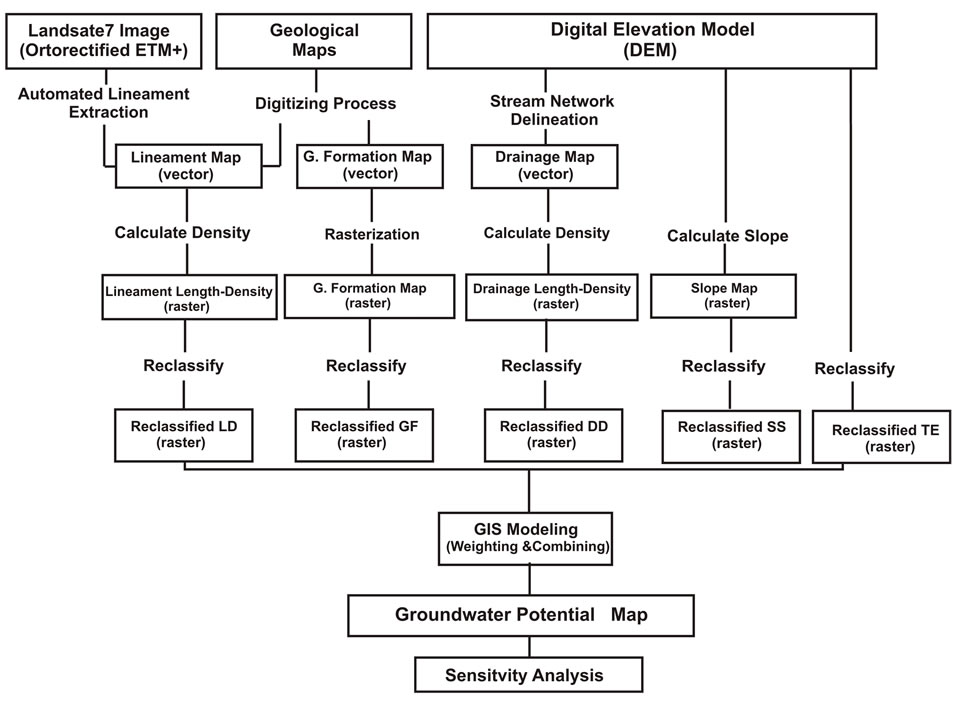
Figure 4. Flowchart for different inputs, outputs and processes during this study.
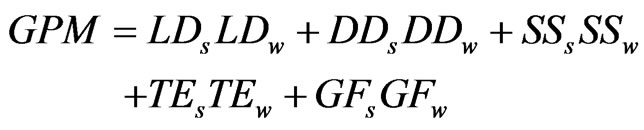
are suitable for exploration. Determination of the groundwater potential value for a given area involves multiplying each scale value of reclassified layer (parameter) by its weight (or percent influence). The resulting cell values are added to produce the final output raster that represent potential groundwater areas. Higher sum values represent a greater potential for groundwater. For a particular area being evaluated, each parameter classes were scaled on an evaluated scale according to their importance to other classes in the layer. The values were assigned in terms of their importance with respect to groundwater occurrences. Once each parameter has been assigned a scale value (suitable value) it is weighted. Weight values, from 1 to 100, express the relative importance of the parameter with respect to each other to groundwater occurrences. The formula of the GPM is shown below [14,15]:
 (1)
(1)
where w: Importance weight for the factor (1% - 100%)s: Scale value of area being evaluated (1 - 5)LD: Lineament length-densityDD: Drainage length-densityTE: Topography elevationSS: Slope steepnessGF: Geological formations.
This formula was modified by Musa et al., (2000) from DRASTIC model, which is used to assess ground water pollution vulnerability by Environmental Protection Agency of the United State of America. Table 1 shows the scaled values and weights assigned to different classes for different parameters each of these parameters was represented by a single GIS layer. These layers were manipulated spatial to produce the GPM map. Figure 5 shows these layers along with their scaled values based on Table 2.
6. Results and Discussion
Equation (1) was used to generate groundwater potential map as shown in Figure 6. GPM model results were reclassified to three classes; high, moderate and low groundwater potential area. It was found that about 7% of the study area was classified as high potential areas and concentrated in the western part of the study area. The high GPM high values at these areas are resulted from the high values of lineament densities and formation in these sites (Figure 5(a)). It is also noted that the scored values for elevation parameter are the highest in the western sites.
Furthermore, it was found that 79% of the study was classified as moderate potential areas. By referring to Figure 5(c), it will be noted that the elevation in these
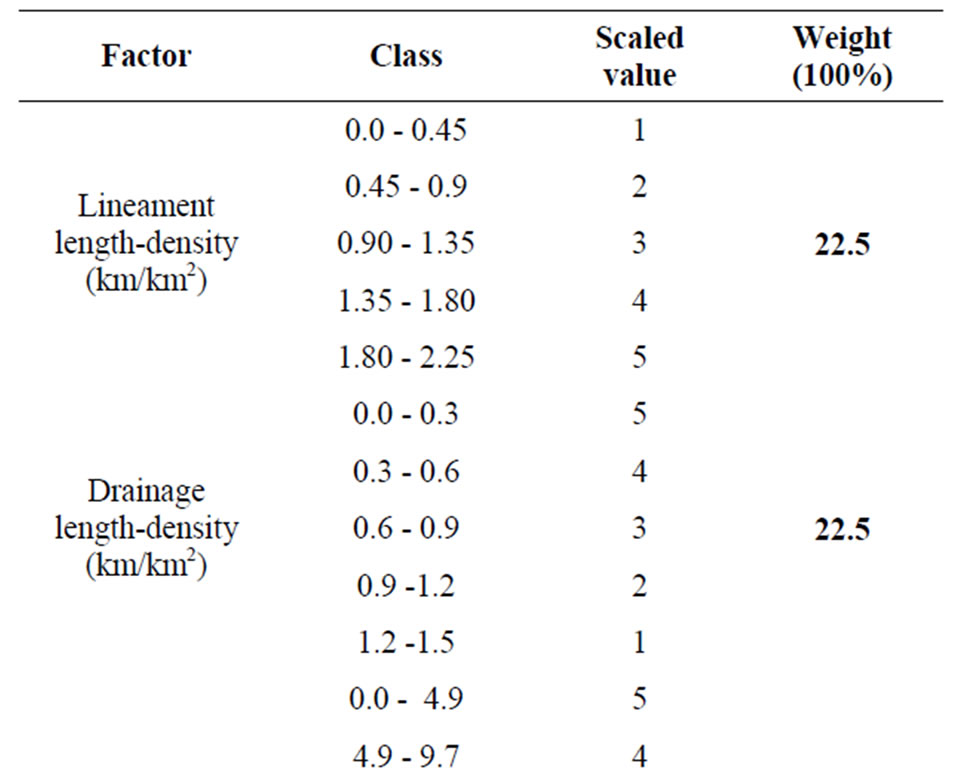
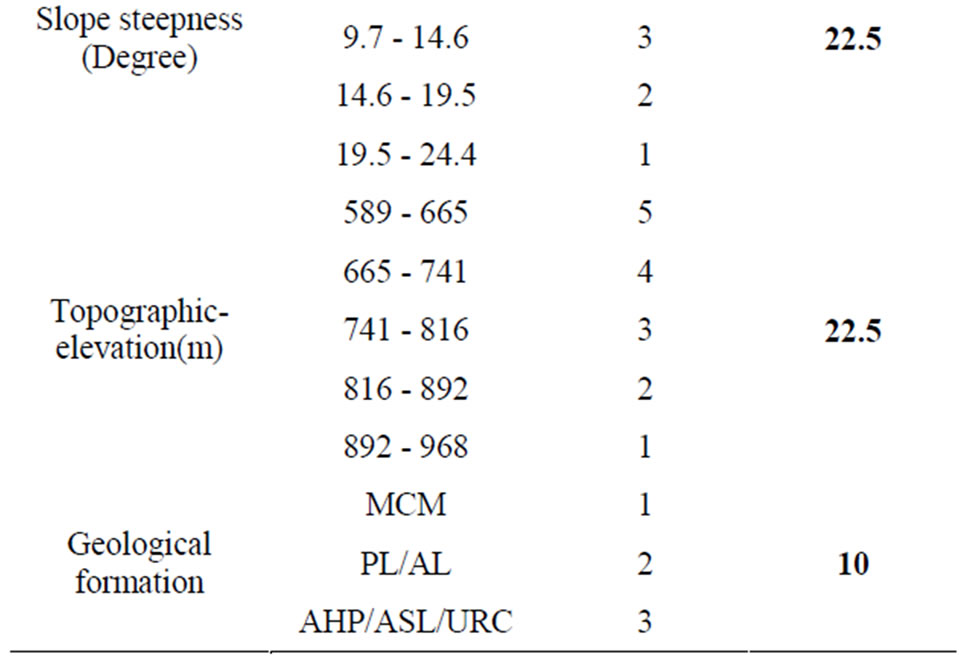
Table 1. Scaled values and weights assigned to different classes for different parameters.
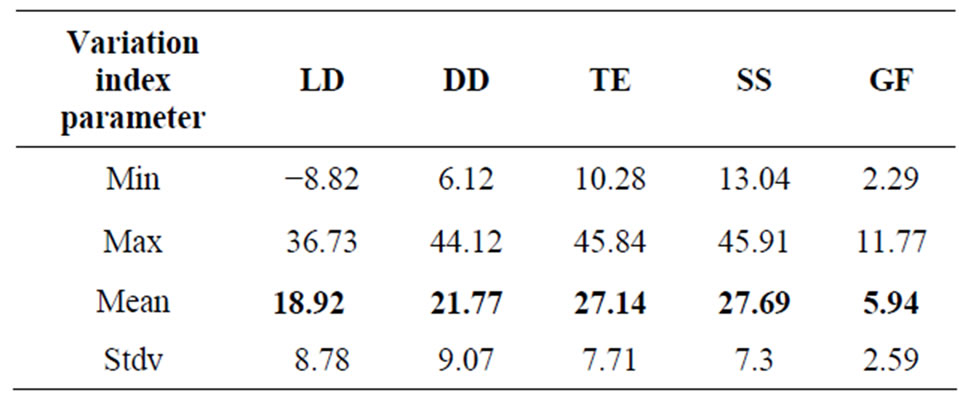
Table 2. Variation index of the excluded parameter.
area are ranging between 700 and 820. The scouring values of these elevation ranges will have a moderate value of 3 out of 5. The rest of the study area (14%) was classified as low potential areas and concentrated in north, northeast and southeast part of the study area. In these areas the elevation is relatively high (>800 m), and the lineaments density is the lowest among the rest of the study area.
7. Validation of the GPM
The results obtained from GPM where validated based
 (a)
(a)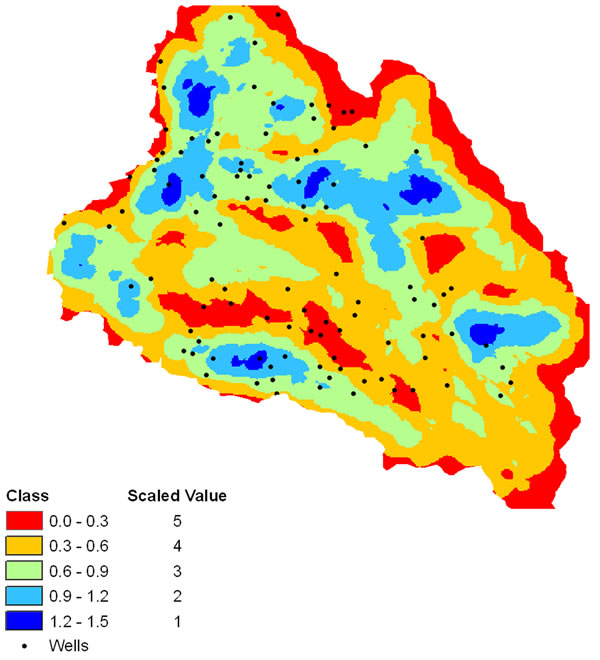 (b)
(b)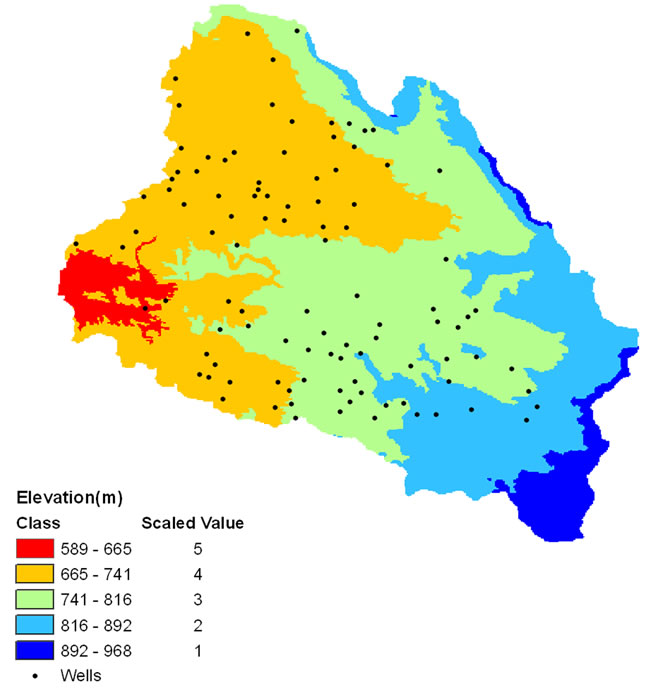 (c)
(c)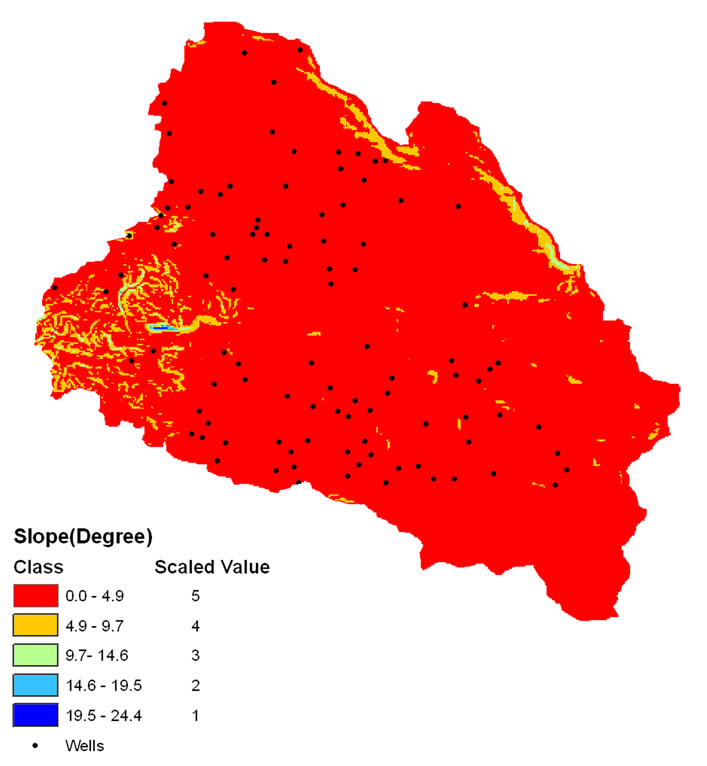 (d)
(d)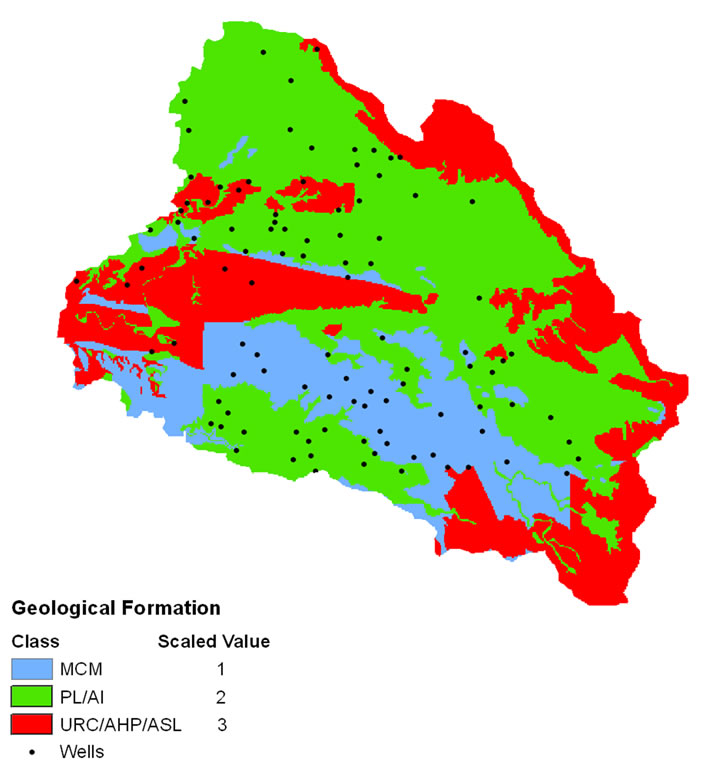 (e)
(e)
Figure 5. Spatial distribution of GPM parameters and their scaled values: (a) Lineaments density; (b) Drainage density; (c) elevation; (d) Slope; and (e) Geological formations.
on the following field observations and measurements. First, Water level measurements in the production wells that spread over the study area were used in constructing a groundwater level contour map using spatial analyst extension in ArcGIS (Figure 7). It can be seen from the map that the groundwater flows mainly toward the western part of the study area. This corresponds with the result of the GPM where the high potential of groundwater is concentrated in the western part of the study area. Second, the study area is located within the hydrogeological model of Central Jordan published by [16] (Figure 8). It can be seen from this model that most of groundwater flows mainly toward the west. Third, several production wells in the study area were tested for their yield. The average yield of production wells is 57.3 m3/hr [1,16].Wells data were used to derive yield map using Kriging method in Geostatistical Analyst extension in ArcGIS then reclassified into five classes. Figure 9 shows that the higher yield wells are concentrated or very close to the area of high groundwater potential areas. And Fourth, The production wells were used to describe the transmissivity of B2/A7 aquifer in the study area. These wells were used to derive transmissivity map using as shown in Figure 10. By referring to this figure, it will be noted that higher transmissivity wells are concentrated or very close to the area of high groundwater potential especially in the western part of the study area. The wide range in the transmissivity values may be related to karst features, including enlarged joints, caves and fault zones.
8. Sensitivity Analysis of GPM
Sensitivity analysis provides valuable information on the influence of scaled values and weights assigned to each parameter in a GPM. There carried out two sensitivity tests: the map removal sensitivity analysis and the single parameter sensitivity analysis. Similar analyses have been applied in the assessment of aquifer vulnerability [17].

Figure 6. Groundwater Potential Model (GPM) classes and their spatial distribution.
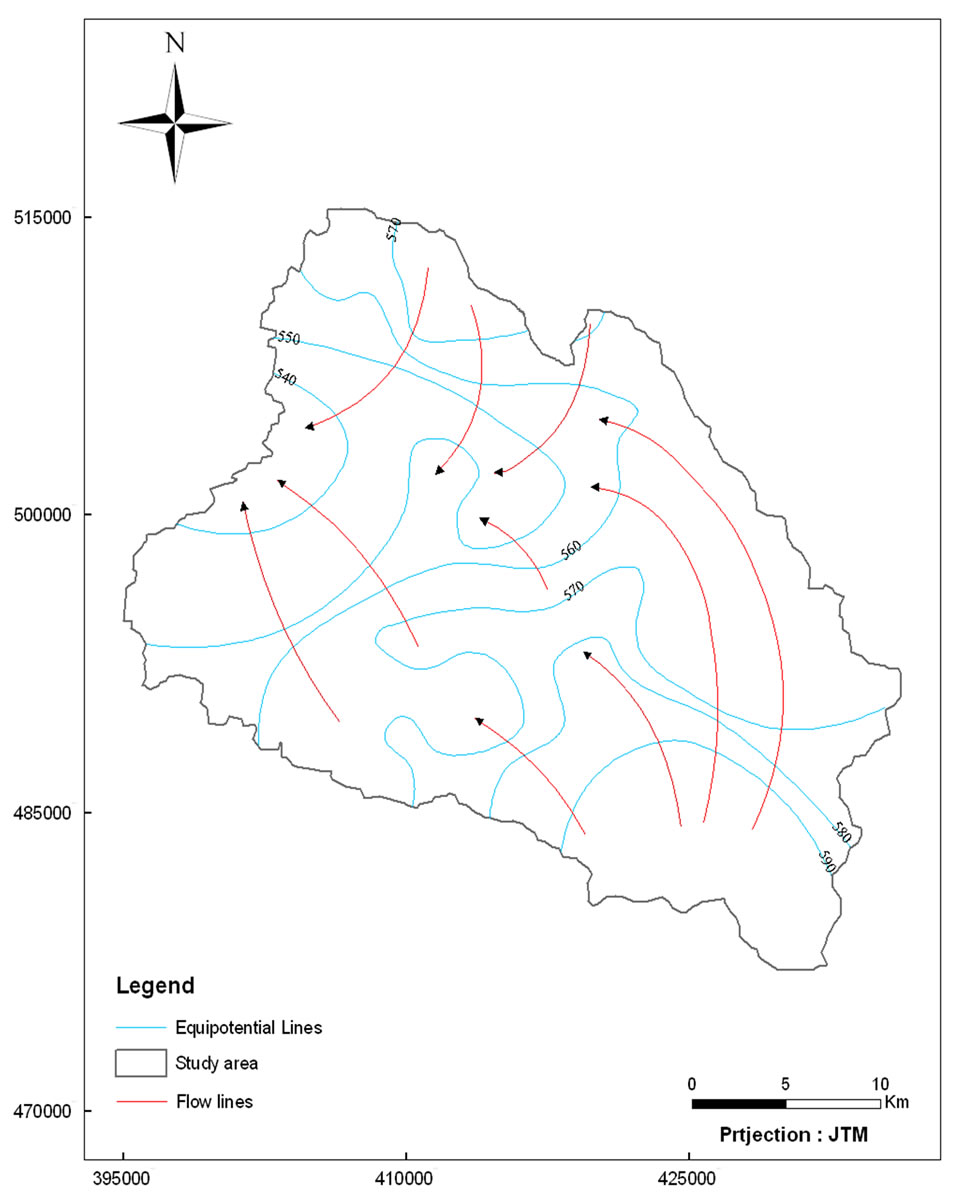
Figure 7. Groundwater level contour map based on water level measurements (Source of data MWI, 2006 and Sawarieh, 2005).
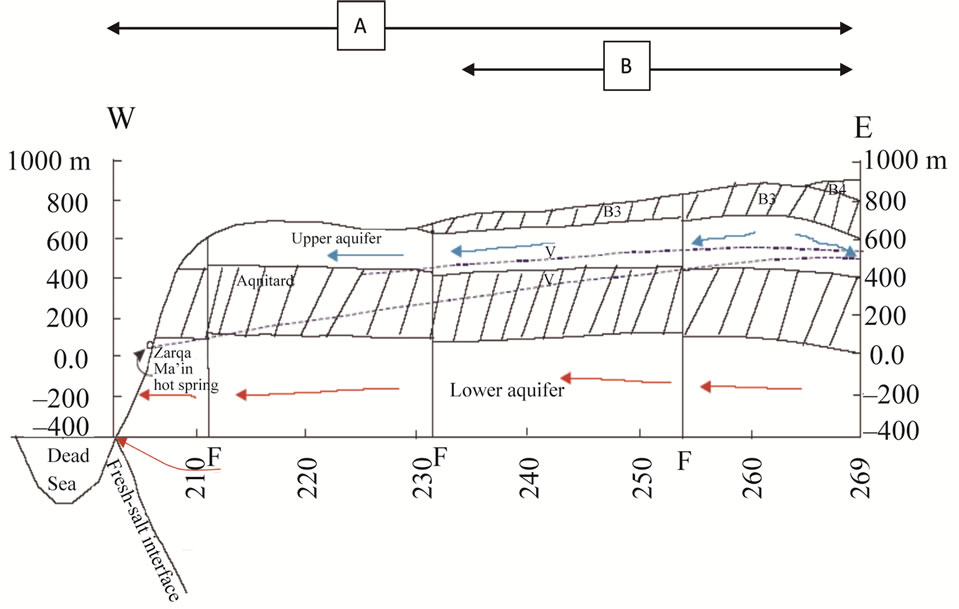
Figure 8. The conceptual hydrogeological model of central Jordan (after Sawrieh, 2005), A: Central of Jordan; B: study area.
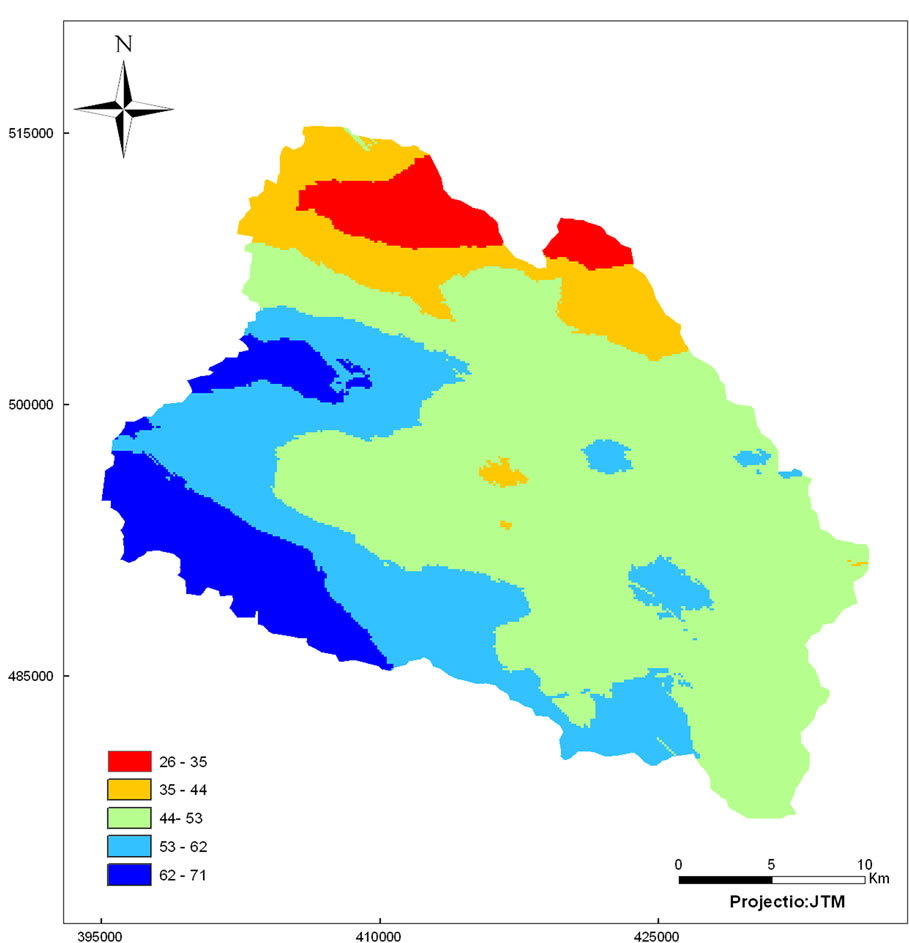
Figure 9. Yield map of the production wells in the study area.
The first test identifies the sensitivity of GPM by removing one parameter and is worked out using the following equation [17]:
 (2)
(2)
where V: The variation index.
P: Potential value computed using Equation (1) in each cell.
P': Represents the potential value of each cell excludeing the one parameter.
The single parameter sensitivity test was carried out to assess the influence of each of the five parameters of the GPM on the potential value. In this analysis real or “effective” weight of each parameter was compared with its
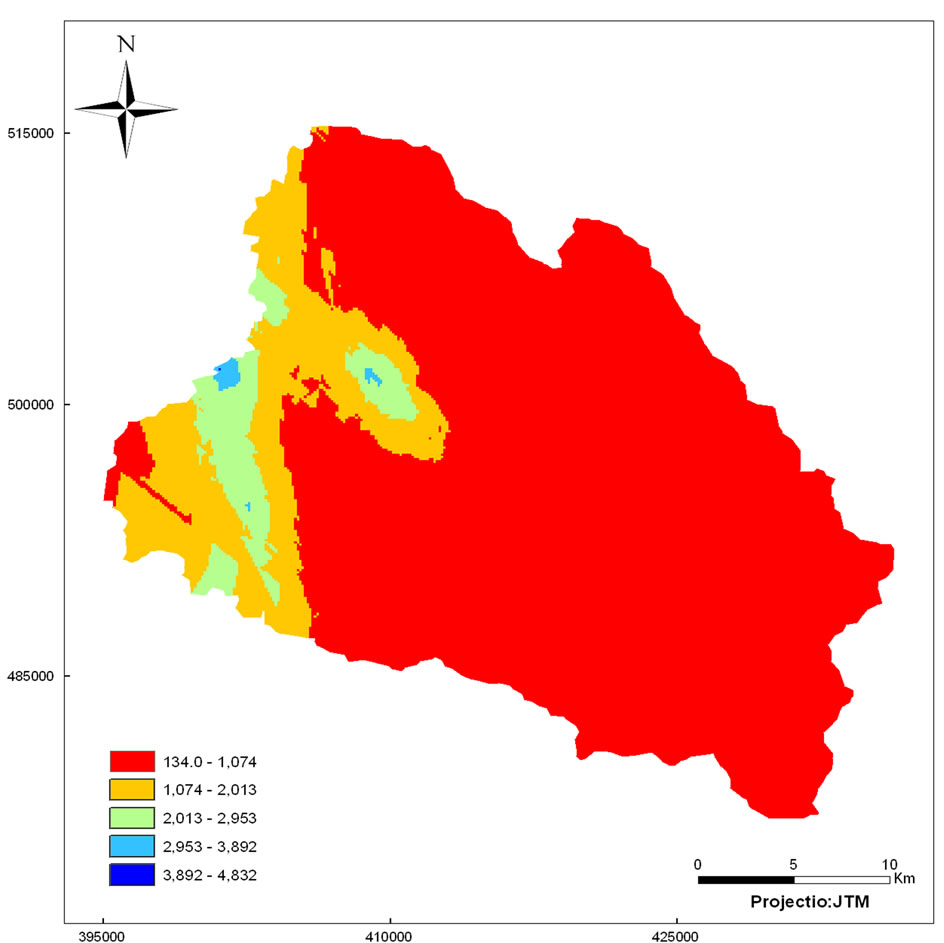
Figure 10. Transmissivity map (Transmissivity m2/d) of the production wells in the study area.
assigned or “theoretical” weight. The effective weight of a parameter in each cell was calculated by using following equation [18]:
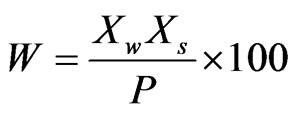 (3)
(3)
where w and s are, respectively, the weights and scaled values for the parameter X assigned in each cell, and P is the potential value as computed in Equation (1). For each cell, the sum parameter effective weights are 100% for the five parameters.
The variation index (V) for each GPM parameter is computed as shown in Table 2. This table shows that the GPM is sensitive to the removal of all parameters. Geological formation parameter shows the lowest variation index 5.94%.
Table 2 shows the statistics of the calculated effective weights or variability for each GPM parameters. As shown in this table, the effective weight for each parameter differs from the theoretical weight assigned by GPM. Geological formation parameter shows the lowest effective weight 5.86%. Therefore, theoretical weight of these parameters should be revised for computing the GPM. Effective weights of all parameter in Table 3 were used to derive groundwater potential zonation map (Figure 11).
9. Conclusions
The main objective of this paper is to use GIS and remote sensing technique for the assessment, evaluation and analysis of spatial distribution of ground water potential zones with in an area of approximately 900 km2. Ground-

Figure 11. Groundwater potential zonation map in the study area based on effective weights.
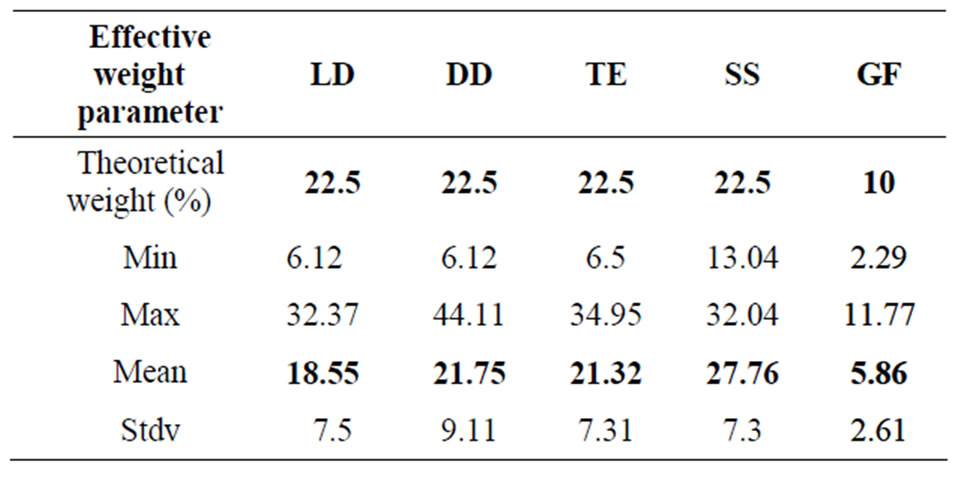
Table 3. Statistical analysis of the effective weight.
water potential map (GPM) has been produced using five thematic maps from satellites images, exiting data and field data. GPM map were compared and validated by existing discharge data obtained from different production wells spread in the study area. The results showed a significant correlation or agreement with the discharge data and the higher yield wells are concentrated or very close to the areas of high groundwater potential in the western part of the study area.
This study generally demonstrates that GIS and Remote sensing techniques in combination with field data could be used for the assessments of ground water potential zones in an area with little primary porosity and low bedrock hydraulic conductivity and where hydrogeological properties are mainly determined by secondary factors fracture zones and associated weathering. It can be considered as a time and cost-effective tool for delineations and identification of high ground water potential target area.
Based on the GPM model results, about 7% of the study area was classified as high potential areas and concentrated in the western part of the study area; about 79% of the study was classified as moderate potential areas and the rest of the study area (14%) was classified as low potential areas and concentrated in north, northeast and southeast part of the study area.
Based on the results revealed from sensitivity analysis, the effective weights for each parameter are sometimes different from the theoretical weights assigned by the GPM, which mean that the theoretical weight of this parameter should be revised for computing the GPM.
10. Acknowledgements
This work was part of the third author master thesis at the Hashemite University, Jordan.
REFERENCES
- MWI (Ministry of Water and Irrigation, Jordan), 2010. http://www.mwi.gov.jo/mwi/homepage.aspx
- MWI (Ministry of Water and Irrigation), “Water for Life: Jordan’s Water Strategy 2008-2022,” Amman, 2009.
- AARC (Al-Urdun Al-jaded Research Center), “The State of Environment in Jordan,” Annual Report, 2001.
- E. Salameh and H. Bannayan, “Water Resources in Jordan, Present Status and Future Potentials,” Friedrich Ebert Steftung, Amman, 1993.
- Ph. Duatartre, J. M. Coudert and G. Delpont, “Evolution in the Use of Satellite Data for the Location and Development of Groundwater,” Advances in Space Research, Vol. 13, No. 5, 1993, pp. 187-195.
- R. M. Teeuw, “Groundwater Exploration Using Remote Sensing and a Low-Cost Geographical Information System,” Hydrogeology Journal, Vol. 3, No. 3, 1995, pp. 21-30. doi:10.1007/s100400050057
- B. Chandhary, B. Kumar, K. Saroha, G. Yadar, M. Singh, A. Sharma, M. Pandey and P. Singh, “Integrated Groundwater Resources Mapping in Gurgoan District (Haryana) India, Using Remote Sensing and GIS Techniques,” 2001. www.gisdevelopment.net/aars/acrs/2002/ts2/water0002pf.htm
- H.-J. Oh, Y.-S. Kim, J.-K. Choi, E. Park and S. Lee, “GIS Mapping of Regional Probabilistic Groundwater Potential in the Area of Pohang City, Korea,” Journal of Hydrology, Vol. 399, 2011, pp. 158-172. doi:10.1016/j.jhydrol.2010.12.027
- S. Ganapuram, G. T. Vijaya Kumar, M. Krishna, E. Kahya and M. Cüneyd Demirel, “Mapping of Groundwater Potential Zones in the Musi Basin Using Remote Sensing Data and GIS,” Advances in Engineering Software, Vol. 40, No. 7, 2009, pp. 506-518. doi:10.1016/j.advengsoft.2008.10.001
- A. El-Naqa, N. Hammouri, K. Ibrahim and M. El-Taj, “Integrated Approach for Groundwater Exploration in WadiAraba Using Remote Sensing and GIS,” Jordan Journal of Civil Engineering, Vol. 3, No. 3, 2009.
- S. Mukherjee, “Role of Satellite Sensors in Groundwater Exploration,” Sensors, Vol. 8, No. 3, 2008, pp. 2006- 2016. doi:10.3390/s8032006
- D. Jaser, “The Geology of Khan EzZabib Area,” Bulletin 3, Geology Directorate, Natural Resources Authority, Amman, 1986.
- NRA (Natural Resources Authority), “Khan EzZabib Map Sheet 3253 III Scale 1:50000,” Bulletin 3, NRA, National Geological Mapping Project, Amman, 1986.
- K. A. Musa, A. Juhari Mat and I. Abdullah, “Groundwater Prediction Potential Zone in Langat Basin Using the Integration of Remote Sensing and GIS,” The 21st Asian Conference on Remote Sensing, Taipei, 4-8 December 2000.
- A. Sener, A. Davraz and M. Ozcelik, “An Integration of GIS and Remote Sensing in Groundwater Investigations: A Case Study in Burdur, Turkey,” Hydrogeology Journal, Vol. 13, No. 5-6, 2005, pp. 826-834. doi:10.1007/s10040-004-0378-5
- Sawarieh, “Heat Sources of the Groundwater in the Zara-ZarqaMa’in-Jiza Area, Central Jordan,” Ph.D. Thesis, University of Karlsruhe, 2005.
- R. C. Gogu and A. Dassargues, “Sensitivity Analysis for the EPIK Method of Vulnerability Assessment in a Small Karstic Aquifer, Southern Belgium,” Hydrogeology Journal, Vol. 8, No. 3, 2000, pp. 337-345.
- P. Napolitano and A. G. Fabbri, “Single Parameter Sensitivity Analysis for Aquifer Vulnerability Assessment Using DRASTIC and SINTACS,” Proceedings of the 2nd HydroGIS Conference: International Association of Hydrological Sciences, IAHS Publication 235, 1996, pp. 559-566.