Journal of Water Resource and Protection
Vol.4 No.6(2012), Article ID:19893,8 pages DOI:10.4236/jwarp.2012.46037
Evaluating Subdivisions for Identifying Extraneous Flow in Separate Sanitary Sewer Systems
1Bloomington & Normal Water Reclamation District, Bloomington, USA
2Department of Geography-Geology, Illinois State University, Normal, USA
Email: alanning@bnwrd.org, ewpeter@ilstu.edu
Received March 29, 2012; revised April 29, 2012; accepted May 27, 2012
Keywords: Sanitary Sewers; Inflow; Infiltration; Modeling
ABSTRACT
Separate sanitary sewer systems are designed to convey sewage waste from municipal areas to a central treatment facility; they are not designed to handle water associated with precipitation events. However, intercept of groundwater (infiltration) and of flows through manholes or unauthorized connections (inflows) introduces rainwater into the sanitary sewer system. Infiltration/Inflow (I/I) increases the costs associated with treatment and can create additional environmental problems. Identifying and quantifying the volume I/I can be complicated and costly. A simple quantitative method was developed to quantify the extent of I/I occurring in sewer sheds. The method uses measured sewer flows, water usage, precipitation values, and land cover data to calculate the volume of extraneous flows. To assess its utility, the method was used to compare two urban sewer sheds, Holiday Knolls and Eagle View. Both sewer sheds showed evidence of I/I in excess of 200 gallons per day per inch-mile of sewer pipe (gpd/in-mile). Holiday Knolls, the older subdivision had an average I/I of 1912 gpd/in-mile, while Eagle View had an average of 1143 gpd/in-mile. The developed method provided simple means to calculate I/I and to identify sewer sheds in need of repair.
1. Introduction
Sanitary sewerage systems are typically constructed of multiple pipes connected together to form a network of sewers conveying wastewater to a centralized treatment facility. A storm sewer normally conveys rainwater to a water body rather than a wastewater treatment plant. Some systems are combined sanitary and storm sewers in which rainwater that falls onto a street is conveyed to the sanitary sewer rather than a separate storm sewer. The limited design of separate sanitary sewerage makes it illequipped to handle non-wastewater; however, one common problem separate sanitary sewage systems face is that they typically intercept rainwater or ground water (inflow/infiltration) into the pipe [1].
Infiltration refers to extraneous waters that enter the sewer system from the surrounding soil [1,2]. During wet weather conditions, elevated groundwater levels can be relieved as the water slowly leaks into the sewer [3]. Metcalf & Eddy INC. [4] calculated that infiltration can account for 100 to 10,000 gallons per day per inch of pipe diameter along one mile of pipe (gpd/in pipe diameter/mile length) and increases proportionally with the age of the sewer.
Inflow is excess water that enters the system from above ground sources such as flow into systems through leaky manholes, leaky storm sewers, or from unauthorized household drains, e.g., roof, cellar, or foundation collections, connected to sanitary sewers [1,2]. Ellis [3] estimates that household connections may contribute as much as 30% - 40% of the total inflow to a sewer system. Collectively, inflow/infiltration (I/I) is considered extraneous flow, water that does not originate from what would normally enter the sanitary sewer from households, industry, or commercial business.
Consequently, the non-contaminated, inflow/infiltration (I/I), water leaking into a pipe will flow to the treatment plant where it must be pumped and treated in the same manner as raw sewage. I/I can increase the volume of water needing treatment up to 400% [3]. The source of additional water is typically groundwater or rainwater, and there is no need to move and to treat the water [5]. However, the excess water increases the operation and treatment costs [6,7], and mediation over the next 20 years is estimated to cost $164 billion [1]. Additionally, efficiency of treatment facilities decrease with elevated I/I, and in extreme instances can result in backflooding of sanitation sewers into streets and private properties or in untreated wastewater being discharged to the environment [2].
Identifying and delineating I/I can aid in locating and fixing the major sources of extraneous flow into a sewer system. Attempts to quantify the amount and to identify the source of I/I have been made, but identifying sources is very complex and can require a tremendous amount of data to accurately quantify.
The objective of this study is to develop a simplified method of quantifying the amount of extraneous flow that results from either groundwater (infiltration) or storm water (inflow) so that any maintenance efforts can be focused on smaller more leaky parts of a system. This method is used to examine two sewer sheds in an urban area to illustrate utility of the method in evaluating potential problems.
A common method of analyzing sewage hydrographs is to simply look at the magnitude of the flow spike. The problem with examining and comparing flow spikes is that flow data from a certain location may represent larger areas or a higher density sewer system than another location. Temporal considerations should be a factor in analyses since groundwater conditions change seasonally and will impact the amount of infiltration that occurs [7].
The presented method breaks down individual subdivisions by characterizing them according to the impermeable area to better delineate flow spikes associated with surface runoff of storm water. Secondly, the length and diameter (in-mile) of sewers is used in the analyses to account for sewer density in the subdivision. Sewer density must be accounted for since the greater the density of sewers in a unit area, the greater the potential for ground water/storm water to come into contact with the pipes. Considering these two issues should present a more representative approach to analyzing sewer flow hydrographs. All issues such as hydrology, topography, soil types, groundwater, and rainfall intensity/duration should be properly accounted for by examining multiple sewer sheds simultaneously and using this analysis method.
2. Study Site Overview
The study focuses upon two subdivisions in Bloomington, Illinois, a twin city of Normal, Illinois that jointly make up a metropolitan area of 125,000. The two separate subdivisions, Holiday Knolls and Eagle View, reside on the east side of Bloomington (Figure 1). For both subdivisions, there are separate sanitary sewers and storm sewers, meaning that all sewage is conveyed separately from any street runoff that would originate from precipitation. In theory, no rainwater should enter the sanitary sewers; thus, there should be no increase in sanitary sewage flow during or following a precipitation event.

Figure 1. Overview map of Bloomington-Normal showing location of precipitation gauge, Eagle View and Holiday Knolls subdivisions.
In reality, the sanitary sewer system leaks, this is legally allowed. Illinois Administrative Code Title 35, Section 370.320 states that upon installation, 200 gal/inmile per day may leak in a sanitary sewer. The term “gal/ in-mile” is the number of gallons flowing through a section of pipe defined as inside diameter of pipe multiplied by the length of section. Simply stated, 200 gallons of extraneous water per day (gpd) can legally leak upon installation through 1 mile of 1 inch inside diameter pipe.
Holiday Knolls and Eagle View subdivisions were selected for analysis based on their size, age, and sewer characteristics. For each subdivision, the total area, paved area, base flow of sewage in the system and length (inmiles) of public sewers were identified to differentiate the subdivisions (Table 1). While the two subdivisions are similar, Holiday Knolls subdivision is 3.3% larger and contains more paved area than Eagle View. Impermeable surfaces that drain directly to the storm sewers were classified as paved areas. Roofs of structures were not classified as paved areas as the gutter systems drain to open ground where water infiltrates into the subsurface. The Holiday Knolls subdivision has 6% more sewer pipe than Eagle View. The significant difference is that Holiday Knolls is approximately 30 years older than Eagle View.
The Holiday Knolls subdivision constructed in the 1960s is primarily single family residential with limited commercial business. The point of discharge for the outlet sewer where sewage flow was measured is 865 ft. above sea level and located in the northwest section of the sewer shed. The region is typical for subdivisions in the Bloomington area in regards to home size, roadways, and sidewalks.
Constructed in the 1990s, Eagle View subdivision is also a typical single family residential subdivision with limited commercial business. The point of discharge for the outlet sewers is 857 ft. above sea level where sewage flow was measured and is located in the northwest corner of the basin.
3. Methodology
3.1. Data Acquisition
Each subdivision was first characterized using an Esri ArcReader version 9.2. The GIS database has specific details about the size and lengths of sewers within the area as well as the size of the catchment area. Precipitation and flow data were collected for this study from January 1, 2011 through March 31, 2011. This period of time was used because water use most closely reflects the amount of sewage, i.e., no loss of water use to outdoor activities, allowing a 1:1 ratio between water usage and sewer usage to be assumed.
Precipitation data were collected from a rain gauge owned and operated by the Bloomington Normal Water Reclamation District (BNWRD), located near the Holiday Knolls subdivision (Figure 1). The gauge is a 3600 series tipping bucket style gauge manufactured by ADS Environmental Services Inc. with telemetry allowing for automatic retrieval of data. The rain gauge was checked on a monthly basis by maintenance crews to ensure proper functionality and accuracy.
The flow of sanitary sewage (ASF) from the subdivision was monitored using in-pipe submerged flow sensors made by American Sigma Inc. A pressure/velocity sensor is situated within the pipe and was programmed for pipe diameter and pipe material type to calculate the flow of sewage. A meter was positioned at the common outlet point of discharge for the subdivision where all sewage from the area flows through. The meter collected data in 15 minute intervals and stored it internally until maintenance crews manually downloaded the data to a lap-top computer.
Base flow, no extraneous flow included, (BF) was established by obtaining drinking water consumption rates for the subdivisions and assuming that most of the drinking water used eventually enters the sewers and becomes base flow. The City of Bloomington water billing was able to provide drinking water consumption rates from January through March 2011 for each subdivision.
3.2. Data Analysis
3.2.1. Method 1—Potential Extraneous Flow (PEF)
Here we introduce the term potential extraneous flow (PEF), which refers to the volume (gallons) of water that falls on the area but would not be conveyed from the basin via storm sewers. Theoretically, PEF represents the maximum infiltration/inflow (I/I) that could leak into the sanitary sewer system.
For each subdivision, the total area (TA) and paved area (PA) were found using GIS (Table 1). The PA includes the roadways and driveways that would immediately convey water to the storm sewers. An assumption is
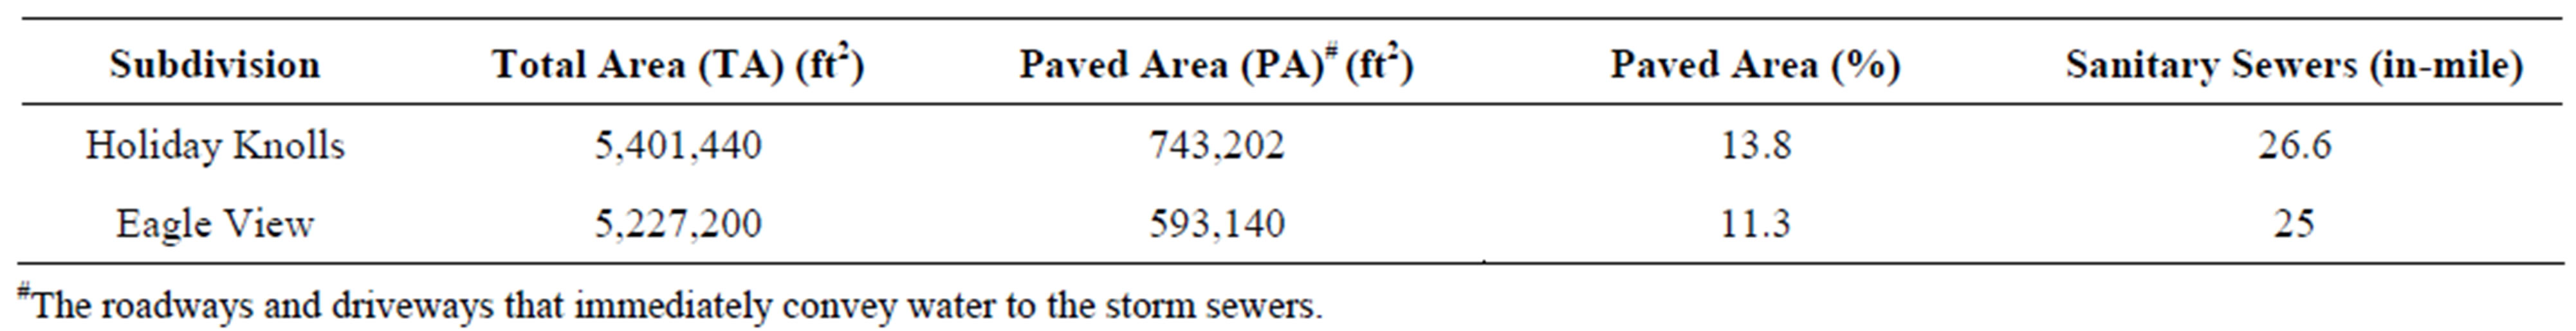
Table 1. Subdivision characteristics for Holiday Knolls and Eagle View. Data obtained from the City of Bloomington.
being made that the PA is impervious and does not allow for infiltration. After knowing the TA and PA along with precipitation (ppt), the PEF is calculated using:
(TA – PA) × ppt × (7.48 gal per ft3) = PEF (1)
where ppt represents the reported depth of precipitation in feet. The 7.48 gal per cubic feet is a conversion factor.
To assess the impact of I/I for a subdivision, a comparison of the PEF to actual extraneous flow (AEF) is needed. As previously stated, water consumption rates are assumed to represent the base flow (BF) for the sanitary sewer system. Actual sewage flow (ASF) is measured in-situ. The difference between the ASF and BF is considered actual extraneous flow (AEF) (Equation (2)). The AEF represents the volume of I/I that has entered the sanitary sewer system.
ASF – BF = AEF (2)
After computing the AEF, a comparison can be made between the AEF and PEF, defined as Extraneous Flow (EF) ratio, and is described in Equation (3).
EF Ratio = AEF/PEF. (3)
If the EF ratio is zero (0), then no AEF occurred. While an EF ratio equal to 1 indicates AEF is equal to PEF, a value greater than 1 would indicate that either the assumption concerning PA is incorrect or there are structural problems in the area contributing to elevated flows. Once calculated, the EF ratio allows for one-toone comparison between subdivisions that indirectly accounts for multiple hydrologic and civil characteristics.
3.2.2. Method 2—Infiltration/Inflow (I/I)
Infiltration/Inflow (I/I) represents the AEF per length of sewers (in-miles) that exist in the basin. I/I takes into consideration the sewer density within the basin and the actual amount of extraneous flow that entered the sewers. I/I accounts for multiple hydrologic and civil characteristics while providing a comparison between subdivisions with differing sewer densities and base flows. I/I (gpd/ in-mile) can be calculated by dividing the AEF by the sewer length (SL):
I/I = AEF/SL (4)
3.3. Subdivision Comparison
Statistical comparison of the AEF values, I/I values, and the EF ratios for the two subdivisions were conducted using a one-tailed, Paired-difference test for comparing two population means with the null hypothesis that the difference in the mean variable of interest would be zero. An α = 0.05 was used.
3.4. Data Assumptions
Assumptions were made to complete the analysis for these subdivisions. The first assumption is in calculating the potential extraneous flow, where 100% of the rainfall that landed on the paved areas was conveyed to the storm sewers. Although paved areas are not completely impervious due to cracks and openings in the pavement, the permeability of the impervious surface was assumed to be zero ft2 to simplify the analysis. Additionally, sump pump discharges directly to the street and roof gutters that convey water to the street potentially enter the storm sewer rather than entering the soil, decreasing the volume of I/I. These factors are almost impossible to account for so for the purpose of simplicity a common method was used for both subdivisions.
The second assumption was that the recorded precipitation represents both locations for analysis. As shown in Figure 1, the precipitation gauge was located just south of the Holiday Knolls location. Ideally, each location would have a precipitation gauge at a centralized point in the subdivision to accurately represent the rainfall.
The final assumption is that all drinking water used at a home was input to the sanitary sewer. This is likely not true as a person can consume water and not contribute to these particular sewers. Similarly, outside sources of water could enter the sewers at our study locations such as bottled beverages that would not be metered as drinking water yet contribute to the actual sewer flow. For the sake of simplicity we assumed all drinking water metered at the home was eventually input to the sanitary sewer and the discrepancy between metered and unmetered liquids would close to even out in the end. As long as the method of analysis remains constant, these discrepancies should be negligible.
4. Results
Climatically, conditions were typical for January through March 2011 for central Illinois; however, temperatures were slightly warmer than average. In January, the average temperature was 19.4˚F [8], and total of 1.01 inches of precipitation was recorded (Figure 2). The area experienced unseasonable warm temperatures on December 30 and 31, 2010, with average daily temperatures of 48˚F and 56˚F, respectively [8]. Additionally, on December 31, 1.02 inches of rain, no snow, fell over the area. January 8 marks the first snow event that resulted in a sustained snow cover. The event resulted in 2 inches of snow, which was equivalent to 0.08 inches of precipitation. Snow cover remained throughout the month. In February, the average temperature was 26.2˚F [8] and a total of 2.68 inches of precipitation were recorded. A 13 inch snow fall, equivalent to 1.07 inches of rain, occurred on February 1. Although an additional 1.2 inches of snow fell (0.16 inches equivalent rain) fell on February 6th and 7th, melting had reduced the snow depth on February 8th to 11 inches. No additional melting was recorded until February 12th, when a melting rate of 1 inch every two days was recorded until February 20th. On February 20th, the area experienced 0.39 inches of rain. Following the rain, no snow was reported on the ground. A final snow fall occurred on February 24, with 2.5 inches of snow falling, an equivalent to 0.1 inch of rain. By February 27, no snow was reported on the ground [8]. The average temperature in March was 38.4˚F [8] and 1.77 inches of precipitation were measured.
During the period of interest, the average daily water consumptions for Holiday Knolls and Eagle View were 20,761 gallons per day (gpd) and 29,761 gpd, respectively (Figure 3(a)). While, the Eagle View subdivision is smaller, the area used 30% more water on a daily basis than Holiday Knolls. Given the time of year, these values represent water use within the households that would be returned via the sanitary sewer system.
Daily measured ASF values and calculated AEF values for both subdivisions are presented in Figure 3(a) and (b), with monthly values presented in Table 2. Actual sewer flow (ASF) and Actual Extraneous Flow (AEF) varies over the duration of the study for both subdivisions (Figures 3(a) and (b)), with spikes coinciding with precipitation events. Since BF was taken as a constant, changes in AEF result in corresponding changes in ASF. Hence, the paper will focus solely on AEF and not ASF. The elevated AEF to start January are a response to precipitation events on December 30 and 31. During January and early February, both subdivisions had periods of low, but consistent, AEF. During this period, AEF from Holiday Knolls was slightly higher than from Eagle View. During the melting of the snow, AEF from Holiday Knolls increases at a faster rate than for Eagle View and remains higher until the end of March. Overall, the Paired-difference test showed that the AEF for Holiday Knolls (M = 50,871, SD = 28,654) is greater than for Eagle View (M = 28,589, SD = 8702), t (89) = 8.60, p < 0.01.
The EF ratio for Holiday Knolls ranges from 0.01 to 3.53, and Eagle View had a range of 0.01 to 1.12 (Figure 4). Statistically, the ratio for Holiday Knolls (M = 0.39, SD = 0.74) was greater than the ratio for Eagle View (M = 0.20, SD = 0.30), t (25) = 2.01, p = 0.03.
Since the I/I is the quotient of the AEF divided by the sewer length within the sewer shed, the I/I for both areas follow the same trend as the AEF but at a decreased volume (Figure 3(c), Table 2). Although Holiday Knolls has more sewer line, the I/I for Holiday Knolls (M = 1912, SD = 1077) is greater than for Eagle View (M = 1143, SD = 348), t (89) = 7.94, p < 0.01.
5. Discussion
A distinct and statistical difference in AEF between Holiday Knolls and Eagle view is noted during and following precipitation events (Figures 3 and 4). Both systems show a response to the precipitation events, but Holiday Knolls exhibited higher AEF flows. The average EF ratio for Holiday Knolls was twice the magnitude than the EF ratio for Eagle View indicating that more rain entered the sewer per inch of rain fallen. In many cases, most of the rain falling over houses and gardens is drained by foundation drains and leakage to the sewers, often with substantially increased inflow after a rainstorm as a result [9]. The extraneous flows witnessed at Holiday Knolls and Eagle View indicate that Inflows are occurring within the systems of both subdivisions. One could hypothesize a more direct opening to the sewers exist at Holiday Knolls based on the EF ratio and amount of extraneous flow. The ratio primarily represents an inflow source of leakage since this calculation is only made during a precipitation event.
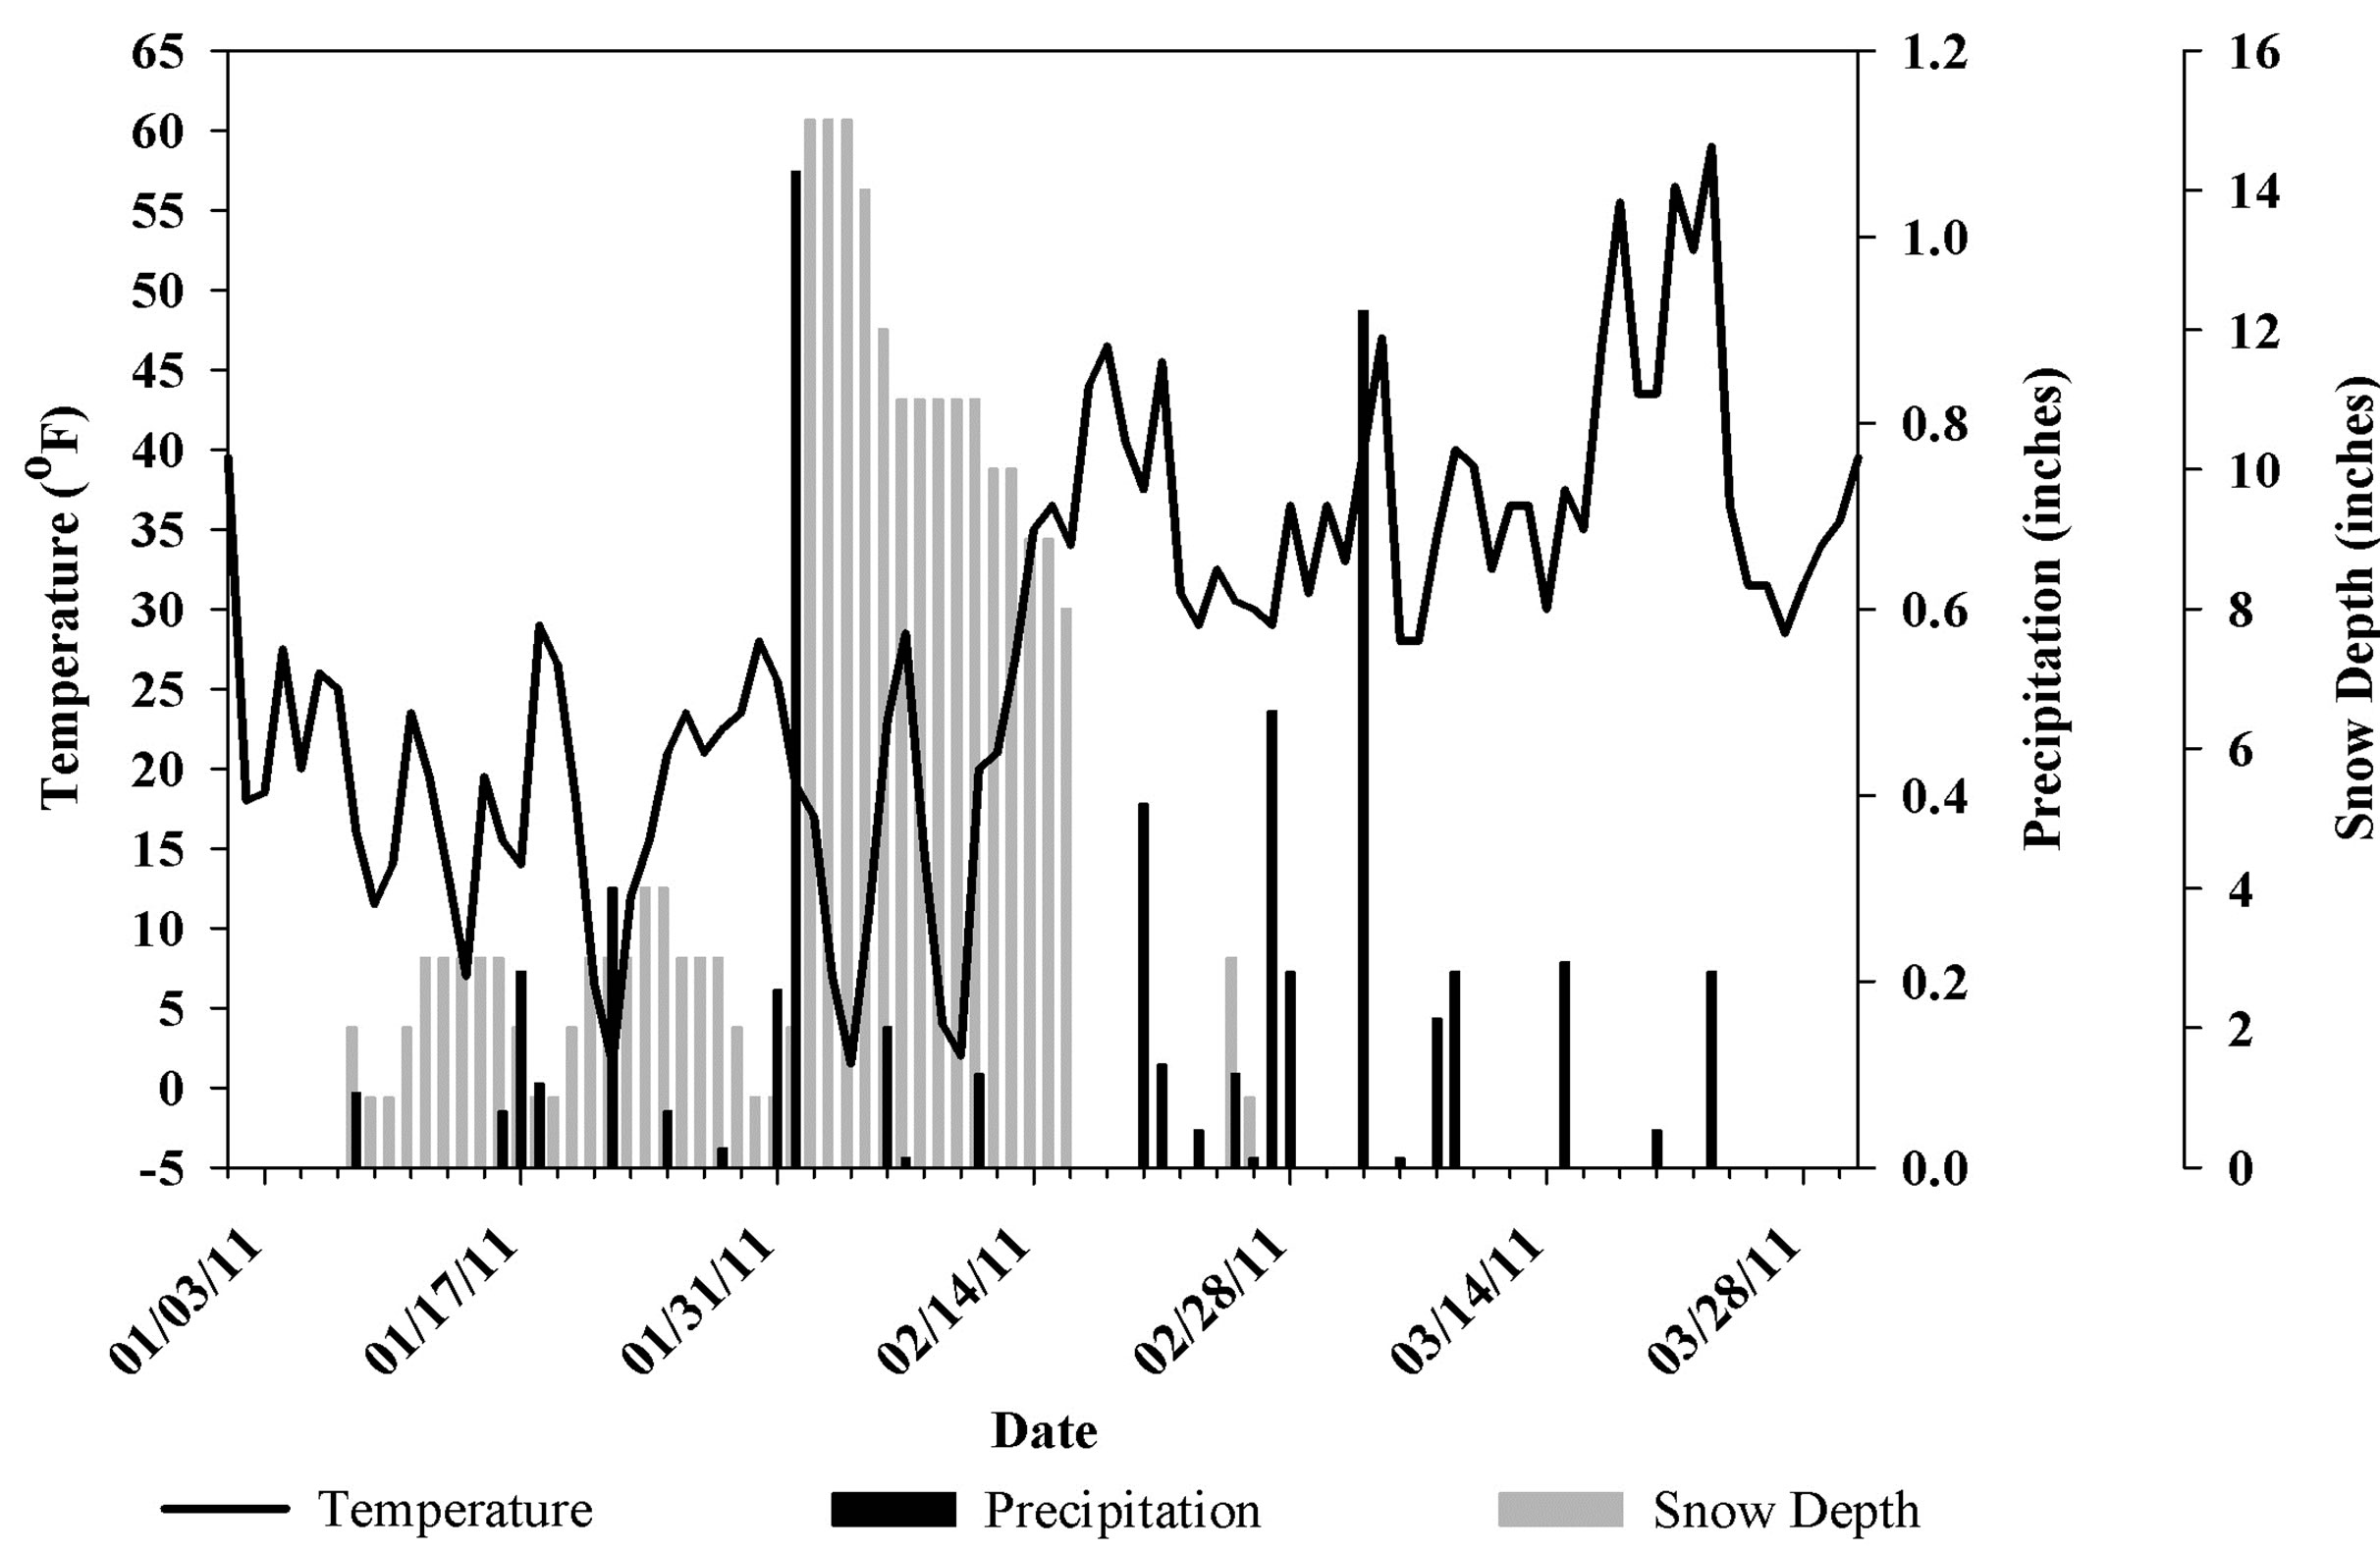
Figure 2. Climatic data for Bloomington, IL from January 1, 2011 to March 31, 2011.

Figure 3. (a) Measured Actual Sewer Flows (ASF), Baseflow (BF), and precipitation for both subdivisions; (b) Actual Extraneous Flow (AEF) for both subdivisions; (c) Infiltration/Inflow (I/I) for both subdivisions, note the dotted line that represents the threshold of allowable extraneous flow to a sanitary sewer in Illinois.

Table 2. Sewer flow information for the subdivision.
During dry periods, both Holiday Knolls and Eagle View have extraneous flows, indicating that Infiltration is entering the sanitary sewer system. Groundwater effects to sewer pipes can be identified by correlating the dry-weather flow in the system to the groundwater-influenced length of sewer pipes. Wittenberg and Brombach [10] showed groundwater infiltration processes act in a similar manner as with stream watersheds exhibiting a lower, constant source of water.
The EF ratio data (Figure 4) indicate a much more leaky system at Holiday Knolls. While the amount of infiltration is similar for both subdivisions, the differences associated with precipitation events imply Holiday Knolls has an inflow problem. The average amount of AEF at Eagle View and Holiday Knolls was 1144 and 1912 gpd/in-mile respectively.
The data suggest that both Holiday Knolls and Eagle View are receiving I/I. The average I/I values of 1912 gpd/in-mile and 1143 gpd/in-mile for Holiday Knolls and Eagle View, respectively, are within the range of infiltration reported by Metcalf & Eddy INC. [4] for leaky systems. However, Holiday Knolls leaks more water per in-mile of sewer both during and after a rain event (Figures 3 and 4). Referencing Illinois Administrative Code, these subdivisions both have I/I values well above the construction standard for allowable leakage of 200 gpd/in-mile. While there are increases in sewage flow associated with precipitation events, the I/I values are consistently high, indicating that the extraneous flows during the relatively dry period are infiltration as defined by the United States Environmental Protection Agency [7]. Infiltration is a problem for both subdivisions. Metcalf & Eddy INC. [4] suggest that there is a linear increase in infiltration with the age of the sewer system, which is consistent with the age of the systems. Holiday Knolls is 30 years older and exhibits a higher magnitude of I/I. Based upon the data, both subdivision need to have repair work.
6. Conclusions
The problem of infiltration and inflow into sanitary sewer systems is well documented. Evaluating and identifying the extent I/I in a sewer system can be complicated, costly and time consuming. We present a simple method to quantify the volume of I/I entering a sanitary sewer. The utility and feasibility of the methods was tested by comparing two urban sewer sheds: Holiday Knolls and Eagle View. Both sewer sheds had I/I in excess of the 200 gpd/in-mile allowed by Illinois Administrative Code, indicating leakage problems. The older, Holiday Knolls exhibits a larger I/I flow problem than Eagle View.
The methods are simple to implement and interpret, therefore, possibly reducing the need for costly and complicated computer models. Using flow meters at each location provides actual data and lessens the assumptions made using common software models [1]. The problem of sewer leakage is complex and involves many areas of study, but simplifying the method of evaluating and identifying problematic areas can help focus repair efforts
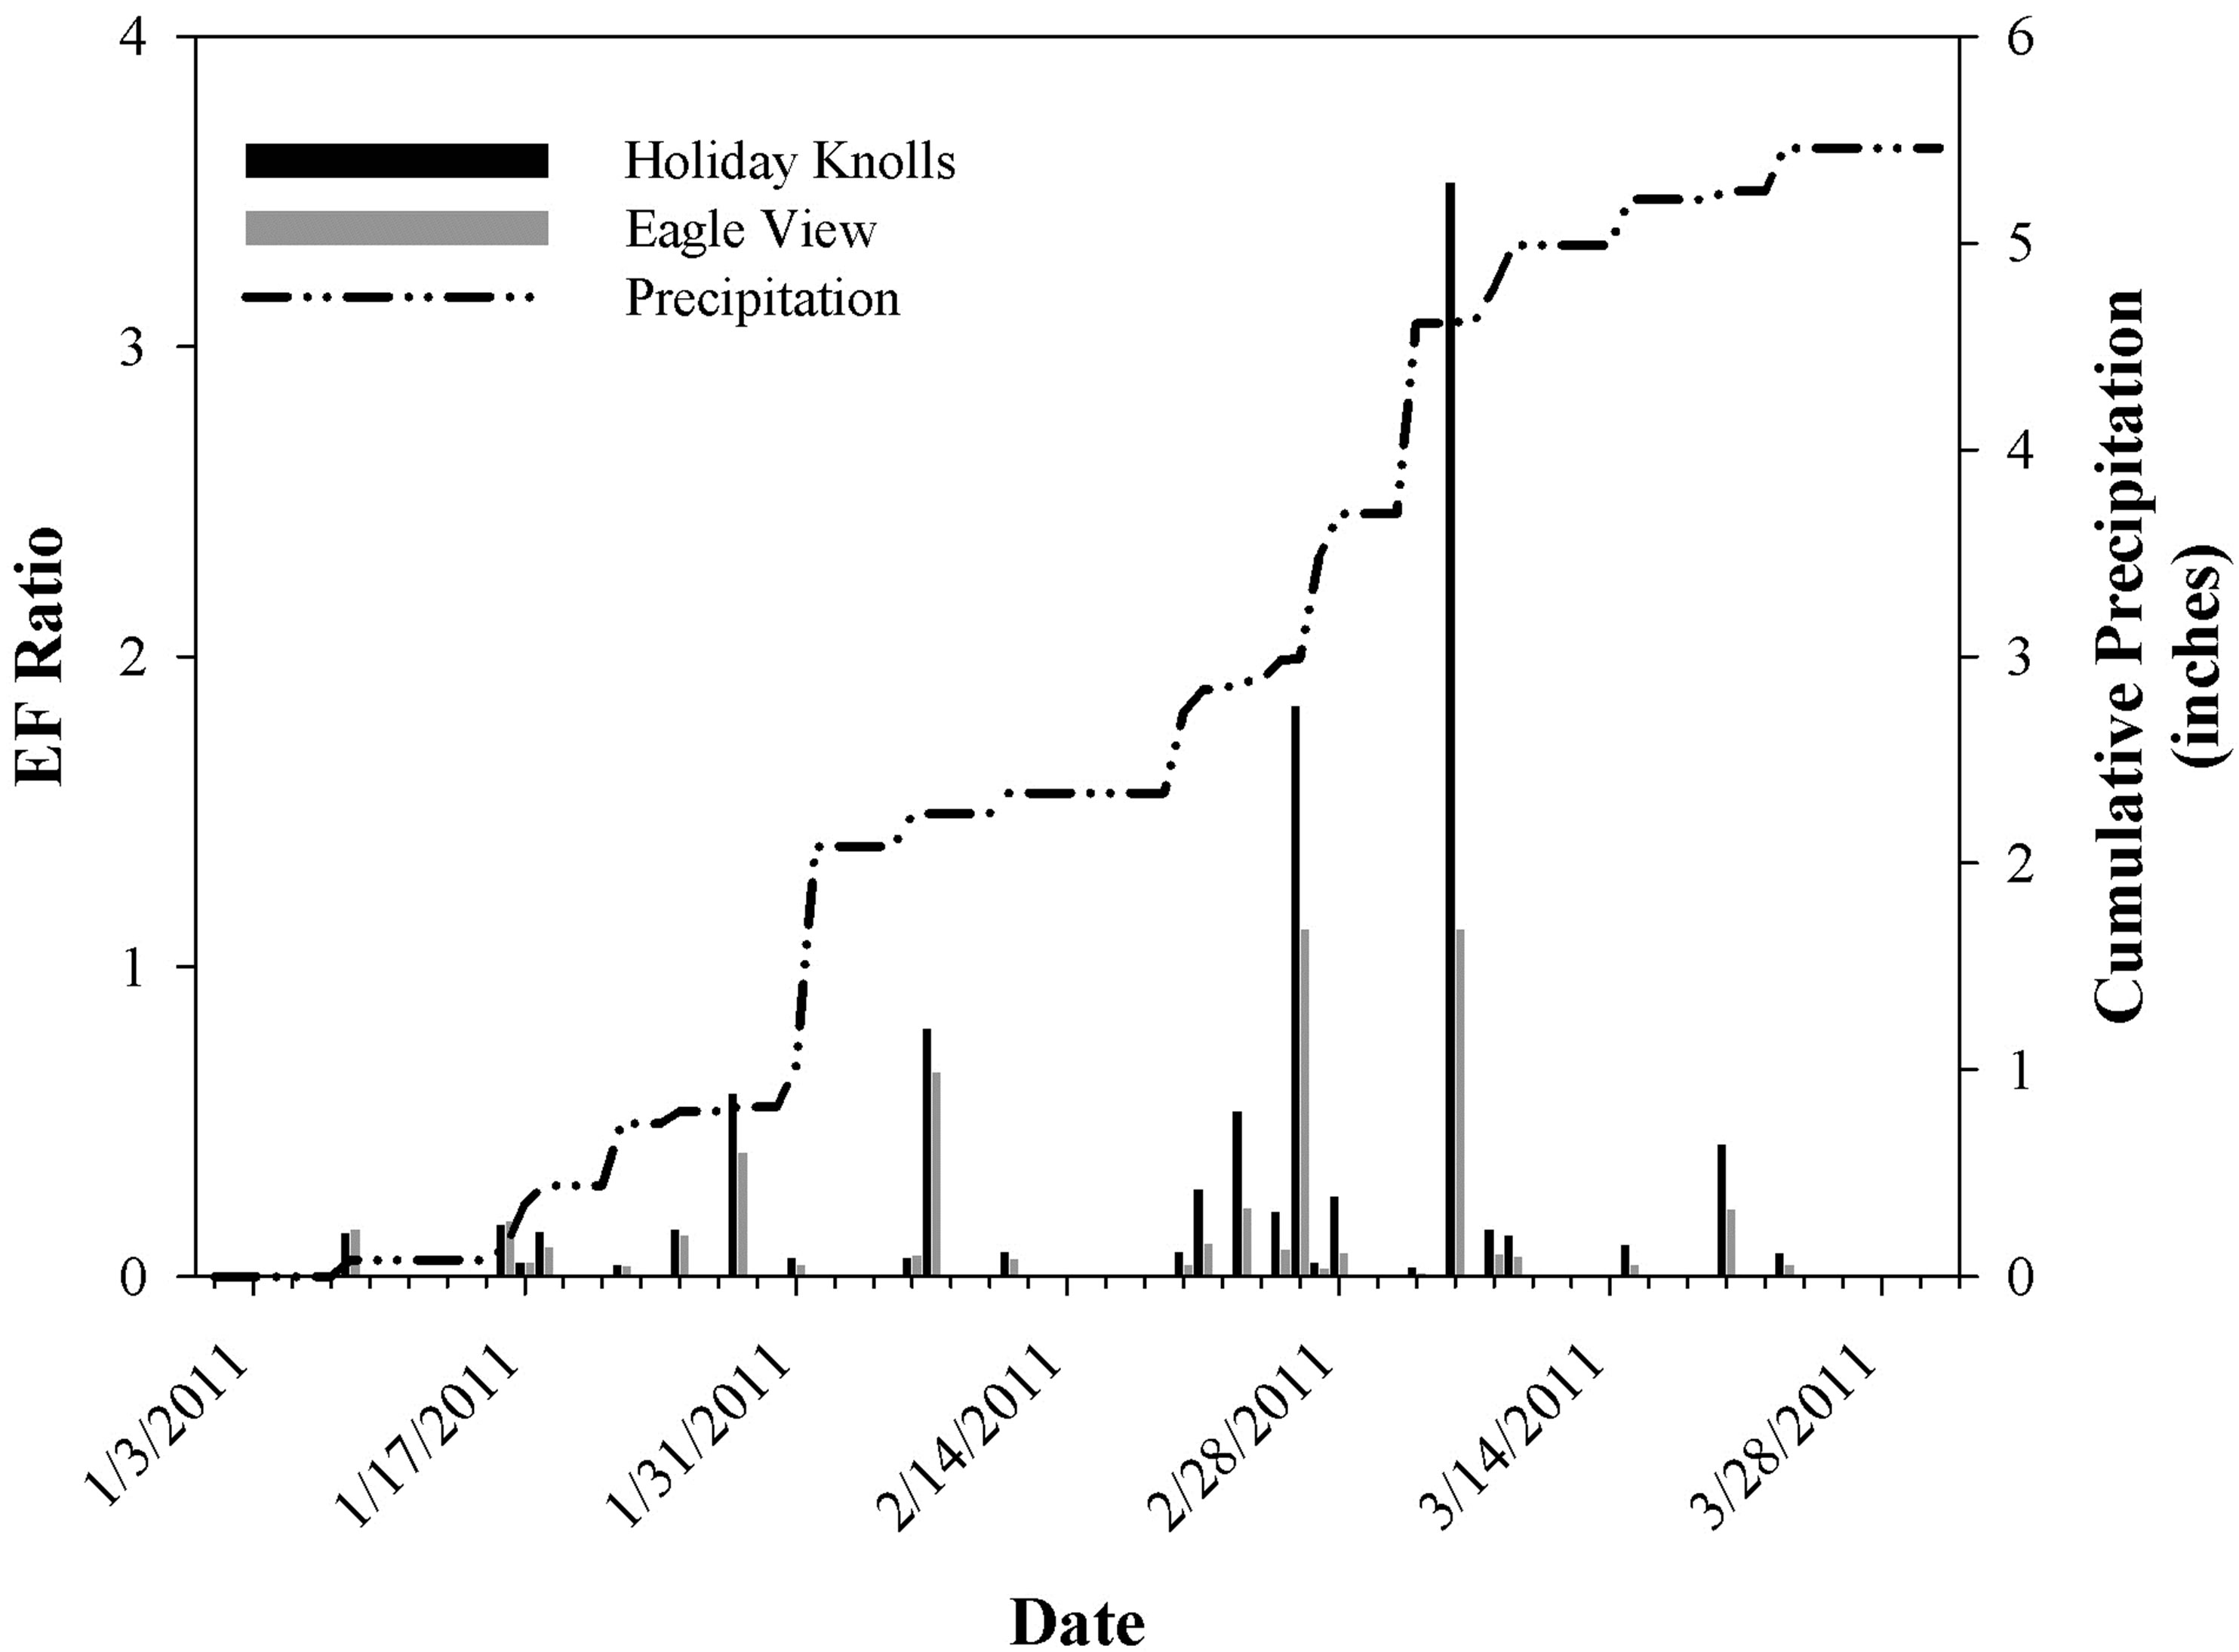
Figure 4. EF ratio versus precipitation for Holiday Knolls and Eagle View.
to these areas.
One could evaluate many aspects of the subject, but the point of this study was to develop a simple and quick evaluation of sewer sheds so repair work can be focused on the most problematic areas. Simply looking at the relative increase in flows from a hydrograph could lead to deceiving results since flow increases are based upon many hydrologic and geologic characteristics, sewer density and size, precipitation intensity/duration, elevation of sewers, water table elevation and amount of paved area within the catchment area. To adequately assess I/I problems, these analyses methods should be performed on multiple subdivisions simultaneously and during similar antecedent soil moisture conditions.
REFERENCES
- F.-H. Lai, “Review of Sewer Design Criteria and RDII Prediction Methods,” United States Environmental Protection Agency, Washington DC, 2008, p. 30.
- National Small Flows Clearinghouse, “Infiltration and Inflow Can be Costly for Communities,” Pipeline, Vol. 10, No. 2, 1999, p. 1.
- J. B. Ellis, “Sewer Infiltration/Exfiltration and Interactions with Sewer Flows and Groundwater Quality,” Interurba II, Lisbon, 19-22 February 2001, pp. 311-319.
- Metcalf & Eddy Inc., “Wastewater Engineering: Treatment, Disposal and Re-Use,” 3rd Edition, McGraw Hill, London, 1991.
- G. Weiss, H. Brombach and B. Haller, “Infiltration and Inflow in Combined Sewer Systems: Long-Term Analysis,” Water Science and Technology, Vol. 45, No. 7, 2002, p. 11.
- C. Karpf and P. Krebs, “Sewers as Drainage Systems— Quantification of Groundwater Infiltration,” Novatech Conference, Lyon, 6-10 June 2004, pp. 969-975.
- United States Environmental Protection Agency, “Sewer System Infrastructure Analysis and Rehabilitation,” United States Environmental Protection Agency, Cincinnati, 1991, p. 105.
- National Weather Service, “WFO Monthly/Daily Climate Data Bloomington IL Airport,” 2011. http://www.crh.noaa.gov/product.php?site=ILX&issuedby=BMI&product=CF6&format=CI&version=11&glossary=0
- H. Bäckman, “Infiltration/Inflow in Separate Sewer Systems,” Chalmers University of Technology, Sweden, 1985.
- H. Wittenberg and H. Brombach, “Hydrological Determination of Groundwater Drainage by Leaky Sewer Systems,” International Conference on Water Resources and Environment Research, Dresden, 22-26 July 2002, pp. 138-143.