Journal of Water Resource and Protection
Vol.4 No.5(2012), Article ID:19465,8 pages DOI:10.4236/jwarp.2012.45028
Evaluation of the Limnological Status of Beeshazar Lake, a Ramsar Site in Central Nepal
Hydrology and Water Resources, University of Arizona, Tucson, USA
Email: rewatin@gmail.com
Received March 9, 2012; revised April 2, 2012; accepted May 3, 2012
Keywords: Beeshazar Lake; Water Quality; Sediment; Nutrients; Trophic Status; Spatial Variation
ABSTRACT
Lack of monitoring and implementation of appropriate management practices and strategies in compliance with the Ramsar Convention obligations have been contributing to severe degradation of Beeshazar Lake, a Ramsar site in central Nepal. The surface water quality and characteristics of underlying sediments were studied to determine the limnological status of the lake. Water quality in Beeshazar Lake was found less favorable to aquatic organisms, with low pH and transparency, low dissolved oxygen (DO), and high nutrient concentrations (Nitrogen and Phosphorus), challenging the conservation of critically endangered gharial, a vulnerable marsh crocodile and many fish species. The lake was found eutrophic in nature by nitrogen concentration and transparency and hyper-eutrophic by phosphorus criteria. Lake sediments were high in organic matter content and nutrient concentrations, signifying a potential internal source of nutrient loading in the overlying water. There were no significant variations in the water and sediment quality between sampling sites except for transparency, sedimentary organic matter content (OM) and total nitrogen concentration (TN). This study provided useful information for decision makers aimed to the conservation and sustainable management of the lake.
1. Introduction
Wetlands, one of the world’s most productive environments, are precious not only for hydrological and ecological processes but also for the high biodiversity they support. Wetlands also help in flood protection; improve water quality by buffering sediments, nutrients and contaminants coming from inflowing waters; support local and migratory animals and provide a wide variety of foods [1]. However, wetlands are among the most threatened habitats mainly due to drainage, land reclamation, pollution, and over-exploitation of wetland species. Also, the accumulation of nitrogen, phosphorus, and pesticides from agricultural runoff leads to severe degradation of wetlands, especially lakes [2]. In view of the worldwide alarming degradation of wetlands, the Ramsar Convention on Wetlands was signed in 1971 to provide a framework for international cooperation for the conservation of critical global wetland habitats.
Monitoring water quality parameters and physio-chemical properties of underlying sediments is very important to determine the actual limnological status of wetlands, an effort which is vital for developing and implementing management strategies for their conservation. Water quality reflects the composition of water as affected by natural causes and man’s cultural activities, expressed in terms of measurable quantities and related water uses [3]. Water quality is the primary factor in the health of aquatic habitats, including habitats for fish, plankton, and other organisms [4]. The physico-chemical characteristics of water have direct influence on the distribution of aquatic biota and vice-versa [5]. The floristic and faunal diversity of wetlands is influenced by several physico-chemical parameters such as water transparency, hydro-dynamism, depth, pH, and nutrients, such as nitrogen (N) and phosphorus (P) [6].
In shallow lakes, the extended water-sediment interface coupled to high mineralization rates supported by high temperatures and nutrient concentrations, lead to high nutrients release from the sediment [7]. Sediment is the reservoir of organic matter and minerals which provide a continuous source of nutrients for these systems. The gradual accumulation of organic compounds in water and sediments can lead to a progressive state of eutrophication, resulting in the impoverishment of the water quality, changes in composition and structure of the biota and an increase in the potential toxicity related to substances with adverse biological effects.
Nepal’s wetlands are facing degradation primarily due to eutrophication and land reclamation. These are critically threatened by the effects of anthropogenic activities such as deforestation, unregulated hunting, dam construction, and increased pollution due to discharges of untreated effluents and runoff from agricultural fields [8]. Beeshazar Lake was designated as a Ramsar Site in 2003 considering its outstanding biodiversity values and the need of immediate protection from over-exploitation by humans [9]. However, due to the lack of monitoring activities and failure to implement management practices in compliance with the Ramsar Convention obligations, Beeshazar Lake is facing severe degradation. The wide spread growth of alien invasive species of floating vegetation has almost covered the open water sector causing habitat modifications that might have affected water quality and altered ecological processes and functions that support rare and endangered autochthonous species of plants and animals. Little information on water quality, bottom sediment, and lake productivity exist to support conservation planning and management of Beeshazar Lake. This study is an attempt to fill this gap by assessing some of the physicochemical parameters of the water and underlying sediments to evaluate the limnological status of Beeshazar Lake. Temperature, pH, transparency, dissolved oxygen (DO), nitrate, total nitrogen (TN) and total phosphorus (TP) concentrations of surface water are measured as well as temperature, pH, organic matter (OM) content, TN concentration, available phosphorus concentration of underlying sediments and water column gross primary productivity (GPP). In addition, this research aims to find correlations among the studied parameters, and determine the spatial variation of water quality and sediment characteristics among sampling sites.
2. Materials and Methods
2.1. Site Description
Beeshazar Lake (Figure 1) is located 5 km south of Bharatpur’s city center in the buffer zone of Chitwan National Park in central Nepal (Latitude 27˚37'0''N and Longitude 84˚25'59''E [10]). The Beeshazar Lake Complex occupies an area of about 3.2 km2 including mosaics of diverse habitat: open water bodies, marshes, swamps, grasslands and forests. Beeshazar Lake has an open water area of about 1 km2 and represents the second largest lake in Nepal’s lowland region [11]. It is located at the altitude of 286 m. The lake has a maximum depth of 4 m and an average depth of 3 m. It receives water inputs from surface and ground water as well as from direct precipitation and by overbank flow from adjacent Khageri canal during monsoon seasons (Figure 1). Beeshazar Lake is a habitat of a critically endangered gharial (Gavialis gangeticus), the vulnerable marsh crocodile (Crocodylus palustris) and several waterfowl and fish. The aquatic vegetation is represented by extensive coverage of floating leaved species mainly water hyacinth (Eichornia
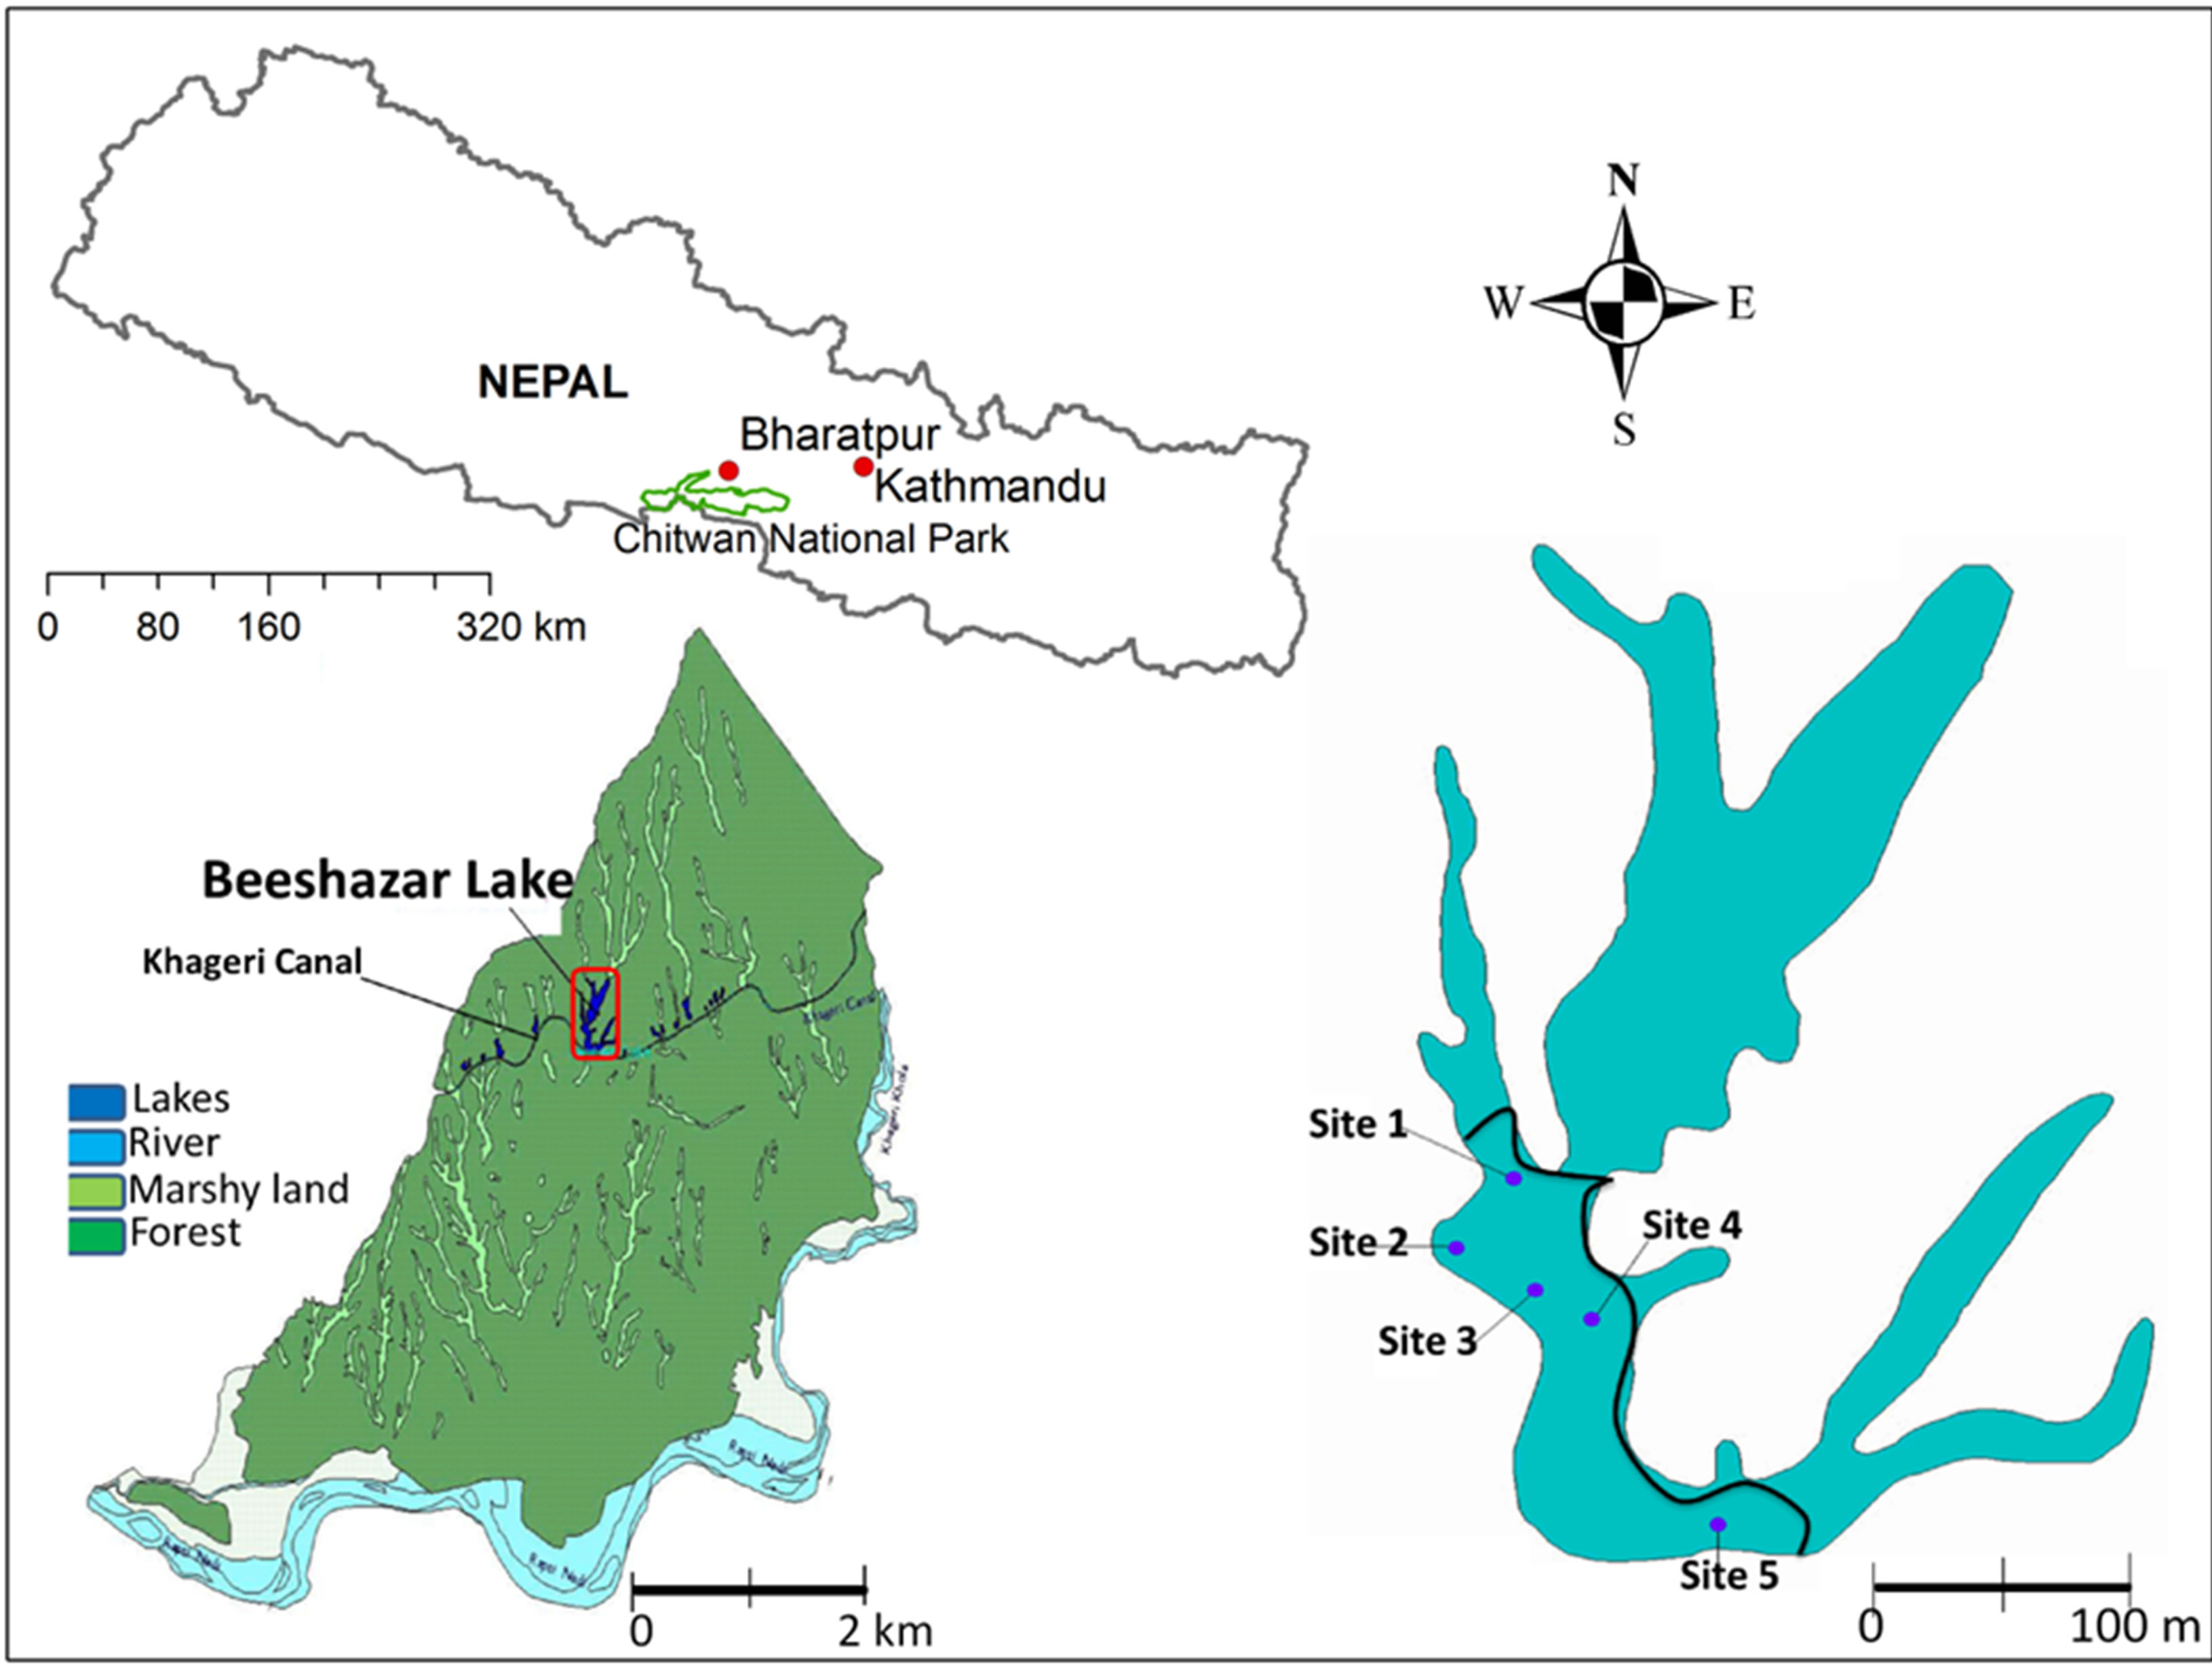
Figure 1. Location map of Beeshazar Lake. Five sampling points are also shown.
crassipes), and water chestnut (Trapa bispinosa), submerged species dominated by hydrilla (Hydrilla verticullata) and marsh vegetation dominated by morning glory (Ipomea carnea sps. fistulosa) [12]. The area at north-east of the black curve line in Figure 1 was fully covered by these aquatic plants during the study period. Beeshazar Lake falls in the tropical climate region and is dominated by a summer monsoon climate. The monsoon begins in late June and continues until early October and brings nearly 80% of the rainfall. The average annual rainfall is 2200 mm and the average atmospheric temperature varies between 8˚C and 35˚C [13].
2.2. Sampling and Laboratory Analysis
The sampling sites were selected to include inlet, outlet, deepest part of the lake and two other sites representative of the open lake area. A short description of sampling sites is provided in Table 1. It should be noted that the open water during the study period was less than 0.25 km2. Surface water samples were collected bimonthly from all sites from January 2006 to December 2006. The samples were collected between 8 am and 12 pm. A 1000 ml sample was collected from each site which was analyzed for multiple parameters. At the same time, bottom sediment was sampled with a Van Veen grab (Wegtech model 115 no RG 194 QD) with a sampling area of 0.0289 m2 and analyzed for multiple parameters. Sampling, preservation and analysis of water quality parameters and underlying sediments were carried out following standard methods for examination of water and waste water [14] and, chemical and biological methods for water pollution studies [15], respectively (Table 2).
2.3. Statistical Analysis
Statistical analysis was performed with R software version “R-2.13.1”. R is a programming language and software environment for statistical computing and graphics. Tukey’s HSD (Honestly Significance Difference) test was performed to determine if there was significant variation in the water quality with respect to sampling sites. Similarly, Pearson’s correlation analysis was also carried out.
3. Results and Discussions
3.1. Water Quality
Temperature: The water temperature of Beeshazar Lake fluctuated between 15.7˚C in winter and 32.1˚C in summer. The average temperature was found to be 23.8˚C, which is optimum for growth and reproduction of most of the biotic communities in the lake. Since the lake is very shallow and located in a tropical climate, the lake exhibits no thermal stratification. There was no difference in the temperature of water on the surface and at the bottom of the lake (Figure 2) as supported by Flake modeling [16].
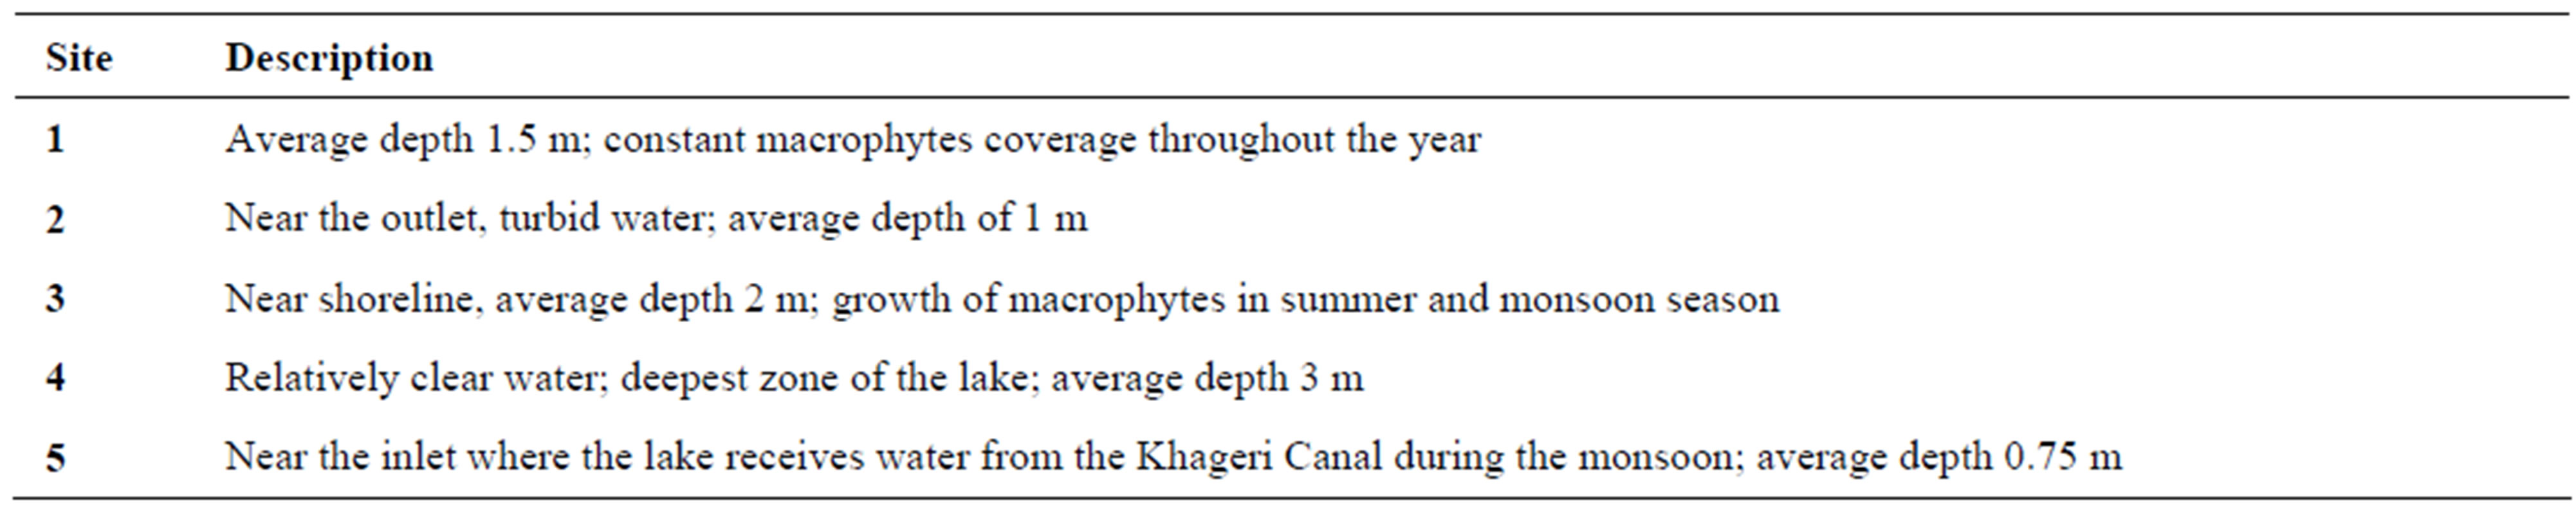
Table 1. Description of sampling sites.
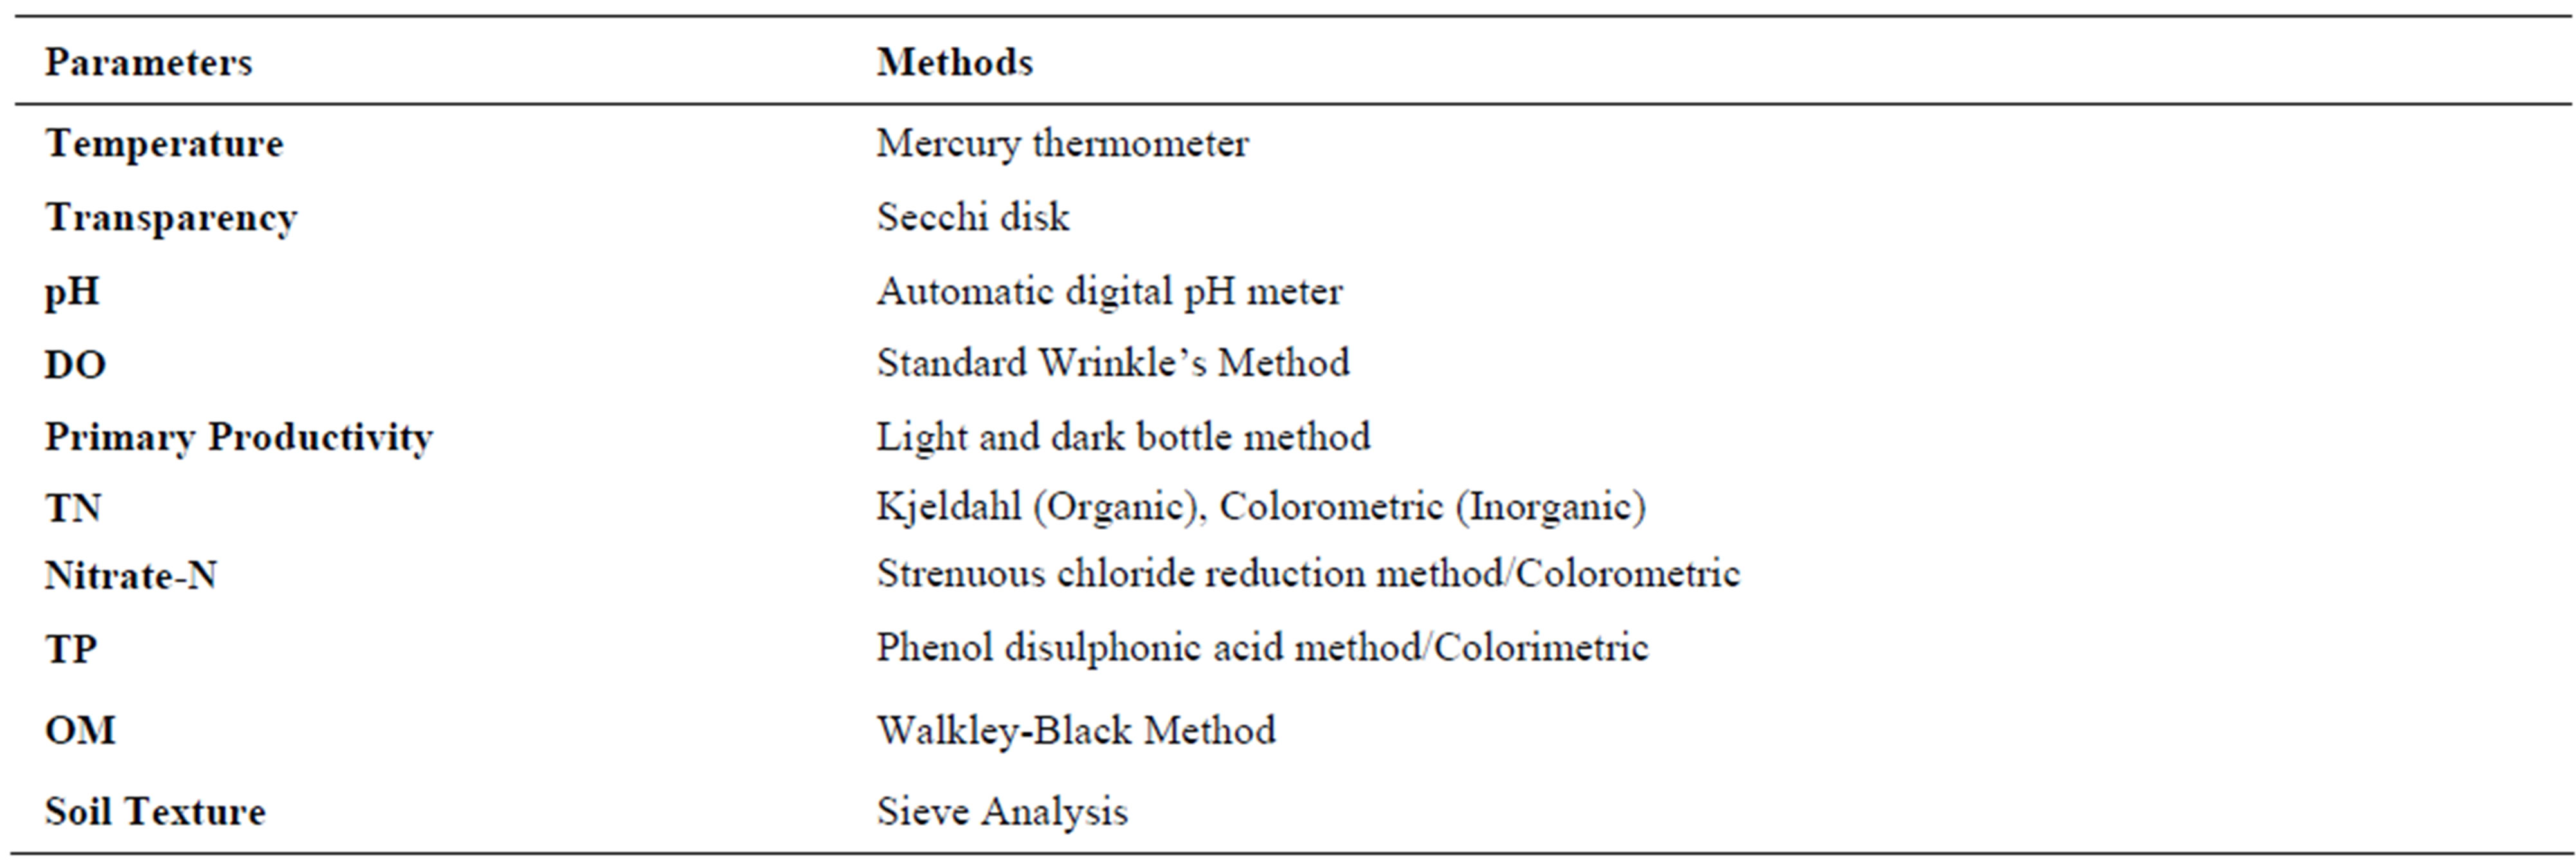
Table 2. Methods used for analyzing water quality and sediment parameters.
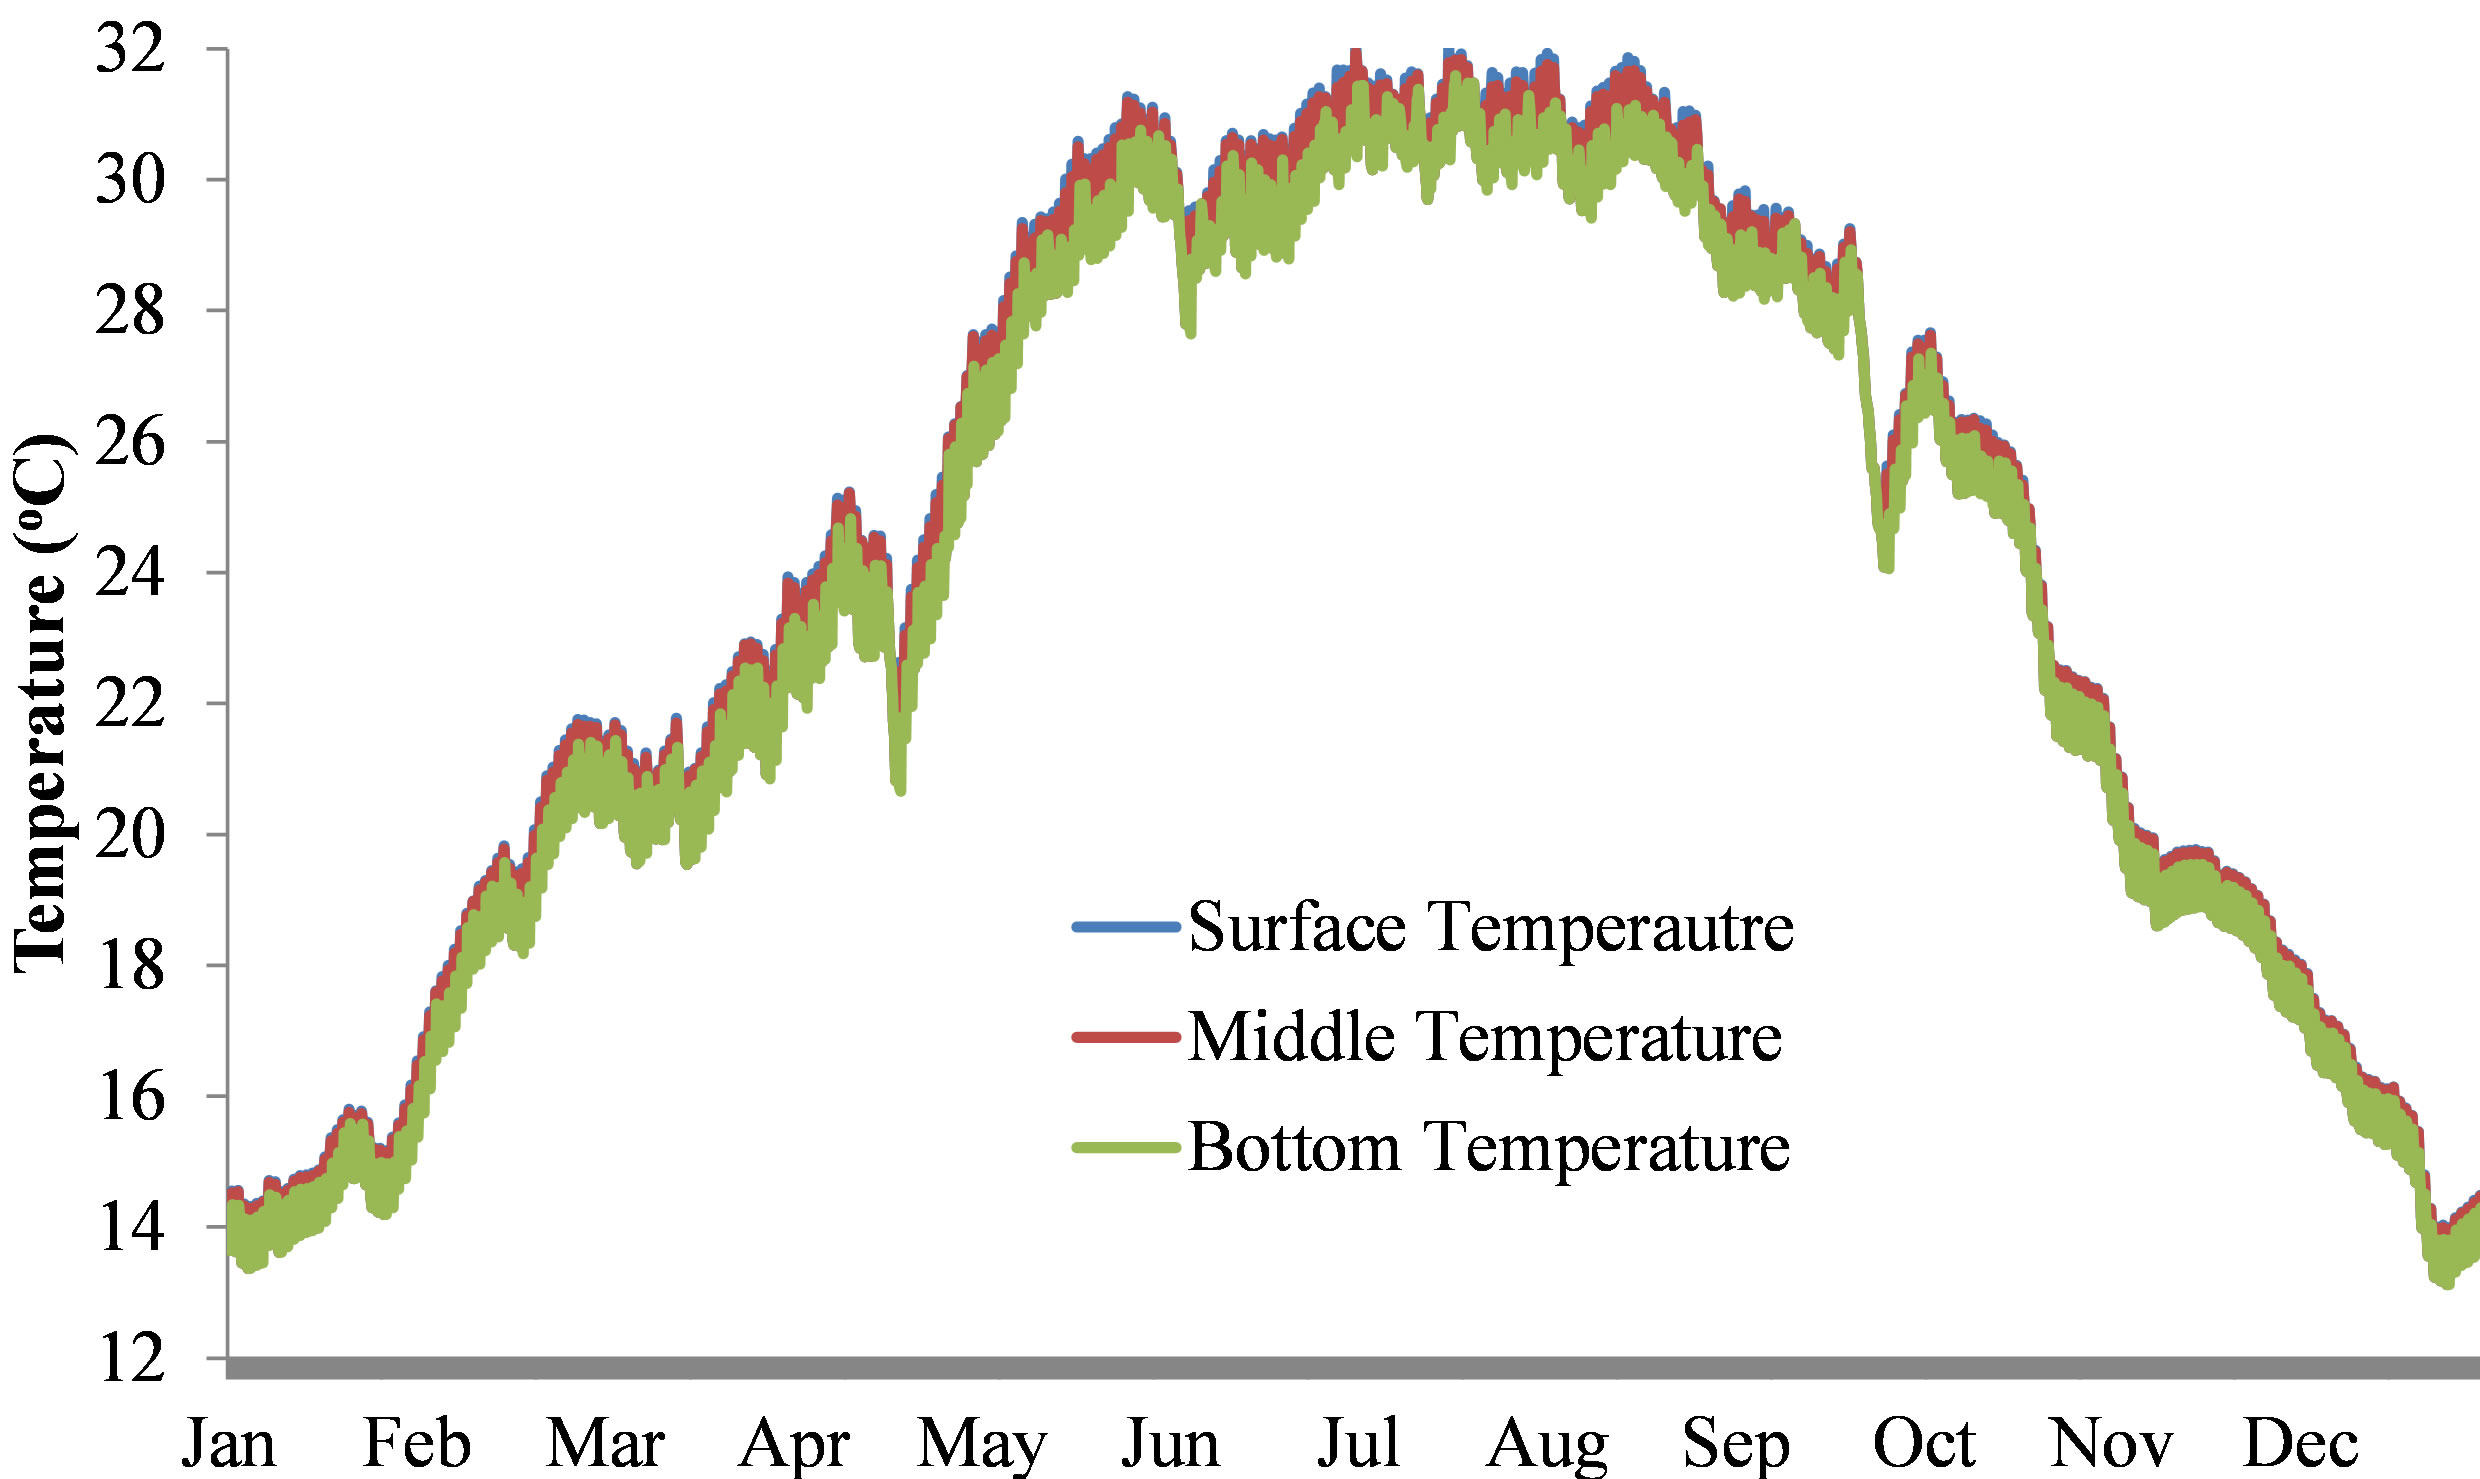
Figure 2. Water temperature variation with depth in Beeshazar Lake.
pH: The average pH of the water was found to be slightly acidic (pH = 6.6) in nature and fell under the category of open lakes [17]. The pH values fluctuated between 6.3 and 7.2. The fluctuation in pH can be attributed to the combined effects of temperature, CO2 balance, liberation of ions, and the buffering capacity of water. The rapid fluctuation might also be due to removal of CO2 from the water body by the process of photosynthesis occurring in submerged aquatic plants [18]. Values of pH between 7.0 and 8.0 are optimal for supporting a diverse aquatic ecosystem. A pH range between 6.5 and 8.5 is generally suitable. Acidic conditions are highly detrimental to aquatic macro invertebrates and fish. If pH declines below 6.5, few eggs hatch and aquatic insect levels drop [19]. Considering these limits, the average pH of Beeshazar Lake was suitable for aquatic life forms. However, the pH of two months, March and May, was below 6.5, which suggests stressed conditions.
Transparency: The average transparency in Beeshazar Lake was found to be 1.1 ± 0.2 m. The low transparency in Beeshazar Lake was attributed mostly to dissolved and suspended solids rather than free floating algae and phytoplankton. This high level of turbidity might have resulted in the lower phytoplankton population by letting less light to penetrate through the water of the lake.
Dissolved Oxygen (DO): The average DO concentration was found to be relatively low (4.0 ± 0.7 mg/L) in Beeshazar Lake, below the international standard of 5 mg/l for surface fresh water. The low concentration of DO in Beeshazar Lake can be attributed to the high coverage of surface water by macrophytes, which prevent photosynthesis, and reduce the chance of diffusion from the atmosphere. Also the heavy loss of oxygen through respiration and heavy utilization by the microorganisms for their subsequent decomposition after die-off lowers the DO level. Generally a DO level between 3.5 mg/L and 6.0 mg/L is considered poor. A DO level under 5 mg/L is stressful to most vertebrates and causes mortality to some invertebrates. Levels below 3.5 mg/L are likely fatal to freshwater fish [19]. Considering this, the average DO of Beeshazar Lake was poor. The value of the DO of Beeshazar Lake was below 3.5 mg/L in summer, suggesting a stressful situation for fish and other aquatic life forms; such a low DO value can directly kill or deter their growth and development. Looking at the oxygen saturation can provide more information regarding the water quality of the lake. The percent oxygen saturation for all the sites in Beeshazar lake were found to be less than 50%, which also suggests poor water quality status [20]. Oxygen saturation above 90% is considered a healthy lake status [20]. The low DO saturation levels could be one of the reasons for the declining fish populations in Beeshazar Lake.
Nutrients (Nitrogen and Phosphorus): The average concentration of nitrate, TN, and TP in Beeshazar Lake was found to be 245.6 ± 8.2 μg/L, 1324.9 ± 501.8 μg/L and 218.7 ± 135.7 μg/L respectively. These high nitrogen and phosphorus concentrations support the growth of aquatic macrophytes like Lersia hexandra, Trapa bispinosa and Eichornia crassipes. These macrophytes have reduced the aesthetic value of the lake, reducing the open water surface and have significantly contributed to the low oxygen level as they die-off.
Primary Productivity: The average GPP of Beeshazar Lake was found to be 0.3 mg O·L–1·h–1 (27 g C·m–3·y–1). As other lakes with GPP between 25 and 75 g C·m–3·y–1, Beeshazar Lake is classified as mesotrophic [21]. Although high nutrients and low transparency were found, the measure of primary productivity does not support the expected high production rates. The lower value of primary productivity can be attributed to the dominating role of the macrophytes, because macrophytes and their associated ephiphytes take up and store nutrients which are then not available for the phytoplankton growth, limiting phytoplankton biomass [22,23].
3.2. Spatial Variation in Water Quality between Sampling Sites
Tukey’s HSD (Honestly Significance Difference) test was performed to determine if there was significant variation in the water quality with respect to sampling sites. The Tukey test showed that there are no significant differences in temperature (P > 0.99), pH (P > 0.84), DO (P > 0.77), nitrate (P > 0.59), TN (P > 0.95), and TP (P > 0.95) among sampling sites. Only transparency in site 4 is significantly different (P < 0.05) than other sites (Figure 3). This can be related to the site 4 depth, which is significantly greater than in the other sites. Also, site 4 was open and less disturbed than the other sites.
Similarly, GPP in site 4 was significantly higher than in the other sites (P < 0.05), which can be related to higher transparency, allowing higher penetration of sunlight and improving photosynthesis. The other remaining four sites showed no significant difference in both transparency (P > 0.24) and GPP (P > 0.95).
3.3. Sediments
Texture: On the basis of triangular classification of soil texture [24], the sediment of Beeshazar Lake was found to be sandy soil. Sandy soils are nutrient deficient due to high porosity [26]. The high percentage of sand in Beeshazar Lake might be attributed to the Khageri canal which supplies huge amounts of sand during monsoon season.
Temperature: The average temperature of bottom sediments was found to be 22.4˚C. The temperature of bottom sediments showed similar trends to water temperature, varying between 16.1˚C and 29.1˚C. In shallow lakes, high sediment temperatures increases mineralizetion rates and enhance nutrient release to the overlying water [25].
pH: The bottom sediments of Beeshazar Lake was slightly acidic (pH around 6). The low pH of the sediments in Beeshazar Lake might be attributed to high organic matter and carbon content. Soil pH strongly affects the microbial activities, as below pH 5.0, bacterial as well as fungal activities are reduced [26]. The pH of the bottom sediments of Beeshazar Lake was found close to 5.0 in some samples, indicating the possible impact on microbial activities. pH is also considered an important factor in regulating the exchange of nutrients between sediments and the water [27]. At low pH, P release from bottom sediments is stimulated [28].
Organic Matter and Nutrients (N & P): The average organic matter content of dry sediments was found to be 53.5 ± 5.8 g/kg. The high organic matter content in Beeshazar Lake might be attributed to high storage of aquatic macrophytes. The average nitrogen and phosphorus concentration were 3.09 g/kg and 79.2 mg/kg
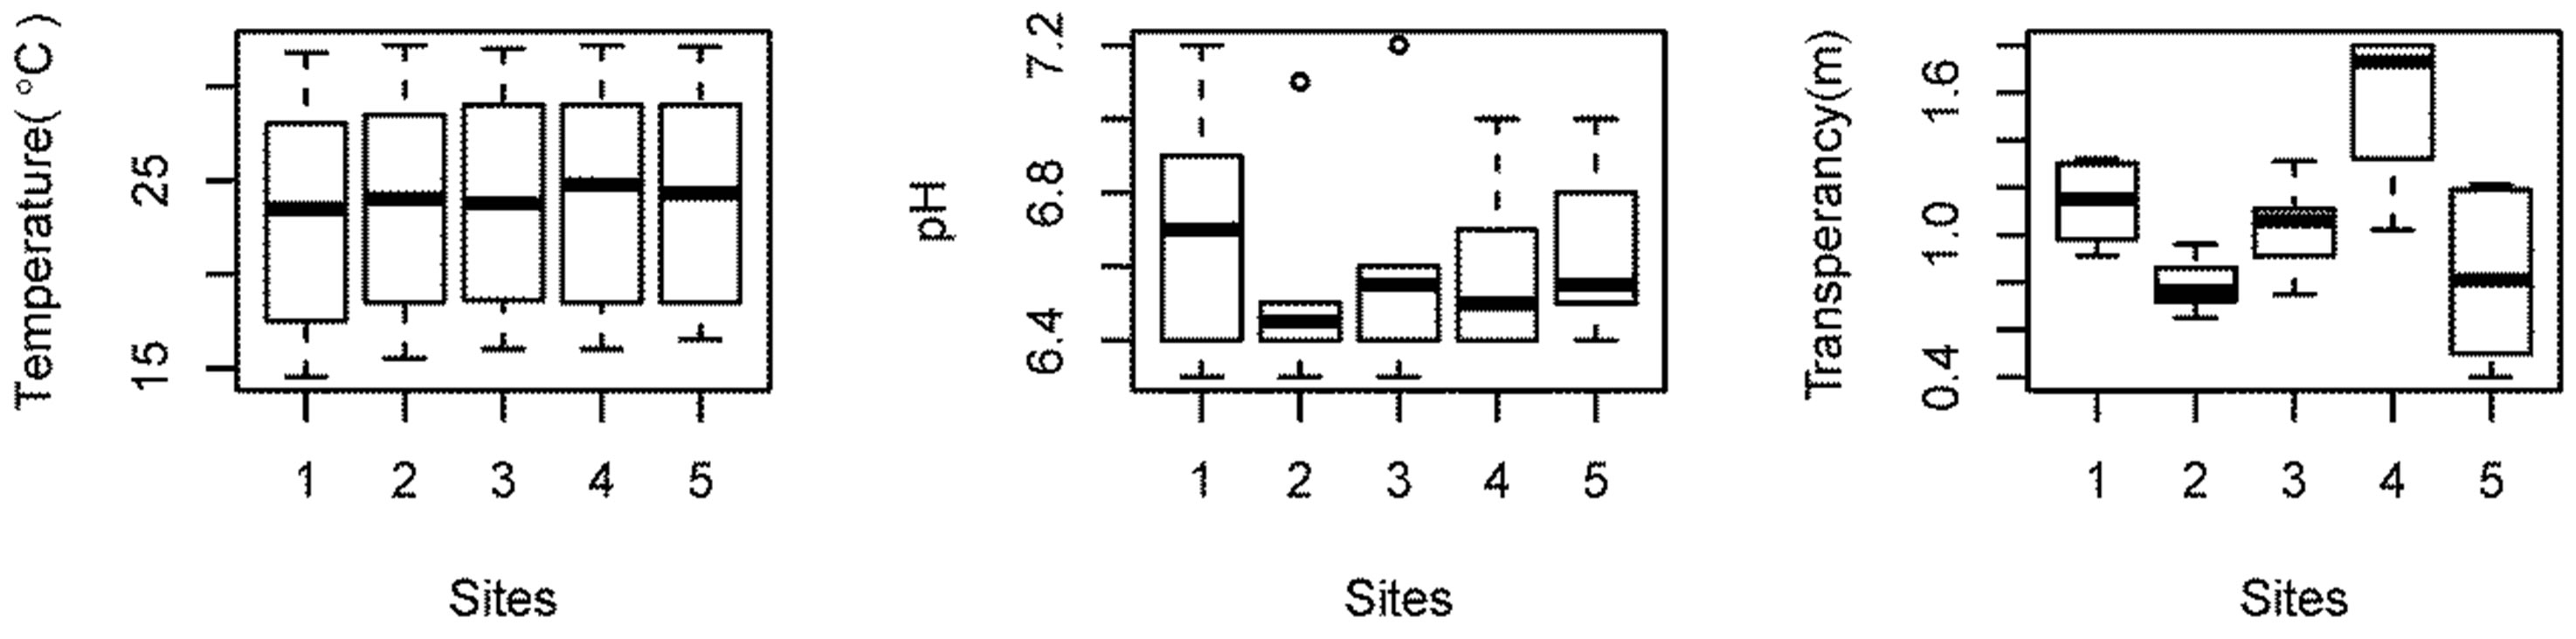
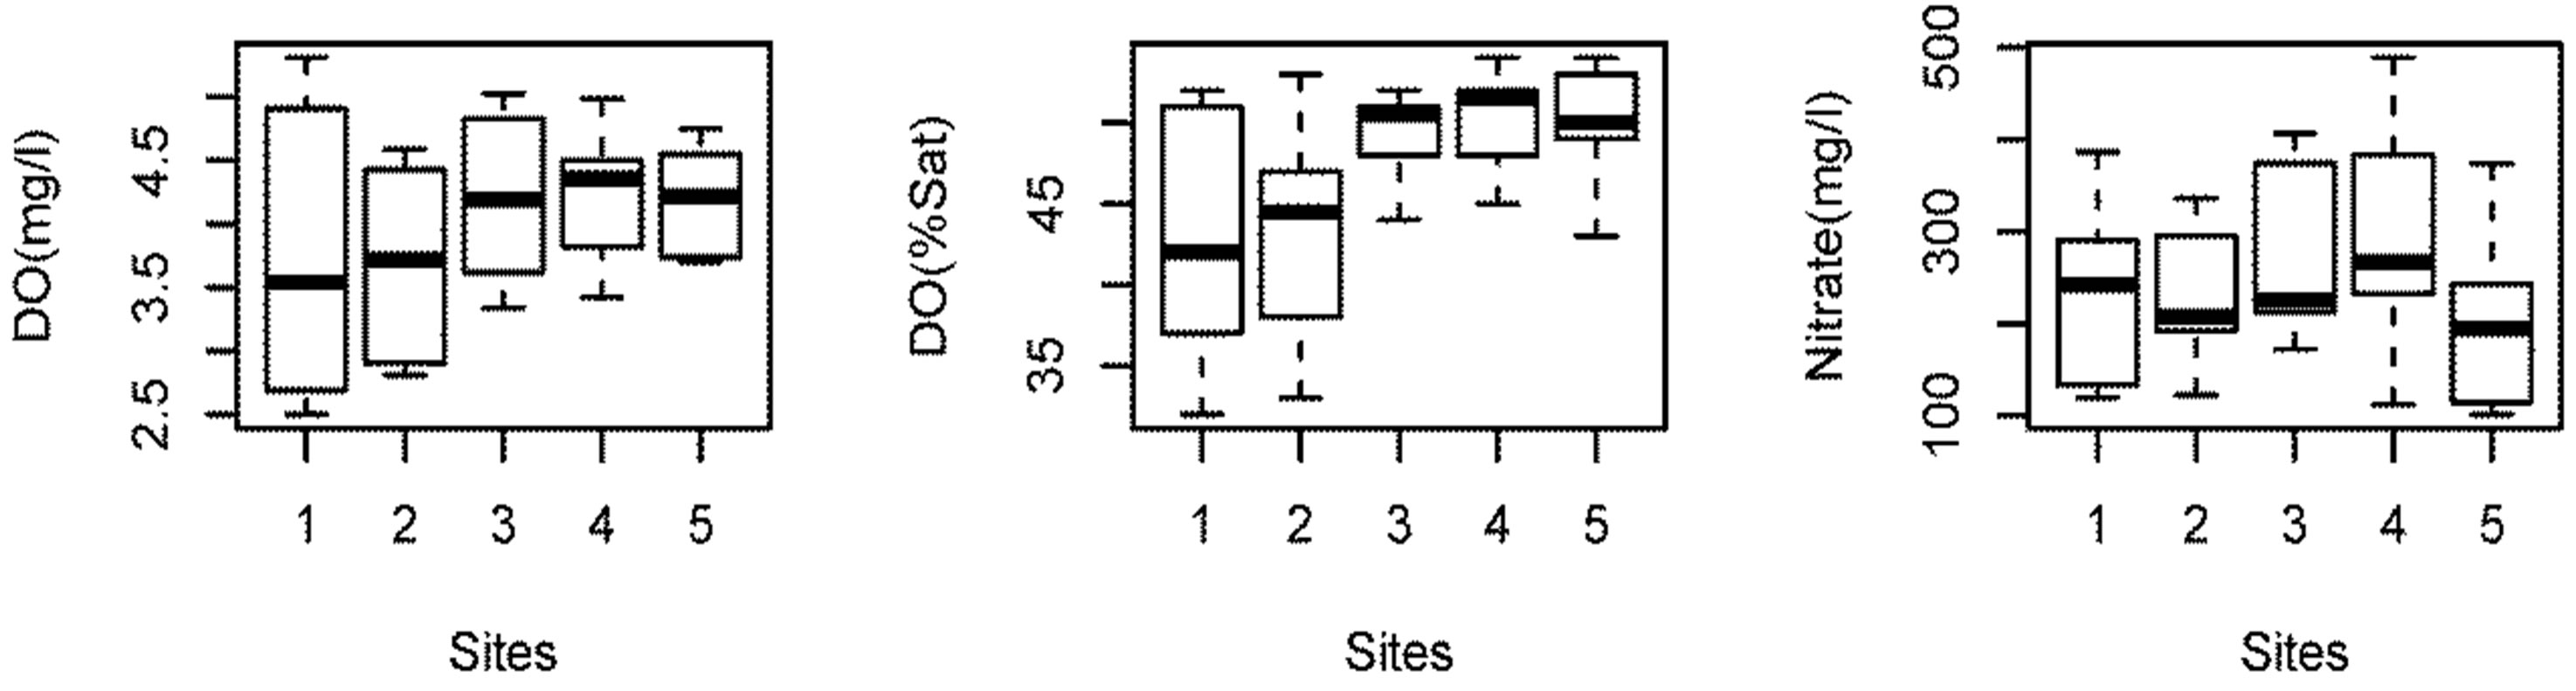
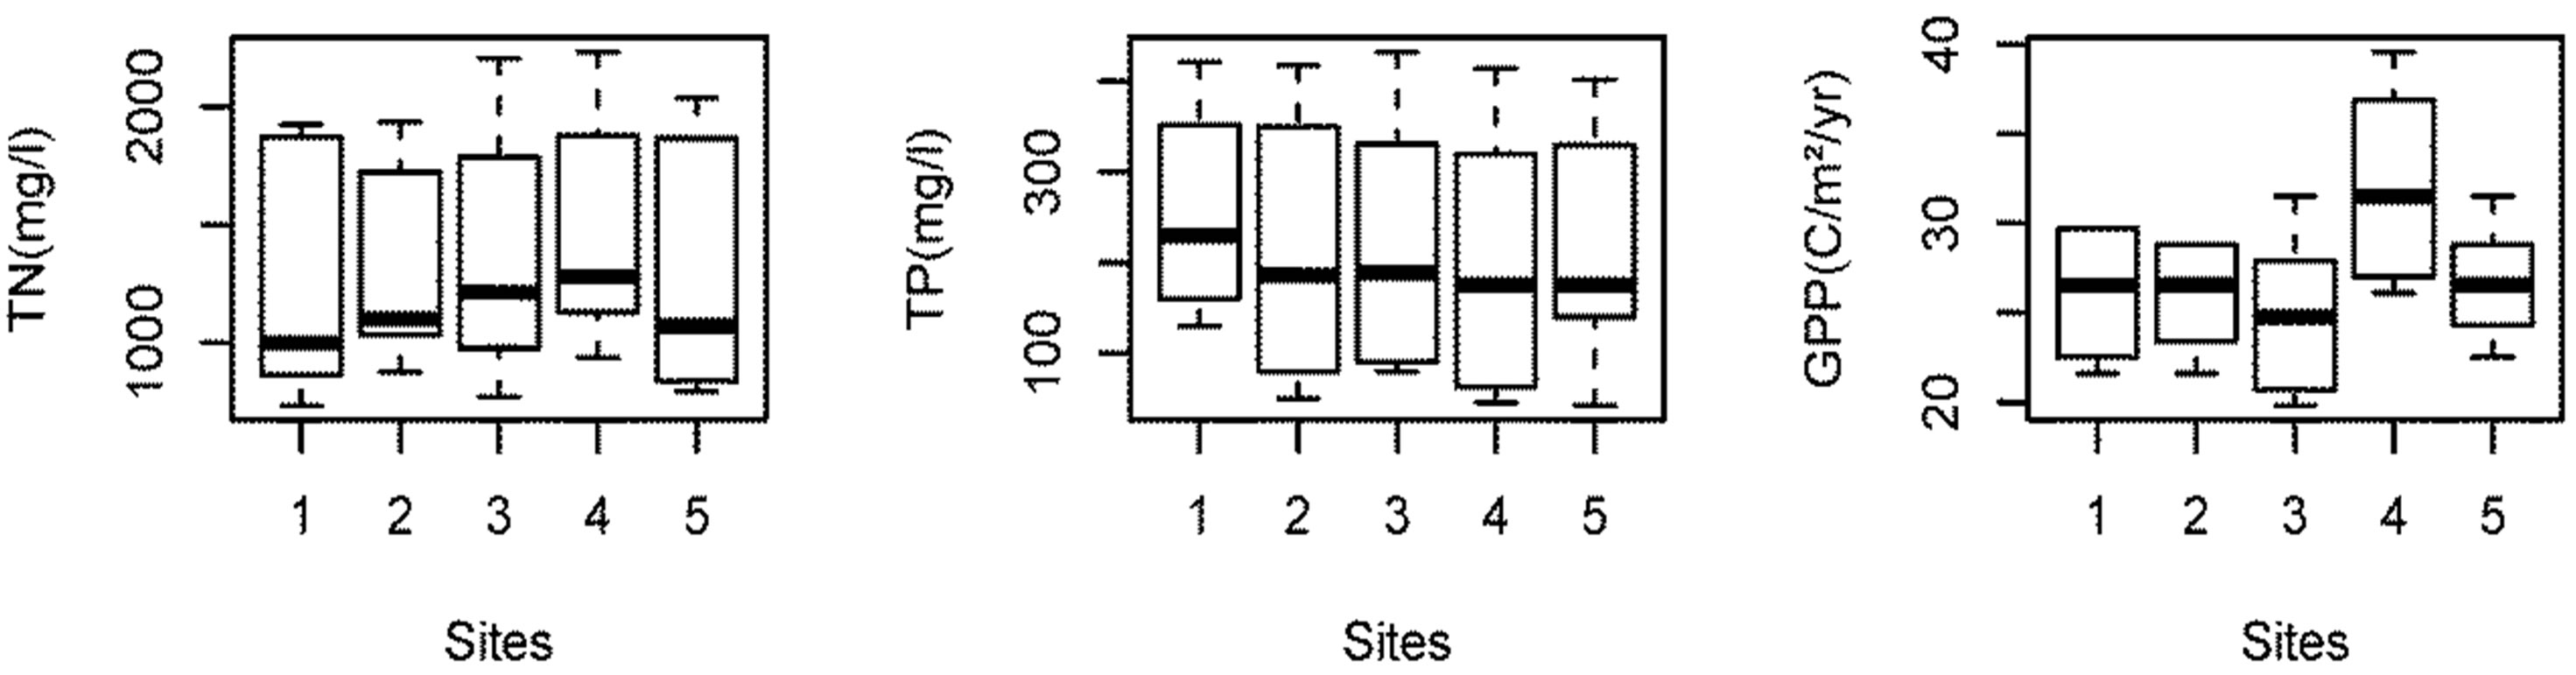
Figure 3. Spatial variation in the water quality parameters in Beeshazar Lake.
respectively. Unlike nitrogen and carbon, phosphorus cannot be lost from wetlands through metabolic processes and thus tends to accumulate in the bottom sediments [29]. In shallow lakes, microbial mineralization enhance nutrient recycling, this is commonly called internal nutrient loading. Burrowing animals and resuspension of sediments further increases the release of nutrients [30]. Internal P recycling from bottom sediments to the euphotic zone can initiate and sustain both algae blooms and eutrophication, even when external P sources decrease [31]. The N concentration in the sediments is controlled by the presence of organic matter with 90% or even more of the N existing in organic forms [32]. Sediment with available P lower than 30 mg/kg is considered poor; from 30 to 60 mg/kg medium and above 60 mg/kg is highly productive [33]. According to these criteria, the average available P concentration of Beeshazar Lake (79.2 mg/kg) is able to sustain high productivity. The P fluxes depend also upon the concentration gradients between overlying water and bottom sediments [29] which is particularly pronounced in Beeshazar Lake.
3.4. Spatial Variation in Characteristics of Bottom Sediment between Sampling Sites
The Tukey’s HSD test was also performed to determine the variation in the characteristic of underlying bottom sediments between sampling sites. The test showed no significant differences in the temperature (P > 0.99) and available P (P > 0.45) among sampling sites. Although site 3 had pH significantly different than site 4 (P < 0.05), there was no other significant differences among all other sites (P > 0.1). For OM content and TN concentration, only sites 1 and 3 showed no significant difference (P > 0.81), all other sites were significantly different from each other (P < 0.001). Since TN concentration and OM content were strongly correlated (r = 0.99), the spatial variation was similar. As indicated in Figure 4, site 4 had very high OM content and TN concentration compared to other sites basically because of its high primary production [26].
3.5. Correlation Analysis
In the present study, water temperature shows a significant negative correlation with DO (p < 0.0001, n = 30) and TP (P < 0.001, n = 30) (Table 3). TP showed significant positive correlation with nitrate (P < 0.0001, n = 30) and TN (P < 0.01, n = 30). Similarly, GPP showed significant positive correlation with both nitrate (P < 0.0001, n = 30) and TN (P < 0.01, n = 30).
The temperature of bottom sediments showed a significant positive correlation with available P (p < 0.0001, n = 30) (Table 4). Similarly, TN showed a significant (p < 0.0001, n = 30) positive correlation with OM. No other strong correlation was found in this study.
3.6. Trophic Status
Beeshazar Lake can be classified as eutrophic based on nitrogen concentrations and transparency and hyper-eutrophic based on phosphorus concentrations (Table 5, [34]).
3.7. Possible Sources of Pollution and Policy Gaps
The possible input of nutrients which is primarily responsible for the degradation of water quality in Beeshazar Lake is water runoff from surrounding agricultural land. The surrounding agricultural land is fed with huge amounts of nitrogen and phosphorus fertilizers to increase crop yields. But, since the cropping and the monsoon seasons overlap, excess fertilizer is washed by the
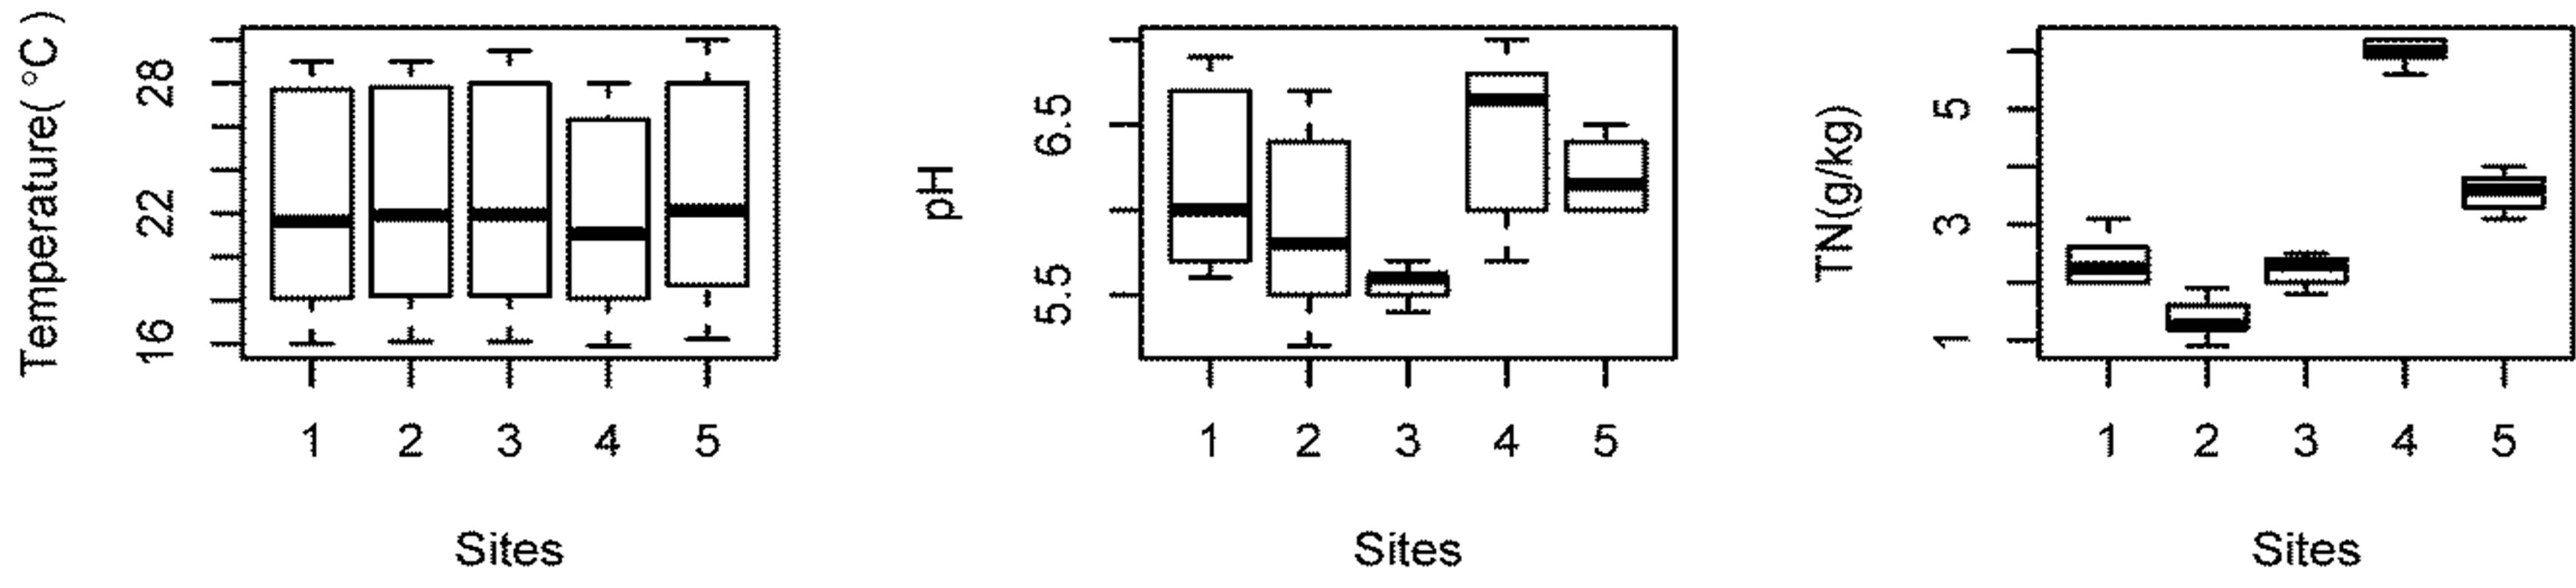
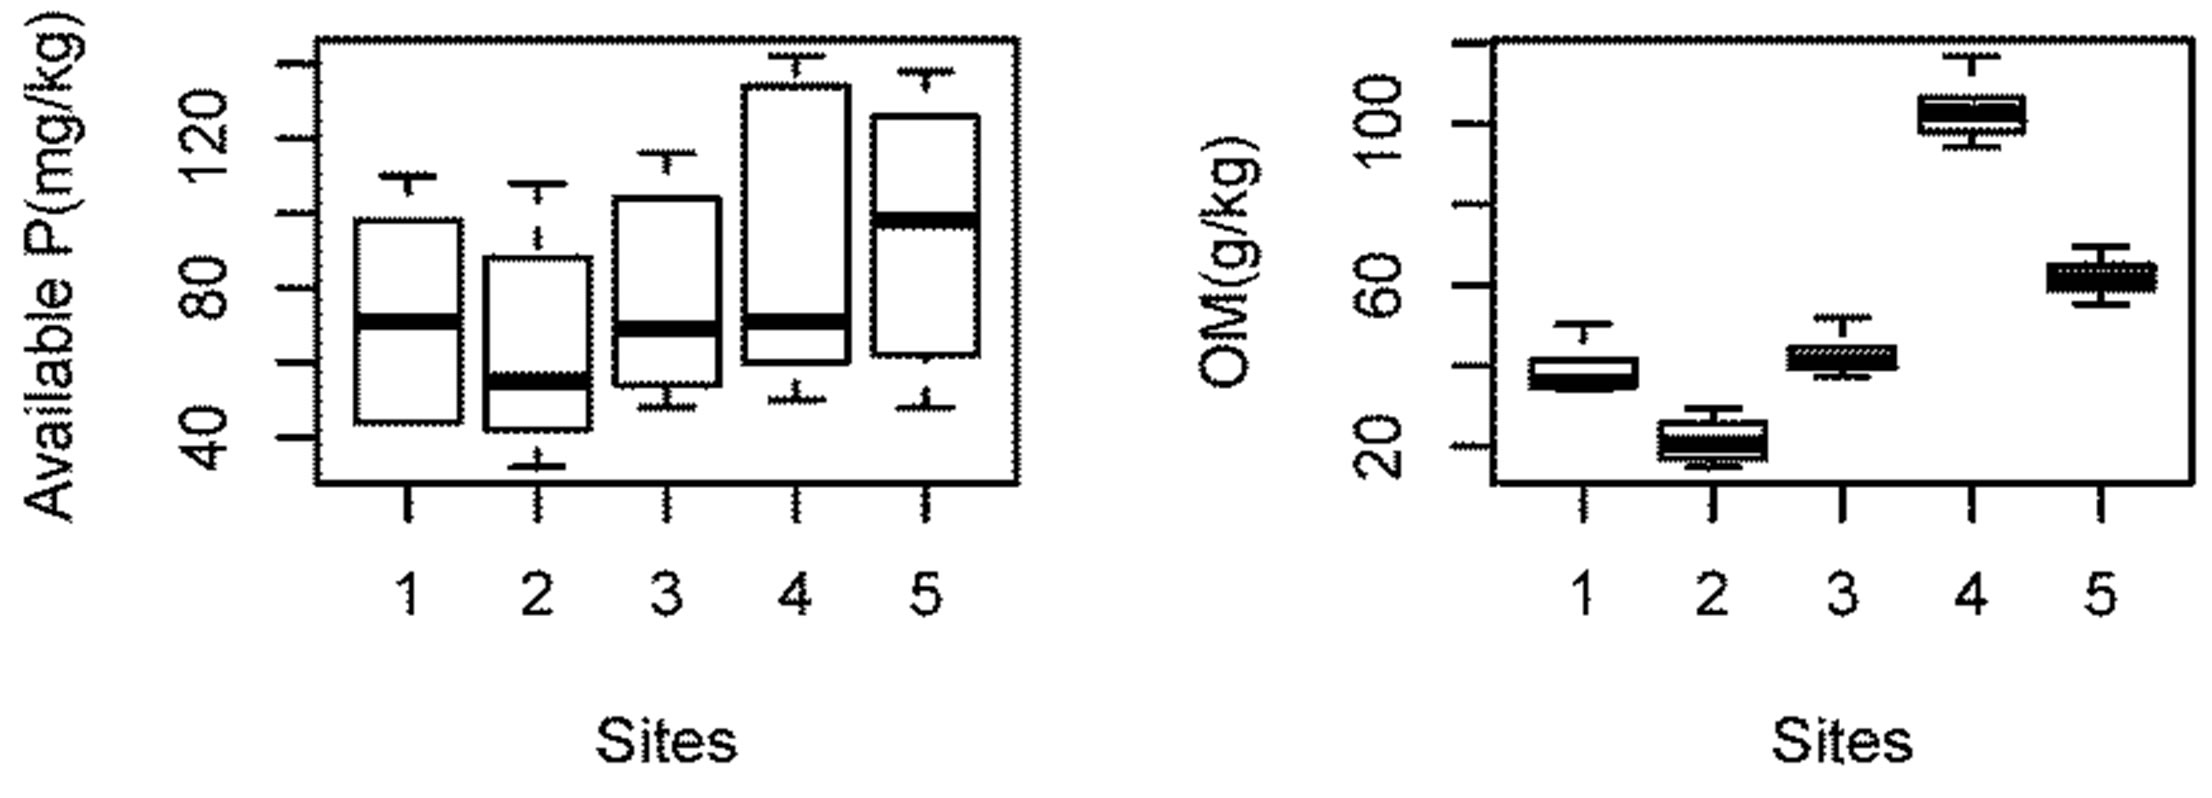
Figure 4. Spatial variation in the properties of underlying sediment in Beeshazar Lake.
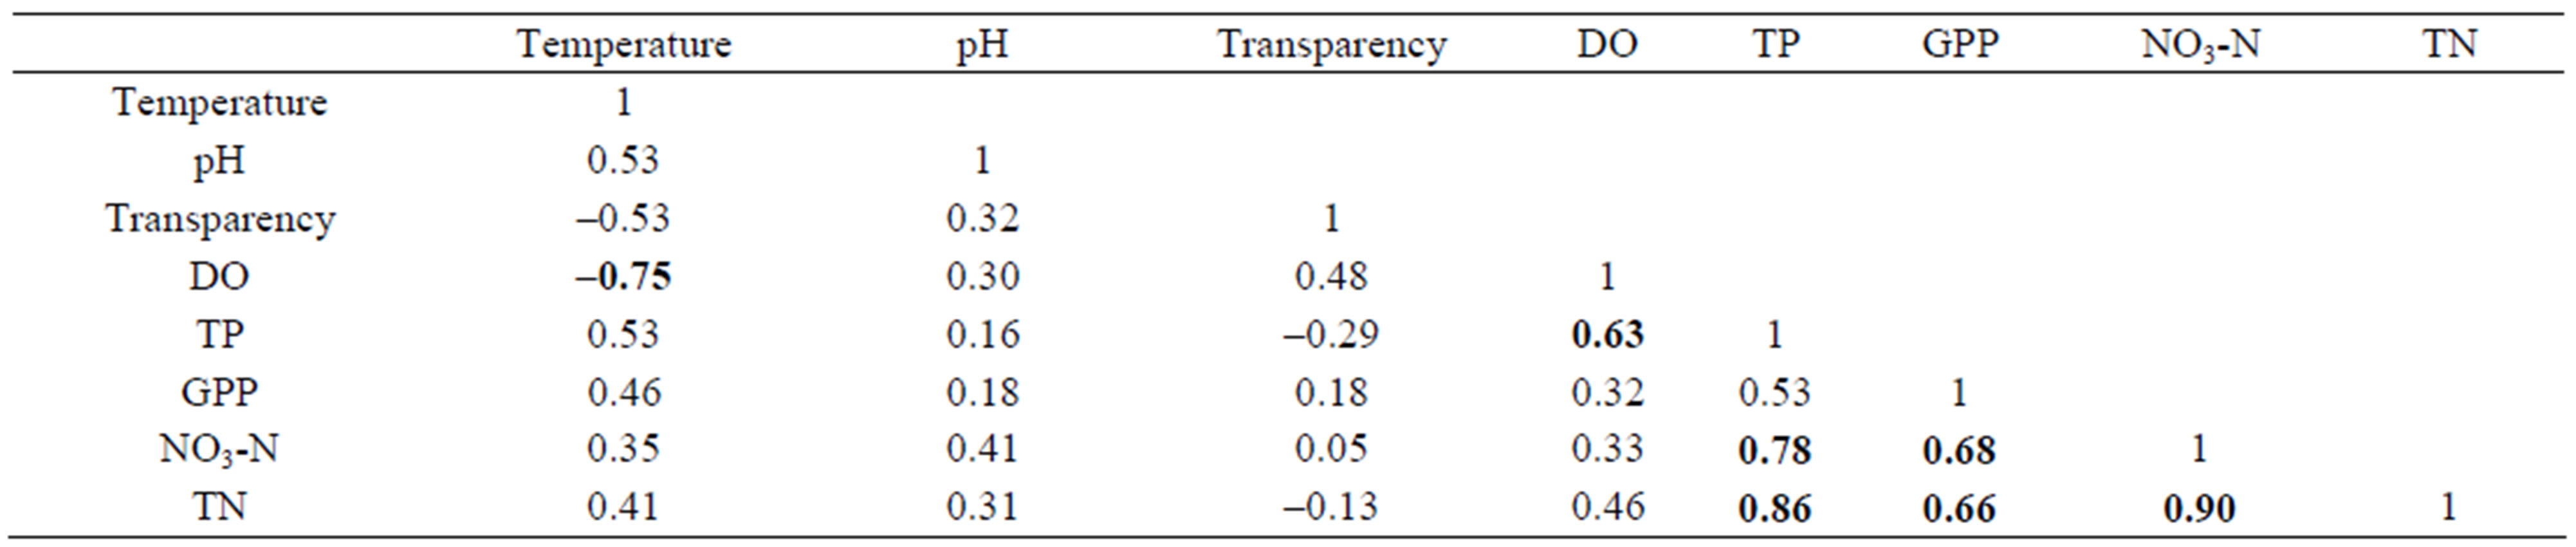
Table 3. Correlation among Water Parameters.
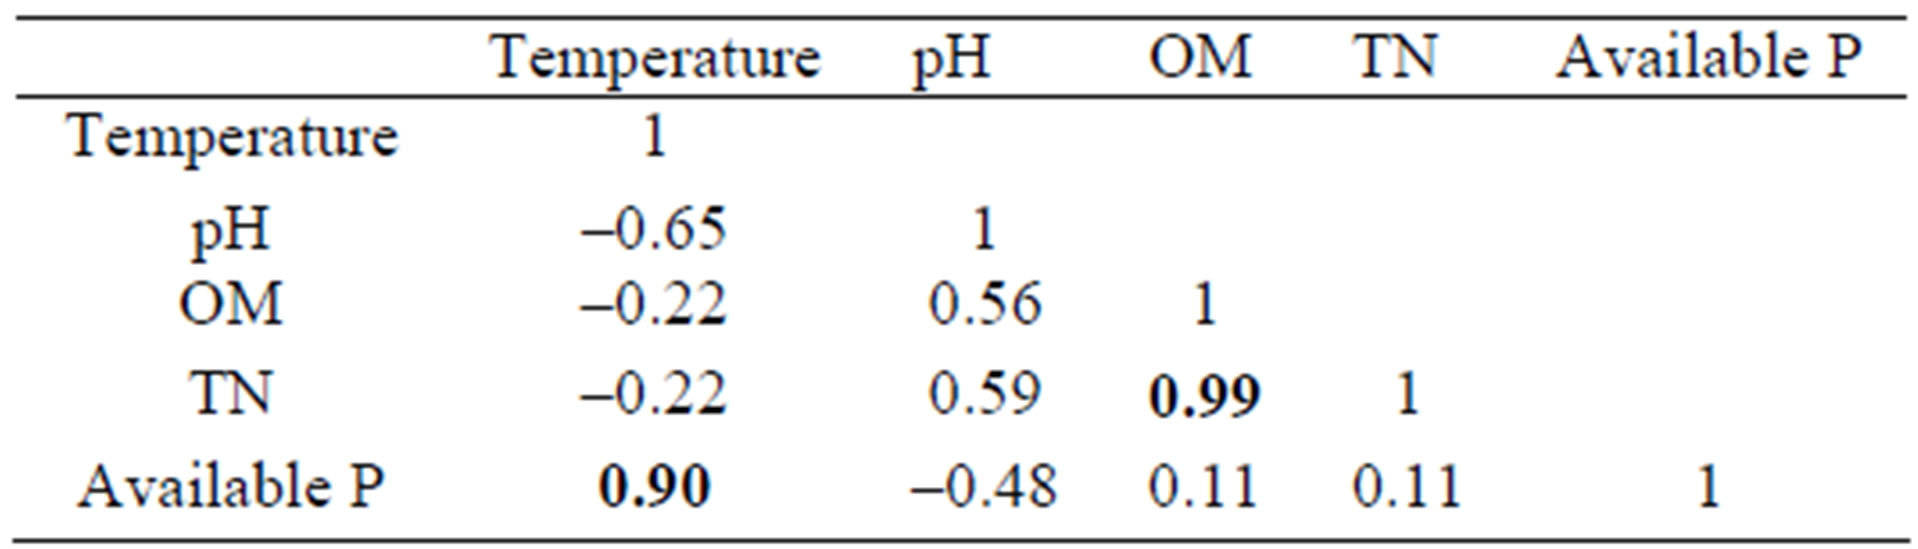
Table 4. Correlation among Bottom Sediments Parameters.
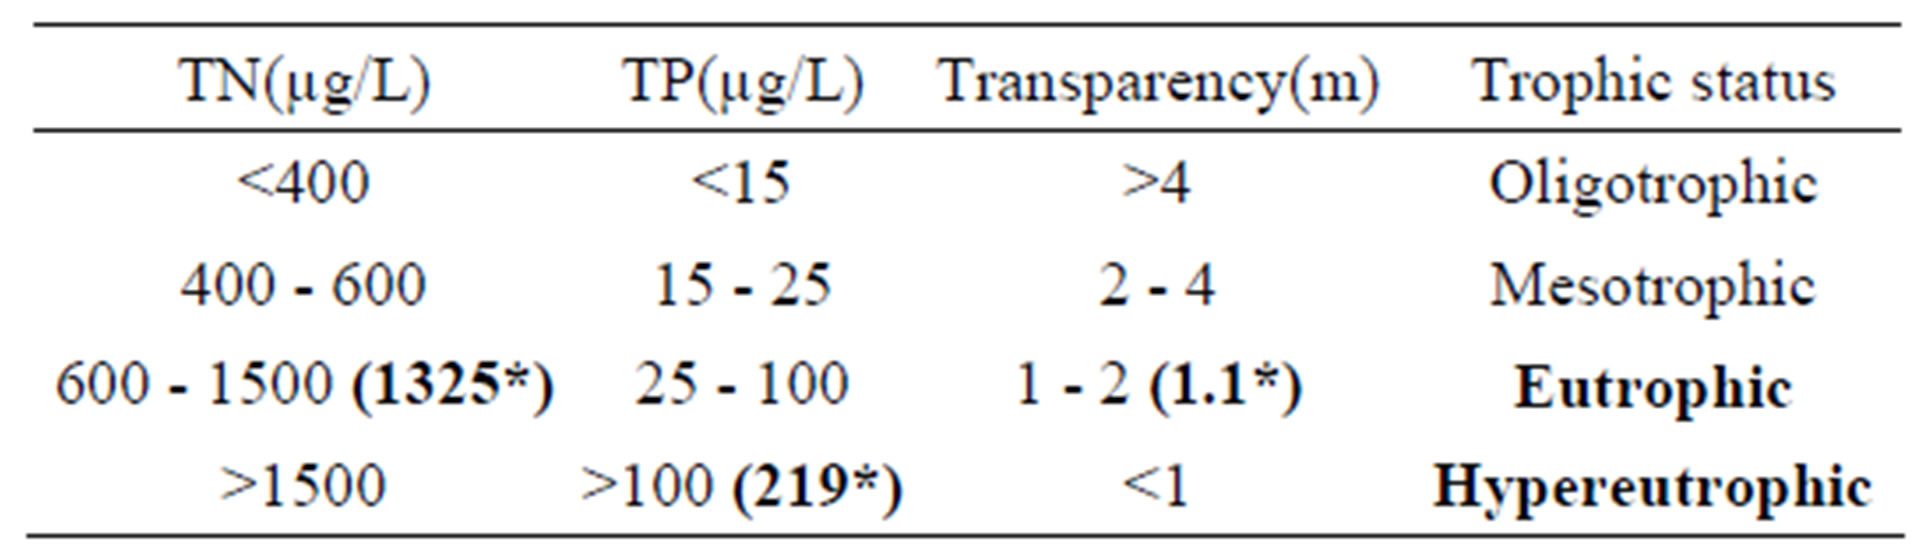
Table 5. Trophic status (Beeshazar Lake) according to Forsberg and Ryding (1980).
rain into the lake. Other possible inputs are from the Khageri canal, which carry water polluted with agricultural fertilizers, pesticides and industrial effluents. Due to the absence of appropriate regulations, most of the industries discharge their effluent directly to the river which feeds the canal without any treatment. Similarly, untreated domestic wastes are also regularly thrown into the river. All these practices are responsible for the low water quality of the lake. Due to the rapid urbanization in the surrounding area, the lake health is expected to be further degraded in the future.
The lack of strong policies for the conservation and management of wetlands in Nepal is another source of the problem for Beeshazar Lake. Although any human activity is prohibited inside the natural park without the special permissions, Beeshazar Lake is located in its surrounded buffer zone, which reduces the possibilities for its protection and management. Therefore, specific policies and personnel are required to ensure its proper management and to comply with the obligations of the Ramsar Convention.
4. Conclusion
Surface water quality and bottom sediments were examined to determine the limnological status of Beeshazar Lake. Water quality in Beeshazar Lake was found unfavorable to aquatic organisms. The lake was found slightly acidic in nature and very low DO concentrations indicated very stressful conditions for aquatic life forms. This is of great concern especially regarding the conservation of critically endangered gharial, vulnerable marsh crocodile, and many other fish species. The lake was found eutrophic in nature by nitrogen and transparency and hypereutrophic by phosphorus criteria. There was no significant difference in temperature, pH, DO, nitrate, TN, and TP among sampling sites. However, transparency and GPP in the deeper part were significantly different than in other sites. Lake sediments were high in organic matter content and nutrient concentrations, indicting a potential nutrient source to the overlying water Also sedimentary OM content and TN concentration were higher in the deepest part while no significant differences were found in sedimentary temperature, pH, and available P. The limnological status of the lake estimated in this study is of critical importance to implement management actions for the conservation and better management of Beeshazar Lake, a wetland of international importance. Future studies should be focused on the determination of nutrient mass balance in the lake to identify the main sources of nutrients and implement adequate management practices for reducing pollution and improving the limnological status of the lake.
5. Acknowledgements
Central Department of Environmental Sciences, TU, Kirtipur, Nepal deserves acknowledgement for providing instruments and laboratory for sample analysis.
REFERENCES
- M. J. Groom, B. K. Meffe and C. R Carroll, “Principles of Conservation Biology,” 3rd Edition, Sinauer Associates, Inc. Publishers, Sunderland, 2006.
- Ramsar Convention Bureau, “The Ramsar Convention on Wetlands of International Importance: An Introductory Ramsar Brochure,” 3rd Edition, 2002. http://www.ramsar.org
- B. Pradhan, “Water Quality Assessment of the Bagmati River and its Tributaries, Kathmandu, Nepal,” M.S. Thesis, Boku-University, Vienna, 1998.
- J. Bratram and R. Ballence, “Water Quality Monitoring: A Practical Guide to the Design and Implementation of Freshwater Quality Studies and Monitoring Programs,” London, 1996.
- A. K. De, “Environmental Chemistry,” 4th Edition, New Age International Publishers, New Delhi, 2000.
- Central Board of Immigration and Power of India, “Aquatic Weeds and Their Control in Water in India,” 1999.
- I. Tuzun and O. Ince, “Relationship between Water Flow Volume and In-Lake Total Phosphorus Concentrations via Dissolved Oxygen Concentrations and Temperature in a Warm Temperate Reservoir: Implications by Path Analysis,” Lakes and Reservoirs: Research and Management, Vol. 11, No. 2, 2006, pp. 83-96. doi:10.1111/j.1440-1770.2006.00298.x
- S. D. Joshi, R. P. Chaudary and P. B. Shrestha, “Wetlands of Kathmandu Valley. Inventory and Management Strategy,” Ministry of Population and Environment, HMG, Nepal, 2001.
- http://www.wetlands.org
- http://www.worldlakes.org/lakedetails.asp?lakeid=10577
- IUCN, “An inventory of Nepal’s Terai Wetlands,” IUCNNepal, Kathmandu, 1998.
- International Conservation Union and Department of National Parks and Wildlife Conservation, “Ramsar Information Sheet,” 2006. http://www.wetlands.org/reports/dbdirect-org.cfm?site-id
- DHM, “Department of Hydrology and Metrology,” Babar Mahal, Nepal, 2005.
- APHA, AWWA and WPCF, “Standard Methods for Examination of Water and Waste Water,” 9th Edition, American Public Health Association, Washington DC, 1995.
- R. K. Trivedy and P. K. Goel, “Chemical and Biological Methods for Water Pollution Studies,” Department of Environmental Pollution, Y. K. College of Science, Karad, 1986.
- G. Kirillin, “FLake-Global: Online Lake Model with Worldwide Coverage,” Environmental Modelling & Software, Vol. 26, No. 5, 2011, pp. 683-684. doi:10.1016/j.envsoft.2010.12.004
- G. R. Wetzel, “Limnology: Lakes and River Ecosystems,” 3rd Edition, Academic Press, San Diago, 1987.
- K. H. Schutte and J. F. Elsworth, “The Significance of Large pH Fluctuation Observed in Some South African Lakes,” Ecology, Vol. 42, No. 1, 1954, pp. 148-150. doi:10.2307/2256983
- UNESCO-IUCN, “Water Quality Assessment in and around Keoladeo National Park, Bharatpur, Rajasthan, India,” Technical Report Number 9, UNESCO-IUCN, 2005.
- http://www.cees.iupui.edu/education/Workshops/Project_Seam/water_quality.htm
- W. Rodhe, “Crystallization of Eutrophication Concepts in Northern Europe,” In: Proceedings of Symposium on Eutrophication: Causes, Consequences, Correctives, National Academy of Sciences, Washington DC, 1969, pp. 50-64.
- W. Kaul and C. L. Trishal, “Ecology and Conservation of the Freshwater Lake of Kashmir,” In: S. D. Misra, D. N. Sen and I. Ahmad, Eds., Evaluation and Conservation of Environment, GEO BIOS International, Jodhpur, India, 1991.
- K. M. O’Dell, J. Van Arman, B. M. Welch and S. D. Hill, “Changes in Water Chemistry in a Macrophyte Dominated Lake before and after Herbicide Treatments,” Lake and Reservoir Management, Vol. 11, No. 4, 1995, pp. 311-316. doi:10.1080/07438149509354212
- United States Department of Agriculture, “Soil Mechanics Level 1. Module 3-USDA Textural Soil Classification Study Guide,” 2006. http://www.wsi.nrcs.usda.gov/products/w2q/H&H/docs/training_series_modules/soil-USDA-textural-class.pdf
- M. Sondergaard, J. P. Jensen, E. Jeppesen and P. H. Moller, “Seasonal Dynamics in the Concentrations and Retention of Phosphorus in Shallow Danish Lakes after Reduced Loading,” Aquatic Ecosystem Health and Management, Vol. 5, Vol. 1, 2002, pp. 19-29. doi:10.1080/14634980260199936
- P. D. Sharma, “Ecology and Environment,” 7th Edition, Rastogi Publications, Meerut, India, 1999.
- C. J. Watts, “The Effects of Organic Matter on Sedimentary Phosphorus Release in an Australian Reservoir,” Hydrobiologia, Vol. 431, No. 1, 2000, pp. 13-25. doi:10.1023/A:1004046103679
- Q. Hu, J. Song, L. Dong, Z. Li and Y. Zhu, “Effects of pH and Eh on Nitrogen and Phosphorus Release from Sediments of West Lake,” Proceedings of the Ninth International Conference on the Conservation and Management of Lakes, ILEC, Shiga, 2001.
- O. A. Diaz, K. R. Reddy and P. A. Moore, “Solubility of Inorganic P in Stream as Influenced by pH and Calcium Concentration,” In: W. J. Mitsch, Ed., Global Wetlands, Old and New, Elsevier Science B.V., USA, 1994.
- UNEP, “Planning and Management of Lakes and Reservoirs, an Integrated Approach to Eutrophication,” International Environmental Technology Center, Osaka/Shinga, 1999.
- P. Harremoejs, “The Challenge of Managing Water and Material Balances in Relation to Eutrophication,” Water Science and Technology, Vol. 37, No. 3, 1998, pp. 9-17. doi:10.1016/S0273-1223(98)00051-1
- M. V. Martinova, “Nitrogen and Phosphorus Compounds in Bottom Sediments: Mechanisms of Accumulation, Transformation and Release,” Hydrobiologia, Vol. 252, No. 1, 1993, pp. 1-22. doi:10.1007/BF00000124
- S. M. Banerjea, “Water Quality and Soil Condition of Fish Pond in Some State of India in Relation to Fish Production,” Indian Journal of Fish, Vol. 14, No. 1, 1967, pp. 115-144.
- C. Forsberg and S. O.Ryding, “Eutrophication Parameters and Trophic State Indices in 30 Swedish Waste Receiving Lakes,” Achieves of Hydrobiology, Vol. 89, No. 1-2, 1980, pp. 189-207.