Journal of Water Resource and Protection
Vol.4 No.4(2012), Article ID:18419,23 pages DOI:10.4236/jwarp.2012.44021
Seasonal Dynamics of Nutrient Loading and Chlorophyll A in a Northern Prairies Reservoir, Saskatchewan, Canada
1School of the Environment & Sustainability, University of Saskatchewan, Saskatoon, Canada
2Toxicology Centre, University of Saskatchewan, Saskatoon, Canada
3Division of Environmental Science and Ecological Engineering, Korea University, Seoul, Korea
4Department of Veterinary Biomedical Sciences, Toxicology Centre, University of Saskatchewan, Saskatoon, Canada
5Department of Zoology, and Center for Integrative Toxicology, Michigan State University, East Lansing, USA
6Zoology Department, College of Science, King Saud University, Riyadh, Saudi Arabia
7Department of Biology & Chemistry, City University of Hong Kong, Hong Kong, China
8Institute of Loess Plateau, Shanxi University, Taiyuan, China
9Korea Ocean Satellite Centre, Korea Ocean R&D Institute, Ansan, Korea
Email: *lisuqing@sxu.edu.cn, markus.hecker@usask.ca
Received November 14, 2011; revised December 18, 2011; accepted February 7, 2012
Keywords: Cyanobacteria; Toxic Algae Eutrophication; Prairie Ecozone; Satellite Imaging; Phophorous; Nitrogen; Monitoring; Bloom
ABSTRACT
Harmful algae blooms have become an increasing concern in context to the safety of water resources around the globe; however, little is known about the dynamics and specific causes of such blooms in the prairie ecozone in North America. The aim of this study was to research the nitrogen (N) and phosphorous (P) content and nutrient limitation (defined as N and P limitation) of growth of cyanobacteria in a northern prairies reservoir (Lake Diefenbaker [LD], SK, Canada). A combination of concentration balance analysis for N and P, controlled bioassays with the natural consortium of phytoplankton or defined monocultures of cyanobacteria, and satellite imagery was applied to address this aim. The current trophic status of Lake Diefenbaker is one of moderate eutrophication. Primary production in the lake is P-limited, and N did not represent a limiting factor for algal production. There was no significant increase in TP concentrations between the upper and lower portions of the reservoir, indicating that most of the phosphorus in LD comes from upstream sites in Alberta. Anabaena circinalis, a species that has the potential to seriously degrade lake ecosystems, was identified as the predominant cyanobacteria in LD. Together with the fact that total P (TP) influxes into the reservoir primarily originate from upstream sources, these results suggest the need for remedial measures in the upstream reach of the South Saskatchewan River. Satellite imaging represented a promising approach in support of monitoring for potential algal blooms in LD; however, due to limited sensitivity and issues associated with atmosphere interference this methodology should only be used in combination with in situ water quality monitoring. In summary, while this study indicated that Lake Diefenbaker is potentially at risk from blooms with cyanobacteria (some of which such as Anabena sp. that can produce toxins) during late summer and fall, development of clear causal relationships and risk assessment strategies is currently limited due to lack of monitoring data and programs.
1. Introduction
Intensification of agricultural and industrial activities and increases in population over the past century have led to significant eutrophication of surface waters around the world, including in Canada [1]. One concern in context with such eutrophication is development of harmful cyanobacteria blooms and associated toxins, which represent a threat to drinking water sources such as lowland rivers, lakes, and reservoirs [2,3]. Water bodies in the prairie ecozone of Canada are particularly at risk to such algal blooms because of phosphorus-rich soils, intense agricultural use and more intense solar irradiances [4]. One aquatic prairie ecosystem of concern in this context is the South Saskatchewan River (SSR), which flows across southern Alberta and then into southern Saskatchewan has been identified as one of Canada’s most threatened rivers [5]. Approximately 67% of the catchment area of the SSR is used for agriculture, which results in significant influxes of nutrients and pesticides [6]. In addition, most of the volume of water in the SSR originates in the Rocky Mountains and is formed by the Oldman, Bow and Red Deer Rivers, with relatively less water originating on the prairies [7].
Lake Diefenbaker (51˚1'53"N, 106˚50'9"W) is a multipurpose reservoir on the SSR, which is formed by the construction of Gardiner Dam and Qu’Appelle River Dam across the SSR and Qu’Appelle Rivers, respectively. The lake is 225 km long with approximately 800 km of shoreline and a surface area that reaches approximately 500 km2 with a mean depth of approximately 33 m and a maximum depth of 66 m. Lake Diefenbaker provides water for domestic irrigation and municipal use for approximately 75% of the Saskatchewan population of more than one million people, and allows for regulation of flow of the South Saskatchewan and Qu’Appelle rivers, while providing hydro-electric power [8]. Approximately 75% of the drainage to Lake Diefenbaker is in Alberta [9]. The inflowing rivers also receive irrigation return flows and municipal and industrial effluents. In Alberta, upstream of Lake Diefenbaker, the watershed contains urbanized areas, including Calgary, Red Deer, Medicine Hat, and Lethbridge, intense agricultural lands and feedlots. In fact, it is estimated that over 80% of the population living in the South Saskatchewan River basin are in Alberta [10]. As a result, significant amounts of nutrients, primarily nitrogen (N) and phosphorous (P), and contaminants are released into the river, which can affect water quality. Riparian and in-lake activities represent additional sources of nutrients to Lake Diefenbaker from domestic sewage of small communities that use lagoons for treating the sewage, agriculture, and fish farming.
Even though Lake Diefenbaker is a critical water resource for a large portion of the Western Prairie Region of Canada there is little information on its limnology and in particular the status and trends of nutrients, specifically N and P. While Lake Diefenbaker is representative of other reservoirs in similar eco-regions, it has unique characteristics and properties. It is characterized by some embayments that are deeper than 20 m and an annual fluctuation of water level that is approximately 6 m. A thermocline forms at approximately 25 m, but this is infrequent and dependent on discharge of the SSR. Stratification does not occur throughout the lake and there is little water exchange between embayments and the main channel. While the current status of concentrations of N and P in Lake Diefenbaker is comparable to that reported in other studies to support blooms of cyanobacteria [11- 13], due to the lack of continuous monitoring programs and research efforts, no information on historic blooms with one exception are available for this reservoir. This exception was the report of a bloom of cyanobacteria that occurred in the southern and western parts of the reservoir during fall 2007 [14].
P and N are commonly considered as the limiting nutriaents for phytoplankton production, and particularly availability of P has been hypothesized as the critical factor in contest with freshwater cyanobacteria blooms [15-17]. However, a number of studies that investigated the correlation between N and P and cyanobacteria or phytoplankton abundance have not always found clear relationships between these two nutrients and algal biomass. In fact, algal growth and abundance also depends on the availability of additional micronutrients, particularly Fe but also trace amounts of Mo, Mn and Cu [18-20]. The relevance of Fe becomes obvious if one considers that the two most energy-demanding systems in the cell, photosynthetic carbon reduction and nitrogen reduction, are heavily dependent on Fe-containing compounds. Particularly, Fe serves a crucial role in electron transfer reactions and in enzymes. In addition to Fe, other trace elements such as Cu and Mn also represent essential micronutrients at very low concentrations. However, they become toxic, particularly to cyanobacteria, at greater concentrations (i.e. in the micromolar range) [18]. Finally, a number of other environmental factors such as altered temperature and irradiance (e.g. as a consequence of climate change) and hydrological processes have been hypothesized to significantly influence phytoplankton/cyanobacteria blooms in freshwater and marine environments [17,21].
The goal of this study was to elucidate the nutrient (N, P and other micronutrients including Fe and Mn) content and nutrient limitation of growth of primary production, particularly of cyanobacteria, in Lake Diefenbaker, as the primary local source of water, but also as a model for reservoirs and lakes with comparable hydro-ecology in the western prairies of Canada. Information was collected to conduct a rudimentary concentration balance for nitrogen and phosphorus. Specifically, the question of relative contributions from upstream and in the vicinity of the lake was addressed. In addition, to determine the limiting factors (N and/or P), bioassays were conducted with either the natural consortium of phytoplankton or defined monocultures of cyanobacteria, including Anabaena sp. Satellite imagery was investigated to determine its potential use to quantify the distribution of chlorophylls in Lake Diefenbaker to determine the extent of blooms of algae and cyanobacteria in space and time. Furthermore, models and assessment tools, based on basic water quality parameters, N and P loads, and satellite imaging, were developed to aid in prediction and assessment of algal blooms in prairie lakes.
2. Methods
2.1. Sampling and Field Measurements
Based on the basic information and the characteristics of topography, size, shape, depth, and flow velocity, etc., seven sampling sites in Lake Diefenbaker were selected (Figure 1). Water was collected monthly from June to October 2008. Sampling was conducted between 10 am and 6 pm based on weather conditions [22]. Except for collections at the outflow, downstream of Gardner Dam (site 7), where only surface water was collected, the sampling site was located by GPS and 3 stratified water samples were collected according to depth as follows: 1) Surface: water surface at a depth of 0.5 m; 2) Mid-depth; and 3) Bottom: 0.5 m above the bottom. A total of 81 samples were collected for nutrient analyses during the surveys.
Parameters measured directly in the field included temperature, depth, pH, conductivity (Cond.), turbidity, chlorophyll a (Chl-a), total dissolved solids (TDS), salinity, and dissolved oxygen (DO) by means of a Hydrolab Data Sonde DS5 (OTT, Chesterfield, UK). Additional samples of water were collected, maintained at 4˚C, and immediately shipped to the laboratory for analysis of nutrients as well as organic and inorganic constituents (Supplemental Materials, Table S1).
2.2. Quantification of Nutrients and Inorganic and Organic Constituents
Upon arrival at the laboratory (wet chemistry and analytical lab of the Toxicology Centre, University of Saskatchewan) water samples were immediately analyzed for alkalinity, hardness, nitrate ( ), nitrite (
 ), orthophosphate (
 ), total phosphorous (TP), total nitrogen (TN), sulfate (
 ), chloride (Cl–), chemical oxygen demand (COD), total iron (Fe3+), manganese (Mn2+), and algal abundance of algae. Quantifications of the various parameters were made according to standard methods (Supplemental Materials, Table S1). Method detection limits (MDLs) were established for all analytes by use of reagent water (blank) fortified at a concentration of 3 - 5 times the estimated instrument detection limits (or MDLs). The ionfortified reagent water samples were used for determination of MDLs as follows: 20 μg
  /L (parts per billion; ppb), 24 μg
  /L, 24 μg
  /L, and phosphate 60 μg
  /L. Any sample containing the above concentrations of ions went through the entire analytical process with 7 replicates done in three separate days. Concentrations of ions were reported as the mean and standard deviation (SD).
Chl-a concentrations were quantified both in samples collected in the field and during the controlled bioassays following the spectrophotometric methods described by Lorenzen [23] and Jeffrey & Humphrey [24] with modifications as described in US-EPA Method 445.0 [25]. Specifically, we used a set of narrow bandpass excitation and emission filters (Turner Designs, Sunnyvale, CA; excitation filter 436FS10; emission filter 680FS10) that nearly eliminate the spectral interference caused by the presence of Pheo-a and Chl-b, and which has been previously validated and accepted by the US-EPA (EPA 1997). Briefly, phytoplankton were concentrated by filtering at low vacuum through a 0.7 μm glass fiber filter, and pigments were extracted from phytoplankton in to
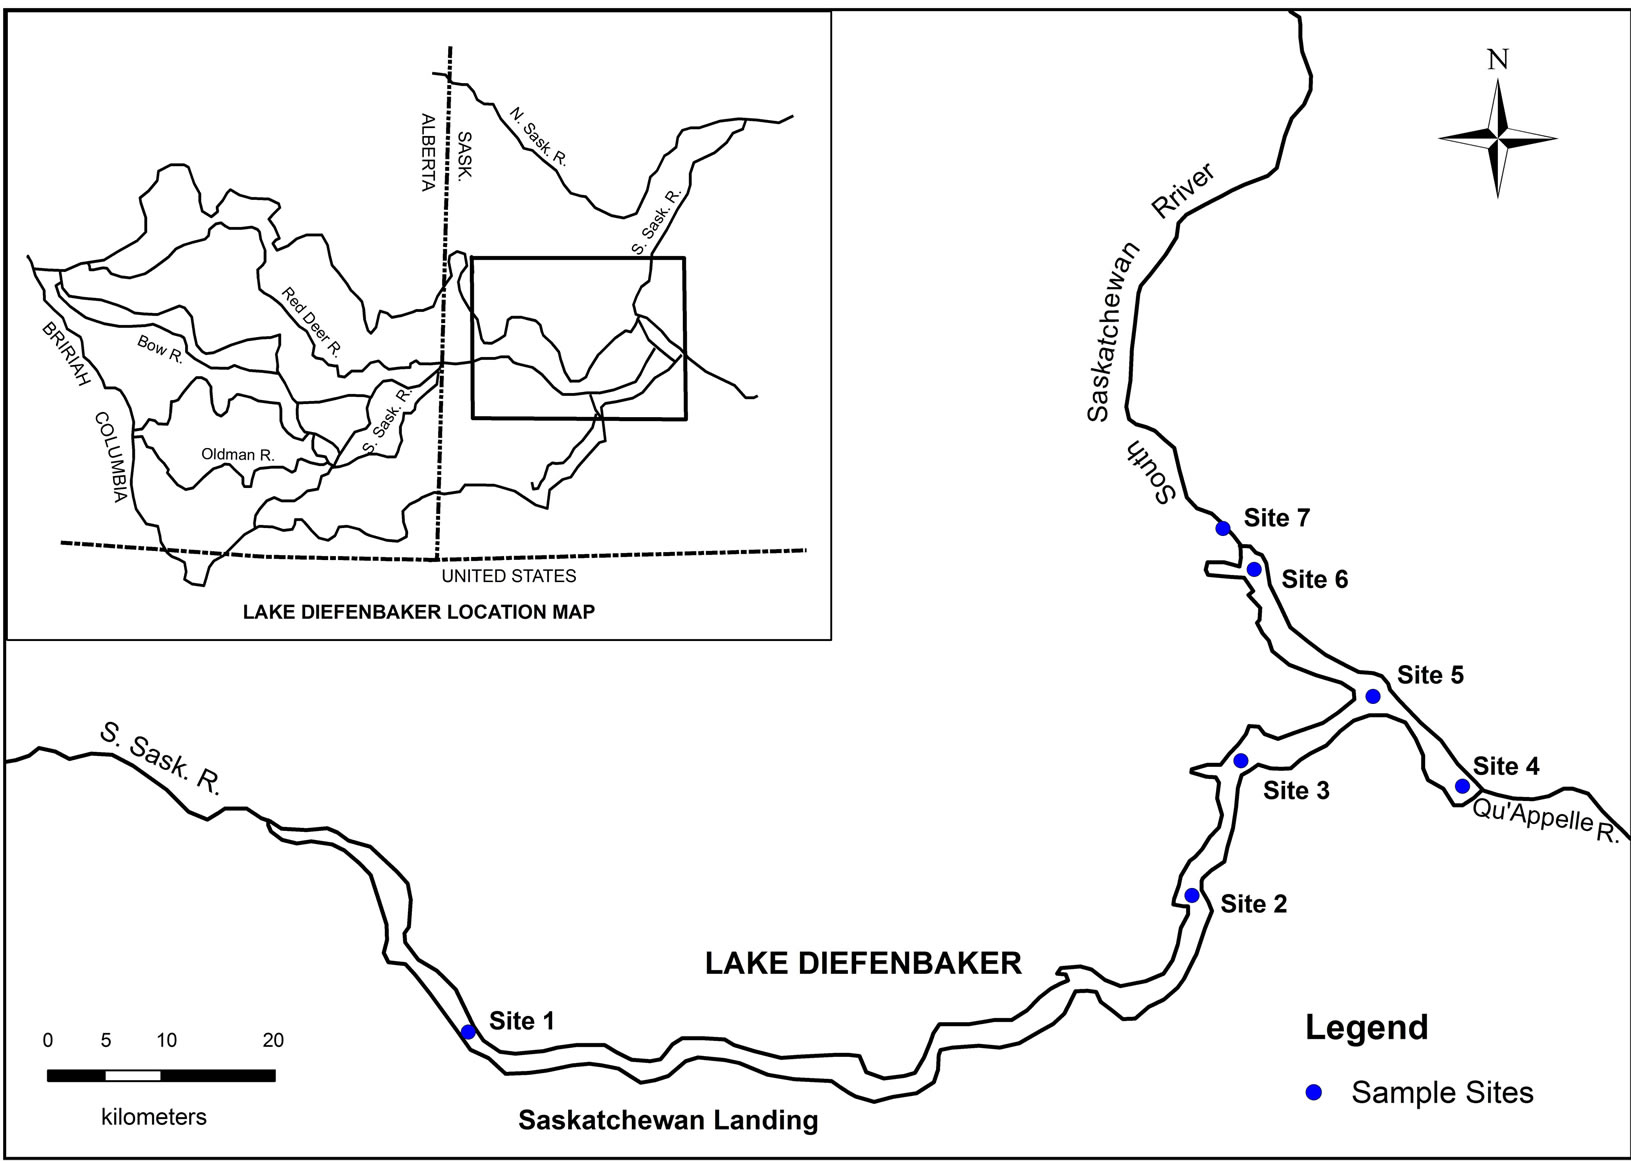
Figure 1. Map of Lake Diefenbaker depicting sampling sites.
90% acetone with the aid of a mechanical tissue grinder and allowed to steep for a minimum of 2 h. The filter slurry was then centrifuged at 675 × g for 15 min and an aliquot of the supernatant was transferred to a glass cuvette. Fluorescence was measured before and after acidification to 0.003 N HCl with 0.1 N HCl using a Turner Designs Model 10 Series fluorometer.
2.3. Bioassays
Bioassays were conducted in the laboratory to determine the limiting factors for growth of cyanobacteria. Bioassays were performed with three different waters from Lake Diefenbaker. The experimental design for bioassays was a 5 × 5 full factorial design with 3 replicates to test for the effects of N (as KNO3) and P (KH2PO4) individually and in combination. Five concentrations of both N (0.00, 0.25, 0.50, 1.00 and 2.00 mg N/L) and P (0.00, 0.0125, 0.025, 0.05 and 0.10 mg P/L) were tested. Concentration ranges were such that they bracketed average concentrations of nitrite,  and
and  (
( ) of 0.0164, 1.013 and 0.0124 mg/L, respectively, that were measured in lake water during the field portion of the studies. One treatment was the control to which no N or P was added. Thus, there were a total of 75 flasks (25 treatment combinations with 3 replicates each). The five concentrations of N and P were selected in combination for nutrient addition (Supplemental Materials, Table S2). Bioassays were conducted either with consortia of plankton or with filtered water F and flasks were inoculated with either a single species of cyanobacteria or a consortium of cells isolated from Lake Diefenbaker water. Qualitative microscopical analysis revealed five algal species in surface and mid water of Lake Diefenbaker sampled on September 29 and 30, 2008 (Figure 2). At site 4, for which a cyanobacteria bloom was reported in October 2007, the dominant algae species was Anabena circinalis in surface water. Furthermore, Woronichinia naegeliana at this location and in surface and middle layer lake water at site 5. None of the other sites (1, 2, 3, 6 and 7) contained these species. Furthermore, three unidentified species occurred at most of the locations. While no quantitative assessments of algal abundance at the laboratory were made due to lack of appropriate sample preservation, the qualitative assessment indicated that Anabaena sp. was the dominant algal species.
In the first study with a natural consortium of phytoplankton from Lake Diefenbaker, a volume of 150 mL surface water was collected at site 4 and placed into 250 mL Erlenmeyer flasks. Phytoplankton was identified and enumerated initially and concentrations of chlorophyll a were determined at the beginning of the experiment and then every few days until the assay was terminated. Cultures were incubated for 14 d at 26˚C, under 2000-lux lighting on a 12:12 light:dark cycle. Flasks were shaken by hand twice a day. Three replicate samples and blanks were taken as the quality control.
In the second study with the species of Anabaena sp., a volume of 150 mL filtered and autoclaved lake surface water collected at site 5 was placed into 250 ml Erlenmeyer flasks. At the beginning of the experiment the number of Anabaena sp. cells was determined and the concentration of chl-a was determined. An initial cell density of 1.0 × 10⁴ per ml Anabaena sp. was used and N and P were added to each flask. The culture and experimental conditions were the same as those of the first bioassay.
2.4. Satellite Imaging of Cyanobacteria Blooms
Satellite images of Lake Diefenbaker were obtained and analyzed to determine the overall spatial distribution of algal and/or cyanobacteria biomass, as measured by spectral reflection of chlorophylls. A total of five scenes of MODIS (http://modis.gsfc.nasa.gov/; Supplemental Materials, Tables S3-S6 and Figure S1) matched with in situ measurements of chlorophyll were collected. Therefore, further analyses of the available image data were conducted to develop predictive relationships between spectral radiance imaging and distributions of concentrations chlorophyll within Lake Diefenbaker.
Because the spatial resolution within MODIS is only km, the algorithm to relate concentrations of chlorophyll from spectral radiance within MODIS was not applied Alternatively, MODIS bands 1 & 2 with spatial resolution of 250 m were used. These bands cannot be used to specifically predict concentrations of chlorophyll, but rather give an indication of Vegetation Index (VI). Thus, the VI was used as a surrogate and has been applied to indirectly estimate the spatial distribution of algal biomass. Two VIs were applied in this study, first the Normalized Difference Vegetation Index (NDVI) [36], which is defined as the normalized difference of brightness values indicating relative distribution and activity from the satellite image (Equation (1)).
 (1)
(1)
where ρnir and ρred represent the spectral reflectance measurements acquired in the near-infrared and visible (red) regions, respectively. MODIS NDVI was processed as described in the following steps (Equation (2)).
1) Use band 1 and 2 having 250 m spatial resolution for detecting green algae;
2) Reflectance data was of limited use owing to over exclusion for the atmospheric correction;
3) Use radiance data instead of the reflectance data.
 (2)
(2)
The second index applied was the Transformed Vege-

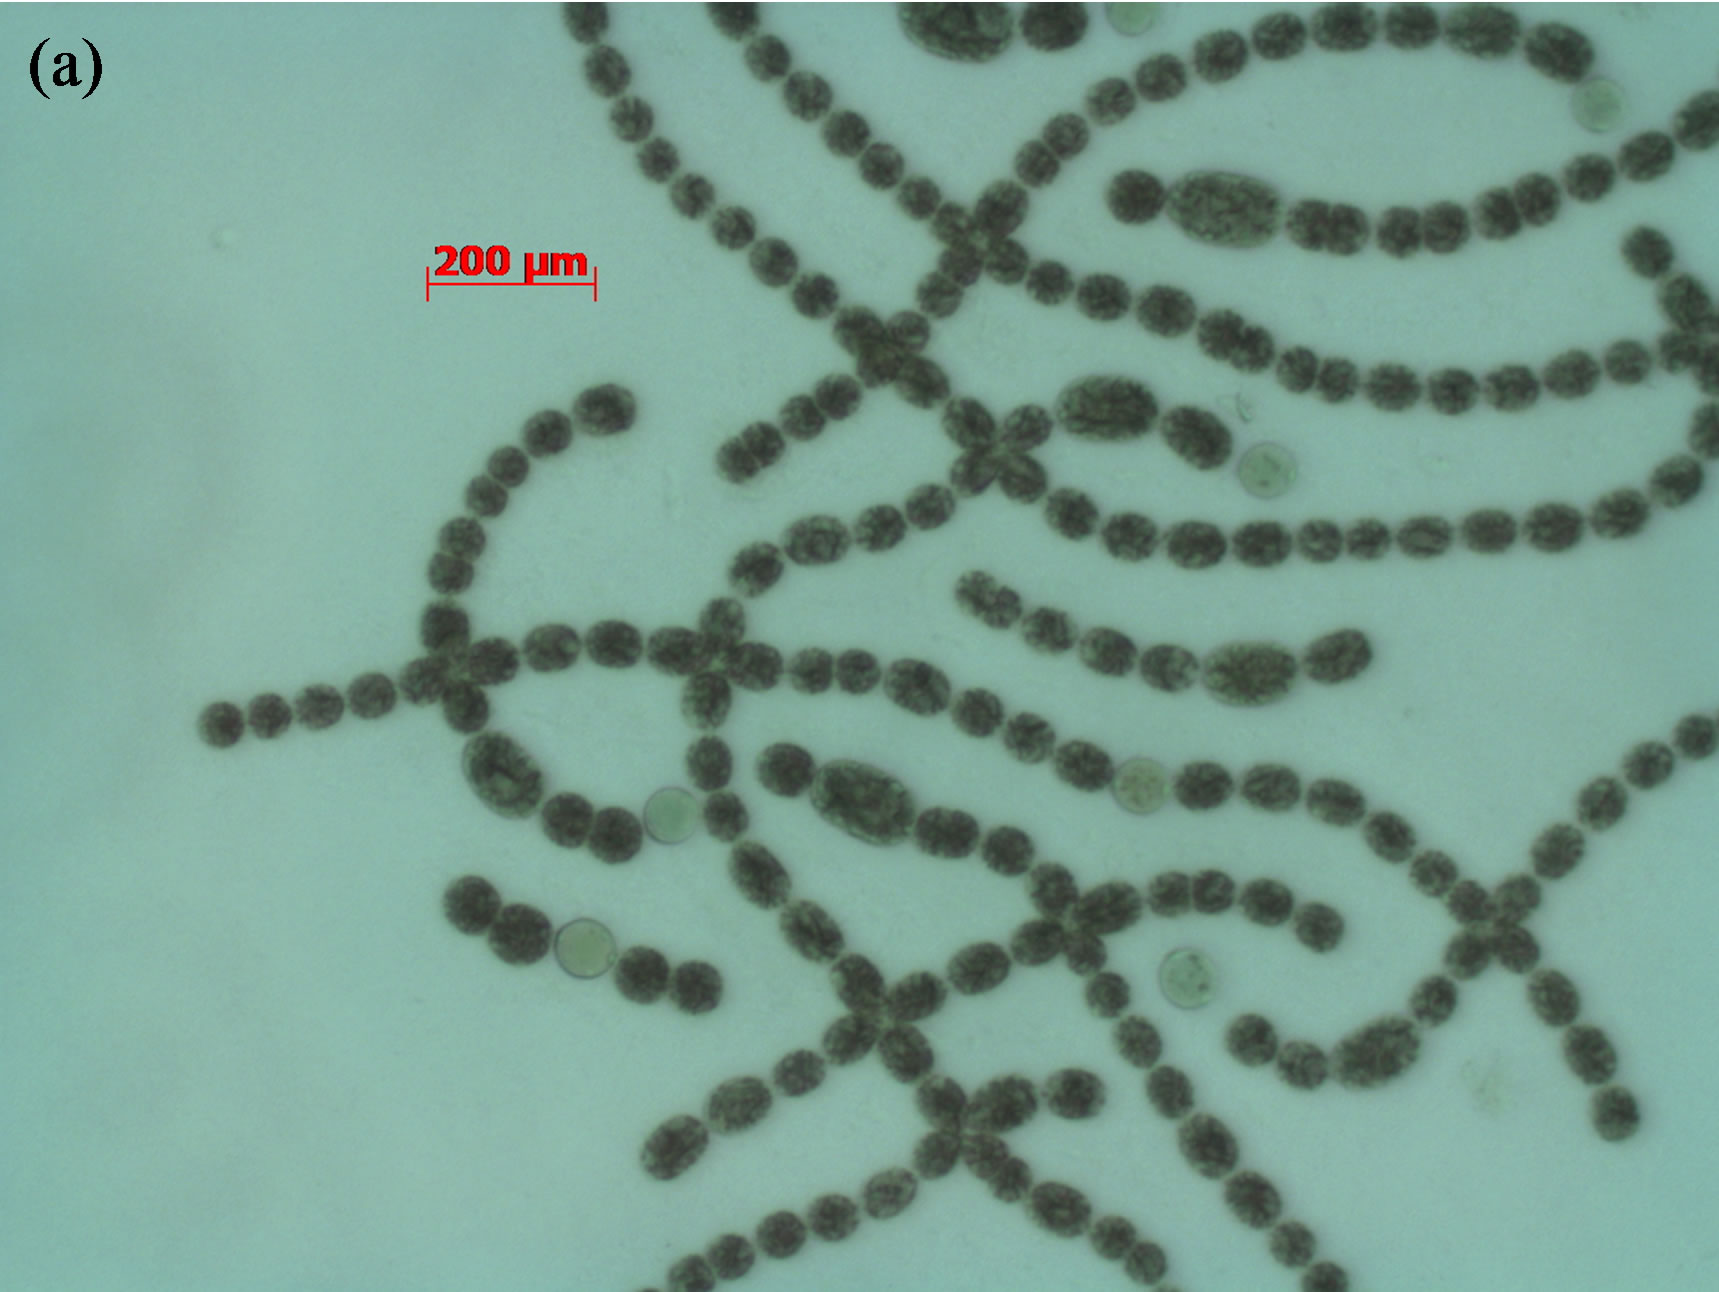
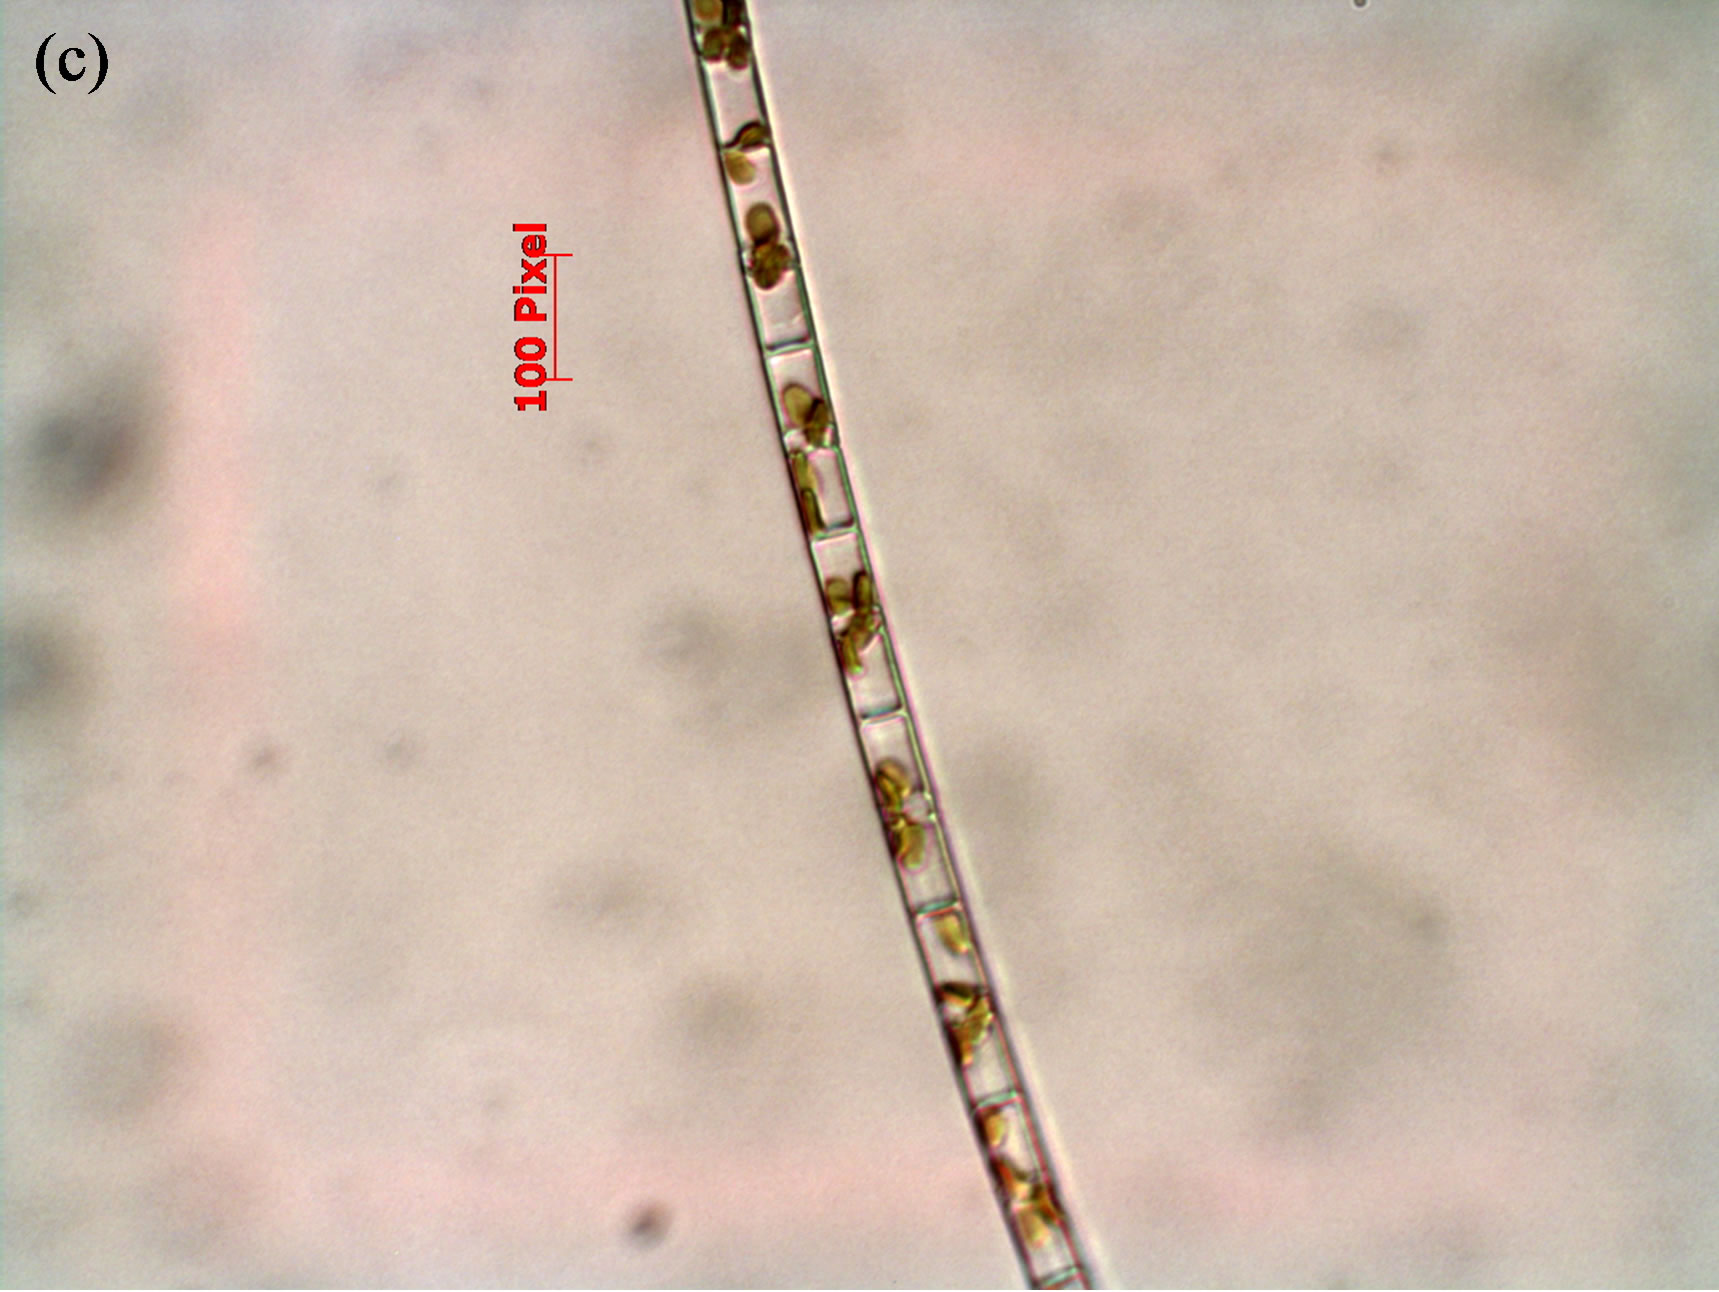
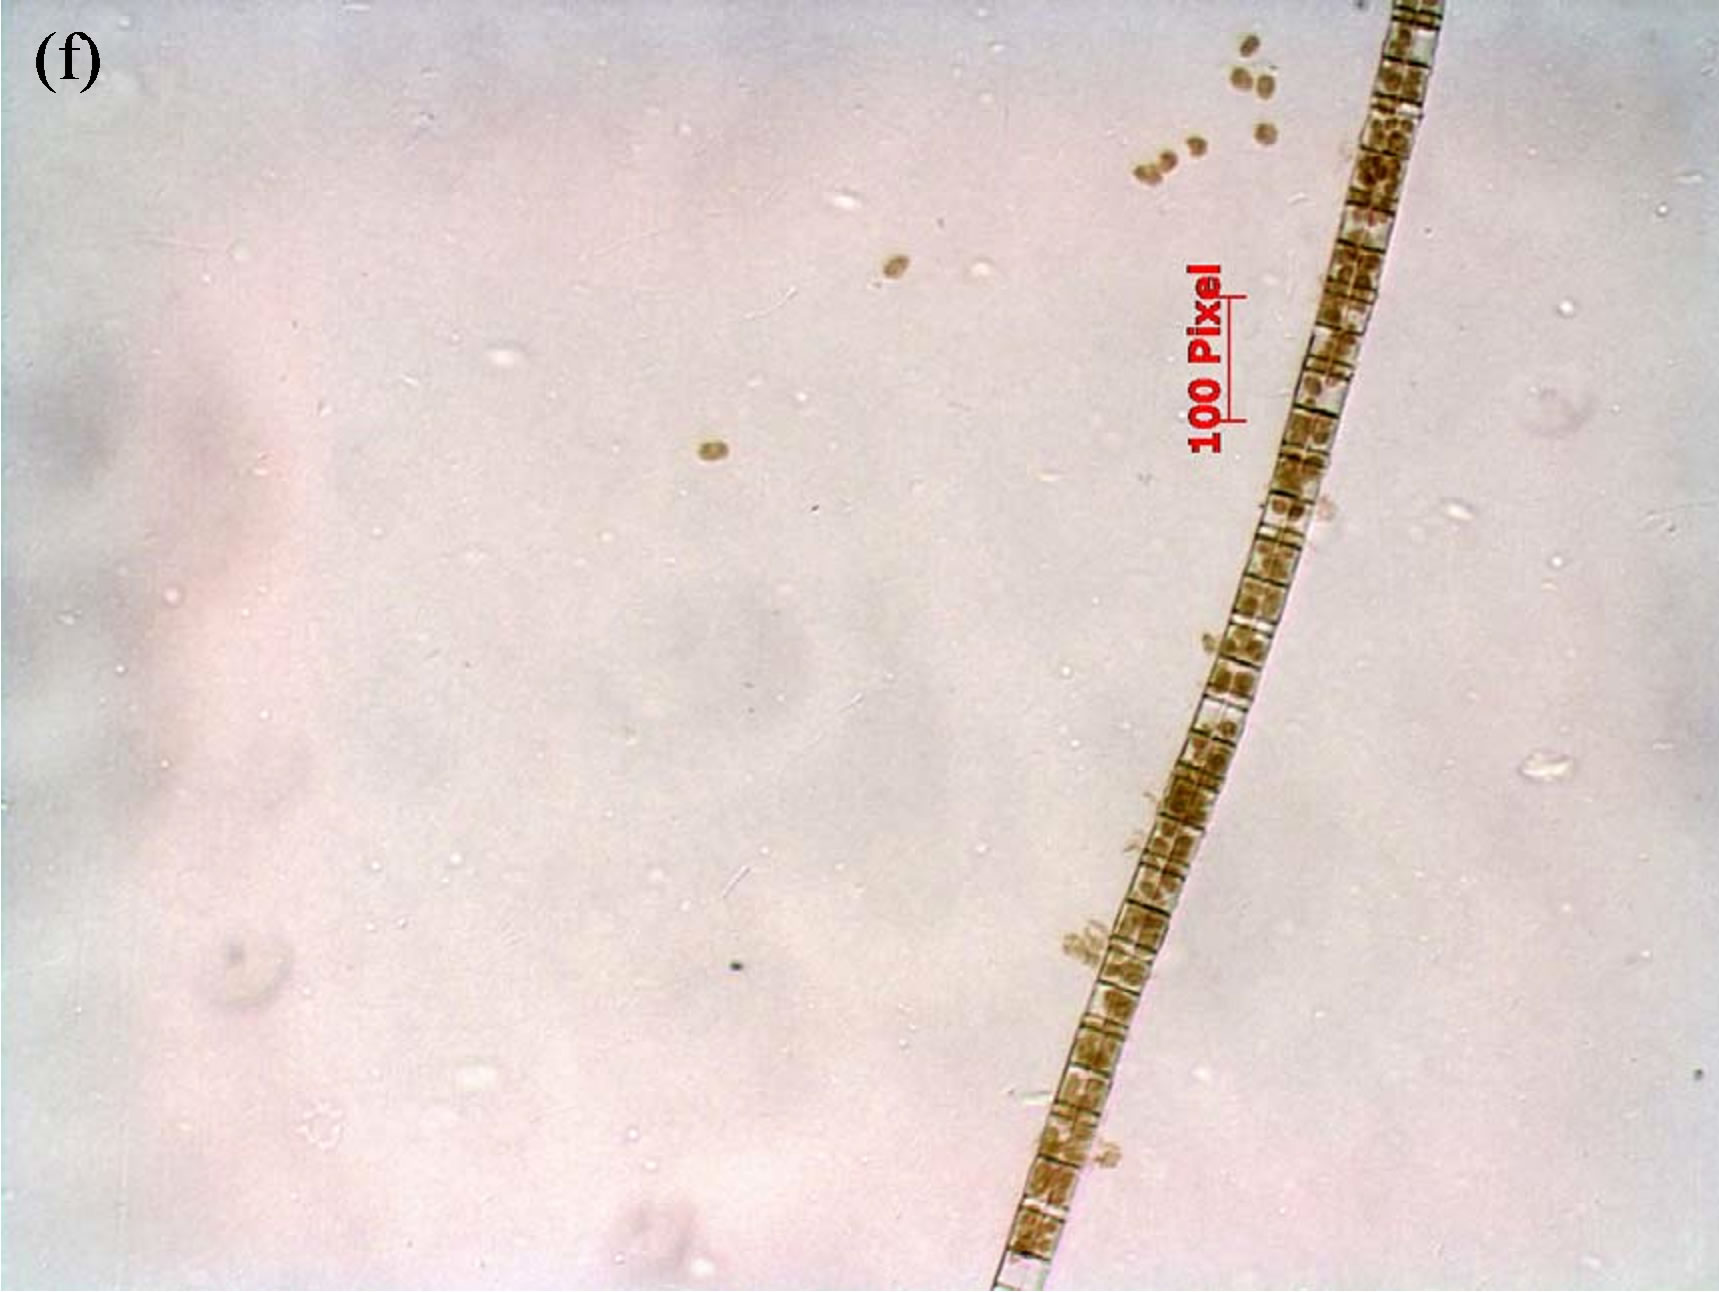
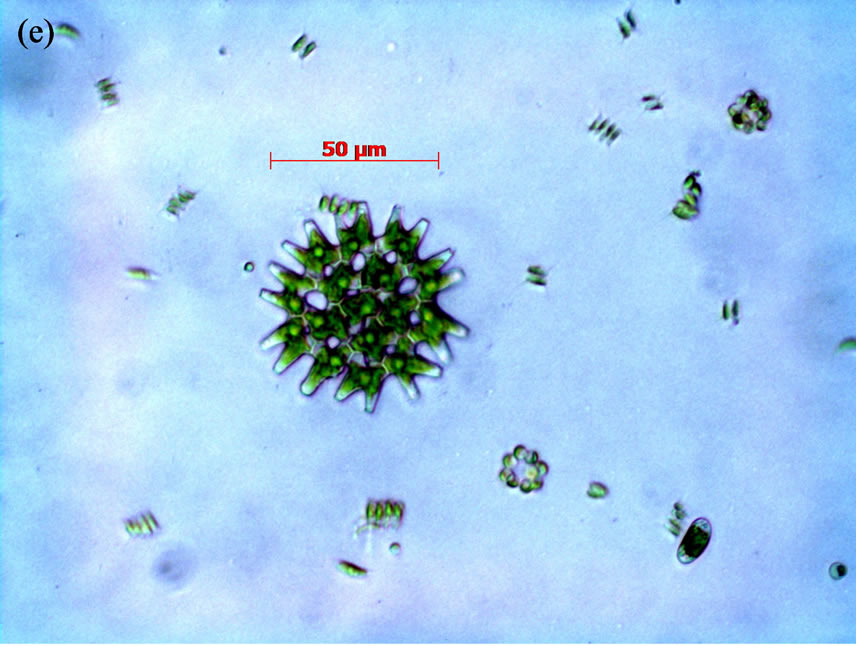
Figure 2. Phytoplankton species identified in Lake Diefenbaker surface water collected on September 29/30, 2008, by means of quailtative light microscopy. Panel a: Anabena circinalis; Panel b: Woronichinia naegeliana; Panels d-f: Unidentified species.
tation Index (TVI), which enhanced values of the NDVI for the elimination of negative values (Equation (3)).
 (3)
(3)
2.5. Statistical Analysis
Statistical analyses were conducted by use of STATISTICA 6 (StatSoft Inc., Tulsa, OK, USA), SigmaStat 3.0 (SPSS Inc., Chicago, IL, USA) and SPSS 11.5 (SPSS Inc.). Prior to the use of parametric statistical procedures, normality was evaluated by the Shapiro-Wilks test and the assumption of homogeneity of variance was evaluated using Levene’s test. All parameters met the assumptions of homogeneity of variance test (Supplemental Materials, Table S7), and thus, measures of productivity, including Chl-a and number of cells, in factorial assays of nutrient (N and P) limitation were analyzed by threeway ANOVA with Student-Newman-Keuls test (SNK). Values for parameters measured in the field were investigated by two-way ANOVA (location and depth). Relationships between the Chl-a, and limiting factors were explored using multiple correlations, and stepwise regression analyses [26]. Data obtained during the field studies fulfilled all assumptions for the calculation of linear regressions, and thus, were not transformed. Chl-a data from the two laboratory experiments were log-transformed to approximate normal distribution prior to conduct of linear regression analyses.
Data for site 1-6 (collected from July to October 2008) were analyzed by use of three-way ANOVA with sampling site, sampling depth, and sampling date as the class variables, followed by SNK pair-wise multiple comparesons, or by the non-parametric Kruskal-Wallis test followed by the Mann-Whitney U test, as appropriate. Parameters, including hardness, COD, DO, pH, Chl-a, and depth passed the normality test and equal variance test using a three-way ANOVA followed by application of the SNK test (SigmaStat 3.0). The remaining 16 parameters (dependent variables) that did not meet the assumptions for parametric analyses were analyzed by the median test of variances (STATISTICA 6).
3. Results and Discussion
3.1. Water Quality Analysis
There were significant differences among most water quality parameters as a function of time, depth and sampling location (Tables 1 and 2). There were statistically significant differences among sampling time-points for hardness, COD, pH, NO2, NO3, PO4, hardness, alkalinity, TN, Mn2+, Fe3+, DO, temperature, Chl-a, and TDS (p ≤ 0.05). Specifically, there was a trend towards greater hardness, ,
, , Cl–, TN and salinity, and lesser
  concentrations and Fe later in the year. No clear trend towards increasing or decreasing values as a function of sampling season was observed for COD. No statistical differences among sampling times were observed for
 , Cl–, TP, pH, Cond, depth, and salinity. The parameters of hardness, COD,
 ,
, , Cl–, TN, Fe3+, pH, and salinity were significantly different among sampling sites with trends towards greater values at the further downstream sites (p ≤ 0.05). No statistical significant differences were observed among locations for
 ,
, , hardness, alkalinity, COD, TP, Mn2+, DO, temperature, Cond, and TDS. Concentrations of Cl– and TDS were significantly different among sampling depths but no clear trends towards increasing of decreasing values at greater or lesser depths were observed (p ≤ 0.05). However, in September there were significantly greater temperatures and pH in surface water compared to bottom water across all sampling sites indicating that some stratification of water layers occurred during this time. No statistically significant differences among sampling depths were observed for
 ,
, ,
, ,
, , hardness, alkalinity, COD, TN, TP, Mn2+, Fe3+, DO, Cond, and salinity.
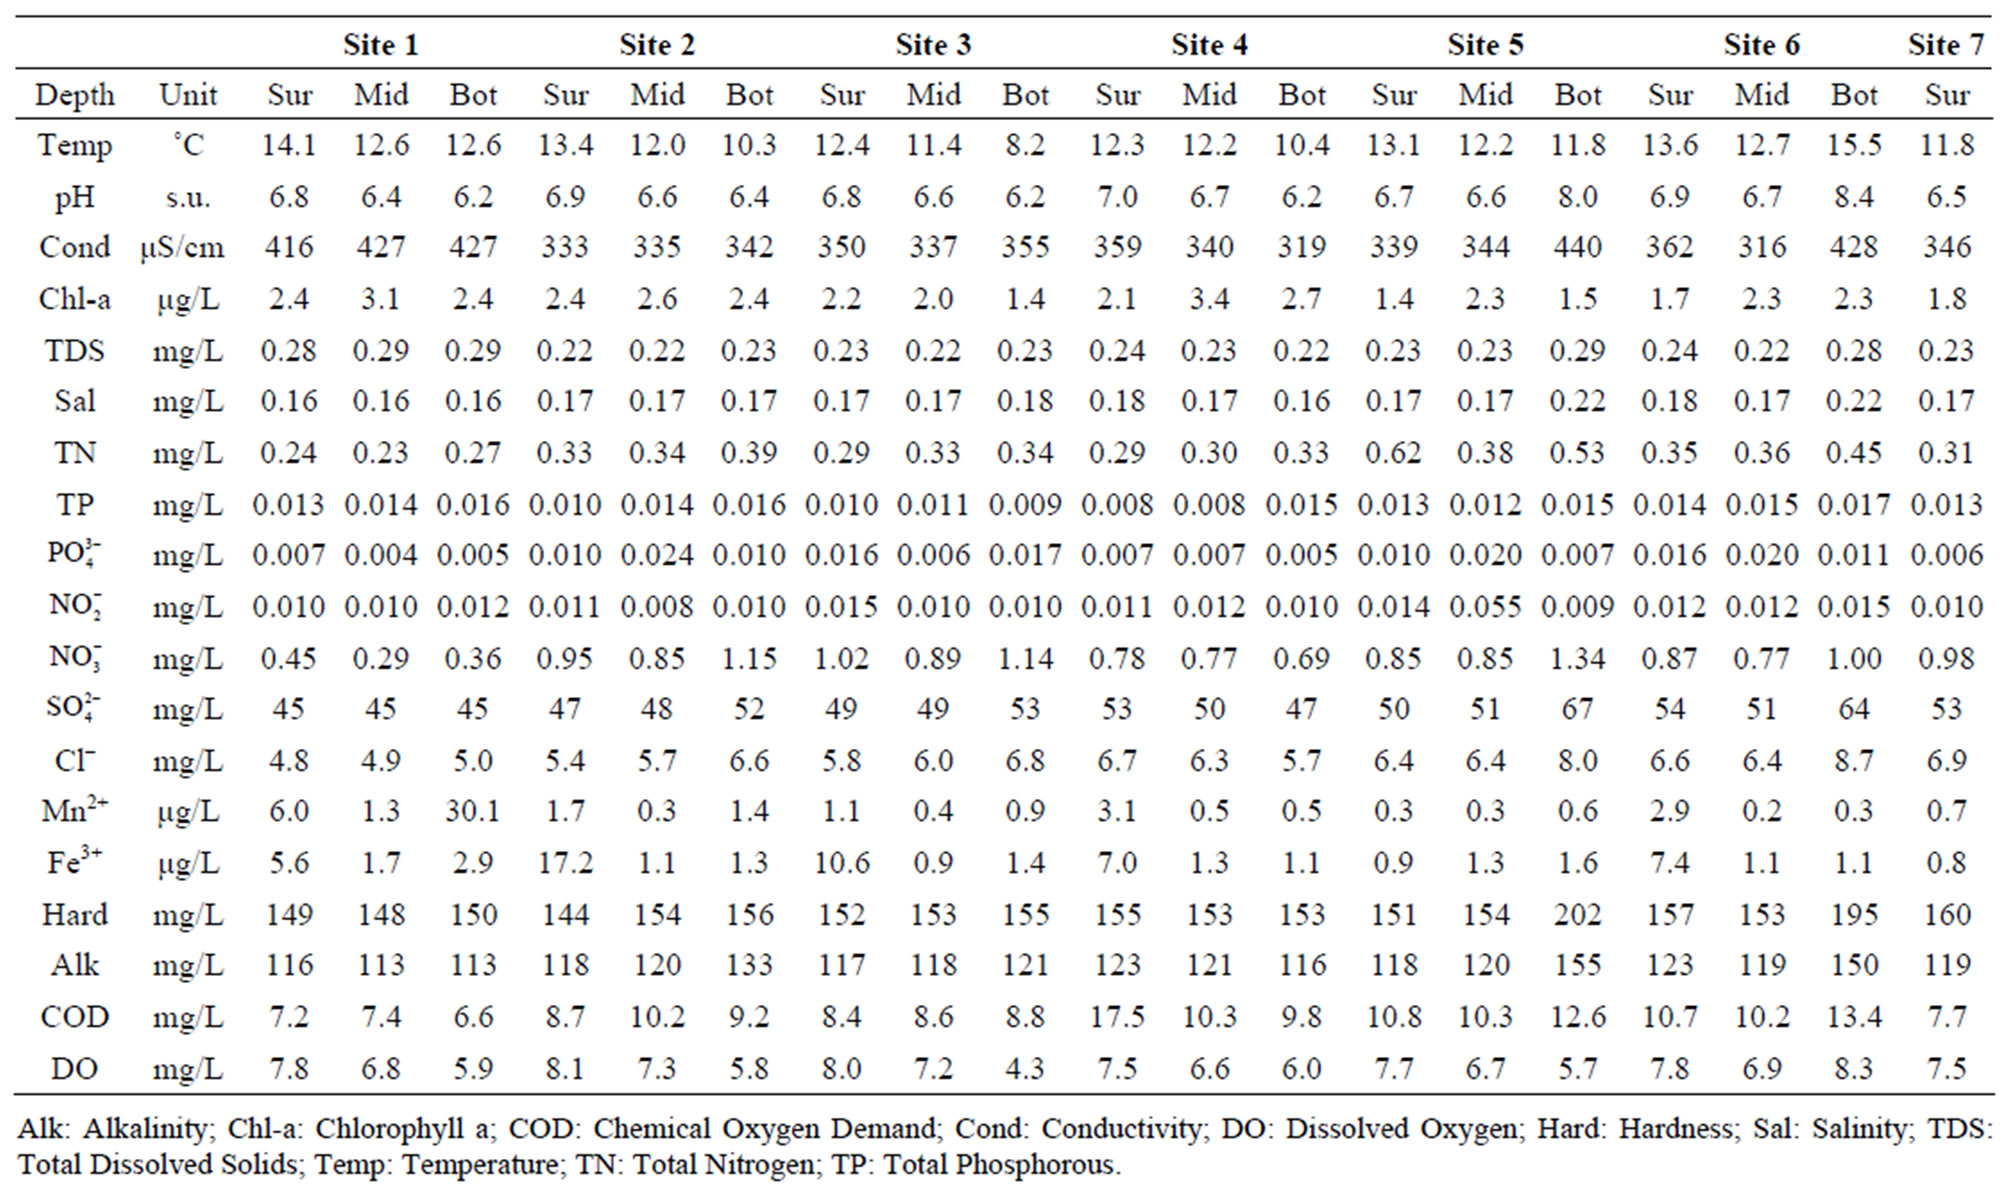
Table 1. Average (mean) water quality parameters measured at the surface (Surf), mid-depth (Mid) and in near-bottom (Bot) water measured between June and October 2008 at all sampling sites (Sites 1-7). N = 5 for surface water (Sur) values, and N = 4 for middle depth (Mid) and bottom (Bot) water samples. No middle depth and bottom water samples were collected at site 7.
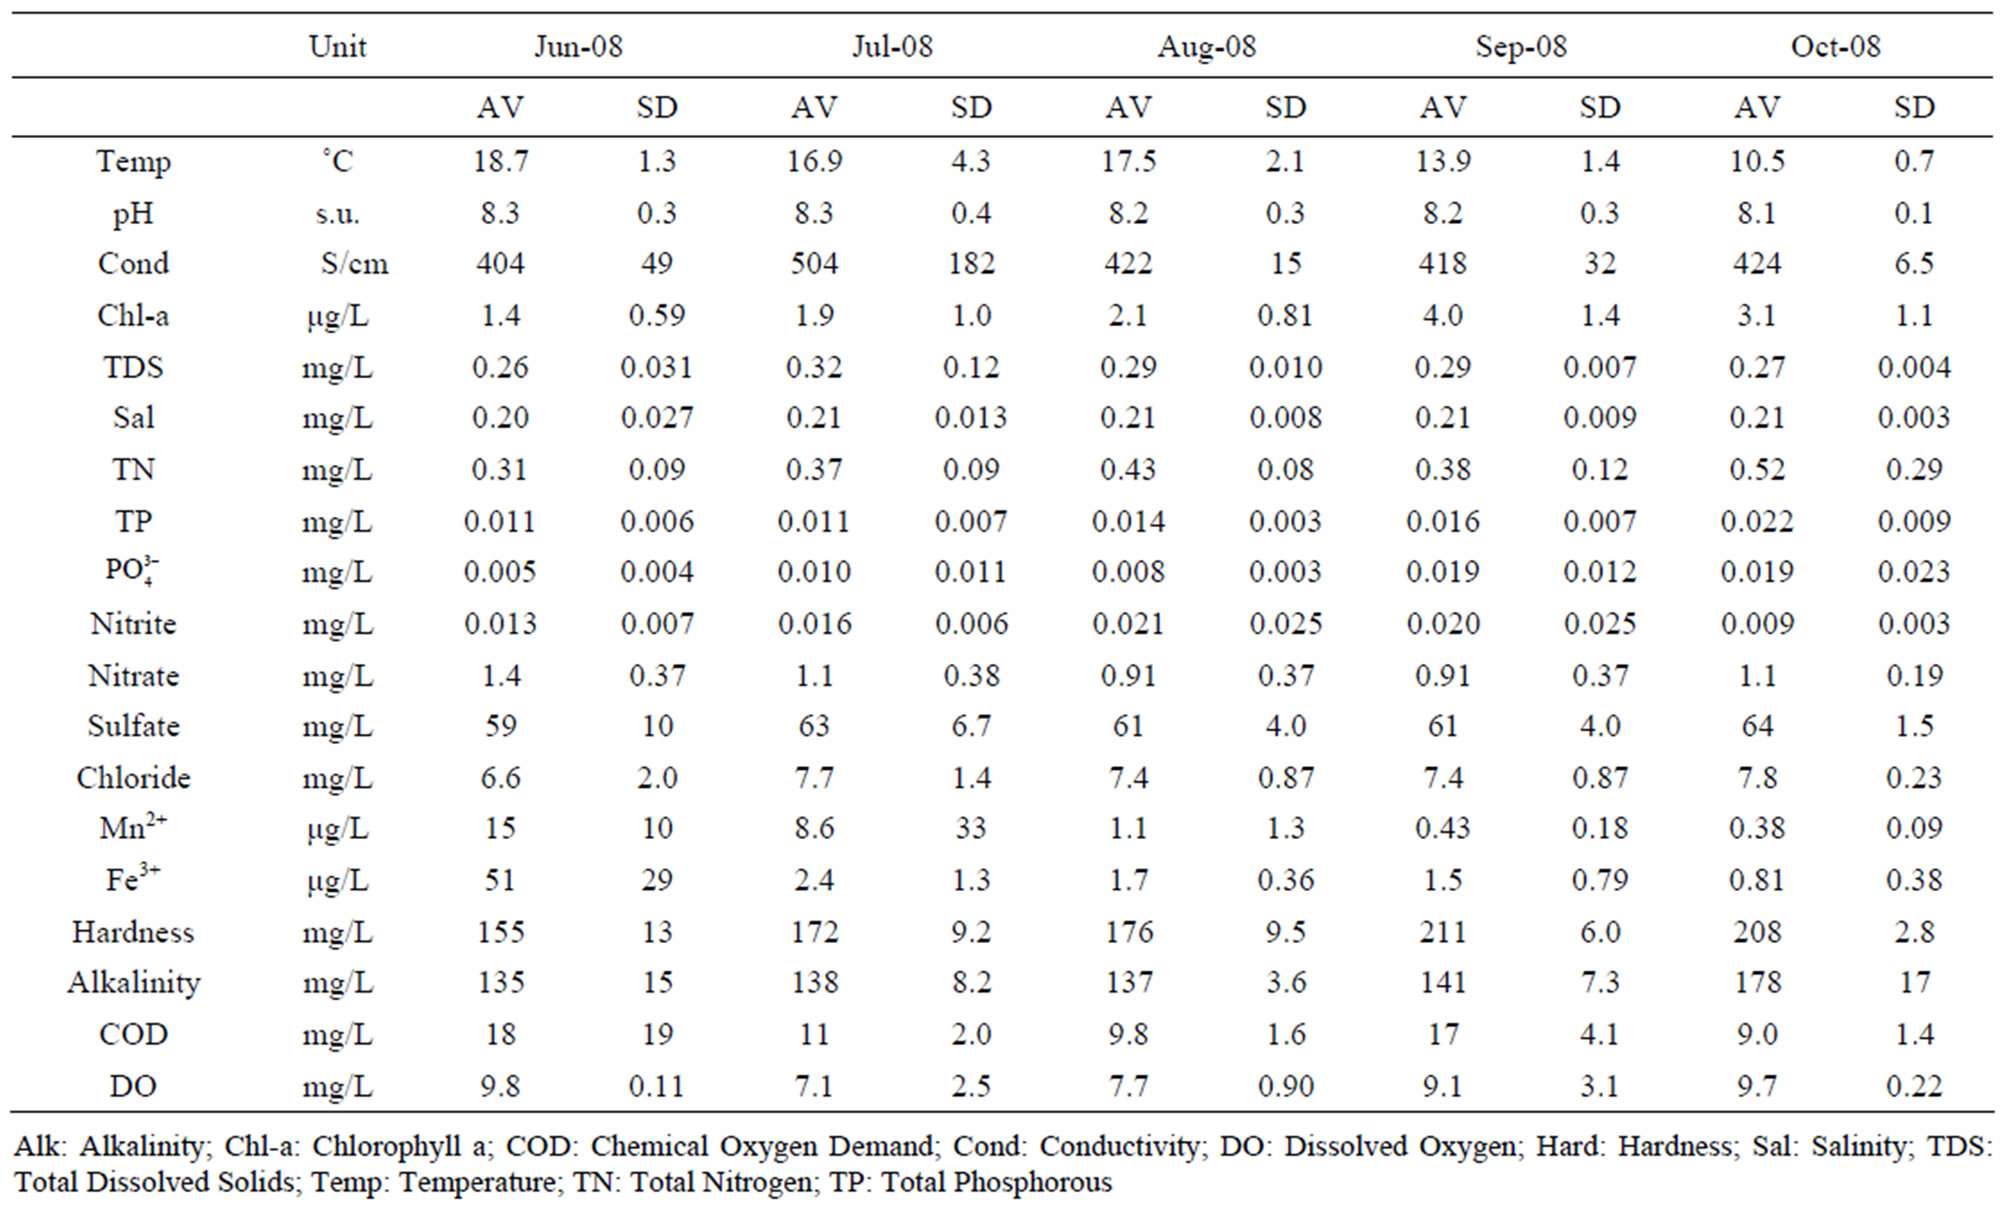
Table 2. Average water quality parameters measured across all sampling sites between June and October 2008. AV: Mean; SD: Standard Deviation. N = 19 with exception of the June 2008 sampling (N = 5).
3.2. Phytoplankton Biomass and Its Association with Water Quality and Nutrient Parameters
3.2.1. Estimation of Biomass of Phytoplankton by Use of Chl-a
Chl-a was selected as an index of phytoplankton biomass and/or production [27,28]. Concentrations of Chl-a in lake water are summarized to show a monthly variation of algal biomass in Lake Diefenbaker during June to Oct 2008. In general, concentrations of Chl-a increased from June to October (Figures 3(a)-(c)). Concentrations of Chl-a reached a maximum of 5.31 μg Chl-a/L in October at site 4. This is approximately 6-times greater than Chl-a measured in June (0.95 μg Chl-a/L), which indicates a significant increase in phytoplankton biomass. In general, Chl-a concentrations measured in surface water from Lake Diefenbaker were comparable to those reported in other lakes (0.22-7.09 μg Chl-a/L) in Canada [29-32]. However, compared to other freshwater systems in which massive cyanobacteria blooms occurred (the associated Chl-a concentrations were more than 100-times greater than those recorded during this study; up to 830 μg Chl-a/L; [21]), Chl-a concentrations in Lake Diefenbaker measured during the 2008 sampling season were low.
Based on monthly concentrations of Chl-a in surface water, there was a general decreasing concentration (algal mass) gradient between the more upstream sites (site 1) and the more downstream locations. In September and October, there was no such decreasing trend. In these months, the greatest concentrations of Chl-a were observed at sites 2 and 4 (Figures 3(a)-(c)). Previous reports indicated that blooms of phytoplankton are often associated with intensity of solar radiation over time [33, 34] or other weather condition such as wind [35]. While no specific data on intensity of solar irradiation or cloud cover was available for the sampling region in 2008, few days (=3) with precipitation in October 2008 would indicate relatively great light intensities prior to the peak of Chl-a in later October (http://climate.weatherof-fice.gc.ca/ climateData/). Furthermore, the prevailing winds in October 2008 were out of the West and North-West, which would favor accumulation of surface alga in the SouthEast arm of the reservoir (http://climate.Weatheroffice.gc.ca/ climateData/). This, together with the poor water exchange between this arm and the flowing portion of the reservoir, is hypothesized to represent contributing factors to the maximum Chl-a concentrations observed at sampling site 4 in October, which is located in the Qu’- Appelle arm of the reservoir.
3.2.2. Satellite Image Analysis
The progress of cyanobacteria blooms between October
 (a)
(a)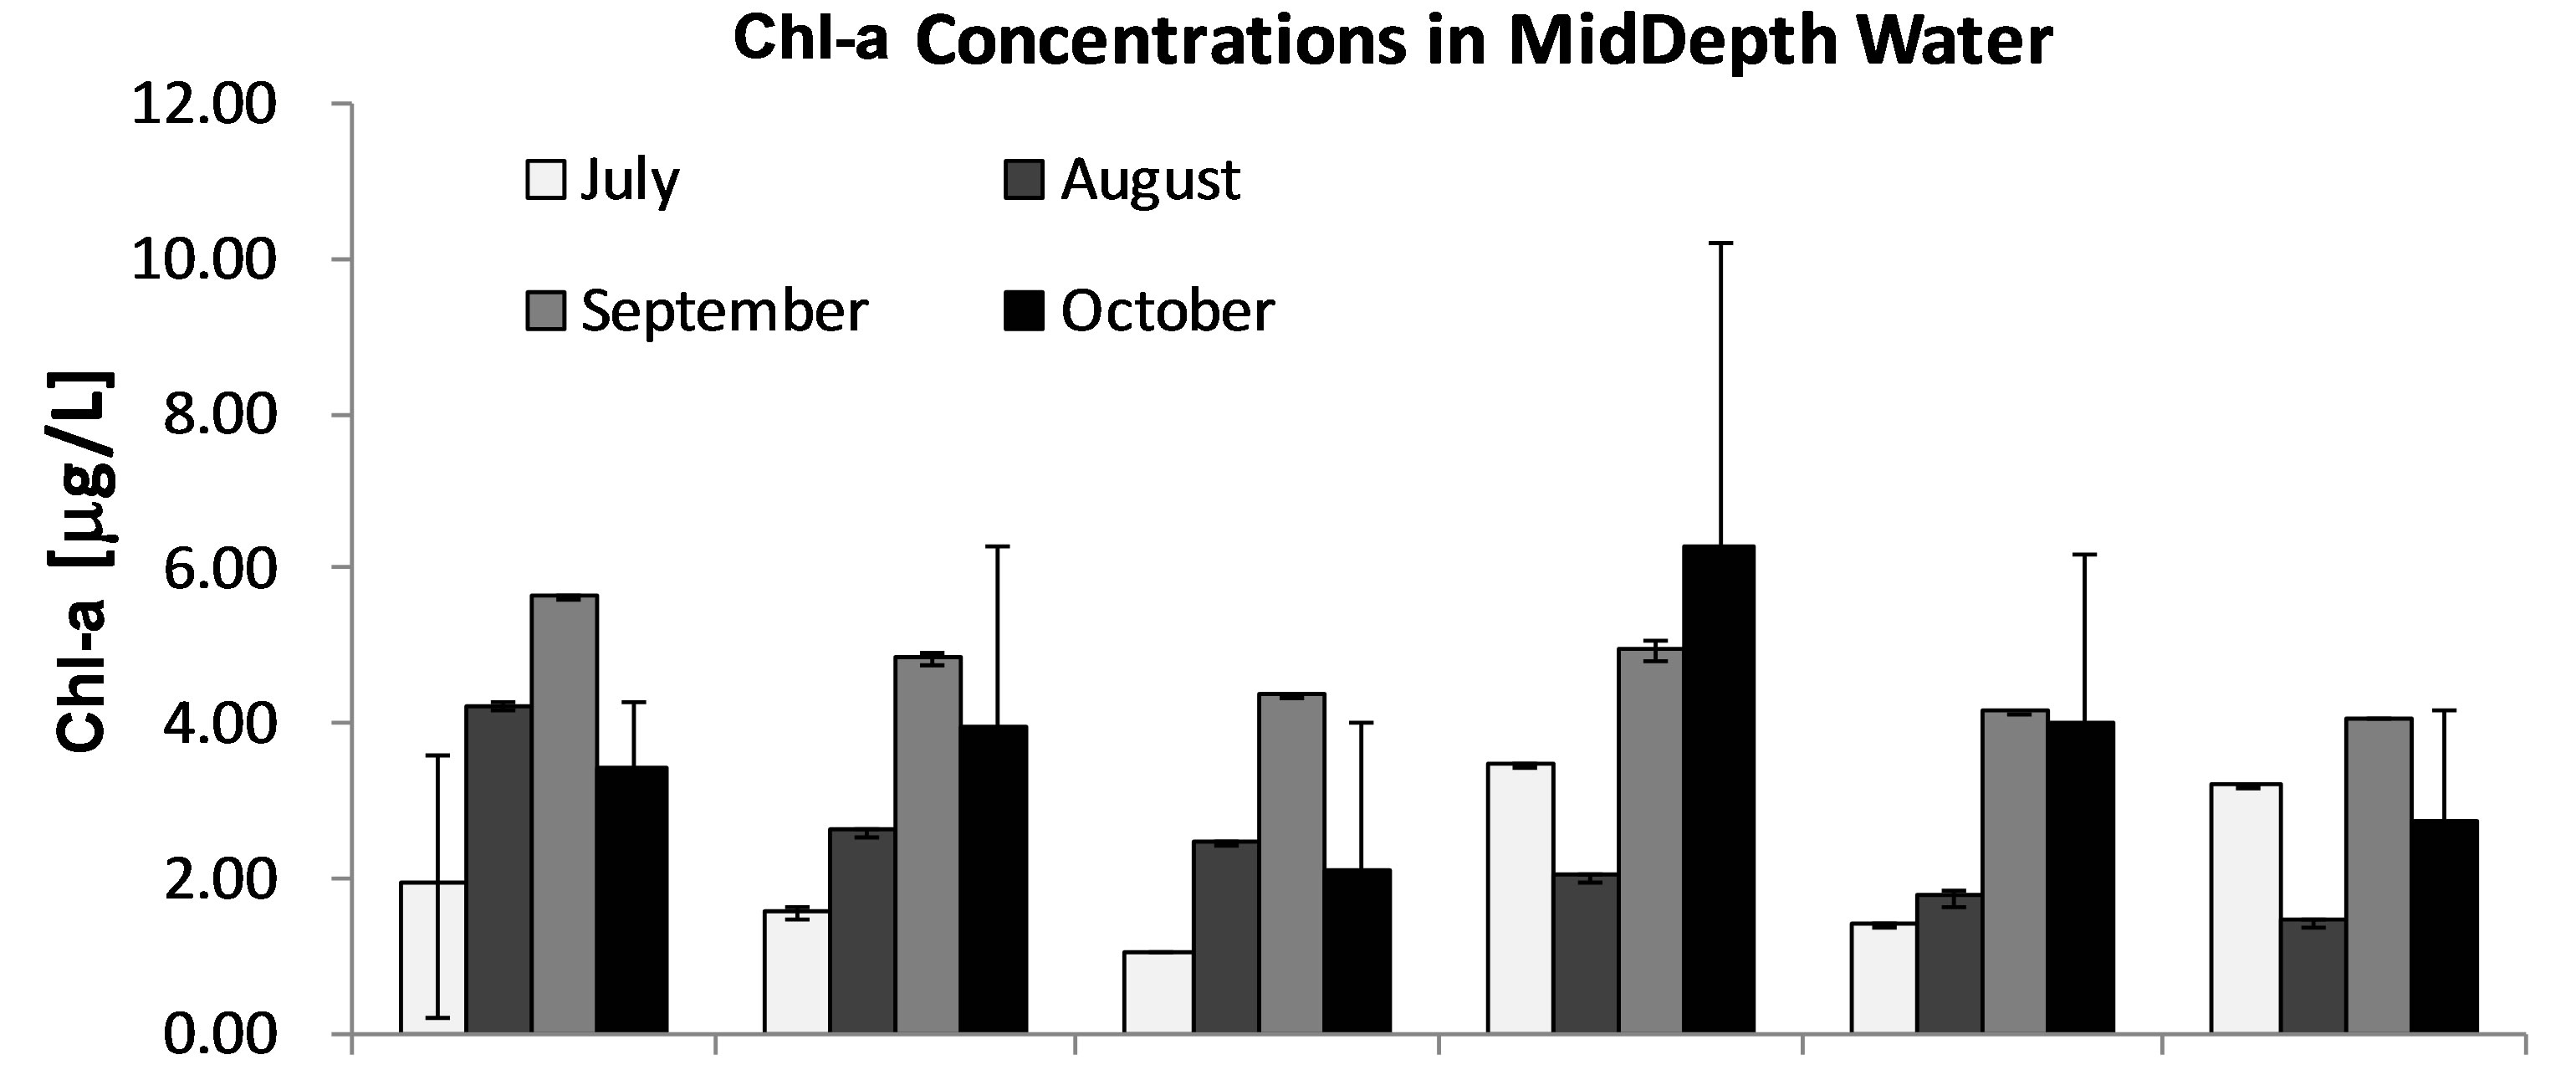 (b)
(b)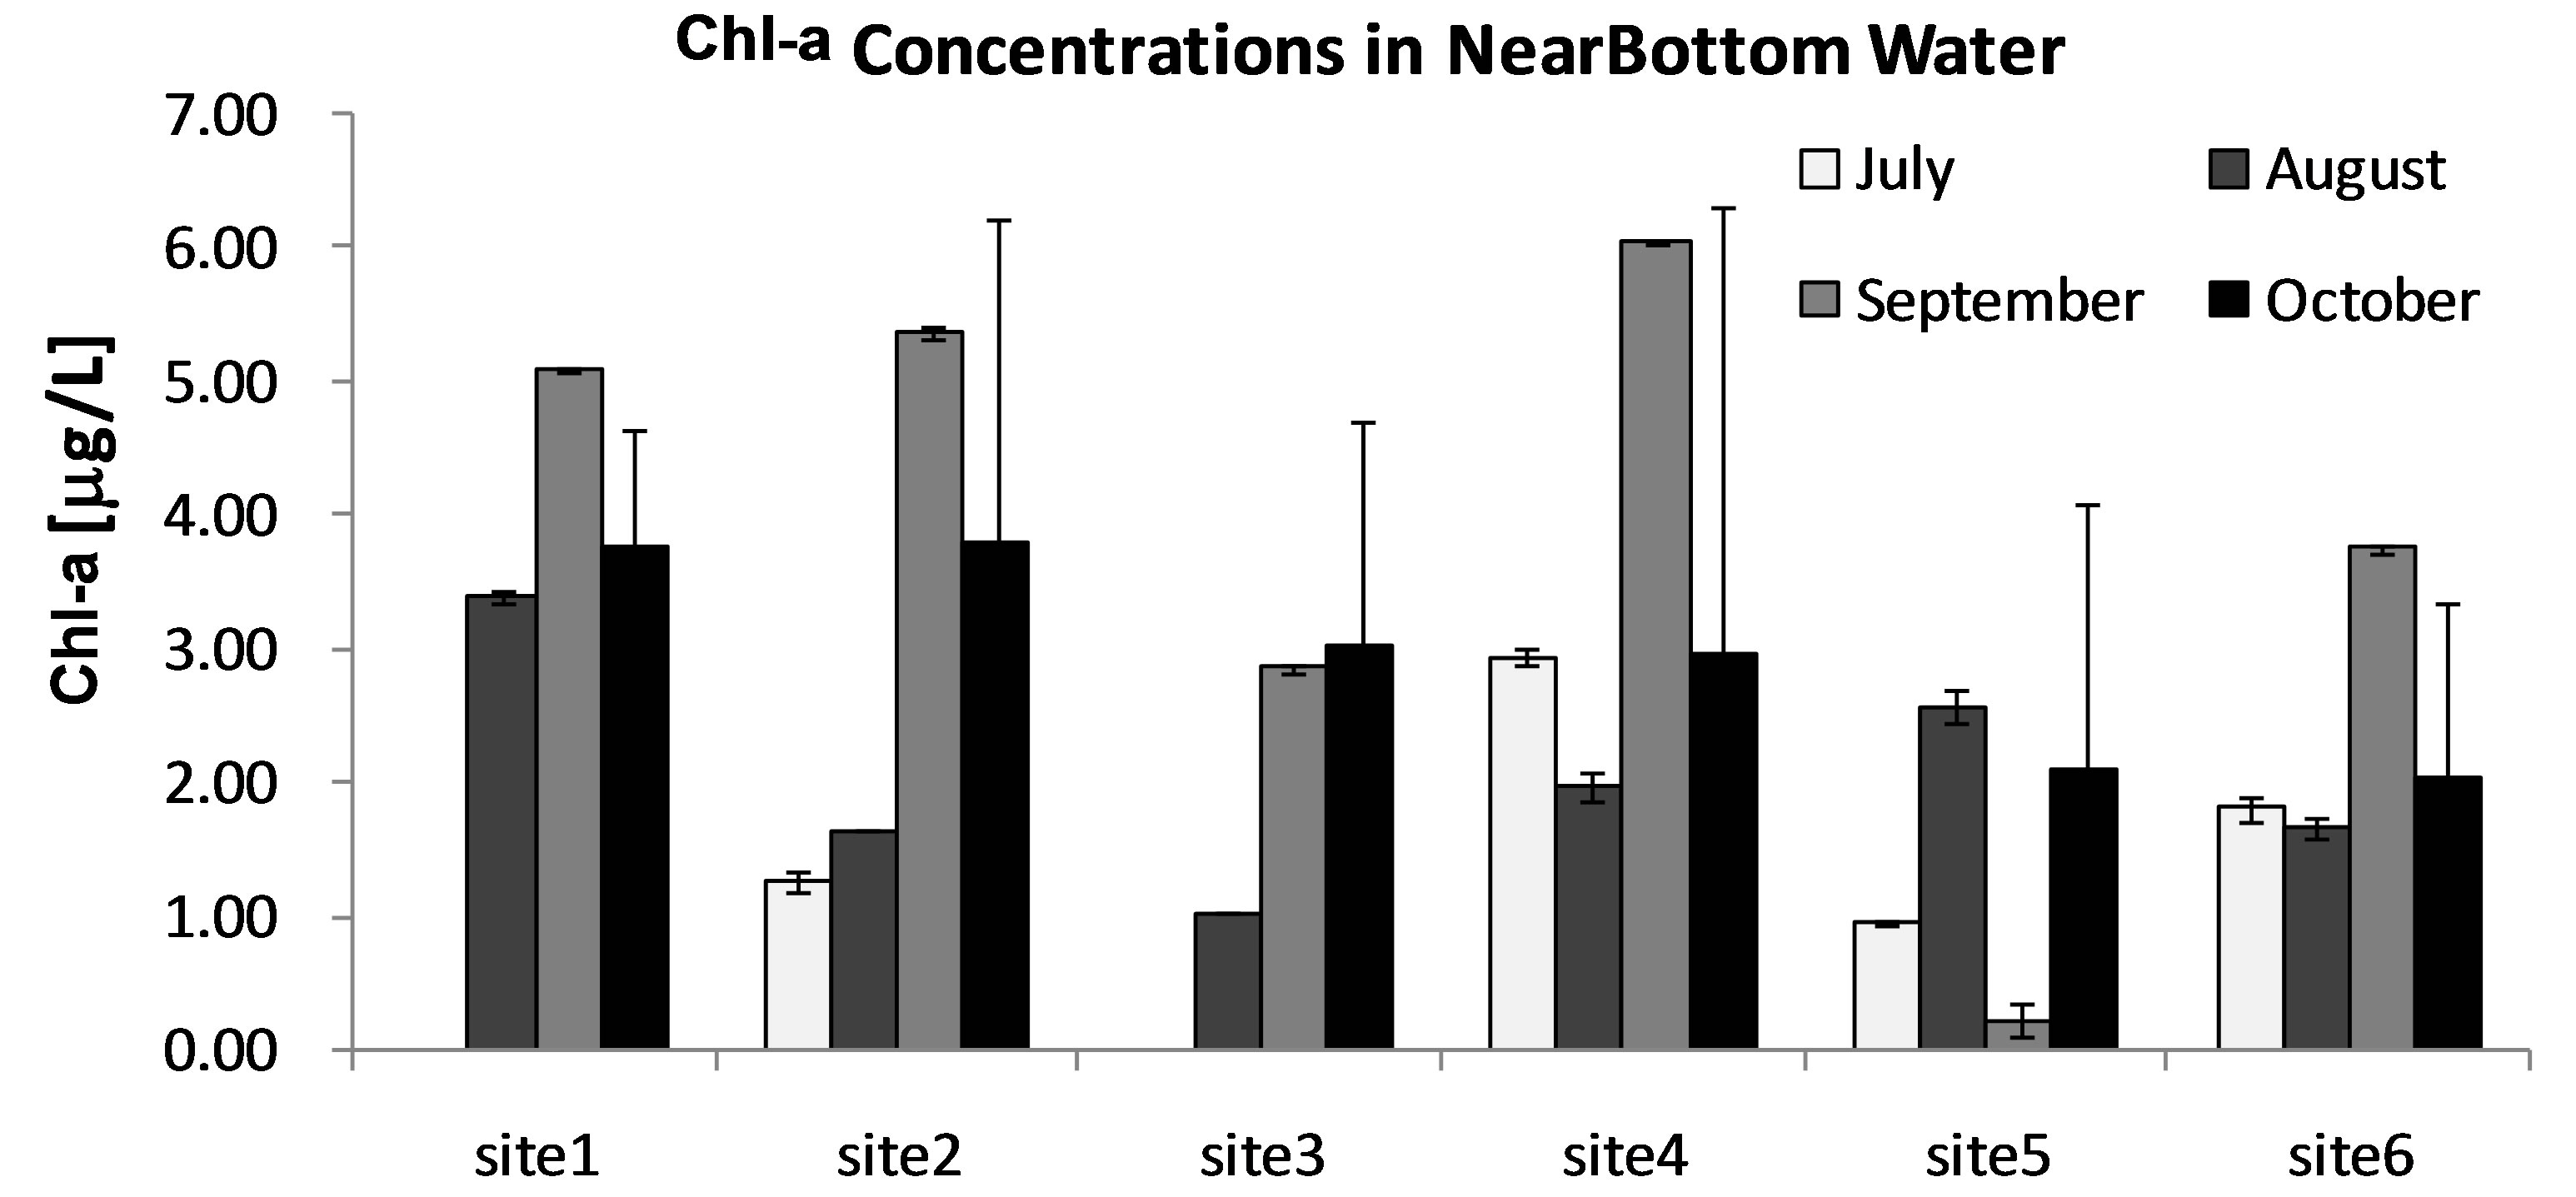 (c)
(c)
Figure 3. Monthly average concentrations of Chl-a [mg/L] in 3 stratified water layers (Surface [A], MidDepth [B], and NearBottom [C]) at sites 1-7 in Lake Diefenbaker during June to Oct, 2008. Bars represent mean values. Error bars represent 1 × SD.
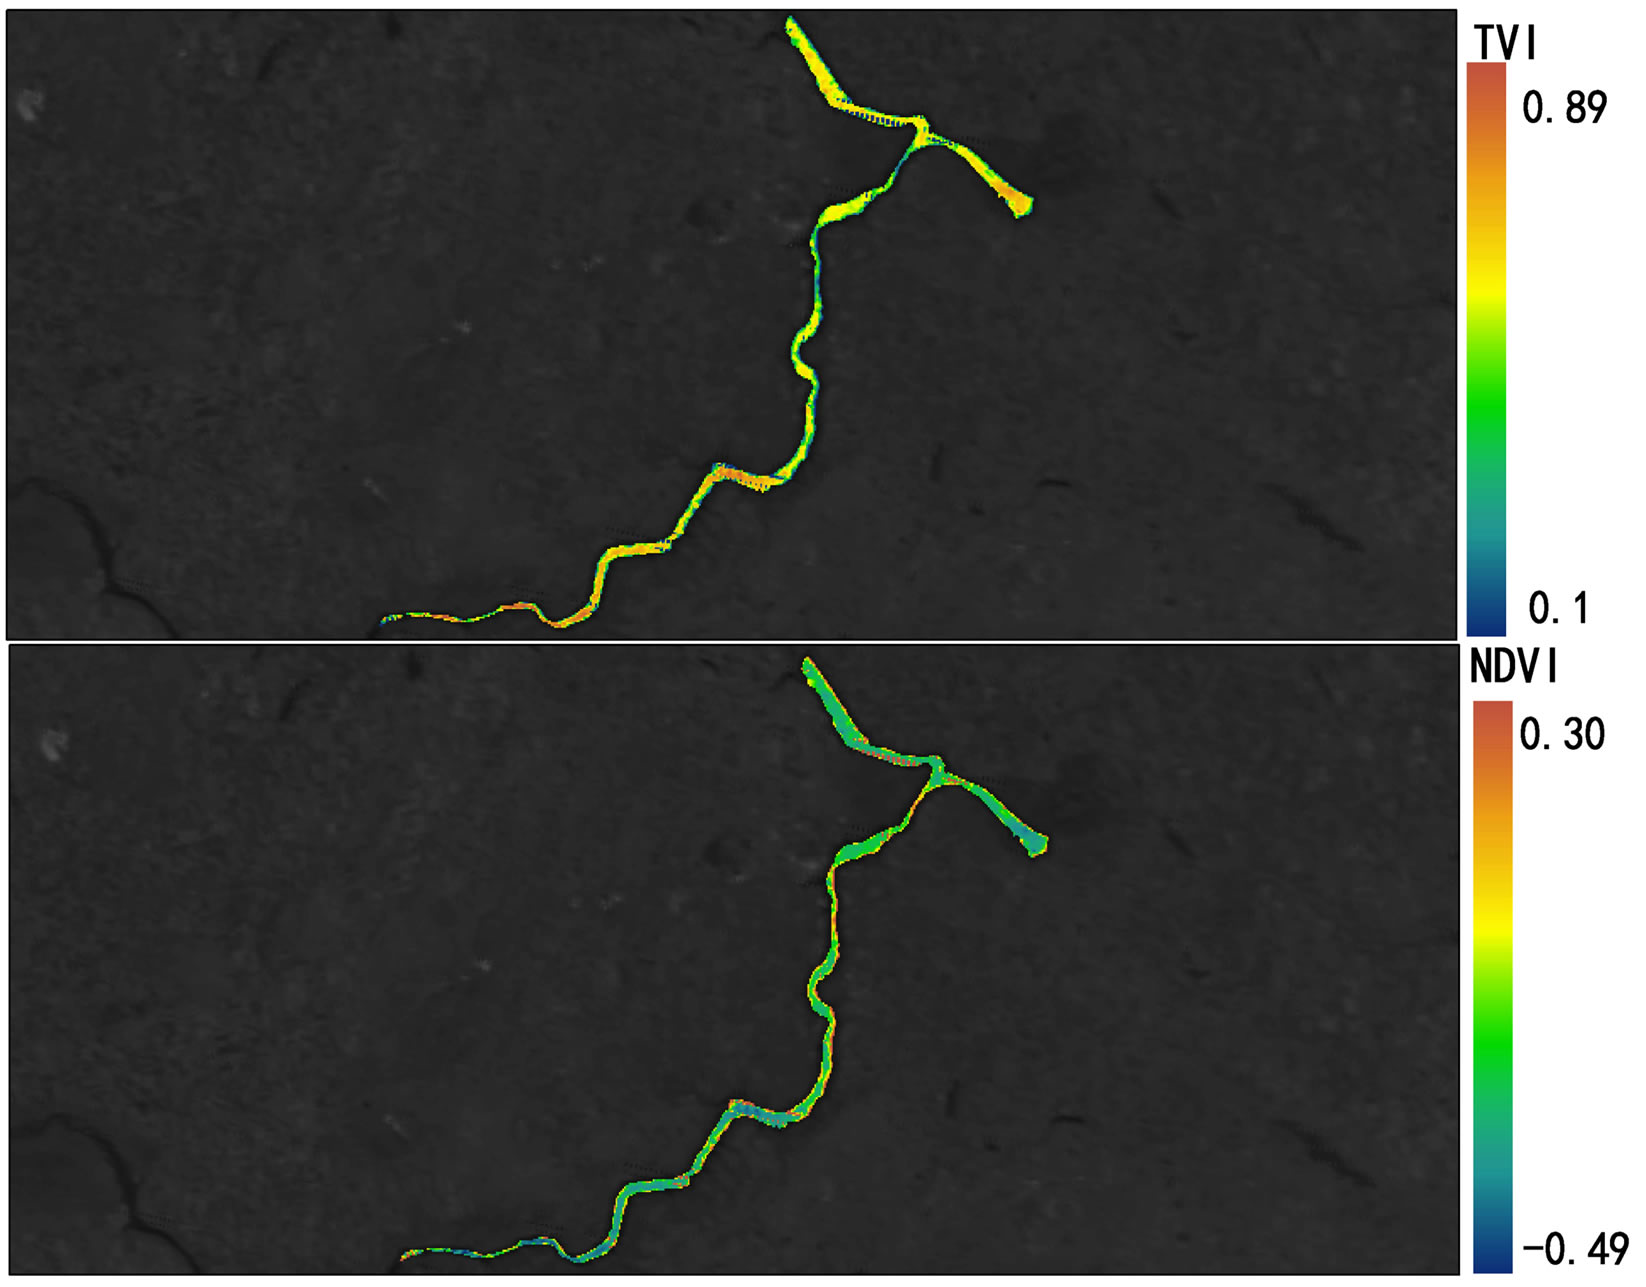
2007 and October 2008 in Lake Diefenbaker was dynamically monitored by use of MODIS Terra daily data and measured by NDVI (Figures 4 and 5; Supplemental Materials, Table S3 and Figure S1) and concentrations of chlorophyll were calculated. NDVI values were negative because of the relatively small concentrations of chlorophyll in the lake, but the TVI resulted in positive values. Retrospective satellite image analysis revealed that NDVI reached a maximum on October 16, 2007, which coincided with the approximate day of the cyanbacteria bloom. In general, NDVI measured at Sites 1 and 2 and at Site 7 exhibited less seasonality than that of Sites in the more downstream region of the reservoir. With exception of Site 2, this may be attributed to the greater flow rates in these areas that do not promote primary production similar to lake-type habitats.
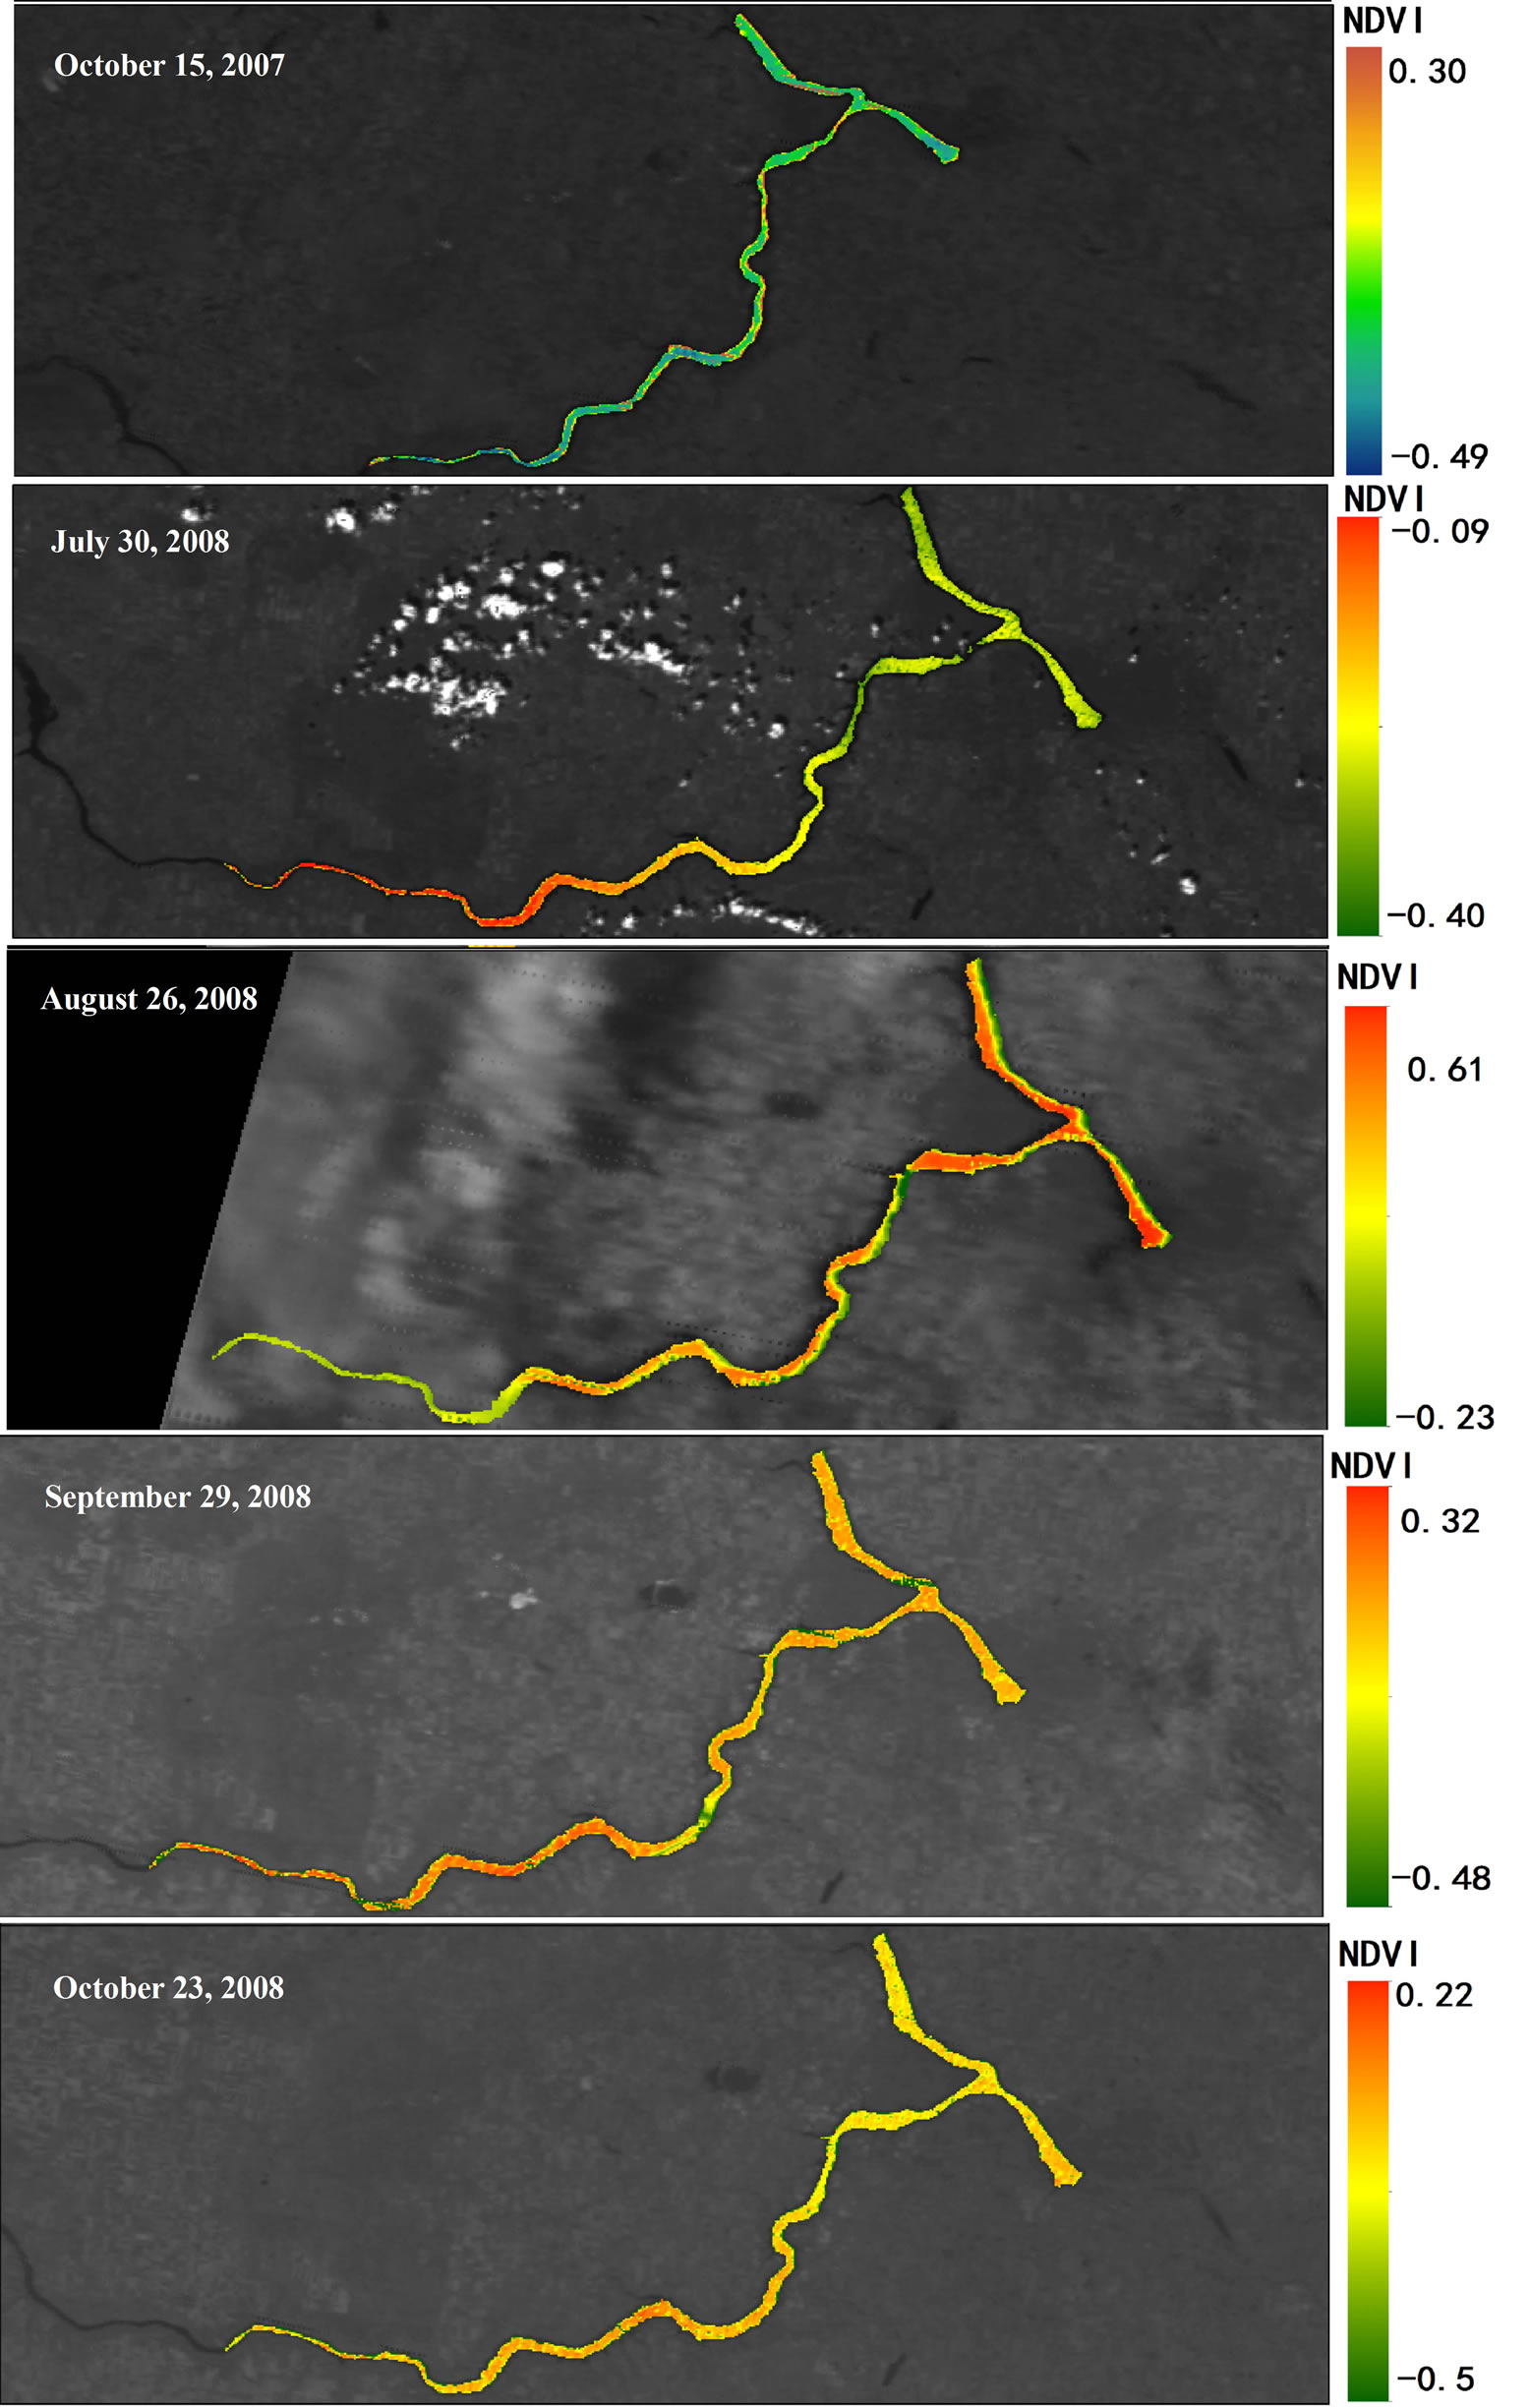
Figure 4. Geographical heat maps of Normalized Difference Vegetation Index (NDVI) values using MODIS terra images (October 2007 through October 2008).

Figure 5. Comparison of normalized difference vegetation index (NDVI) between October 15, 2007 and October 23, 2008, in Lake Diefenbaker surface water using MODIS Terra images.
Significant correlations between concentrations of Chla and NDVI (Pearson correlation coefficient r = 0.497, p < 0.05) and TVI (Pearson correlation coefficient r = 0.446, p < 0.05) from the MODIS terra images obtained on sampling days between June and October 2008 were found (Supplemental Materials, Table S4). This is in accordance with earlier studies that that found correlations between NDVI and surface cyanobacteria concentrations [36,37]. The overall distribution of algal biomass along the river from upstream to downstream locations could be clearly identified by satellite image analysis.
The results of the image analyses indicated that either the NDVI or TVI indexes of MODIS represent promising tools to aid in explaining algal biomass distribution in surface waters such as Lake Diefenbaker [38]. Analysis of satellite images was useful for remote monitoring of the general conditions and spatial distributions of algal biomass in Lake Diefenbaker. However, the limited sources of available satellite image due to atmosphere interferences and relatively narrow range of chlorophyll concentrations in the lake represent potential limitations in the application of satellite imaging to estimate algal biomass distribution. Overall, the current data set and our experience suggests that it will be possible to use satellite image processing to examine and estimate algal distribution at a relatively large scale, but the resolution of concentrations by this method will need to be linked to supplemental water sampling. In particular, to enable accurate determination of the types of algal cells present and their absolute and relative densities will require parallel collection of field data. In addition, satellite imagery will be more useful for those species such as cyanobacteria that tend to float on or near the surface and will be of negligible use for quantifying chlorophyll at deeper depths.
3.2.3. Relationships between Water Quality, Nutrient Status and Chl-a
Relationships between Chl-a and 20 other parameters in lake water were investigated by use of multiple regression analysis. In addition, to determining relationships between and among these parameters, models to predict algal productivity were developed (Supplemental Materials, Tables S8-S10). Chl-a is an integrating variable for a relatively complex set of conditions that can influence phytoplankton biomass and production in lake water. Dynamics and content of Chl-a in bodies of water are restricted and controlled by several types of physical and chemical factors as well as biological factors. Conversely, these factors are changed in response to phytoplankton biomass as represented by Chl-a [39]. The correlation coefficient hat resulted from the multiple regression analysis comparing Chl-a with water quality parameters was 0.867 (r2 = 0.752 N = 81). Because the concentration of Chl-a could be used to indicate phytoplankton biomass, the linear regression (model 1) showed that Chl-a concentration was closely associated with TP, and which is in accordance with other studies that reported strong dependence of algal biomass, as represented by Chl-a, on TP in both cold and warm freshwater lakes [16,40]. Total phosphorus was found to be the limiting factor affecting primary production of phytoplankton in Lake Diefenbaker. If predictions of future loadings of TP can be estimated then the resulting change in algal biomass can be predicted.
Furthermore, nutrient indexes based on concentrations of nitrite, nitrate, SO4, PO4, Cl–, TN, TP, Mn, and Fe were selected and their relationships with Chl-a determined by use of multivariate, stepwise regression analyses (Supplemental Materials, Table S8). The resulting linear regression model is defined by (Equation 4).
[Chl-a] = 1.813 + 80.44 [TP](4)
where: concentration of chlorophyll-a (Chl-a) is the dependent variable and concentration of total phosphorus ([TP]) is the independent variable expressed as mg P/L. The correlation coefficient (between Chl-a and TP in the water was 0.427) r2 = 0.182, N = 81, p < 0.001.
Based on this analysis, concentration of TP was significantly associated with Chl-a and the coefficient of determination of the standardization partial regression between these two variables was 0.392, which was greater than for any other parameters. Thus, using this type of multivariate analysis to investigate the accessory factors and micronutrients in Lake Diefenbaker, it was found that the primary limiting factor for algal production was TP, as is the case in many other freshwater system in temperate regions [16,40]. In addition, the micro-nutrients, Mn and Fe were important cofactors in algal production. Experimental studies in Lake Erie [20] reported Fe as a co-limiting factor of phytoplankton with Fe supplementation resulting in a synergistic stimulating effect on Chl-a in combination with P and N supplementation. Interestingly, in this study a significant and negative correlation was observed between Fe concentrations in Lake Diefenbaker water and Chl-a concentrations (r = –0.482; r2 = 0.232; N = 81; p < 0.001). Fe concentrations in Lake Diefenbaker water were approximately 10- to 100-times greater than those reported to stimulate phytoplankton growth as described by North et al. [20], and thus, Fe is unlikely to have represented a limiting factor in Lake Diefenbaker. However, to date no information on optimum Fe concentrations or Fe-P-N ratios in freshwater systems are available, indicating the need for further studies to elucidate these interrelationships. None of the measures of nitrogen were significant predictors of Chl-a.
3.3. Identification of Limiting Factors for Cyanobacteria Growth
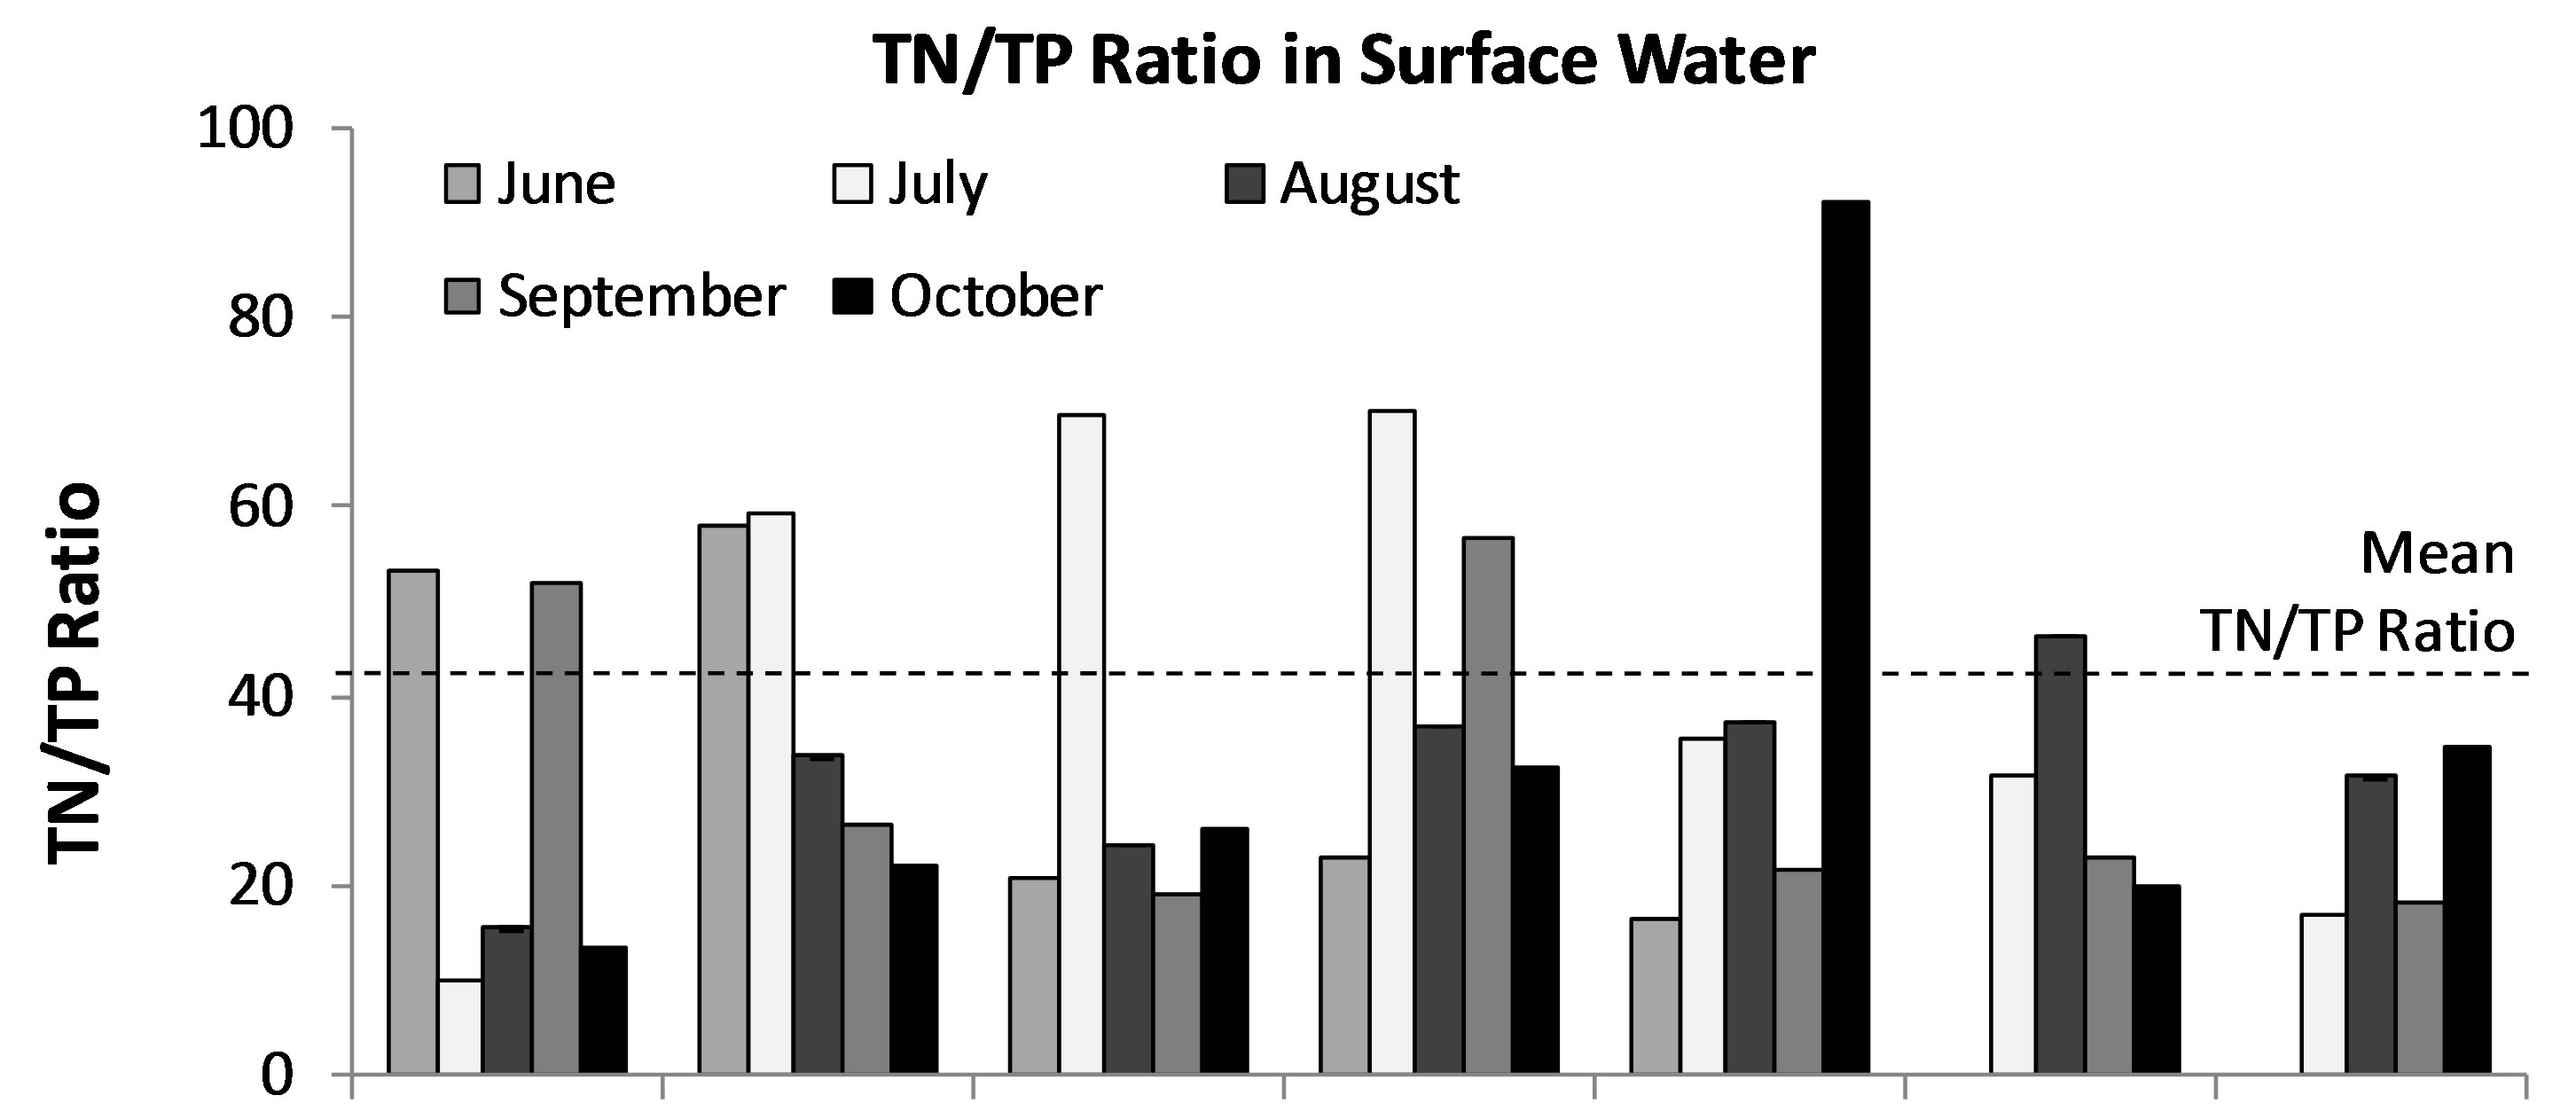
Limnologists and lake managers have developed a general consensus about freshwater lake responses to nutriaent additions. Essentially, at an ambient TP of greater than approximately 0.01 mg/L and or TN of about 0.15 mg/L it is likely that there will be blooms of cyanobacteria during the growing season [41]. The thresholds of concentrations of nutrients associated with eutrophication of lakes are a TP of 0.02 mg P/L and TN of 0.2 mg N/L [42-44]. According to the “Redfield” hypothesis [39, 45,46] the typical molecular formula of algal cells is (CH2O)106(NH3)16(H3PO4), which is equivalent to a ratio of critical nitrogen/phosphorus concentrations of 16:1. On a mass basis this is equivalent to a nitrogen/phosphorus ratio 7.2:1. From this theoretical perspective, if the ratio of nitrogen/phosphorus was less than the critical value, nitrogen would be the factor limiting phytoplankton growth, while if the ratio was greater than this value, phosphorus would be the limiting factor. Average concentration of TN and TP in Lake Diefenbaker were 0.423 and 0.015 mg/L, respectively. Thus, the mean ratio of TN/TP in Lake Diefenbaker was 42:1 (min-max = 16:1 - 440:1; Figure 6). Since the ratio is greater than the critical value, TP is currently the limiting nutrient factor in Lake Diefenbaker. Furthermore, based on the abundance of other micronutrients such as Fe as discussed in the previous section it is unlikely that P-N-Fe co-limitation affects biomass of phytoplankton in general, and biomass of cyanobacteria specifically. Based on this and a current relative classification scheme, Lake Diefenbaker would be classified as moderately eutrophic, and it can be concluded that excessive nutrients and phosphorus in particular would be the most likely cause of the prevalence of cyanobacteria (i.e. A. circinalis).
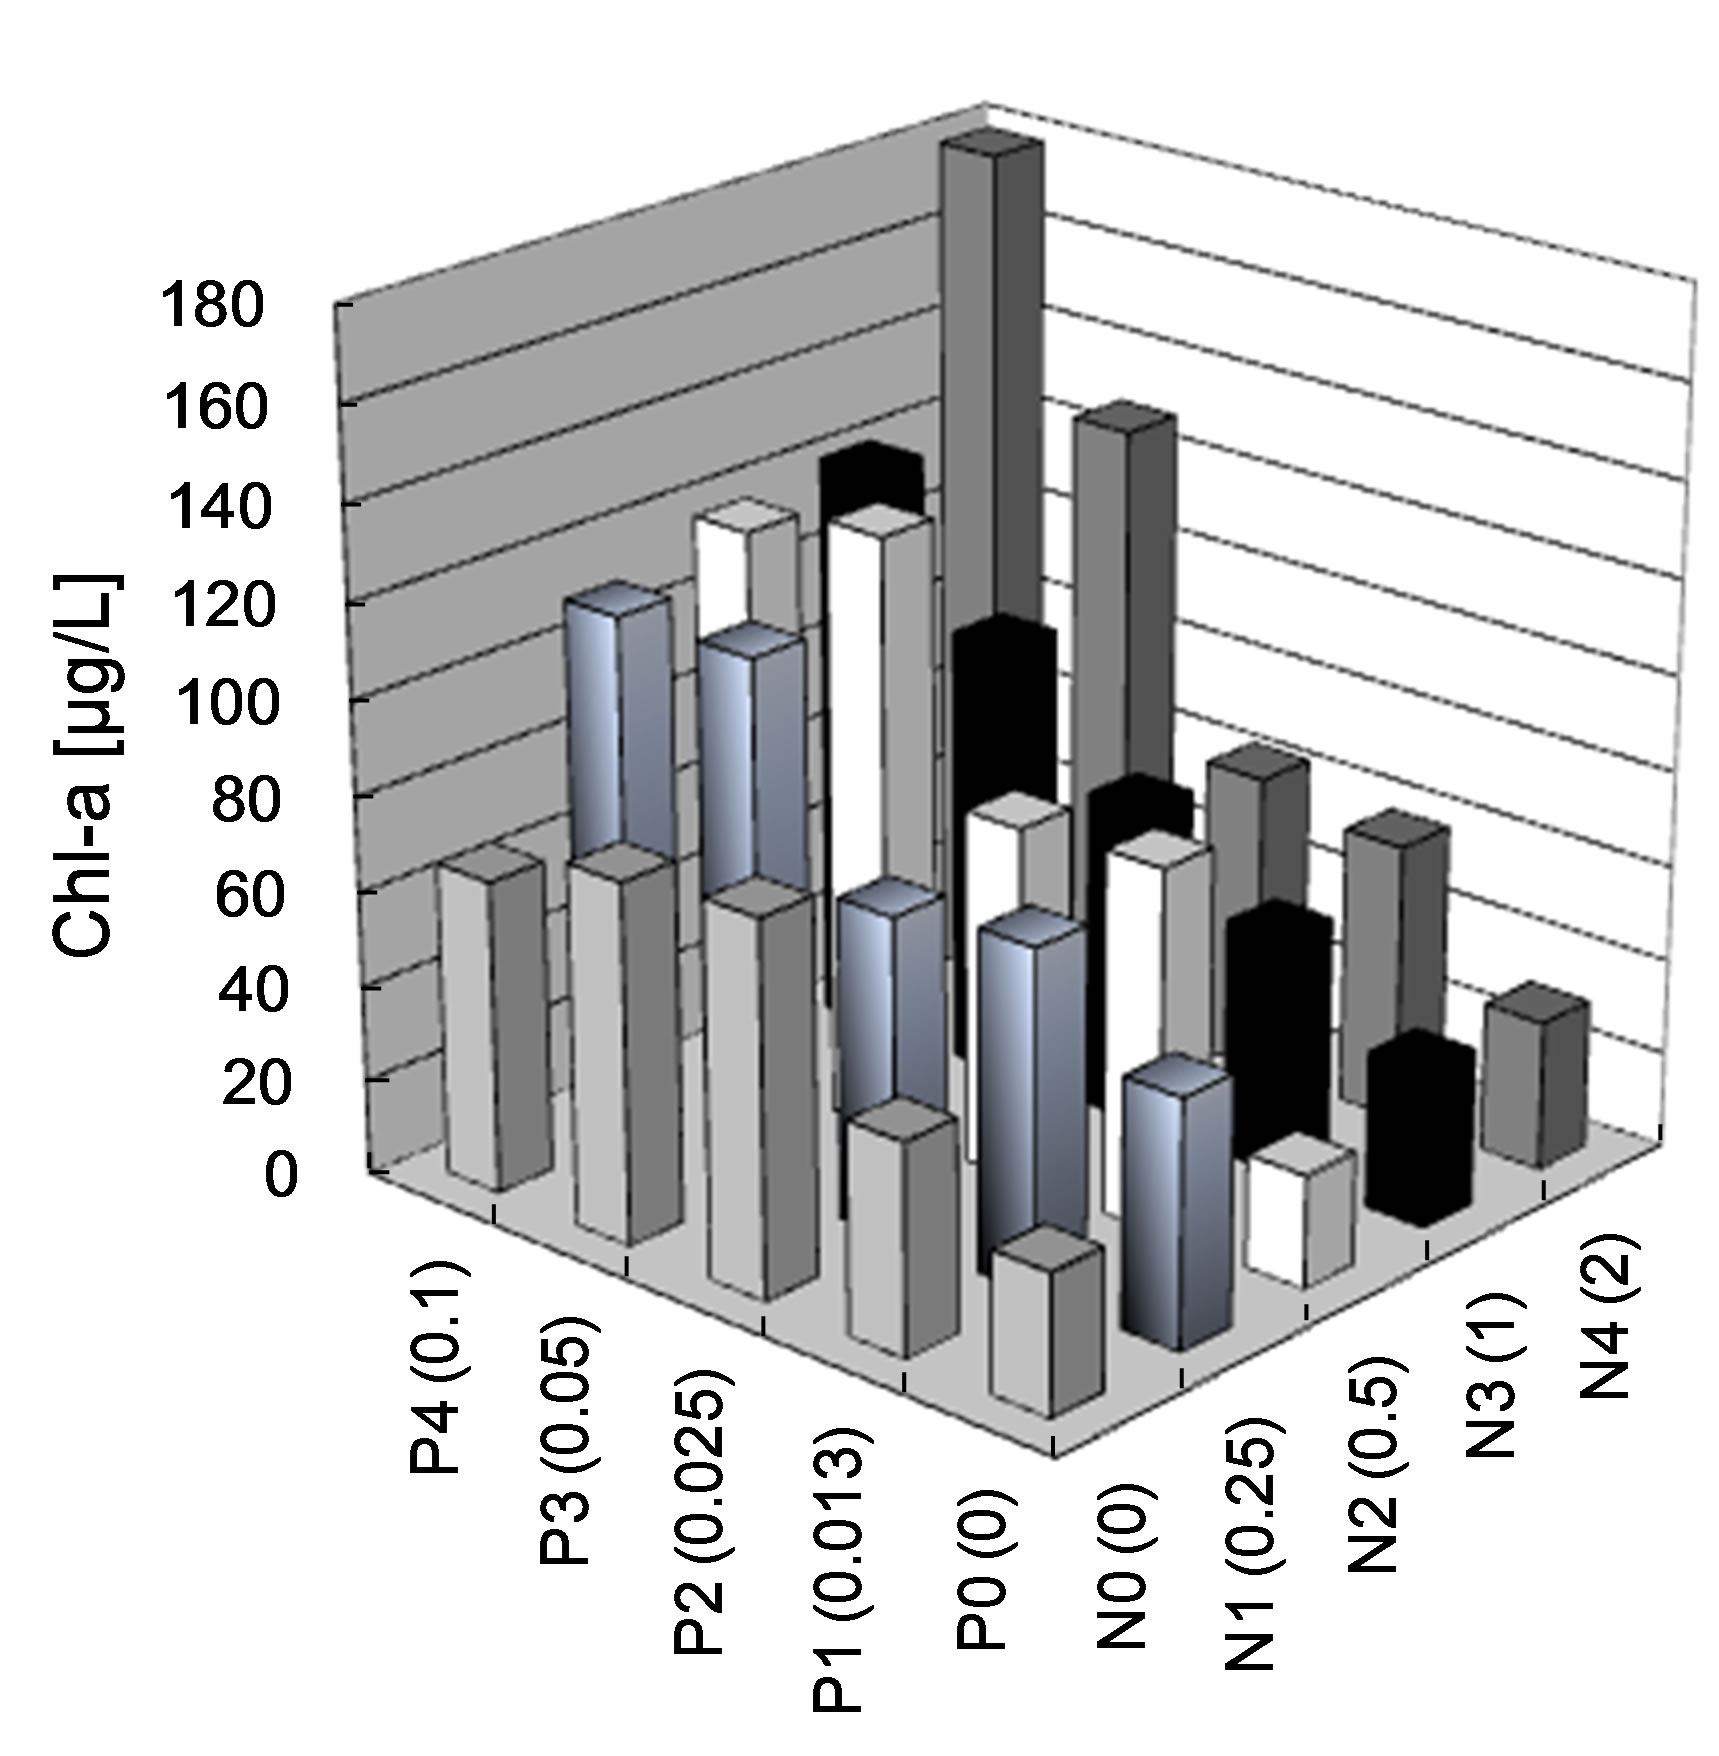
As a confirmation of the determination of putative limiting factors, determined based on concentrations of nutrients and theoretical relationships, two nutrient addition bioassays were conducted. Phosphorus was found to be the limiting nutrient and algal growth increased at concentrations greater than 0.025 mg P/L (Figure 7(a)). After two weeks of exposure, concentrations of Chl-a in lake water doubled at concentrations of 0.025 mg P/L, regardless of N concentration. However, concentrations of Chl-a slightly increased as N increased when P concentrations were greater than 0.05 mg P/L (Figure 7(a)). Thus, if concentrations of P increased, Chl-a (phytoplankton biomass) would only increase to a certain point until N became limiting. However, since some cyanobacteria genera have the ability to fix nitrogen [47], more detailed and longer-term studies with different consortia of phytoplankton would be needed to develop a more robust predictive relationship.
The relationship between Chl-a and nutrient indexes TN and TP after 2 weeks for phytoplankton from Lake Diefenbaker cultured in water from the lake was analyzed by use of stepwise, multivariate, regression analysis. The resulting linear regression model is defined by (Equation (5)):
Ln[Chl-a] = 6.788 + 1.076 Ln[TP](5)
where: Chl-a is the dependent variable and TP is the independent variable expressed as mg/L. The coefficient for the correlation between concentrations of Chl-a and TP was 0.632 (r2 = 0.399, N = 25). TP was significantly associated with Chl-a. Thus, in Lake Diefenbaker the primary limiting factor for algal production was TP, and TN was not a significant predictor of Chl-a.
In the second bioassay, which investigated N and P limitations of growth of the single cyanobacteria that caused the bloom in Lake Diefenbaker, Anabaena sp. (the dominant species observed in the cyanobacteria bloom in 2007), after two weeks of exposure, Chl-a doubled at concentrations of 0.025 mg P/L or greater, regardless of the concentration of TN. However, Chl-a did not increase significantly as a function of the concentration of TN (Figure 7(b)). This result is similar to that observed in the bioassay that used lake water containing a consortium of algal species. This experiment confirmed that P was the limiting nutrient and algal growth increased at concentrations greater than 0.025 mg P/L.
The relationship between Chl-a from Anabaena sp. and TN and TP after two weeks cultured in the second bioassay were analyzed by use of stepwise, multivariate, regression analysis (Supplemental Materials, Table S9). The resulting linear regression model is defined by (Equation (6)):
Ln[Chl-a] = 7.155 + 0.743 Ln[TP](6)
where: Chl-a is the dependent variable and TP is the independent variable expressed as mg/L. The coefficient for the correlation between Chl-a and TP in water was 0.748 (r2 = 0.559, N = 25). The TP concentration was also significantly associated with Chl-a, which showed
 (a)
(a)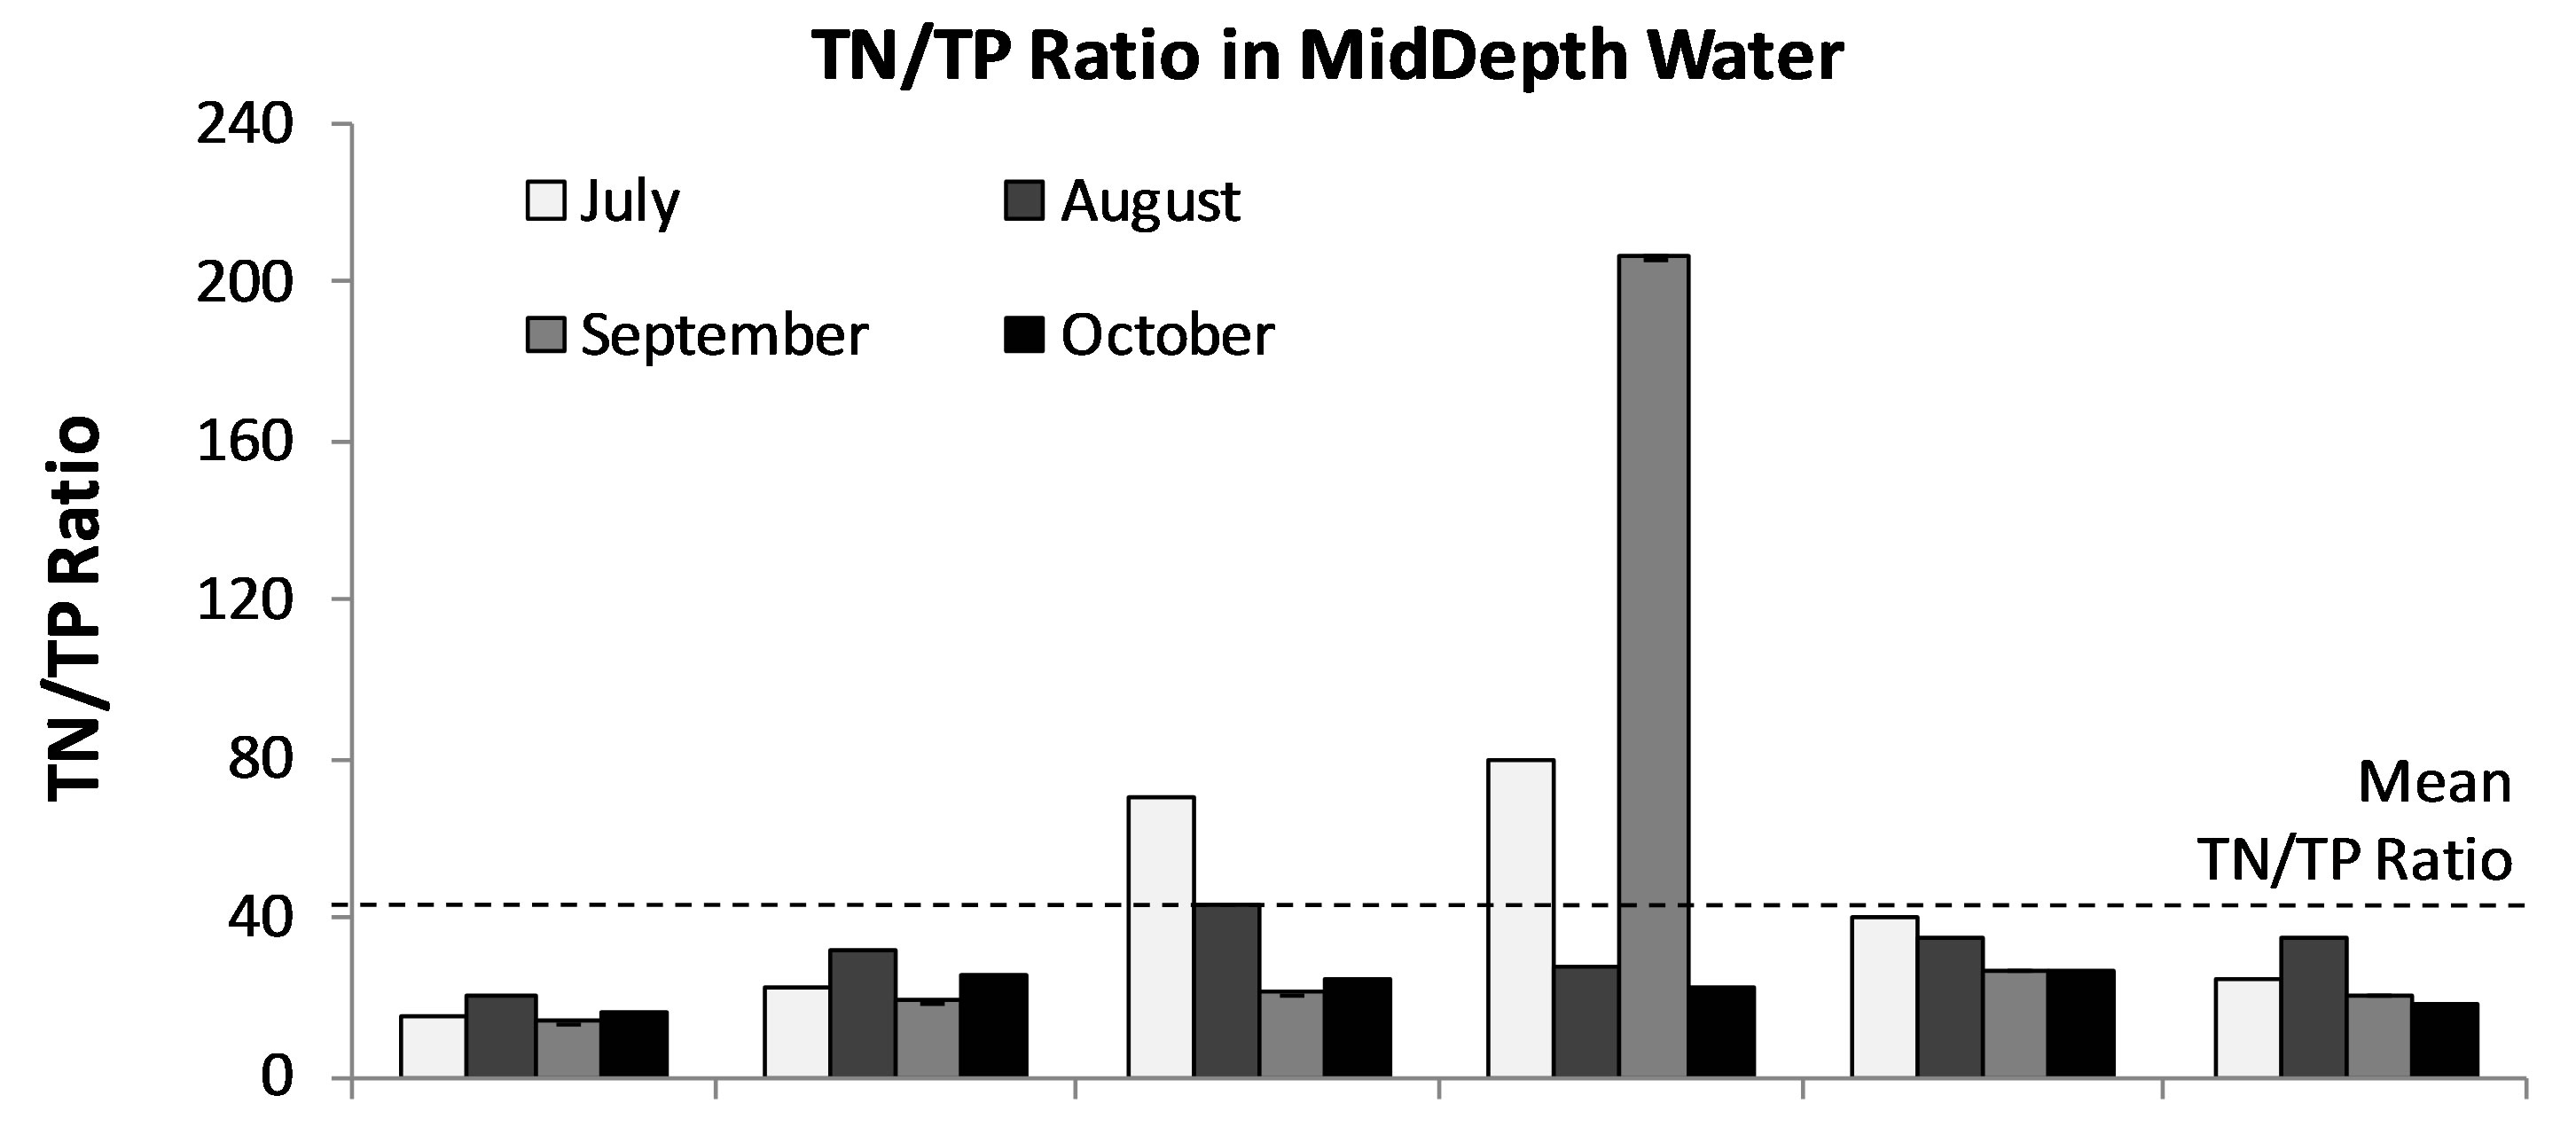 (b)
(b)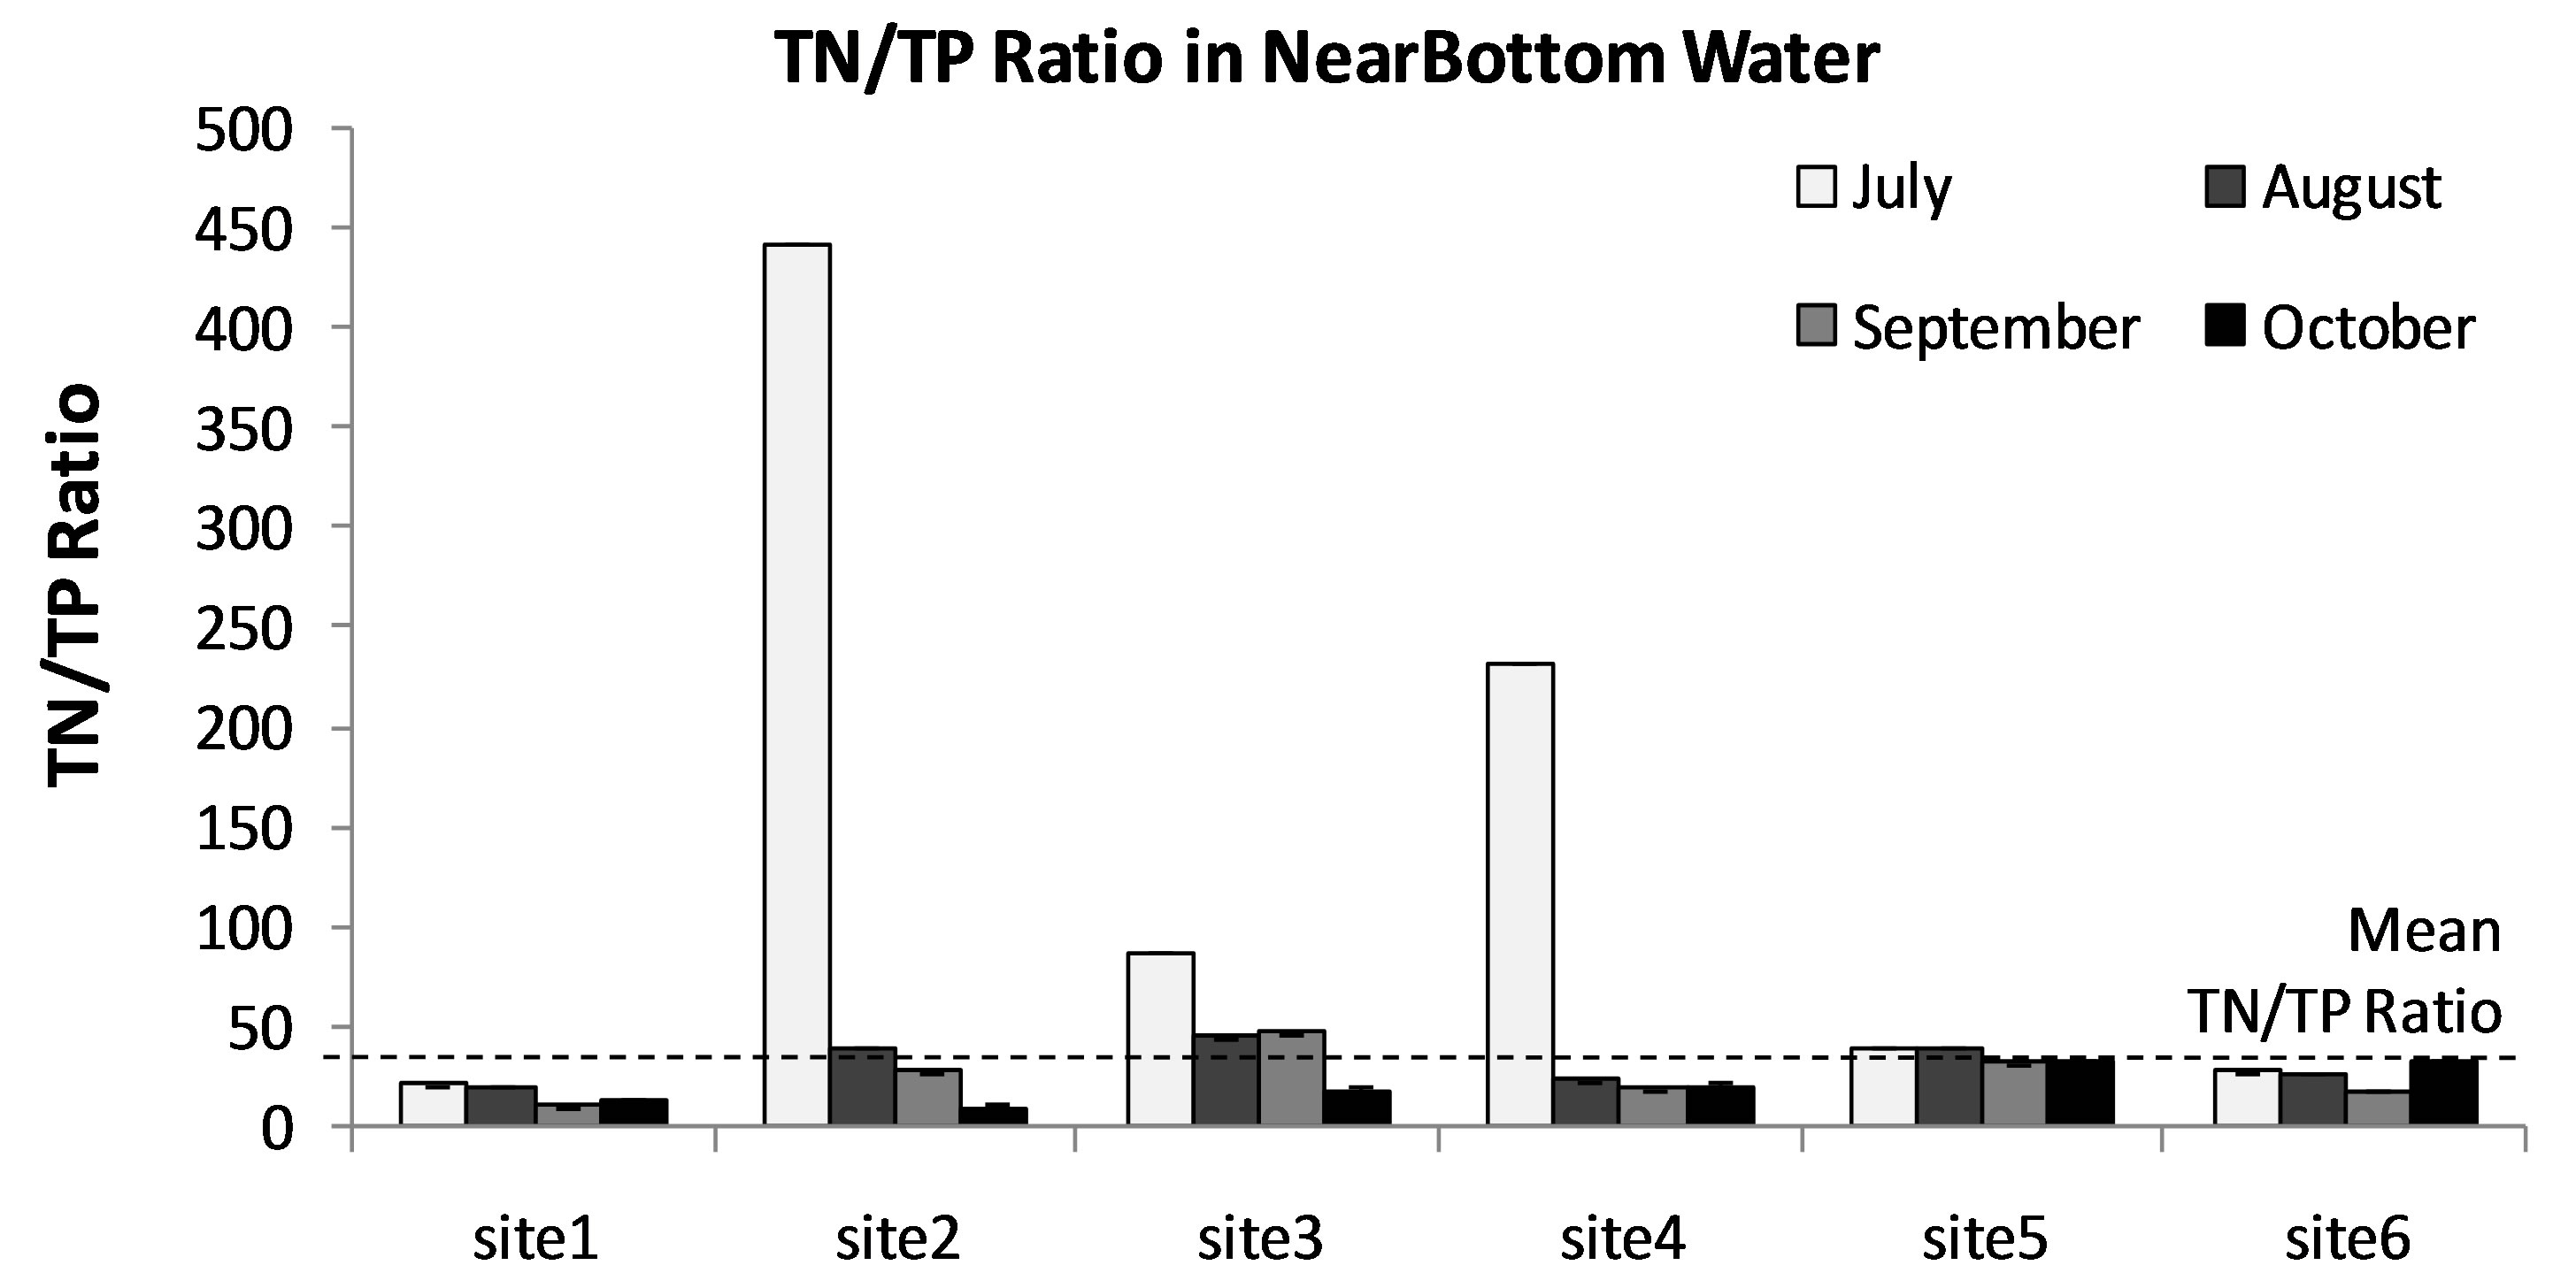 (c)
(c)
Figure 6. Monthly average ratio of TN/TP in in 3 stratified water layers (Surface (a), MidDepth (b), and NearBottom (c)) at sites 1-7 in Lake Diefenbaker during June to Oct., 2008. Dotted line: Mean TN/TP ratio observed over the entire course of the study.
that in Lake Diefenbaker the primary limiting factor for growth of Anabaena sp. was TP.
4. Conclusion
This study characterized N, P and micronutrient concentrations (Fe, Mn) during the summer/fall season in 2008 in Lake Diefenbaker, Saskatchewan, Canada, as a potential predictor of cyanobacteria blooms. Overall, the current trophic status of Lake Diefenbaker is one of moderate eutrophication. It could be demonstrated that primary production in Lake Diefenbaker is P-limited, and that increases in P-influxes represent a potential risk factor in context with the occurrence of such algal blooms. In contrast, nitrogen did not represent a limiting factor for algal
 (a)
(a)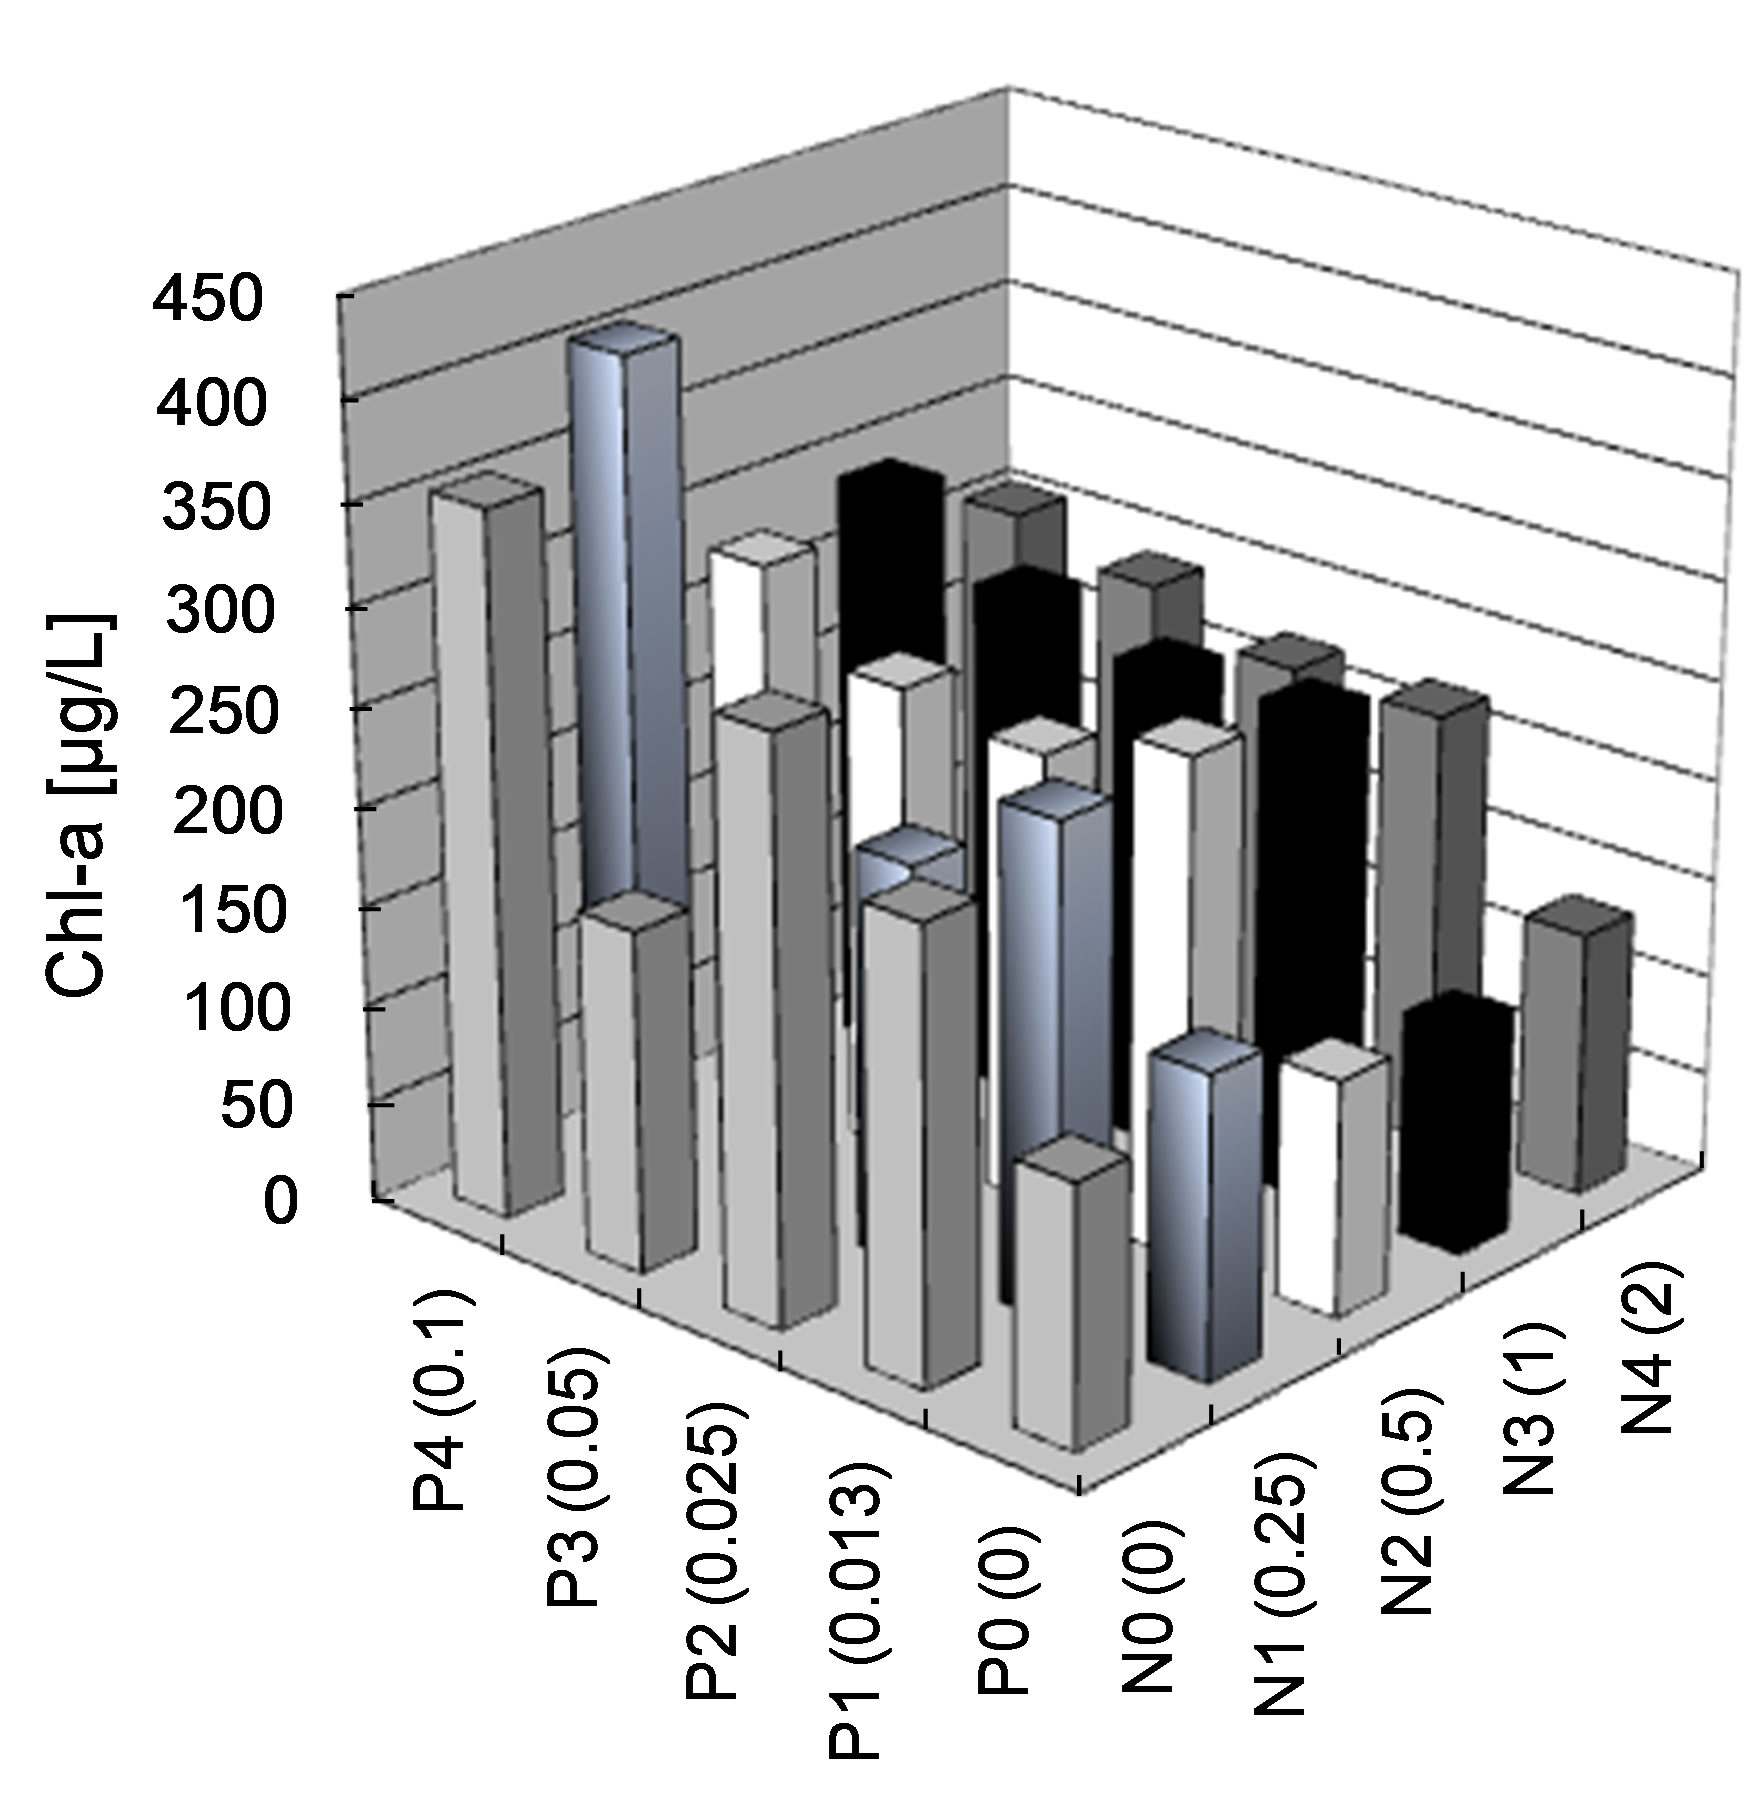 (b)
(b)
Figure 7. Average (n=3) algal (a) and Anabaena sp. (b) growth as measured by Chl-a concentrations (μg/L) in autoclaved lake water after nutrient addition of P and N. Concentrations in water were measured after 2 week of culture.
production. In addition, other factors such as wind patterns, hydrodynamics and the resulting temperature patterns as well as micronutrients such as Mn and Fe also are likely to contribute to the occurrence of algal blooms in the reservoir. A. circinalis, a common nuisance species that has the potential to seriously degrade the Lake eco-systems, was identified as the predominant cyanobacteria in Lake Diefenbaker. Therefore, it is important to continuously monitor for this species. Because increases in algal productivity were directly proportional to increases in TP, the loading of TP to the reservoir needs to be reduced to prevent future cyanobacteria blooms. It was demonstrated that there was no significant increase in TP concentrations between the upper and lower portions of the reservoir, indicating that most of the phosphorus in Lake Diefenbaker comes from upstream sites in Alberta, resulting in the need for remedial measures in the upstream reach of the South Saskatchewan River. In addition to the investigation of relationships between algal production and water quality in Lake Diefenbaker, the use of satellite imaging techniques as a predictive tool to identify algal blooms was explored in this study. While in general a promising approach, due to limited sensitiveity and issues associated with atmosphere interference this methodology should only be used in combination with parallel in situ water quality monitoring. It represents, a potentially useful adjunct tool to inform sampling in context with water quality assessment studies. In summary, while this study indicated that Lake Diefenbaker is potentially at risk in context with cyanobacteria blooms during late summer and fall, development of clear causal relationships and risk assessment strategies is currently limited due to lack of historic monitoring data and ongoing programs.
5. Acknowledgements
This research was supported by a grant from the Mid Saskatchewan Regional Economic and Co-operative Development 1-237-408066-70526, and a Discovery Grant from the National Science and Engineering Research Council of Canada (Project # 326415-07). The authors wish to acknowledge the support of an instrumentation grant from the Canada Foundation for Infrastructure. Prof. Giesy was supported by the Canada Research Chair program, an at large Chair Professorship at the Department of Biology and Chemistry and State Key Laboratory in Marine Pollution, City University of Hong Kong, The Einstein Professor Program of the Chinese Academy of Sciences and the Visiting Professor Program of King Saud University. Prof. Khim and Dr. Ryu were supported by the project “Support for research and applications of Geostationary Ocean Color Satellite (GOCI)” funded by Ministry of Land, Transportation and Maritime Affairs, Republic of Korea. The authors wish to thank Mr. James Tucker, General Manager, Mid Sask REDA and Mr. Russ McPherson, Business Development Officer, and Water Wolf Project Manager, Mid Sask Regional Development Authority (REDA), for logistical support and discussions that facilitated the development and execution of the project. The authors wish to acknowledge the following individuals in the Environmental Toxicology Laboratory of the Toxicology Centre of the University of Saskatchewan, who contributed to this research: Shanda Rolleston, Judy Espseth, Inez Barretto, Kali Bachtold and Yang Si, Xiaowei Zhang, Yi Wan, Jonathan Naile, Yinfei Yang, David Vardy and Eric Higley, Xiaofeng Wang, Guifen Yu, Zenghong Xie, and Monique Dubé and all the partners who provided data and support for this project.
REFERENCES
- D. W. Schindler, P. J. Dillon and H. Schreier, “A Review of Anthropogenic Sources of Nitrogen and Their Effects on Canadian Aquatic Ecosystems,” Biogeochemistry, Vol. 79, No. 1-2, 2006, pp. 25-44. doi:10.1007/s10533-006-9001-2
- D. F. Millie, C. P. Dionigi, O. Schofield, G. J. Kirkpattrick and P. A. Tester, “The Importance of Understanding the Molecular, Cellular, and Ecophysiological Bases of Harmful Algal Blooms,” Journal of Phycology, Vol. 35, No. 6, 1999, pp. 1353-1355. doi:10.1046/j.1529-8817.1999.3561353.x
- D. R. Figueiredo, U. M. Azeiteiro, S. M. Esteves, F. J. M. Goncalves and M. J. Pereira, “Microcystin-Producing Blooms—A Serious Global Public Health Issue,” Ecotoxicology and Environmental Safety, Vol. 59, No. 2, 2004, pp. 151-163. doi:10.1016/j.ecoenv.2004.04.006
- J. Barica, “Water Quality Problems Associated with High Productivity of Prairie Lakes in Canada: A Review,” Water Quality Bulletin, Vol. 12, No. 3, 1987, pp. 107- 115.
- World Wildlife Fund, “Canada’s Rivers at Risk,” 2009. http://assets.wwf.ca/downloads/canadas_rivers_at_risk.pdf
- D. M. Rosenberg, P. A. Chambers, J. M. Culp, G. Franzin, P. A. Nelson, A. G. Salkim, P. Stainton, A. Bodaly and R. W. Newbury, “Nelson and Churchill River Basins,” In: A. Benke and C. Cushing, Eds., Rivers of North America, Elsevier, Amsterdam, 2005, pp. 852-901. doi:10.1016/B978-012088253-3/50022-5
- J. Pomeroy, D. de Boer and L. Martz, “Hydrology and Water Resources of Saskatchewan,” Centre for Hydrology Report #1, University of Saskatchewan, Saskatoon. http://www.usask.ca/hydrology/reports/CHRpt01_Hydrology-Water-Resources-Sask_Feb05.pdf
- Saskatchewan Watershed Authority, 2011. http://www.swa.ca
- International Lake Environment Committee, “Lake Diefenbaker,” 2011. http://www.ilec.or.jp/database/nam/nam-58.html
- Alberta Institute of Agrologists, “Environment for Growth: People to Water, Water to People,” 2005. http://www.aia.ab.ca.
- C. S. Reynolds and A. E. Walsby, “Water Blooms,” Biological Reviews, Vol. 50, No. 4, 1975, pp. 437-481. doi:10.1111/j.1469-185X.1975.tb01060.x
- R. L. Peter, S. B. Curtis, E. Cortney and P. Alain, “Landscape-Scale Effects of Urban Nitrogen on a Chain of Freshwater Lakes in Central North America,” Limnology and Oceanography, Vol. 51, No. 5, 2006, pp. 2262-2277. doi:10.4319/lo.2006.51.5.2262
- J. M. Jacoby, D. C. Collier, E. B. Welch, F. J. Hardy and M. Crayton “Environmental Factors Associated with a Toxic Bloom of Microcysitis aeruginosa,” Canadian Journal of Fisheries and Aquatic Sciences, Vol. 57, No. 1, 2007, pp. 231-240. doi:10.1139/f99-234
- Tourism Saskatchewan, “Lake Diefenbaker Tourism Destination Plan,” 2008. http://www.waterwolf.org/PDFs/LakeDiefenbakerDestinationAreaPlan_June2008.pdf
- K. E. Havens, R. T. James, T. L. East and V. H. Smith, “N:P Ratios, Light Limitation, and Cyanobacterial Dominance in a Subtropical Lake Impacted by Non-Point Source Nutrient Pollution,” Environmental Pollution, Vol. 122, No. 3, 2003, pp. 379-390. doi:10.1016/S0269-7491(02)00304-4
- D. W. Schindler, R. E. Hecky, D. L. Findlay, M. P. Stainton, B. R. Parker, M. J. Paterson, K. G. Beaty, M. Lyng and S. E. M. Kasian “Eutrophication of Lakes Cannot Be Controlled by Reducing Nitrogen Input: Results of a 37- Year Whole-Ecosystem Experiment,” PNAS, Vol. 105, No. 32, 2008, pp. 11254-11258. doi:10.1073/pnas.0805108105
- H. W. Paerl, N. S. Hall and E. S. Calandrino, “Controlling Harmful Cyanobacterial Blooms in a World Experiencing Anthropogenic and Climatic-Induced Change,” Science of the Total Environment, Vol. 409, No. 10, 2011, pp. 1739-1745. doi:10.1016/j.scitotenv.2011.02.001
- J. G. Rueter and R. R. Petersen, “Micronutrient Effects on Cyanobacterial Growth and Physiology,” New Zealand Journal of Marine Freshwater Research, Vol. 21, No. 3, 1987, pp. 435-445. doi:10.1080/00288330.1987.9516239
- L. E. Brand, “Minimum Iron Requirements of Marine Phytoplankton and the Implications for the Biogeochemical Control of New Production,” Limnology and Oceanography, Vol. 36, No. 8, 1991, pp. 1756-1771. doi:10.4319/lo.1991.36.8.1756
- R. L. North, S. J. Guildford, R. E. H. Smith, S. M. Havens and M. R. Twiss, “Evidence for Phosphorus, Nitrogen, and Iron Colimitation of Phytoplankton Communities in Lake Erie,” Limnology and Oceanography, Vol. 52, No. 1, 2007, pp. 315-328. doi:10.4319/lo.2007.52.1.0315
- D. F. Millie, G. L. Fahnenstiel, J. D. Bressie, R. J. Pigg, R. R. Rediske, D. M. Klarer, P. A. Tester and R. W. Litaker, “Late-Summer Phytoplankton in Western Lake Erie (Laurentian Great Lakes): Bloom Distributions, Toxicity, and Environmental Influences,” Aquatic Ecology, Vol. 43, No. 4, 2009, pp. 915-934. doi:10.1007/s10452-009-9238-7
- OECD, “Eutrophication of Water, Monitoring, Assessment and Control,” Organization for Economic Cooperation and Development (OECD), Paris, 1982.
- C. J. Lorenzen, “Determination of Chlorophyll and PheoPigments: Spectrophotometric Equations,” Limnology and Oceanography, Vol. 12, No. 2, 1967, pp. 343-346. doi:10.4319/lo.1967.12.2.0343
- S. W. Jeffrey and G. F. Humphrey, “New Spectrophotometric Equations for Determining Chlorophyll a, b c1 and c2 in Higher Plants, Algae and Natural Phytoplankton,” biochemie und physiologie der pflanzen, Vol. 167, No. 2, 1975, pp. 191-194.
- US-EPA, “In Vitro Determination of Chlorophyll A and Pheophytin A in Marine and Freshwater Algae by Fluorescence,” US Environmental Protection Agency (EPA) Cincinnati, 1997.
- Environment Canada, “Guidance Document on Statistical Methods for Environmental Toxicity Tests,” Ottawa, 2005.
- J. N. Boyer, C. R. Kelble, P. B. Ortner and D. T. Rudnick, “Phytoplankton Bloom Status: Chlorophyll A Biomass as an Indicator of Water Quality Condition in the Southern Estuaries of Florida, USA,” Ecological Indicators, Vol. 9S, No. 6, 2009, pp. S56-S57. doi:10.1016/j.ecolind.2008.11.013
- E. Rott, “Chlorophyll-A-Konzentrationen und Zellvolumen als Parameter der Phytoplakntonbiomasse,” Berichte des Naturwissenschaftlichen-Medizinischen Vereins in Innsbruck, Vol. 65, 1978, pp. 11-21.
- K. A. Moser, J. P. Smol, G. M. MacDonald and G. P. S. Larsen, “19th Century Eutrophication of a Remote Boreal Lake: A Consequence of Climate Warming?” Journal of Paleolimnology, Vol. 28, No. 2, 2002, pp. 269-281. doi:10.1023/A:1021635024757
- P. Werner and J. P. Smol, “Diatom-Environmental Relationships and Nutrient Transfer Functions from Contrasting Shallow and Deep Limestone Lakes in Ontario, Canada,” Hydrobiologia, Vol. 533, No. 1-3, 2005, pp. 145- 173. doi:10.1007/s10750-004-2409-6
- P. Van Hove, C. Belzile, A. E. G. John and F. V. Warwick, “Coupled Landscape-Lake Evolution in High Arctic Canada,” Canadian Journal of Earth Science, Vol. 43, No. 5, 2006, pp. 533-546. doi:10.1139/e06-003
- D. R. Euan and P. S. John, “Diatom-Environmental Relationships in 64 Alkaline Southeastern Ontario (Canada) Lakes: A Diatom-Based Model for Water Quality Reconstructions,” Journal of Paleolimnology, Vol. 25, No. 1, 2001, pp. 25-42. doi:10.1023/A:1008123613298
- Y. S. Li, X. Chen, O. W. Wai and B. King, “Study on the Dynamics of Algal Bloom and Its Influence Factors in Tolo Harbour, Hong Kong,” Water Environment Research, Vol. 76, No. 7, 2004, pp. 2643-2654.
- Q. Chen, H. J. Han, S. J. Zhai and W. P. Hu, “Innuence of Solar Radiation and Water Temperallre on Chlorophyll-a Levels in Lake Taihu, China,” Acta Scientiae Circumstantiae, Vol. 29, No. 1, 2009, pp. 199-206.
- I. Kanoshina, U. Lips and J.-M. Leppänen, “The Influence of Weather Conditions (Temperature and Wind) on Cyanobacterial Bloom Development in the Gulf of Finland (Baltic Sea),” Harmful Algae, Vol. 2, No. 1, 2003, pp. 29- 41. doi:10.1016/S1568-9883(02)00085-9
- M. Kahru and J.-M. Leppanen “Cyanobacterial Blooms Cause Heating of the Sea Surface,” Marine Ecology Progress Series, Vol. 101, No. 1-2, 1993, pp. 1-7. doi:10.3354/meps101001
- L. Weikun, X. Guoqing, Y. Lingxiang and Y. Shuping “Distribution of Bluealga Bloom over Dianchi Lake Monitored with MODIS Remote Sensing Images,” Meteorological Science and Technology, Vol. 37, No. 5, 2009, pp. 618-620.
- Y. Zhang, S. Lin, X. Qian, Q. Wang, Y. Qian, J. Liu and Y. Ge, “Temporal and Spatial Variability of Chlorophyll A Concentration in Lake Taihu Using MODIS TimeSeries Data,” Hydrobiologia, Vol. 661, No. 1, 2011, pp. 235- 250. doi:10.1007/s10750-010-0528-9
- X. Wang, S. Bai, X. Lu, Q. Li, X. Zhang and L. Yu, “Ecological Risk Assessment of Eutrophication in Songhua Lake, China,” Stochastic Environmental Research and Risk Assessment, Vol. 22, No. 4, 2008, pp. 477-486. doi:10.1007/s00477-007-0147-9
- S. J. Guildford and R. E. Hecky, “Total Nitrogen, Total Phosphorus and Nutrient Limitation in Lakes and Oceans: Is There a Common Relationship?” Limnology and Oceanography, Vol. 45, No. 6, 2000, pp. 1213-1223. doi:10.4319/lo.2000.45.6.1213
- EPA, “Nutrient Criteria Technical Guidance Manual Lakes and Reservoirs,” EPA-822-B00-001, 2000. http://www.epa.gov
- J. A. Downing and E. McCauley, “The Nitrogen: Phosphorus Relationship in Lakes,” Limnology and Oceanography, Vol. 37, No. 5, 1992, pp. 936-945. doi:10.4319/lo.1992.37.5.0936
- R. S. Sternberger and E. K. Miller, “A Zooplankton N:PRatio Indicator for Lakes,” Stochastic Environmental Research and Risk Assessment, Vol. 51, No. 1-2, 1998, pp. 29-51. doi:10.1023/A:1005965223474
- M. A. Donald, M. G. Patricia and M. B. Joann, “Harmful Algal Blooms and Eutrophication Nutrient Sources, Composition, and Consequences,” Estuaries and Coasts, Vol. 25, No. 4, 2002, pp. 704-726. doi:10.1007/BF02804901
- R. A. Vollenweider, “Elemental and Biochemical Composition of Plankton Biomass: Some Comments and Explorations,” Arch fur Hydrobiologie, Vol. 105, No. 5, 1985, pp. 11-29.
- I. Chorus and J. Bartram, “Toxic Cyanobacteria in Water: A Guide to Their Public Health Consequences, Monitoring and Management,” F & FN Spon, London, 1999.
- G. E. Fogg, “The Physiology of an Algal Nuisance,” Proceedings of the Royal Society B, Vol. 173 1969, pp. 175- 189. doi:10.1098/rspb.1969.0045
Supplemental Materials

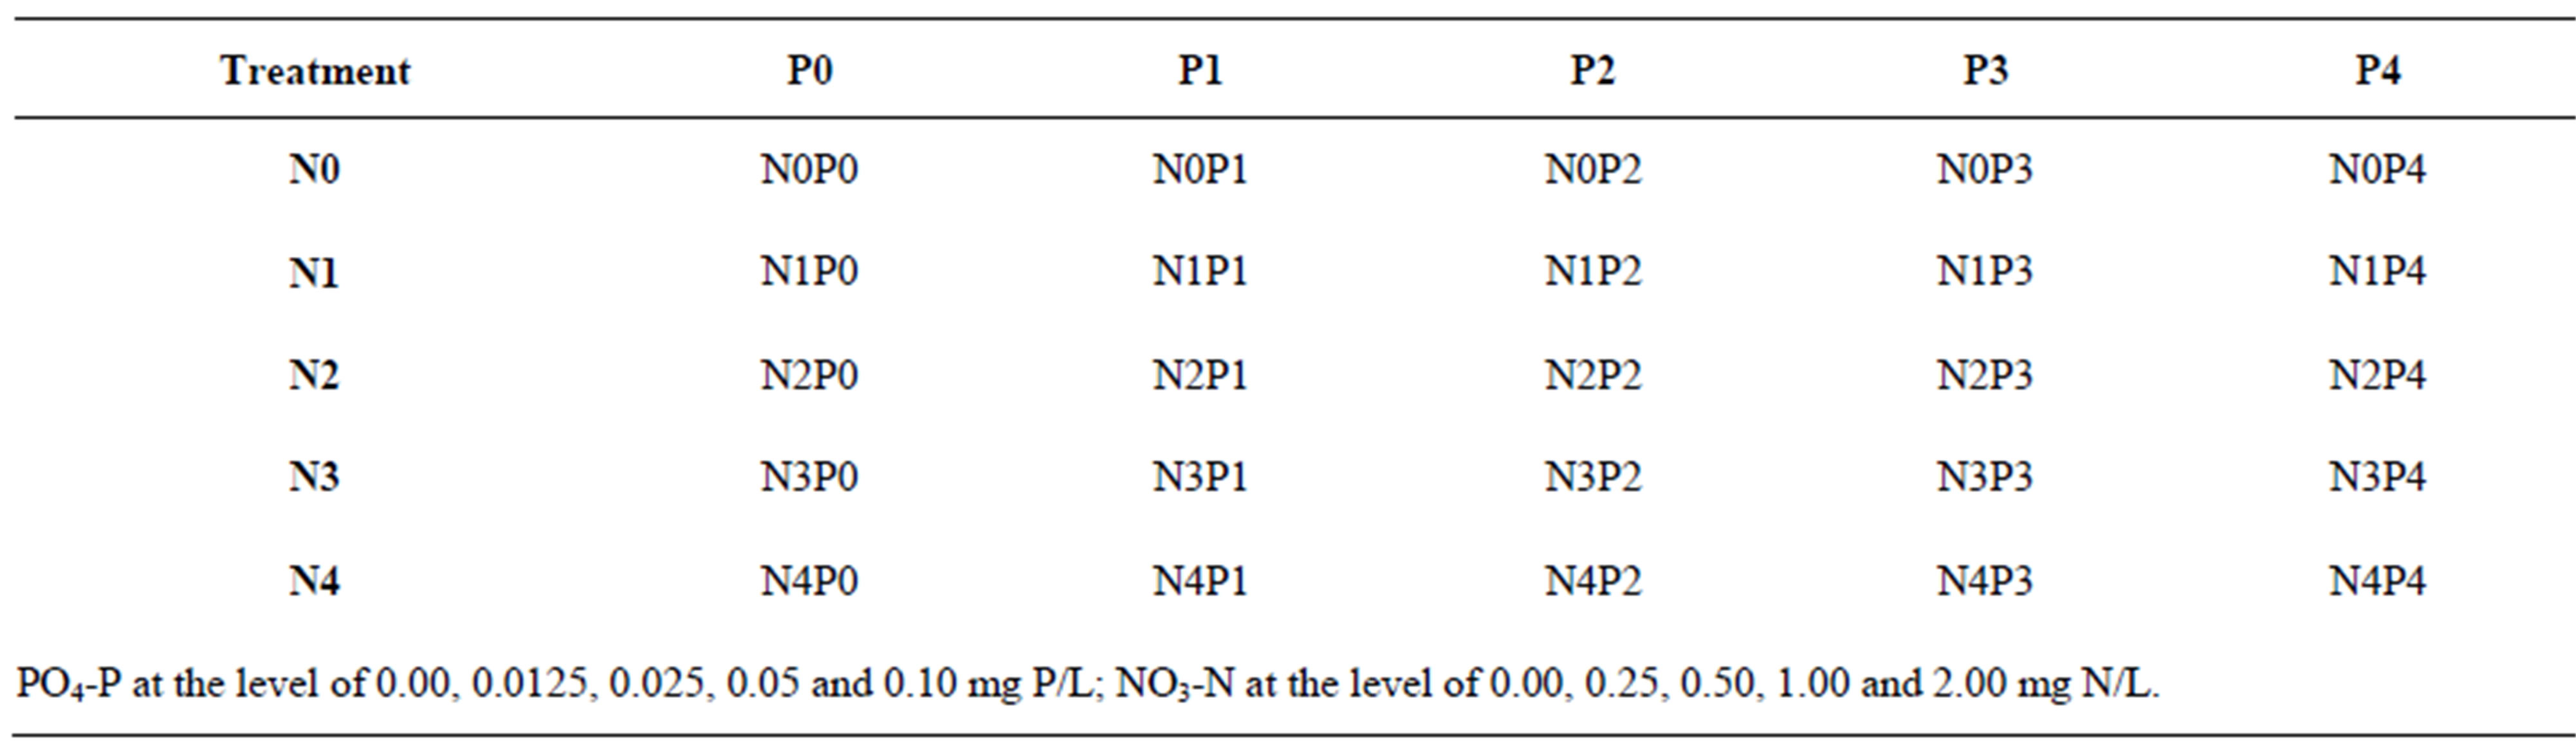
Table S1. Water quality parameters measured in Lake Diefenbaker and analytical methods.

Table S2. Nutrient addition design for algalbioassay.
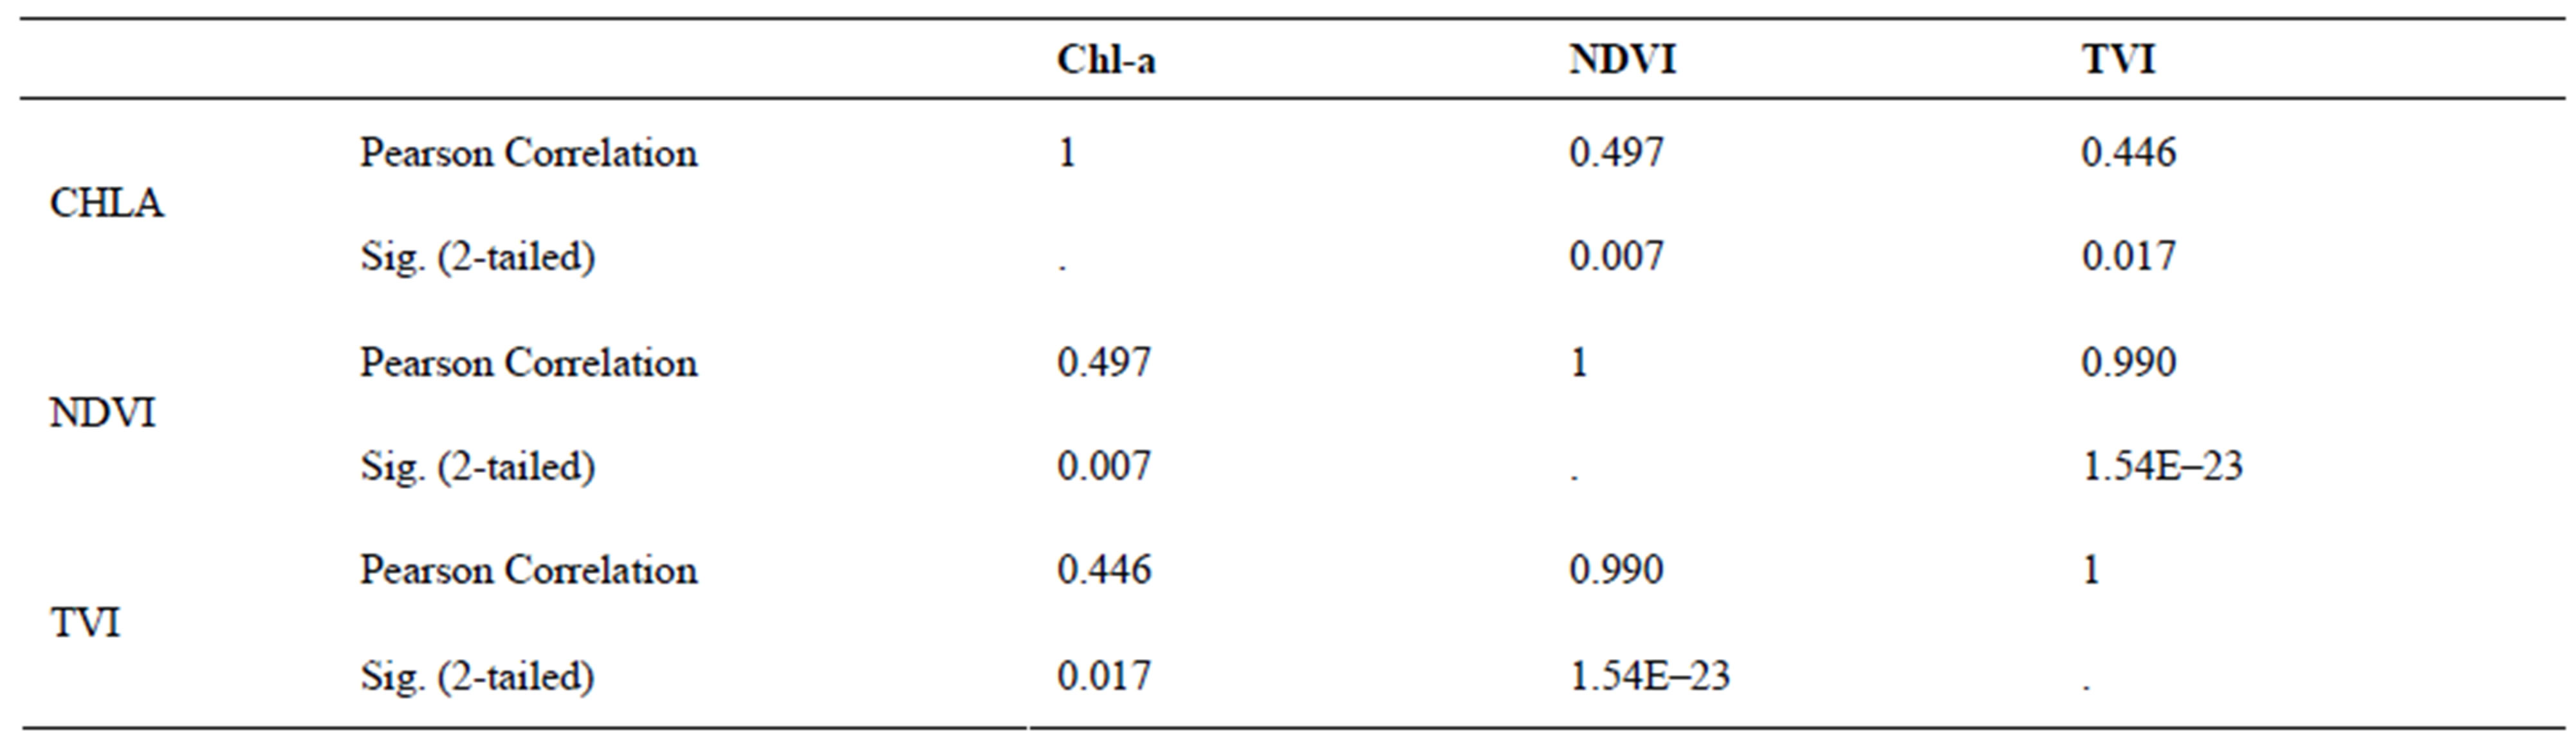
Table S3. Concentrations of Chlorophyll a, NDVI and TVI in surface water of Lake Diefenbaker as determined by satellite imagery by use of MODIS Terra (http://modis.gsfc.nasa.gov/).
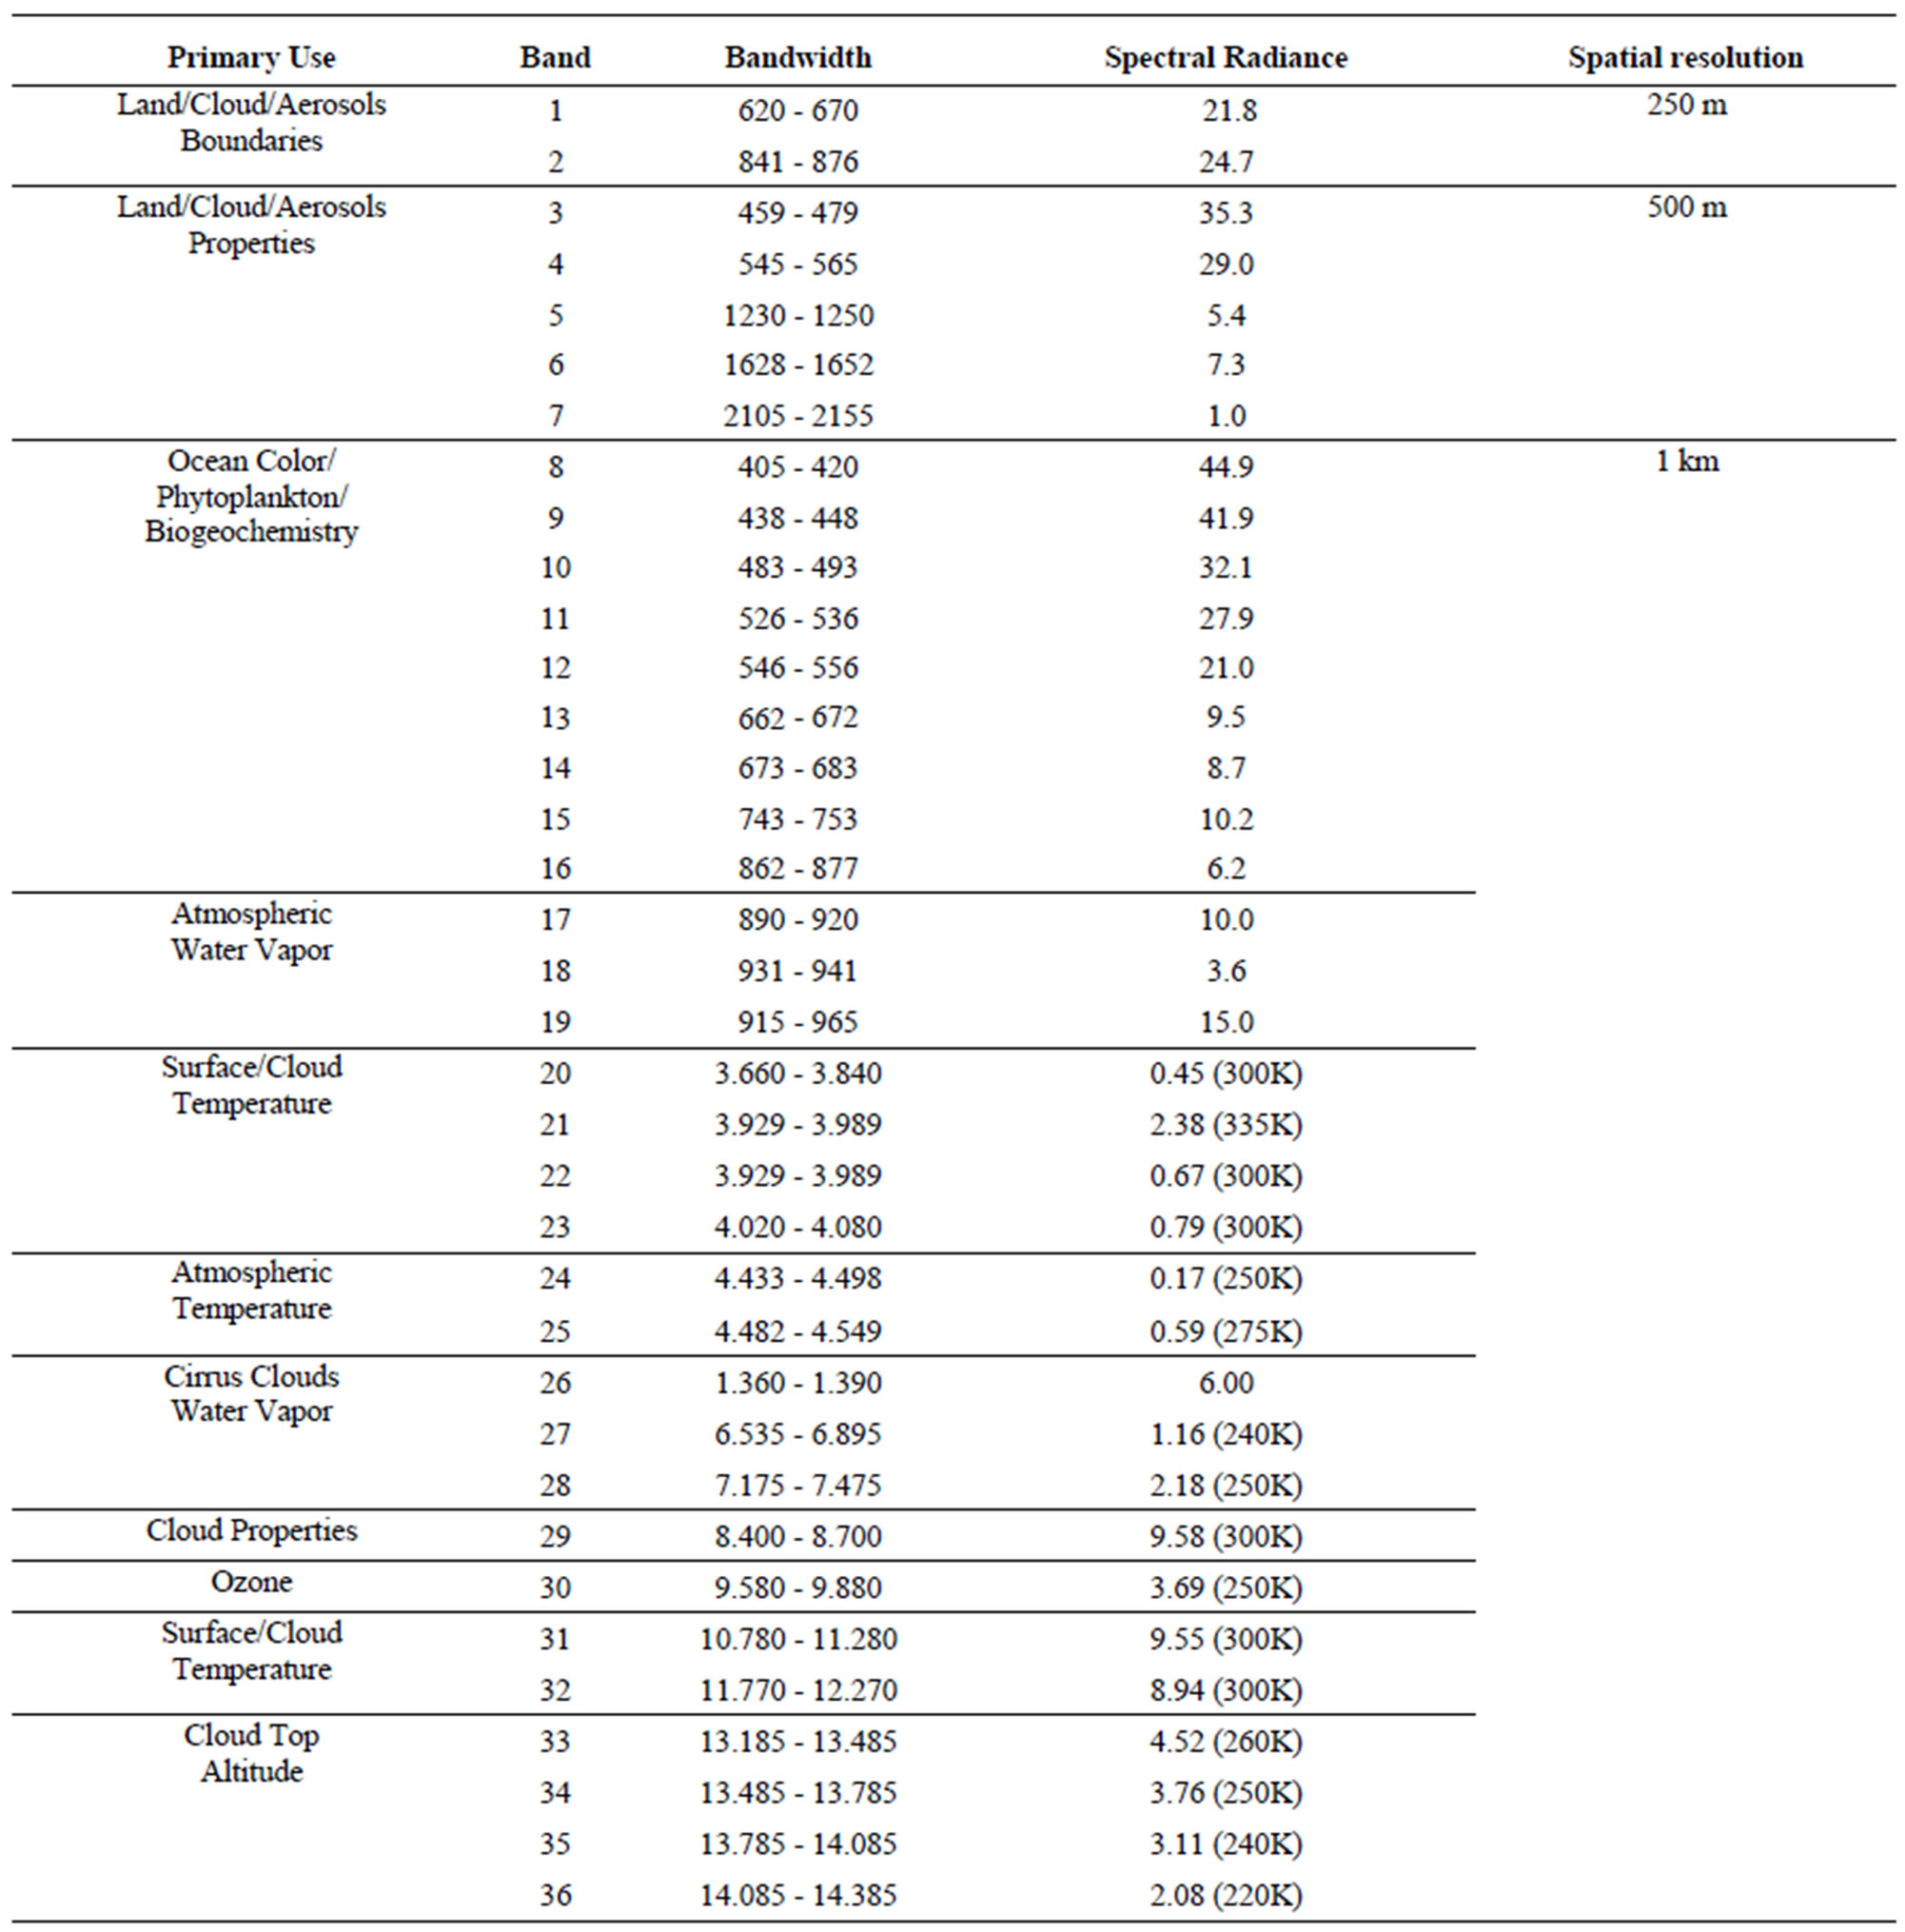
Table S4. Pearson correlation of Chl-a, NDVI and TVI in surface water of Lake Diefenbaker as determined by satellite imagery using MODIS Terra.
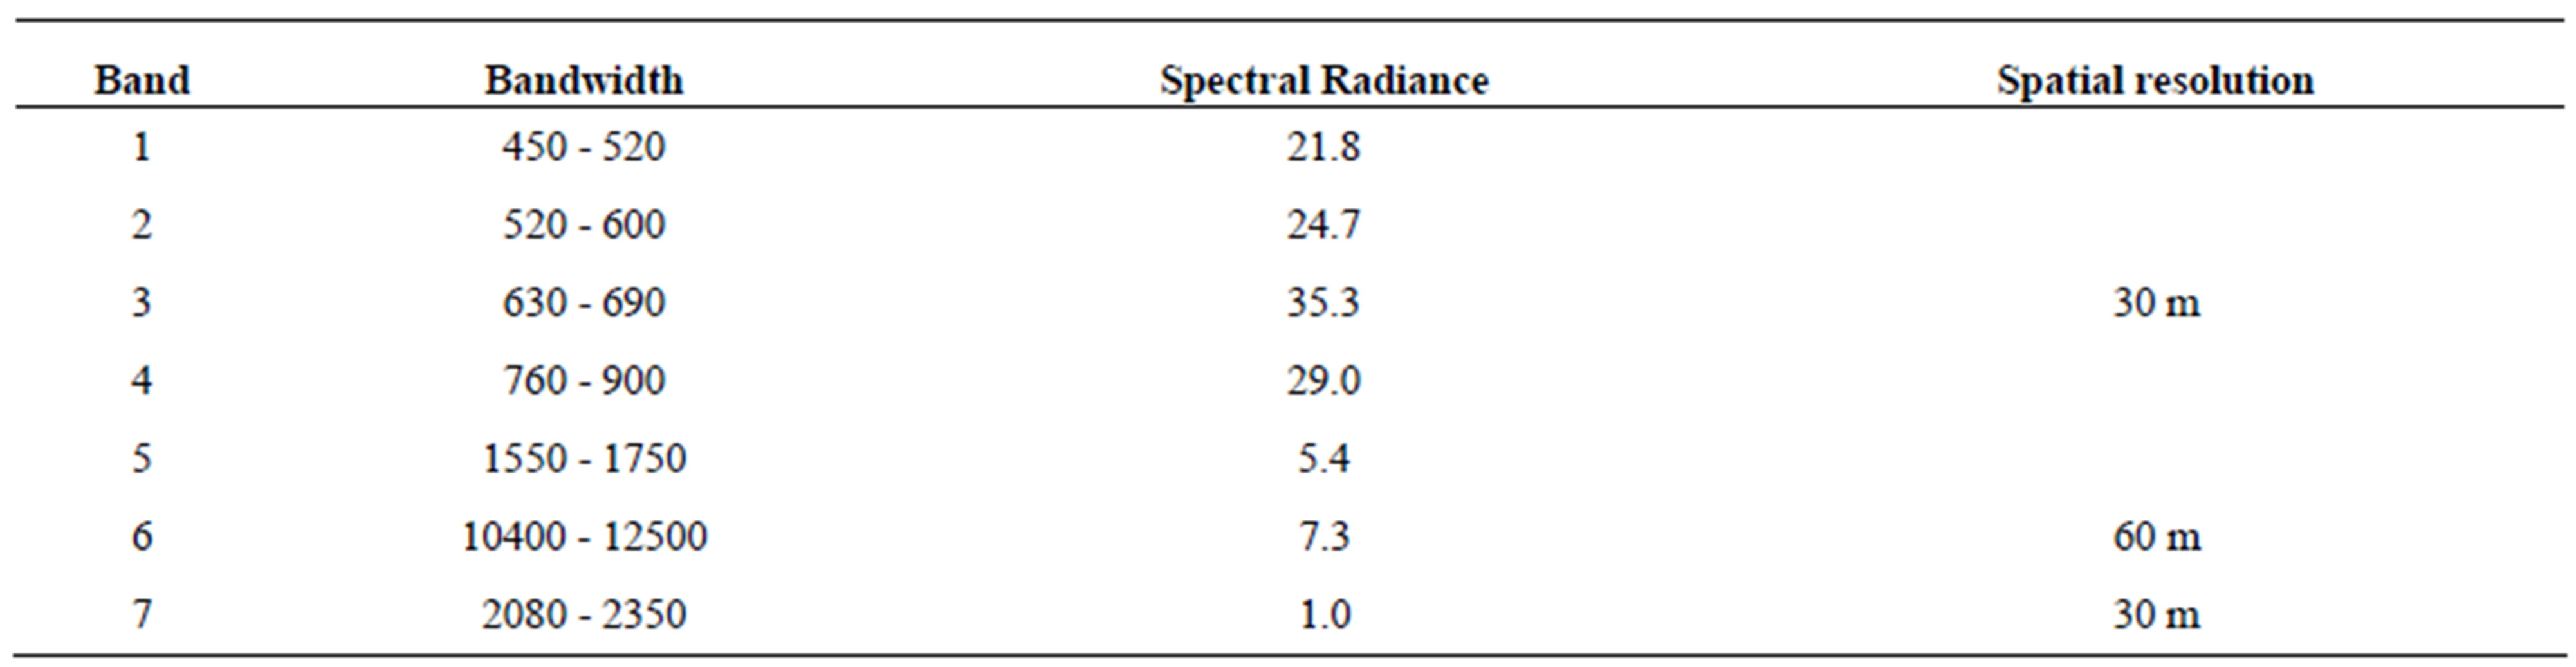
Table S5. Image specification for the MODIS sensor.
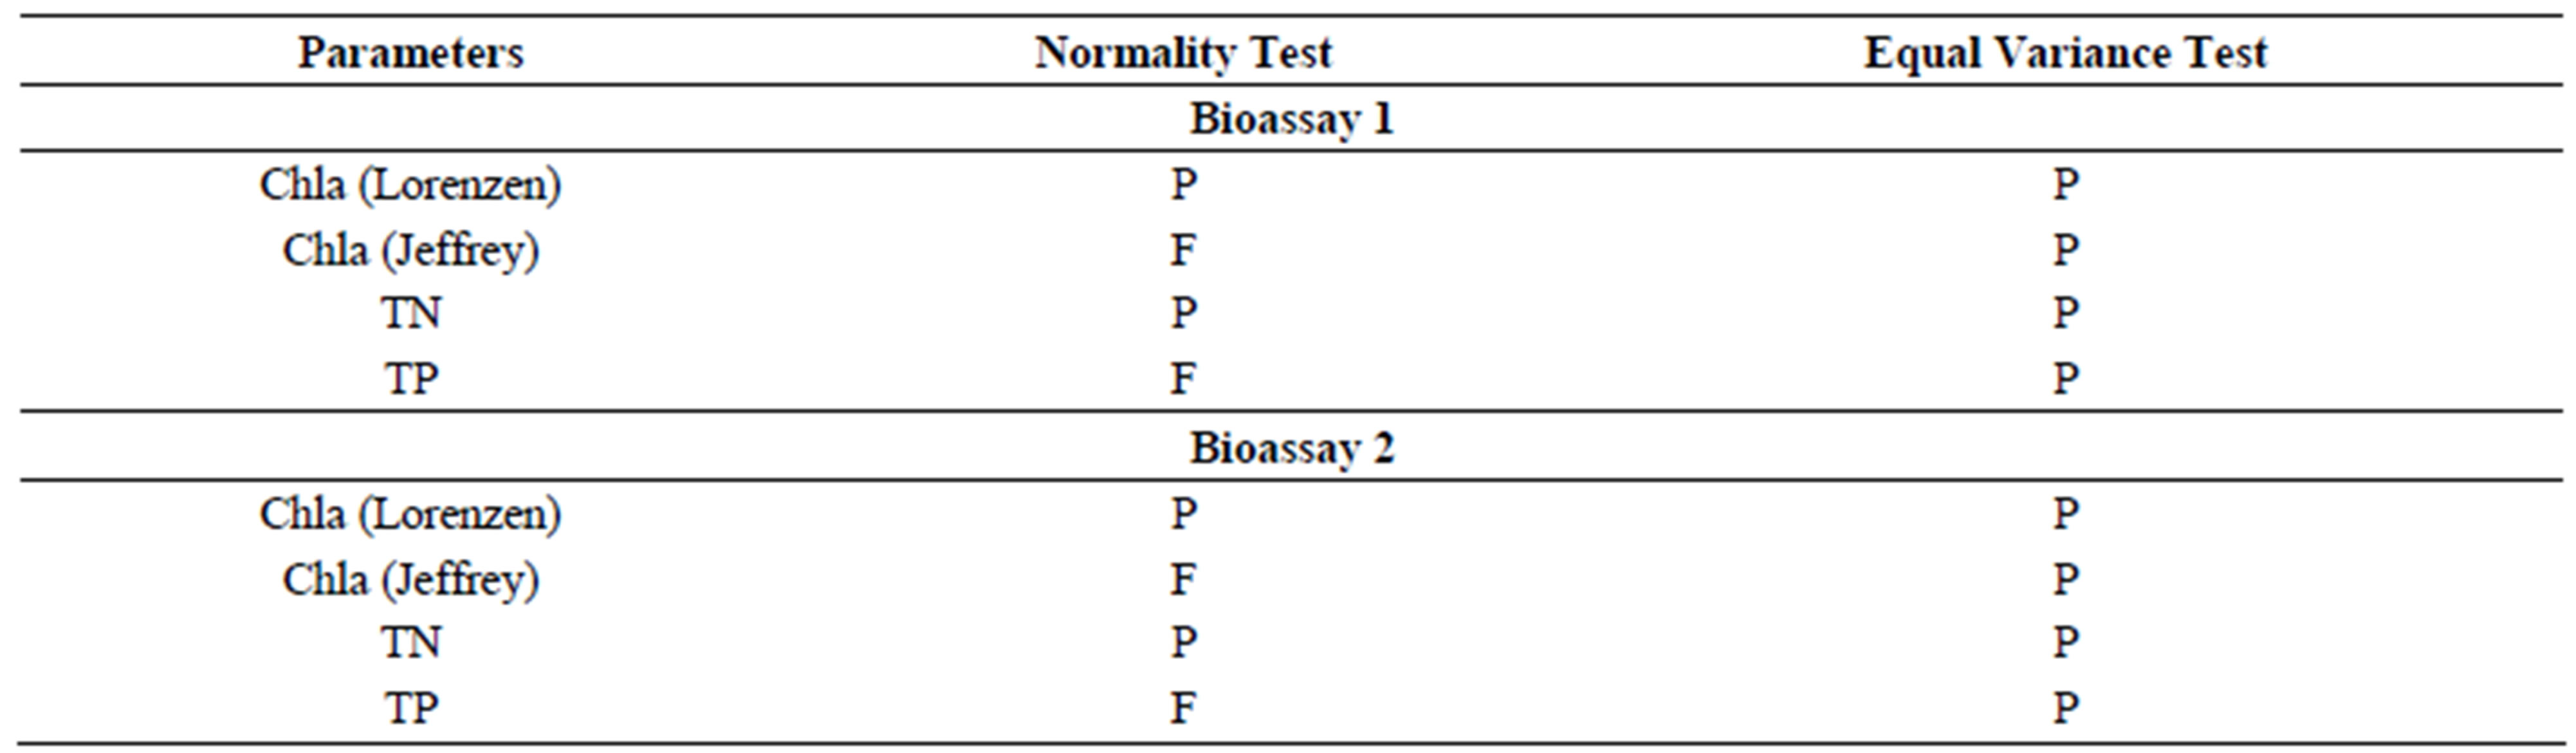
Table S6.Image specification for the Landsat ETM + sensor.
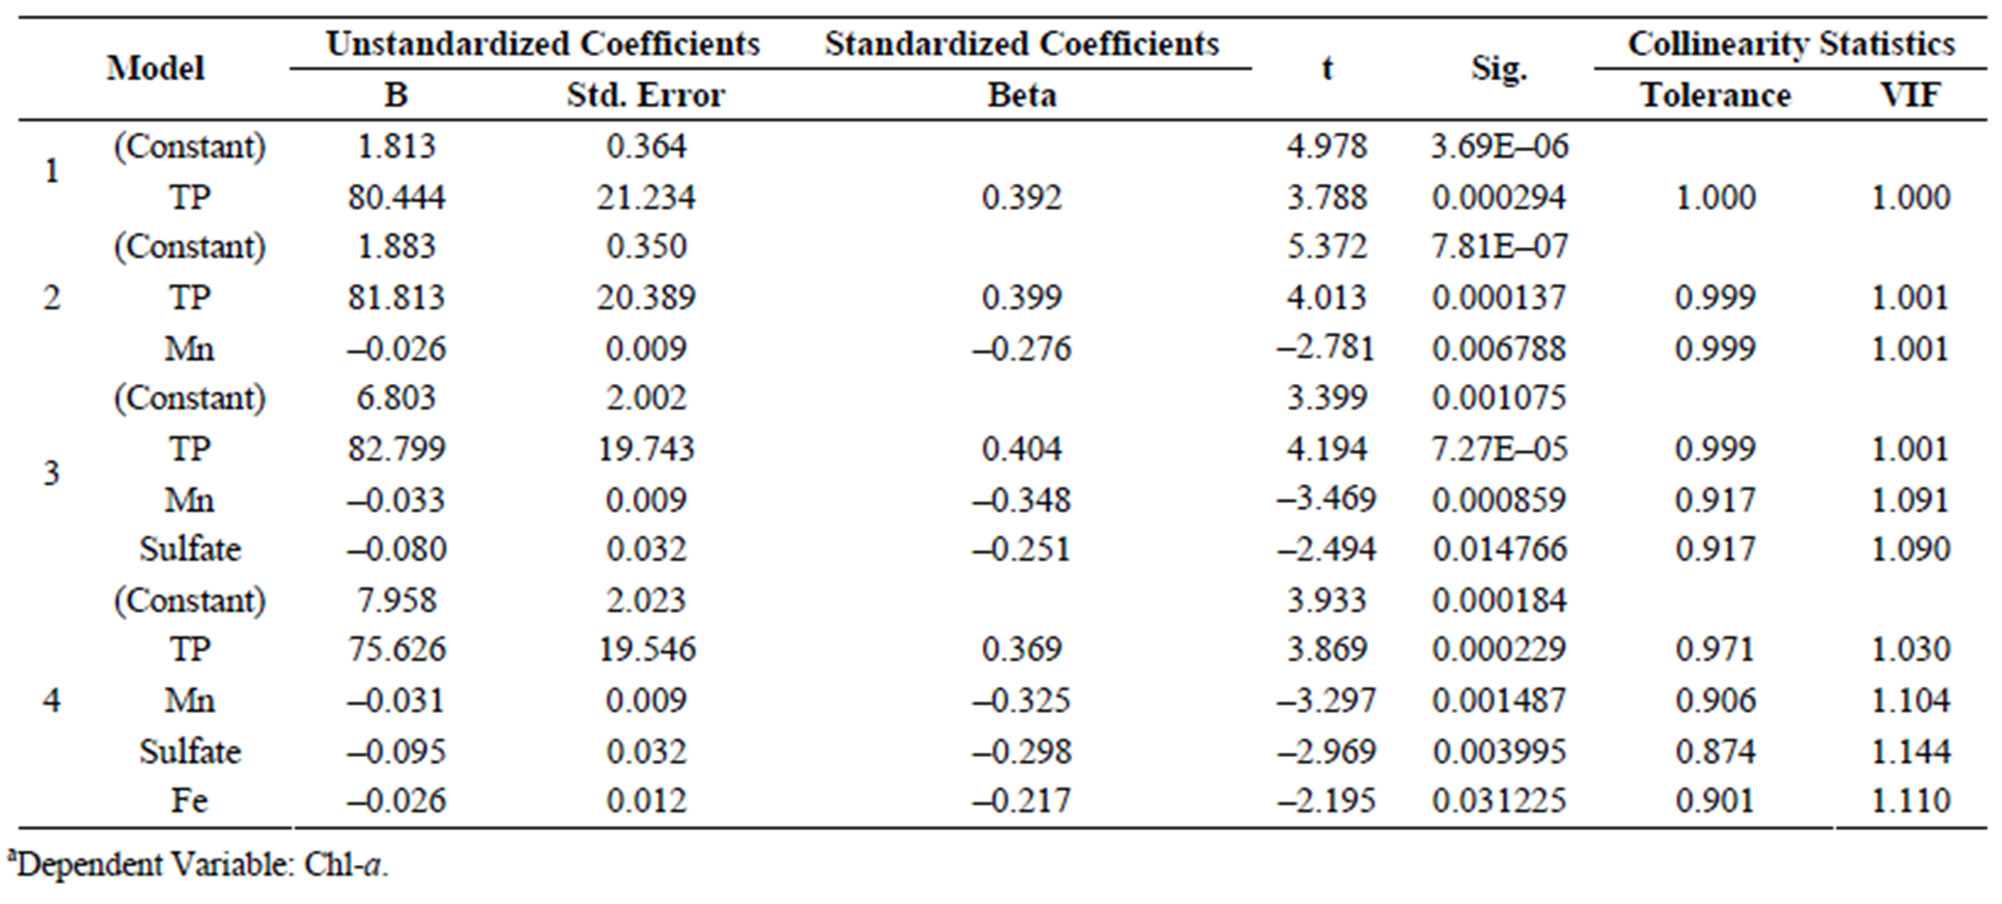
Table S7.Results of tests of normality and equal variance of parameters in two-way ANOVA with SNK method for average Bioassay 1-2. P (Passed) indicates the assumption was met (p > 0.05) and F (Failed) indicates that it was not met (p ≤ 0.05).
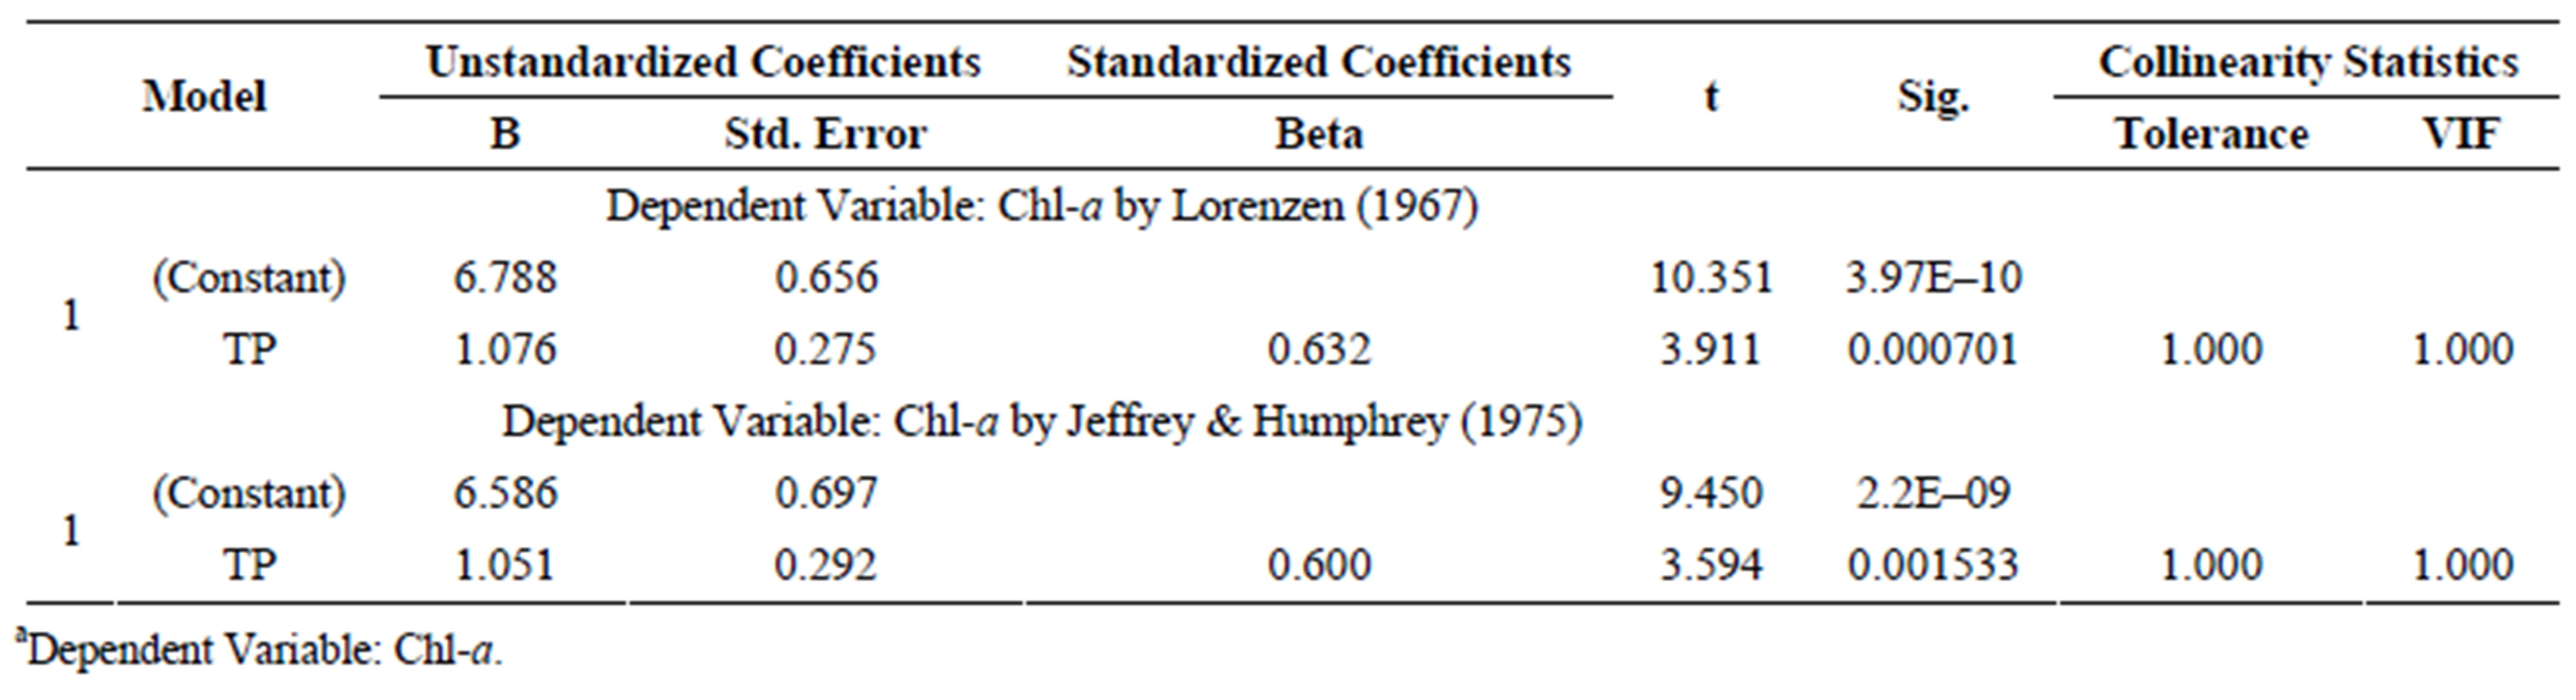
Table S8.a of 9 lake water nutrient parameters compared with Chl-a.
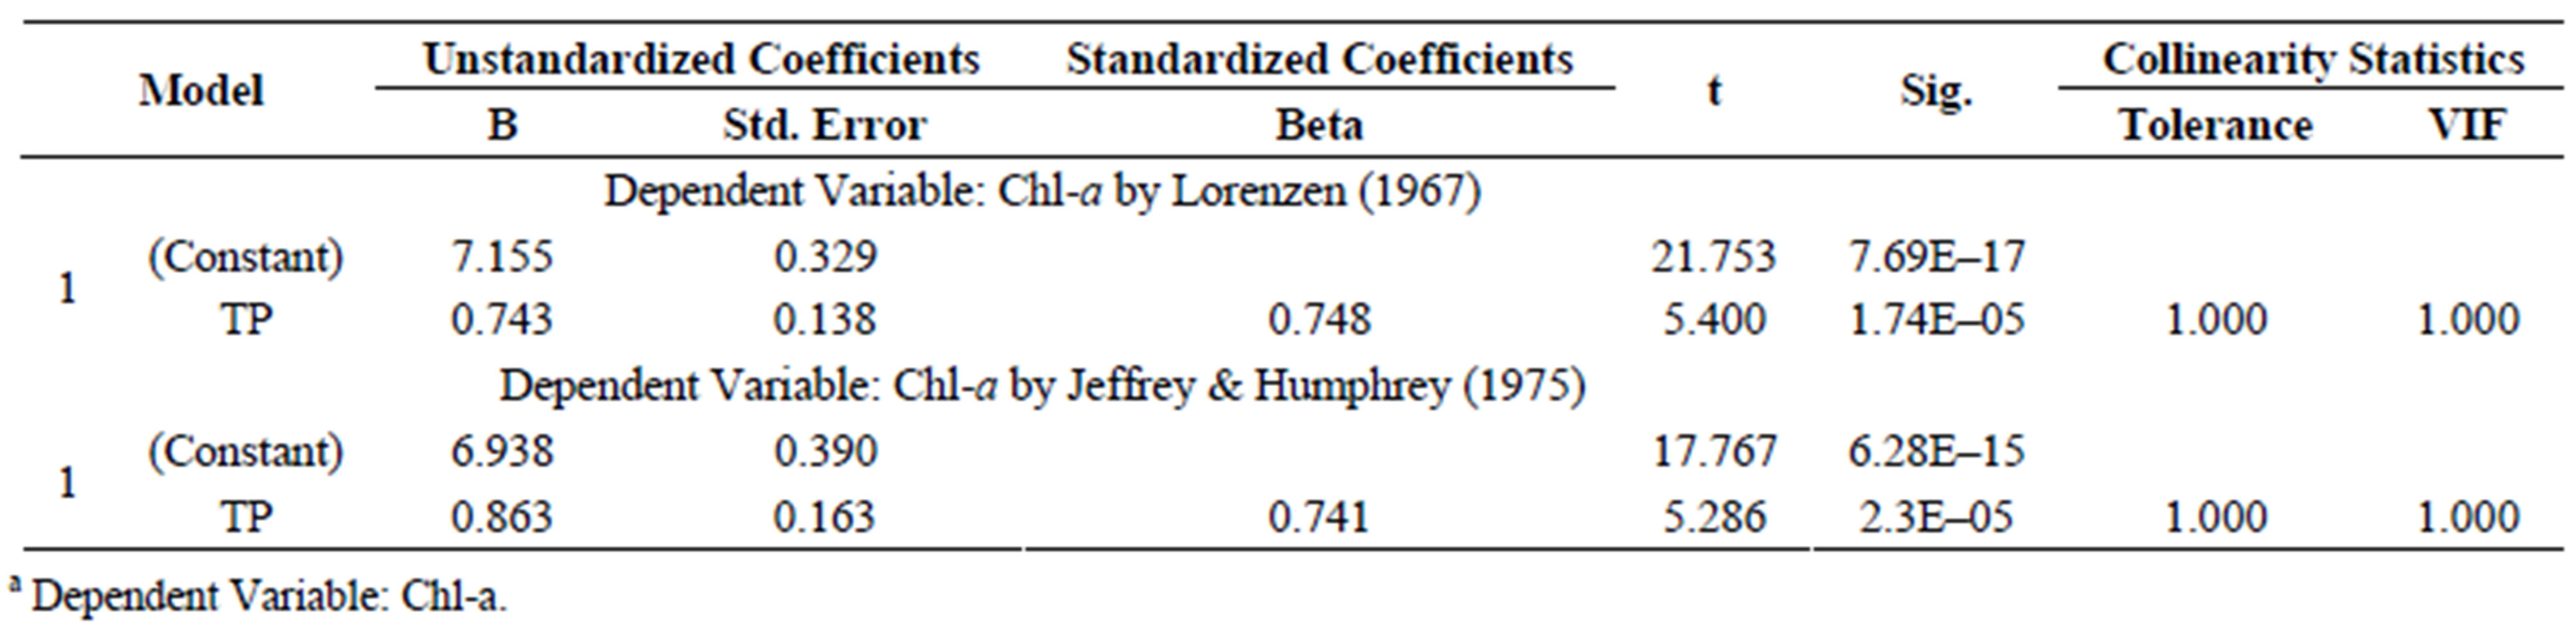
Table S9.a of lake algae Chl-a compared with TP after 2 weeks of culture.
 (a)
(a) 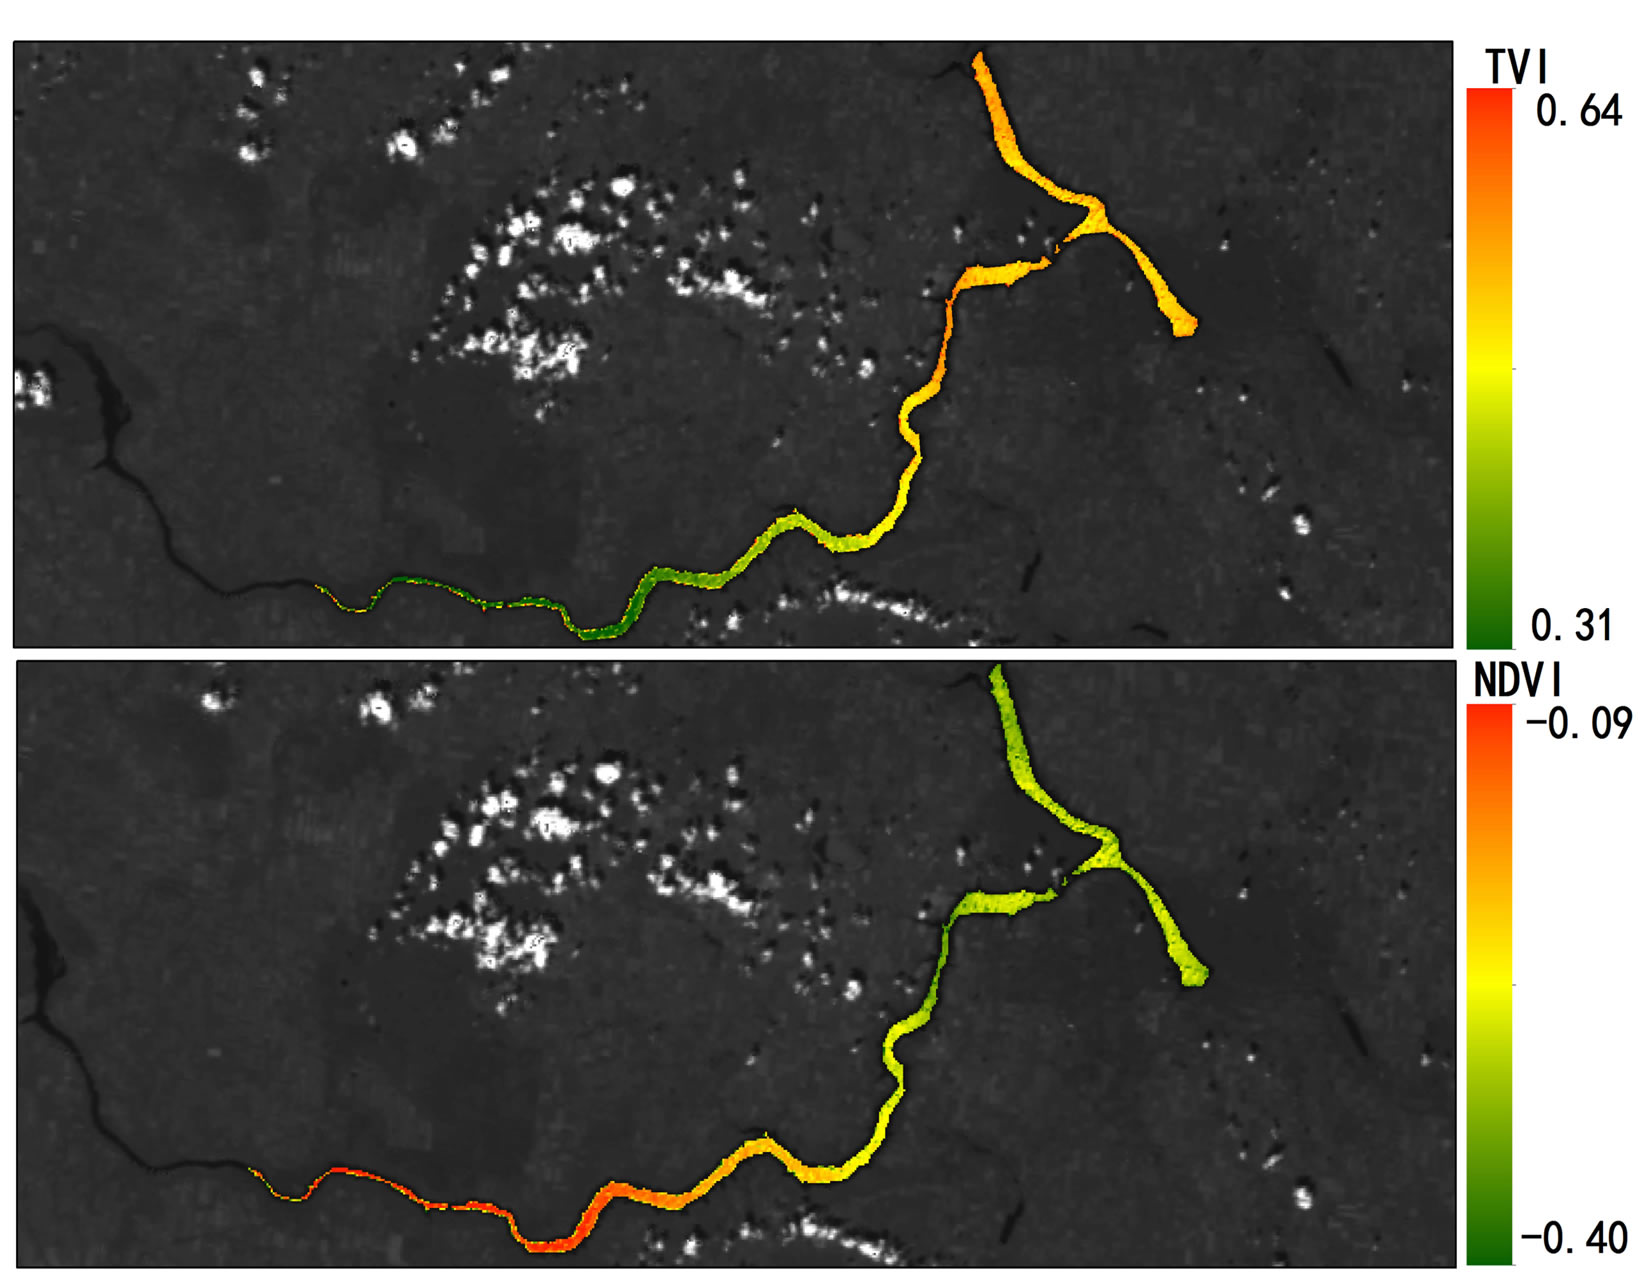 (b)
(b) 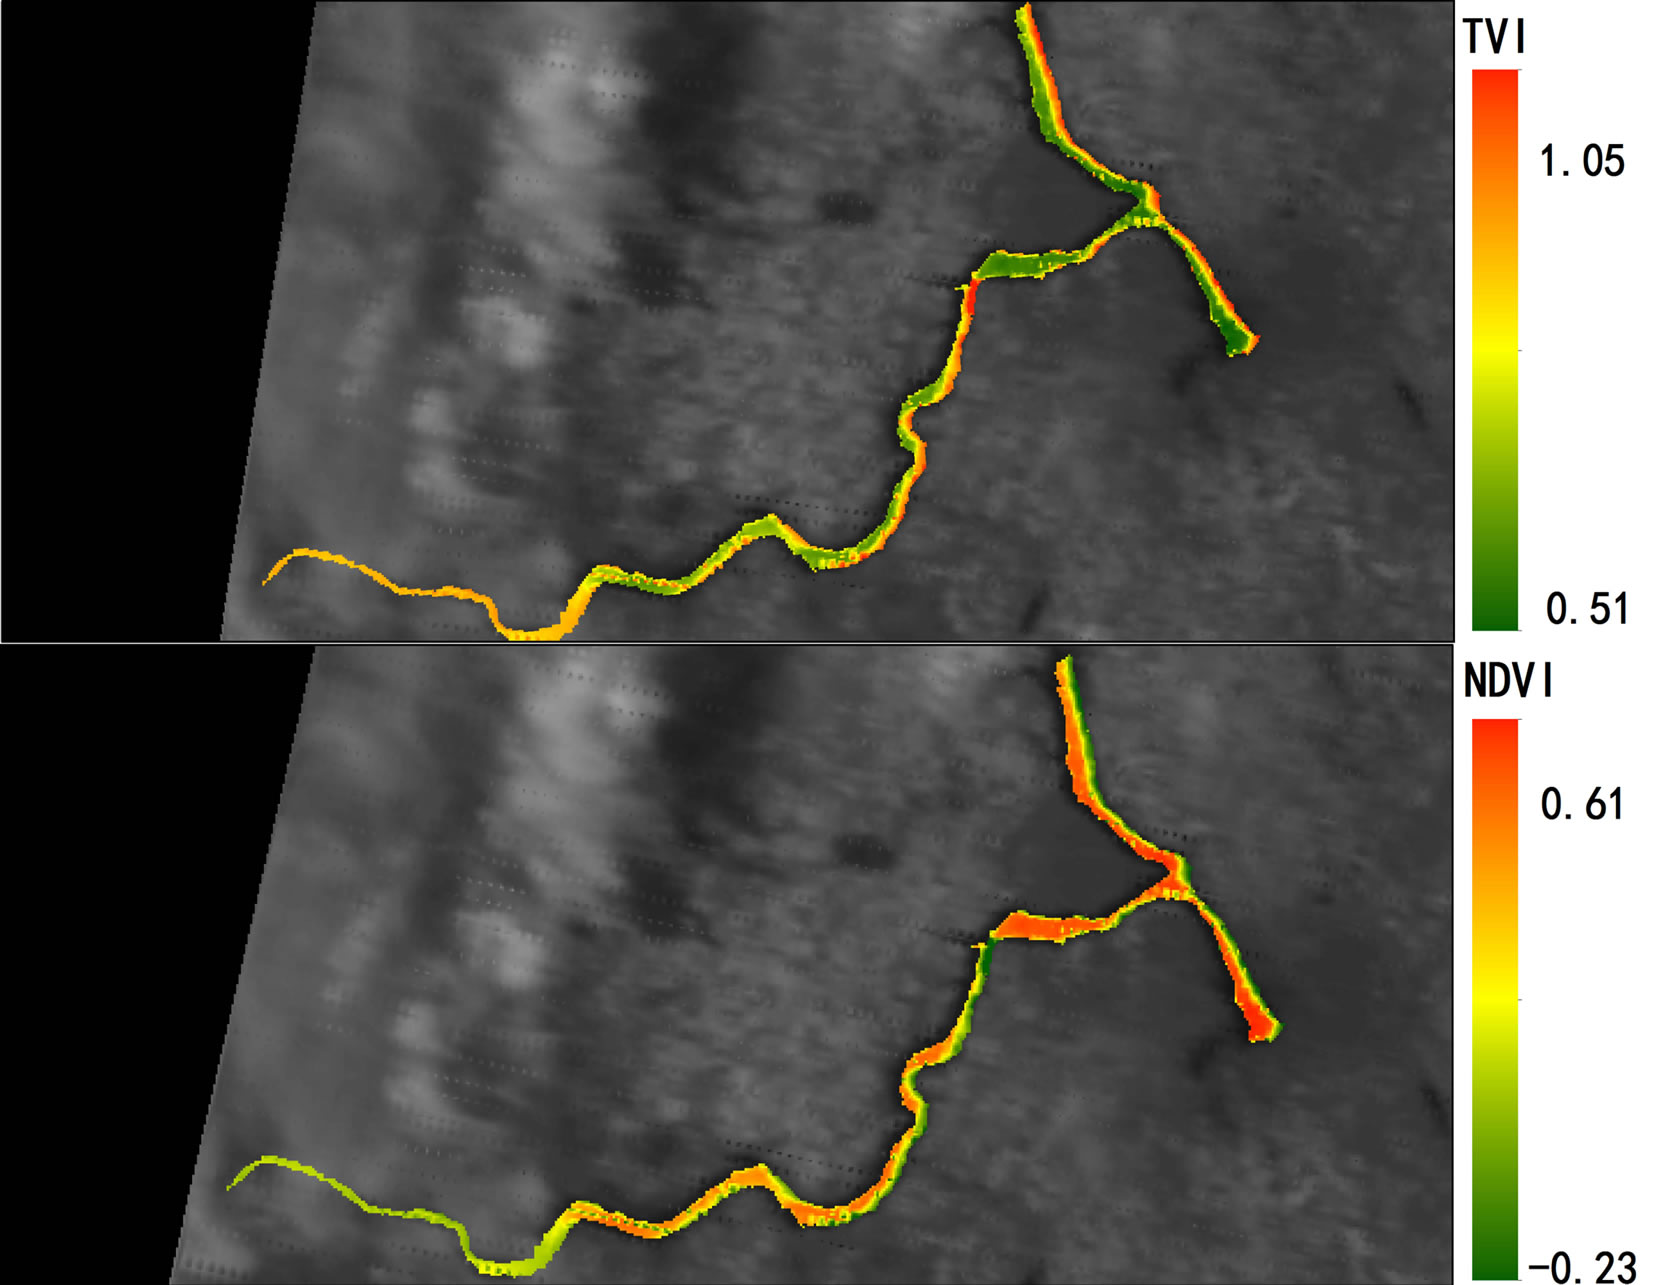 (c)
(c) 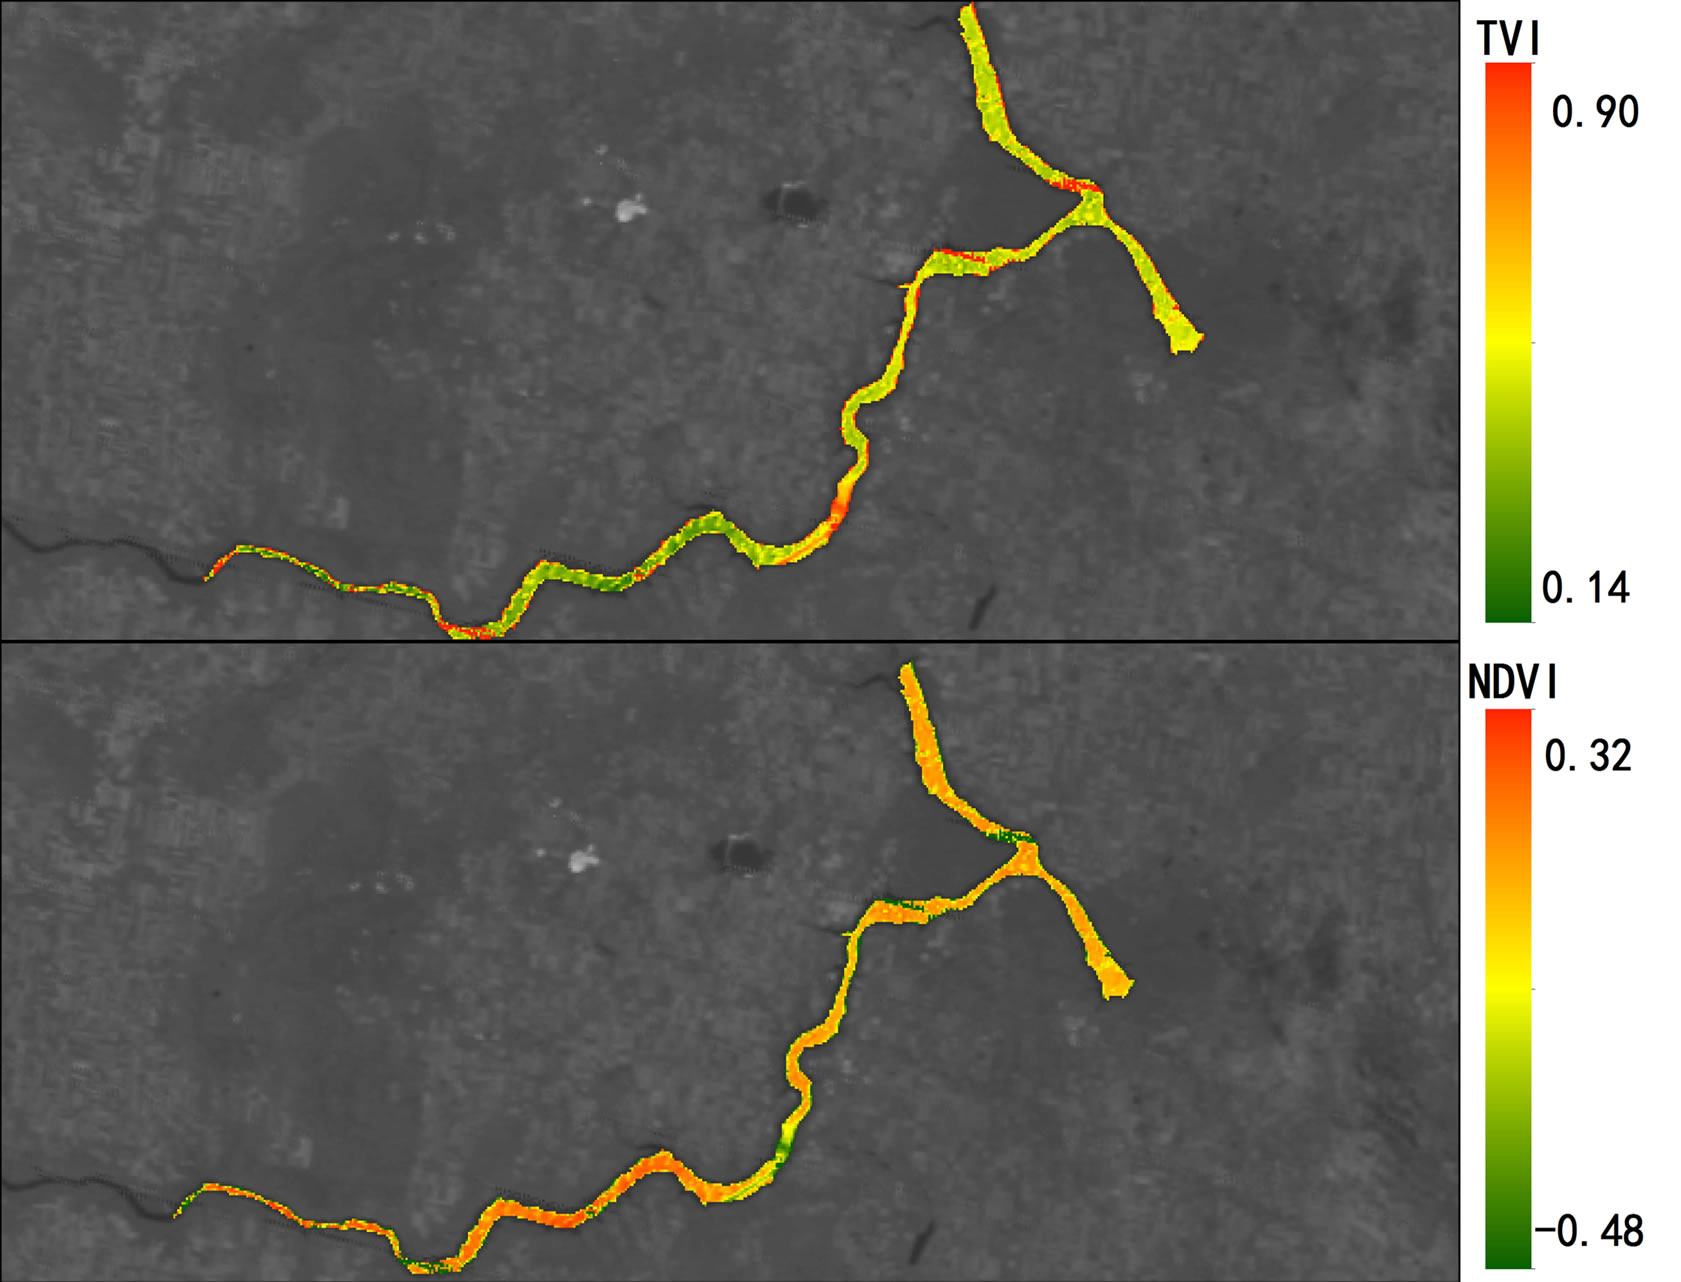 (d)
(d) 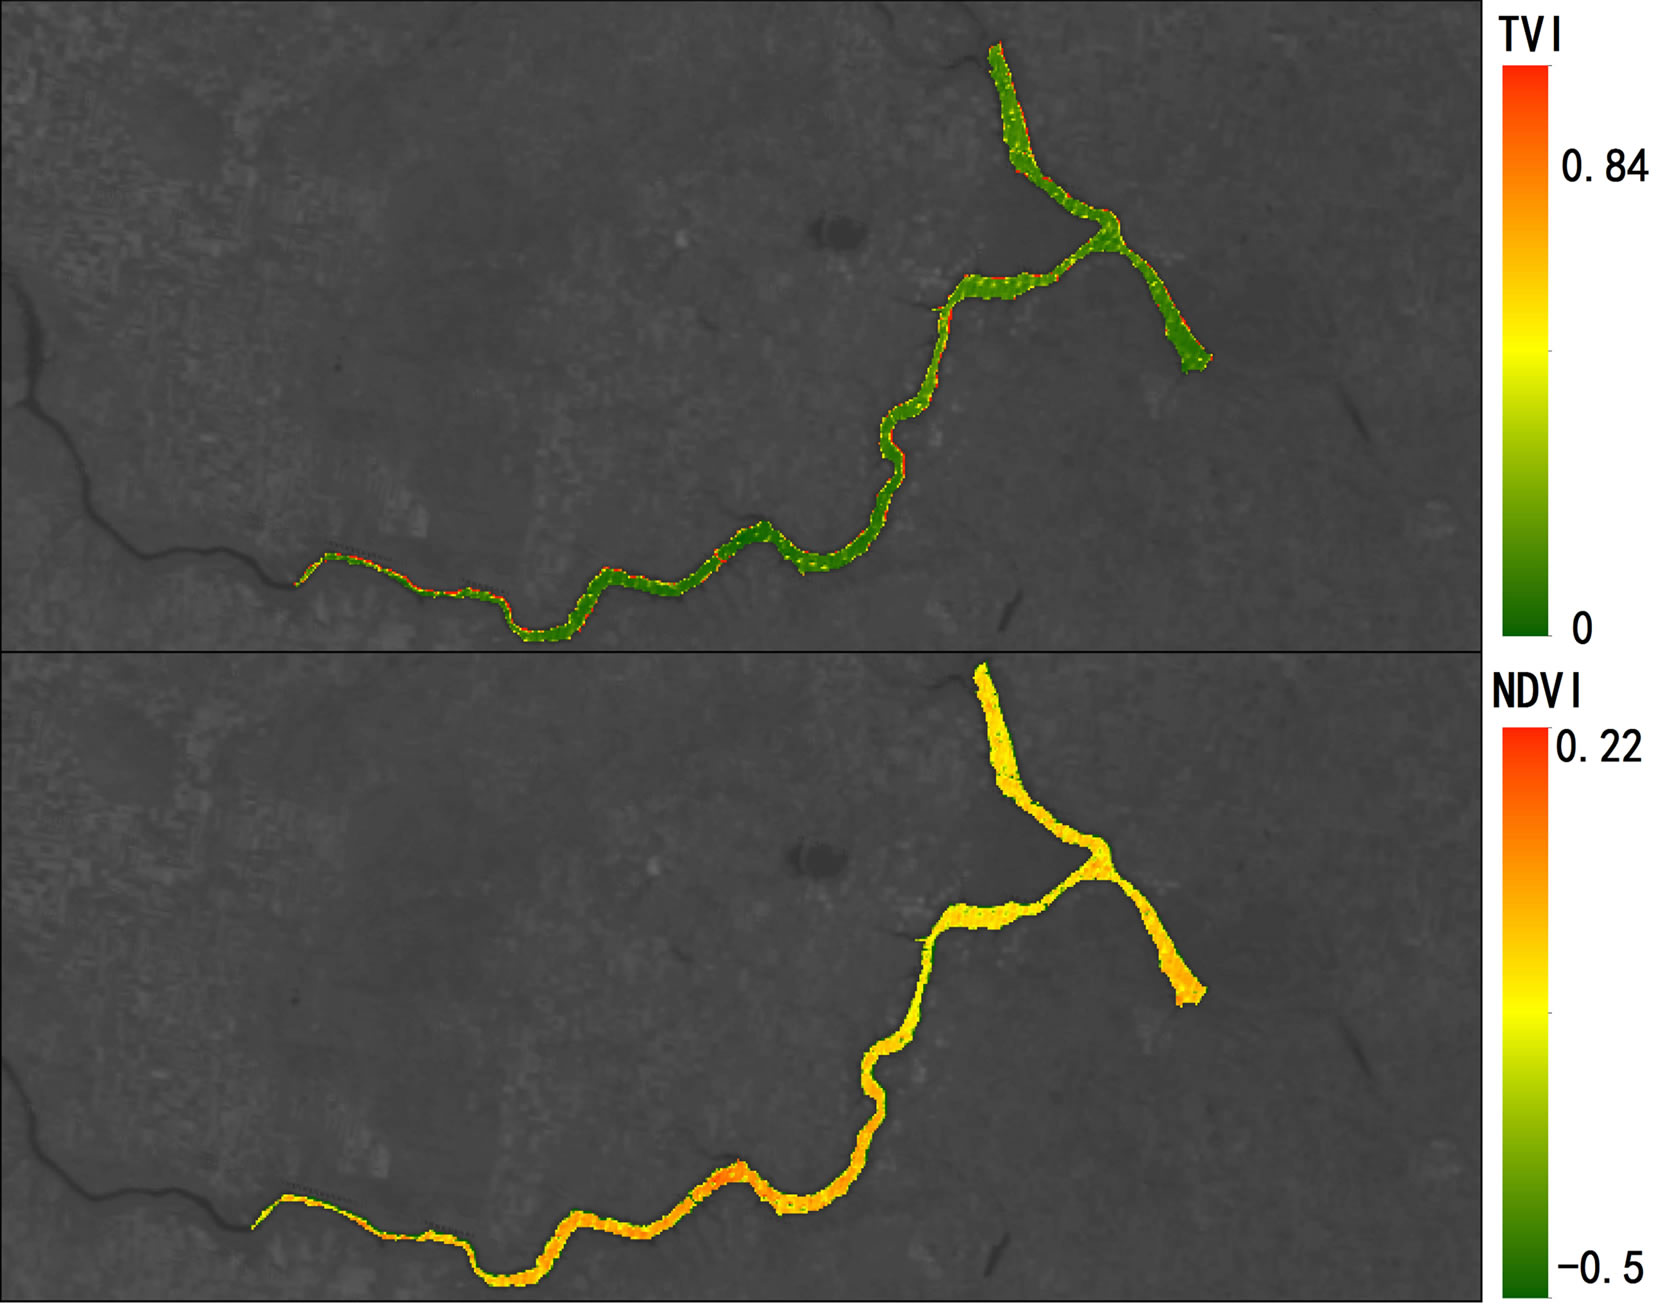 (e)
(e)
Table S10. Coefficientsa of Anabaena sp. Chl-a compared with TP after 2 weeks of culture.
Figure S1.Geographical heat maps of Transformed Vegetation Index (TVI) and Normalized Difference Vegetation Index (NDVI) values using MODIS terra images (October15, 2007 [a] through October 23, 2008 [e]).
NOTES
*Corresponding author.