Journal of Water Resource and Protection
Vol.4 No.1(2012), Article ID:16737,4 pages DOI:10.4236/jwarp.2012.41002
Application of Secondary Resistivity Parameters to Determine Potential Aquifer Horizon: Case Study of Basement Rocks of Hussara, Northeastern Nigeria
Department of Geology, University of Maiduguri, Maiduguri, Nigeria
Email: solomonnyusuf@yahoo.com
Received October 27, 2011; revised November 28, 2011; accepted December 30, 2011
Keywords: Aquifer; Longitudinal Conductance; Transverse Resistance; Porosity; Weathered Bedrock
ABSTRACT
Twenty five vertical electrical sounding using the Schlumberger configuration with current electrode spacing of AB/2 = 100 m were carried out in Hussara, north-eastern, Nigeria. The field data were smoothened and interpreted using IX1D inversion [1] computer software. Secondary resistivity and secondary resistivity derived parameters were used to determine the potential aquifer horizon. Longitudinal conductance map of the third geoelectric layer indicates a higher conducting zone along the eastern part which may indicate possible concentration of weathered materials. Intermediate conductance striking from the north to the southeast may constitute a horizon with increased aquifer materials, while the lower conductivity values may indicate areas of fractured bedrock where the degree of decomposition of the rock fragments is minimal. The transverse resistance map of the same horizon revealed the contour values increasing from the west towards the east perhaps due to the increasing presence of fresh bedrock close to the surface.
1. Introduction
Hussara is situated in the northeastern part of Nigeria. It lies between latitudes 10˚28'N and 10˚32'N and longitudes 13˚13'E and 13˚15'E (Figure 1). The area is underlain by crystalline basement rocks, with secondary porosity due to weathering and/or fracturing of the parent rocks.
Crystalline basement rocks occupy 40% of the land area of sub-Saharan Africa [2]. Weathering activity plays significant roles in the porosity and permeability of the rocks [3-5]. Porosity and permeability in the weathered zone vary through the rock profile as shown in Figure 2. While porosity in rocks generally decreases with depth, however, the permeability depends on the extent of fracturing and clay contents [6]. In some cases the bedrock disintegrates into extensive and relatively thick layer of unconsolidated, highly weathered rock with clayey residues of low permeability [7]. Classical geological methods of searching for water are no longer sufficient [8]. They are being supplemented by new progressive methods in order to reduce the risk of sinking abortive wells. The Vertical Electrical Sounding (VES) technique utilizing the Schlumberger configuration provides means of acquiring information about the vertical distribution of the subsurface materials overlying the basement rock. Within the bedrock, groundwater occurs only in large, open fractures, however, the suitability of the fractures as water bearers cannot be guarantee. This study is therefore aimed at determining the groundwater potential of the area using some secondary resistivity parameters.
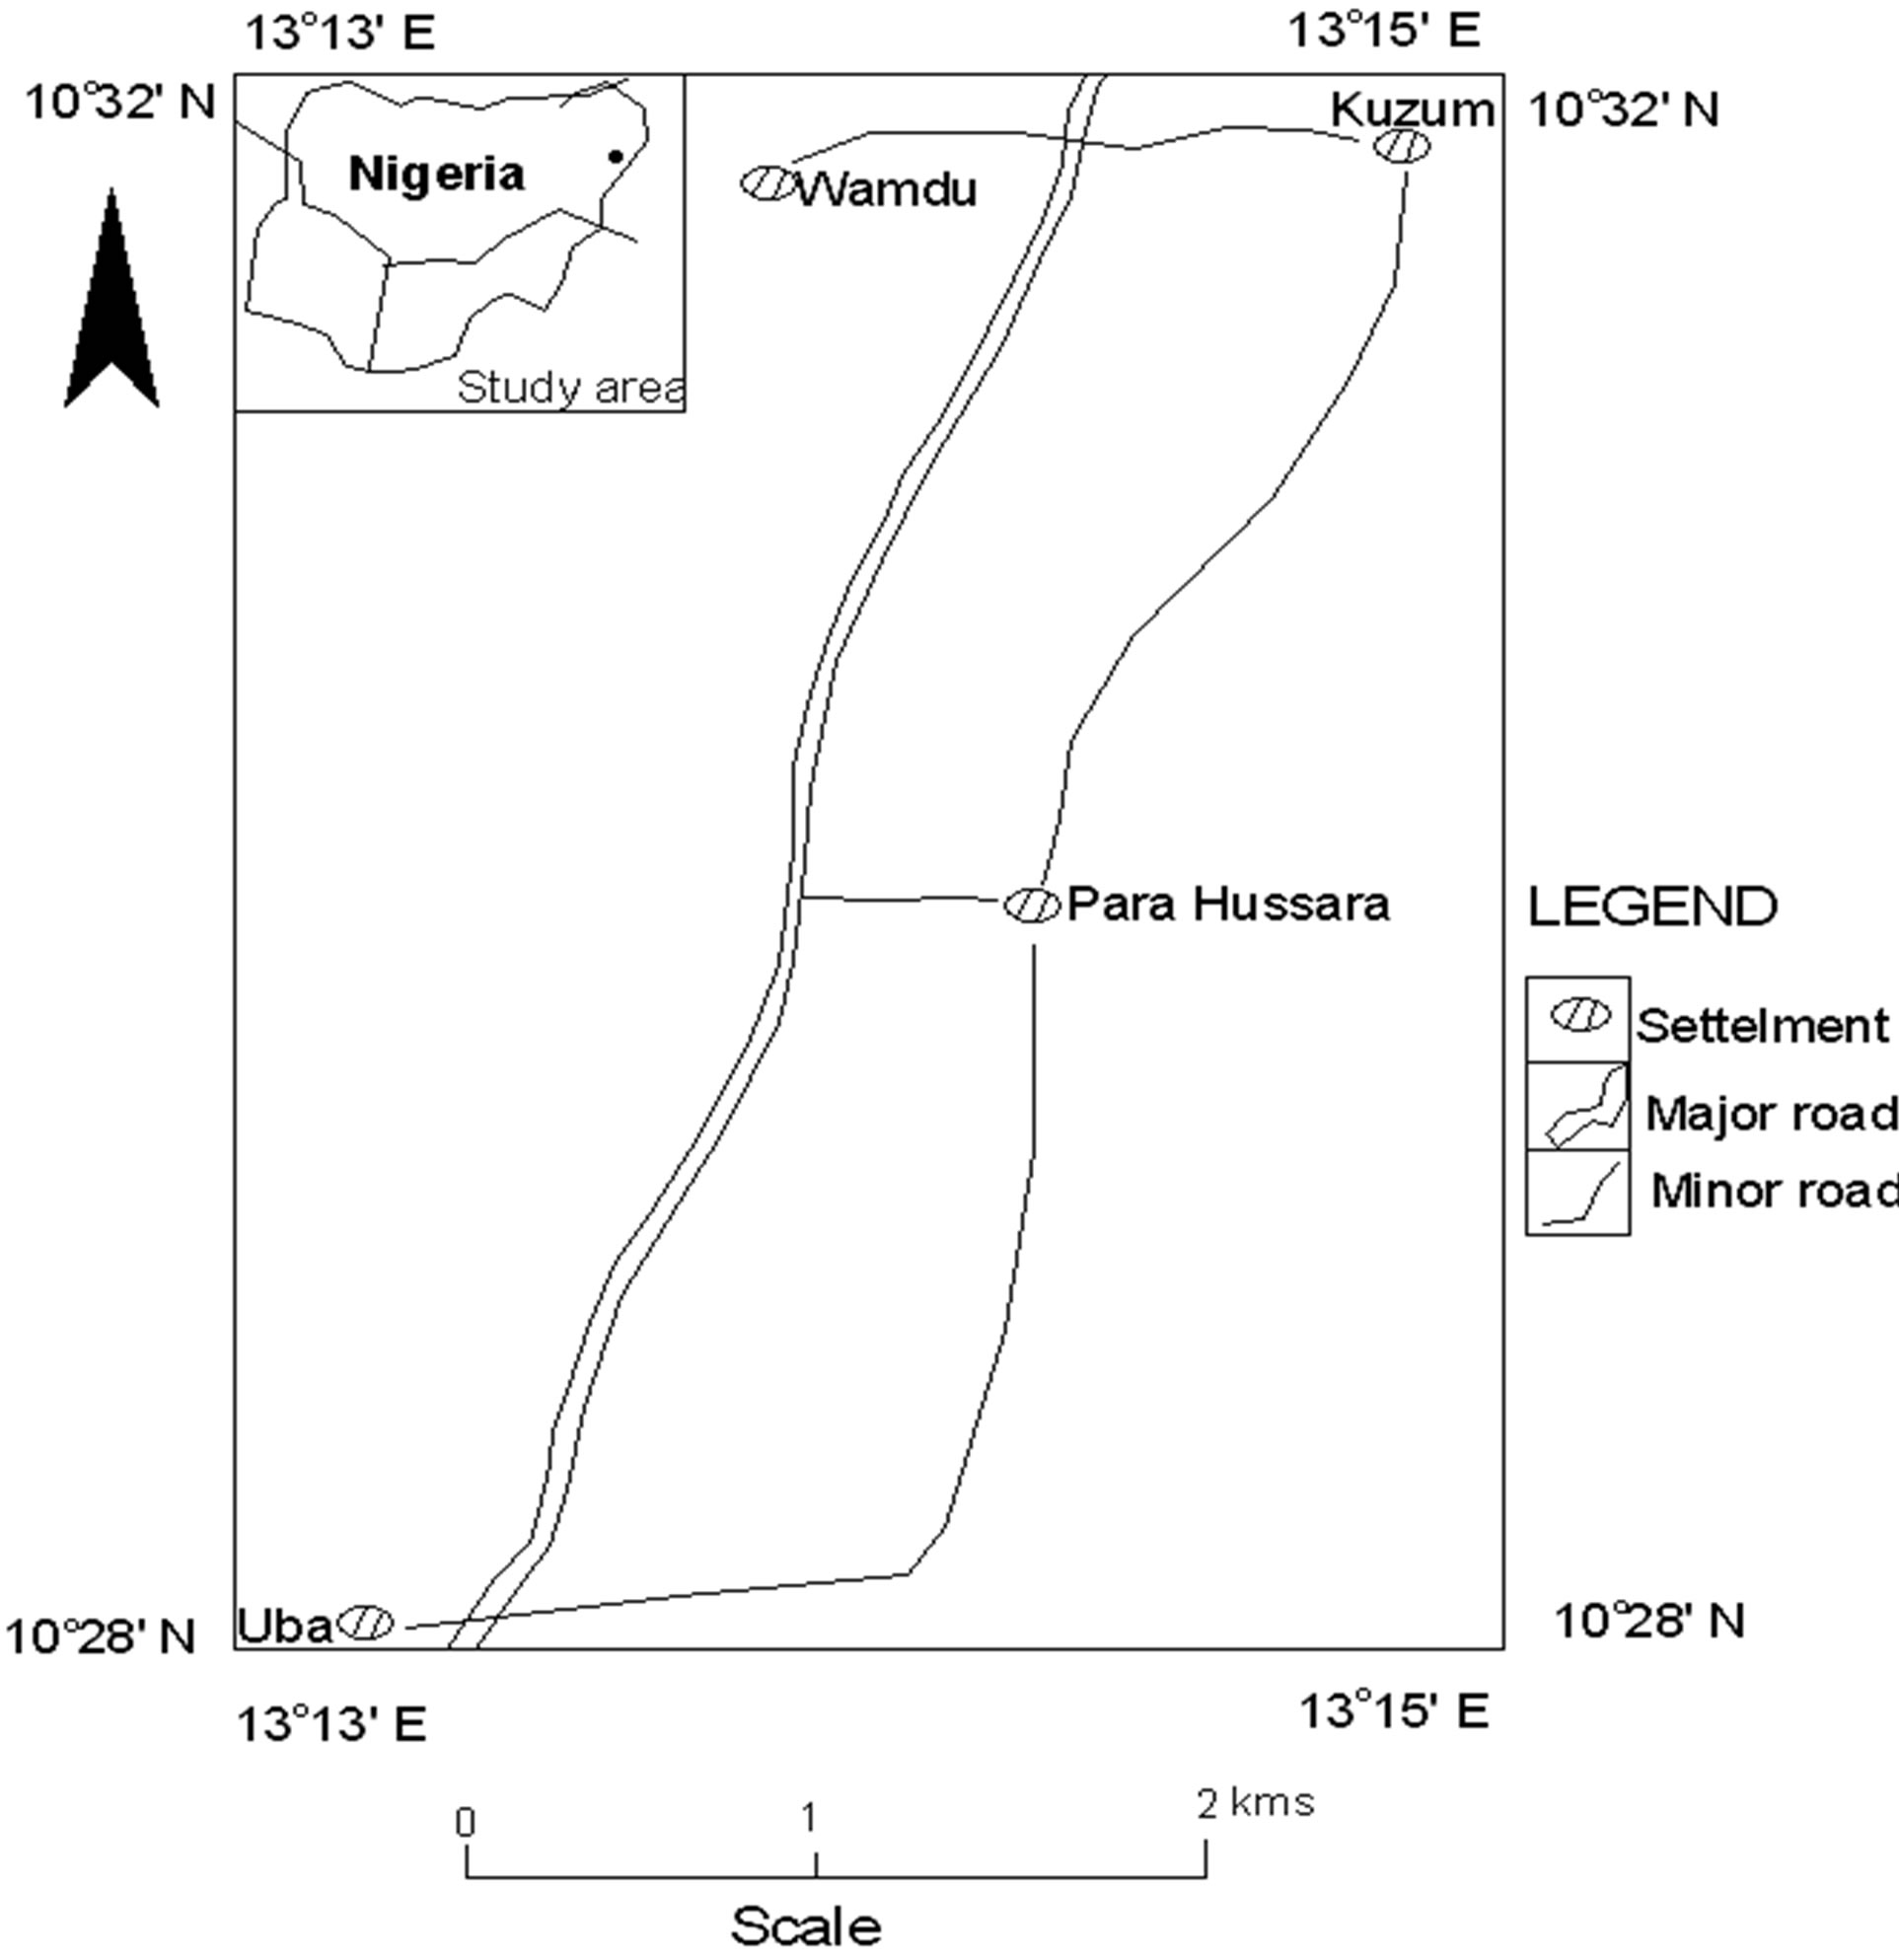
Figure 1. Location map of study area.
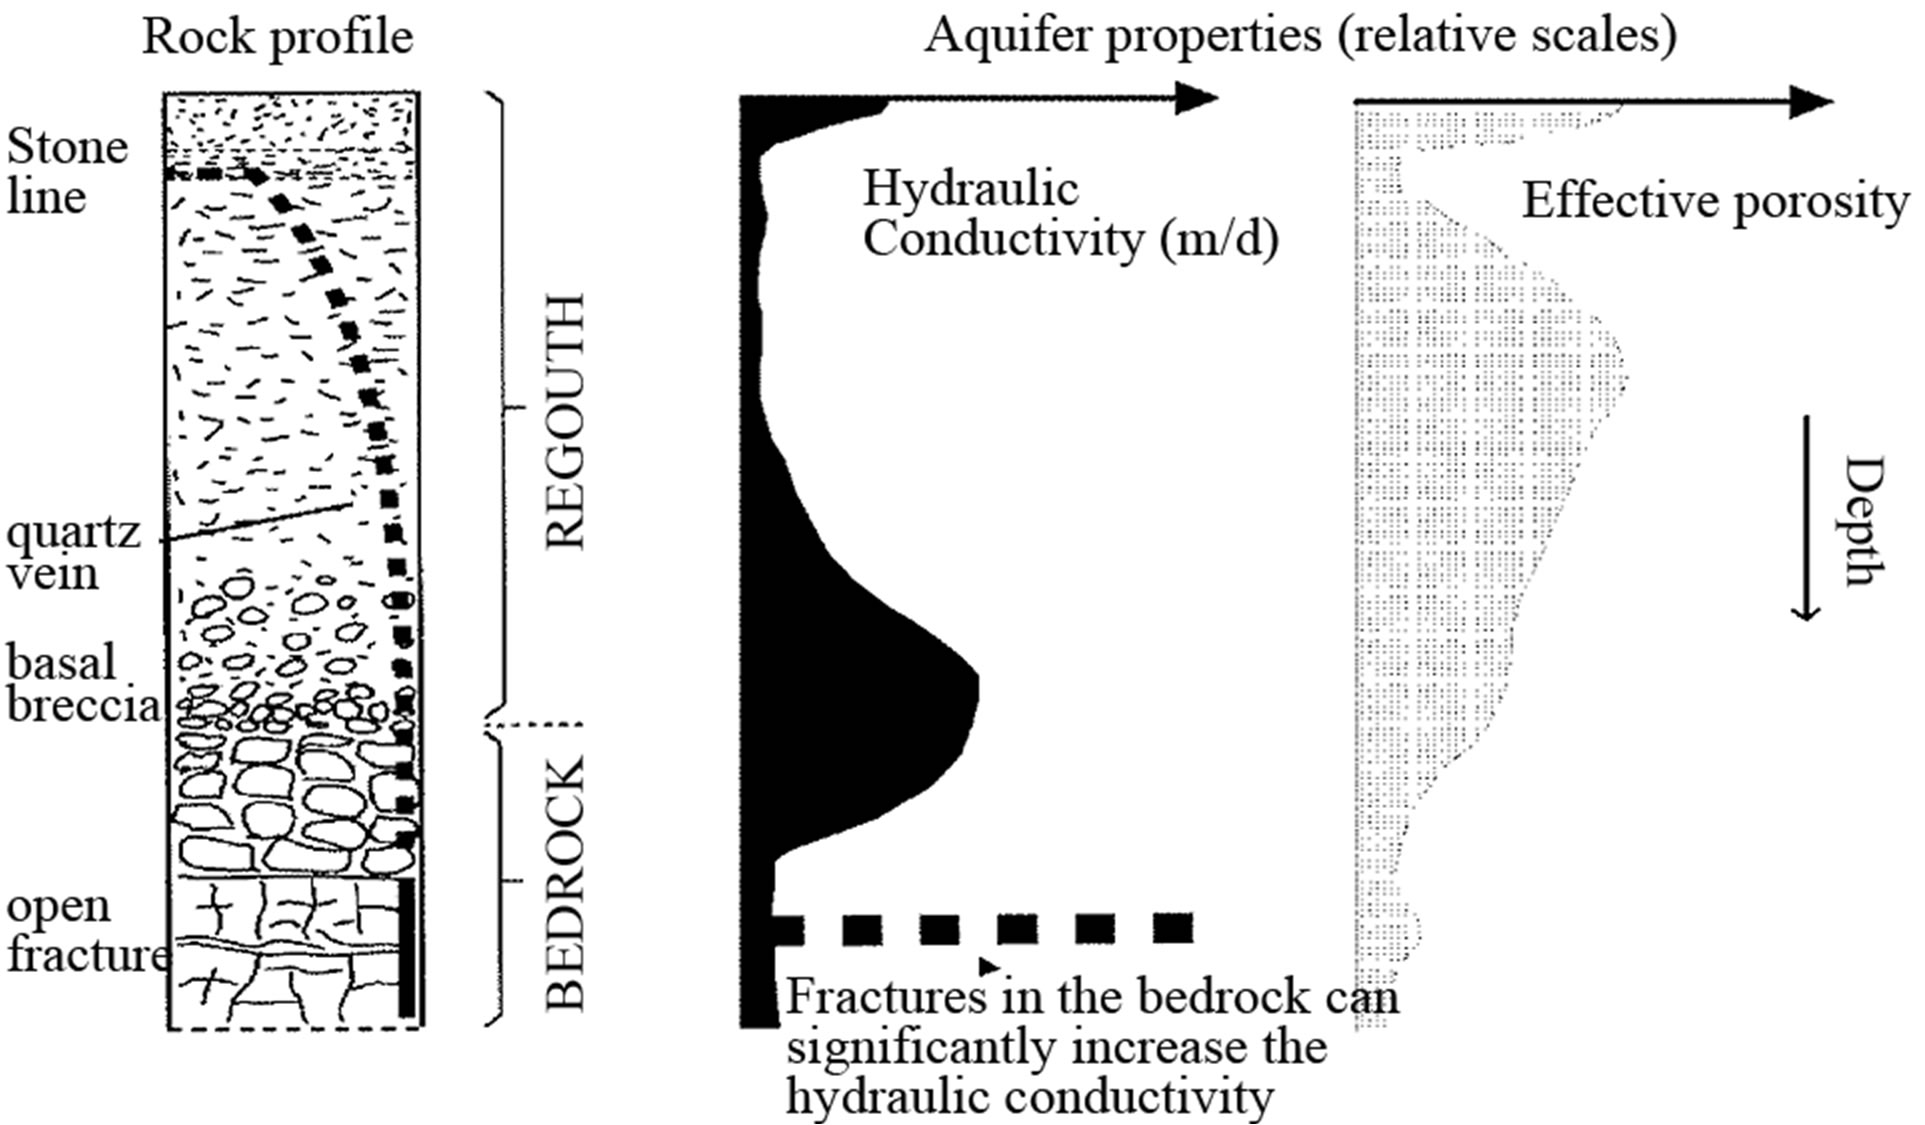
Figure 2. Variation of permeability and porosity with depth in basement aquifers (After Chilton and Foster, 1995).
2. Geology of the Study Area
The study area is underlain by three major rocks units. These include migmatite gneiss, porphyritic granite and finemedium grained granite (Figure 3). The migmatite gneisses occur around the eastern, the northwestern and southwestern sectors. These rocks are essentially magmatitic but approached granitic composition in most places. The porphyrytic granites constitute over 45% of the rock units in the area. They occur as boulders especially at the southern sector. The porphyritic granites are composed of plagioclase feldspars, hornblende and quartz with or without biotite. The northeastern, the central, and parts of the southwestern sectors are underlain by fine-medium grained granites. The fine-medium grained granites are second in abundance.
3. Materials and Methods
3.1. Data Acquisition and Interpretation
Resistivity methods have been used extensively to locate weathered and fractured zones in West and East Africa [6]. A direct current was introduced into the ground through a pair of electrodes and the potential difference was measured through a second pair of electrodes. The current and the potential measurements are then used to calculate the apparent resistivity of the subsurface material. Depth penetration was achieved by progressively increasing the electrodes distance. The apparent resistivity is measured at successive intervals.
The electrode configuration adopted for this study is the Schlumberger array. In this method four electrodes were placed along a straight line on the surface such that the current electrodes distance AB is equal to or greater than five times the potential electrode distance MN [9]. For the linear symmetry array of electrodes (AMNB), the apparent resistivity given by Gruntorad and Karous [8] is:
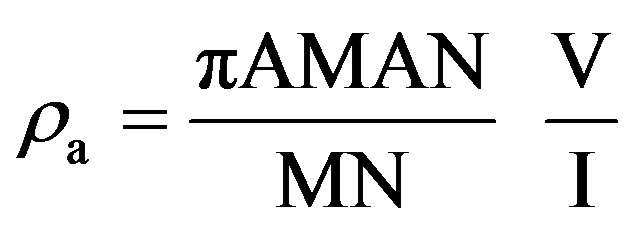 (1)
(1)
where V is the measured potential difference and I is the current. Maximum electric current half spacing (AB/2) attained during the field data acquisition was 100 m. The data were processed through curve matching to generate the initial models for the computer interpretation using IX1D (2004) inversion software. This produced the thickness “h” and electrical resistivity “ρ” values of the various subsurface layers [10]. These two parameters are the primary geoelectrical parameters. [11] environment was used to composed the location map of the VES stations shown in Figure 4 and plotted the terrain models of subsequent Figures.
3.2. Discussion of the Results
The longitudinal conductance (SL) and transverse resistance (T) derived from the fundamental geoelectrical characters mentioned above are the secondary geoelectrical parameters. These parameters are important to describe
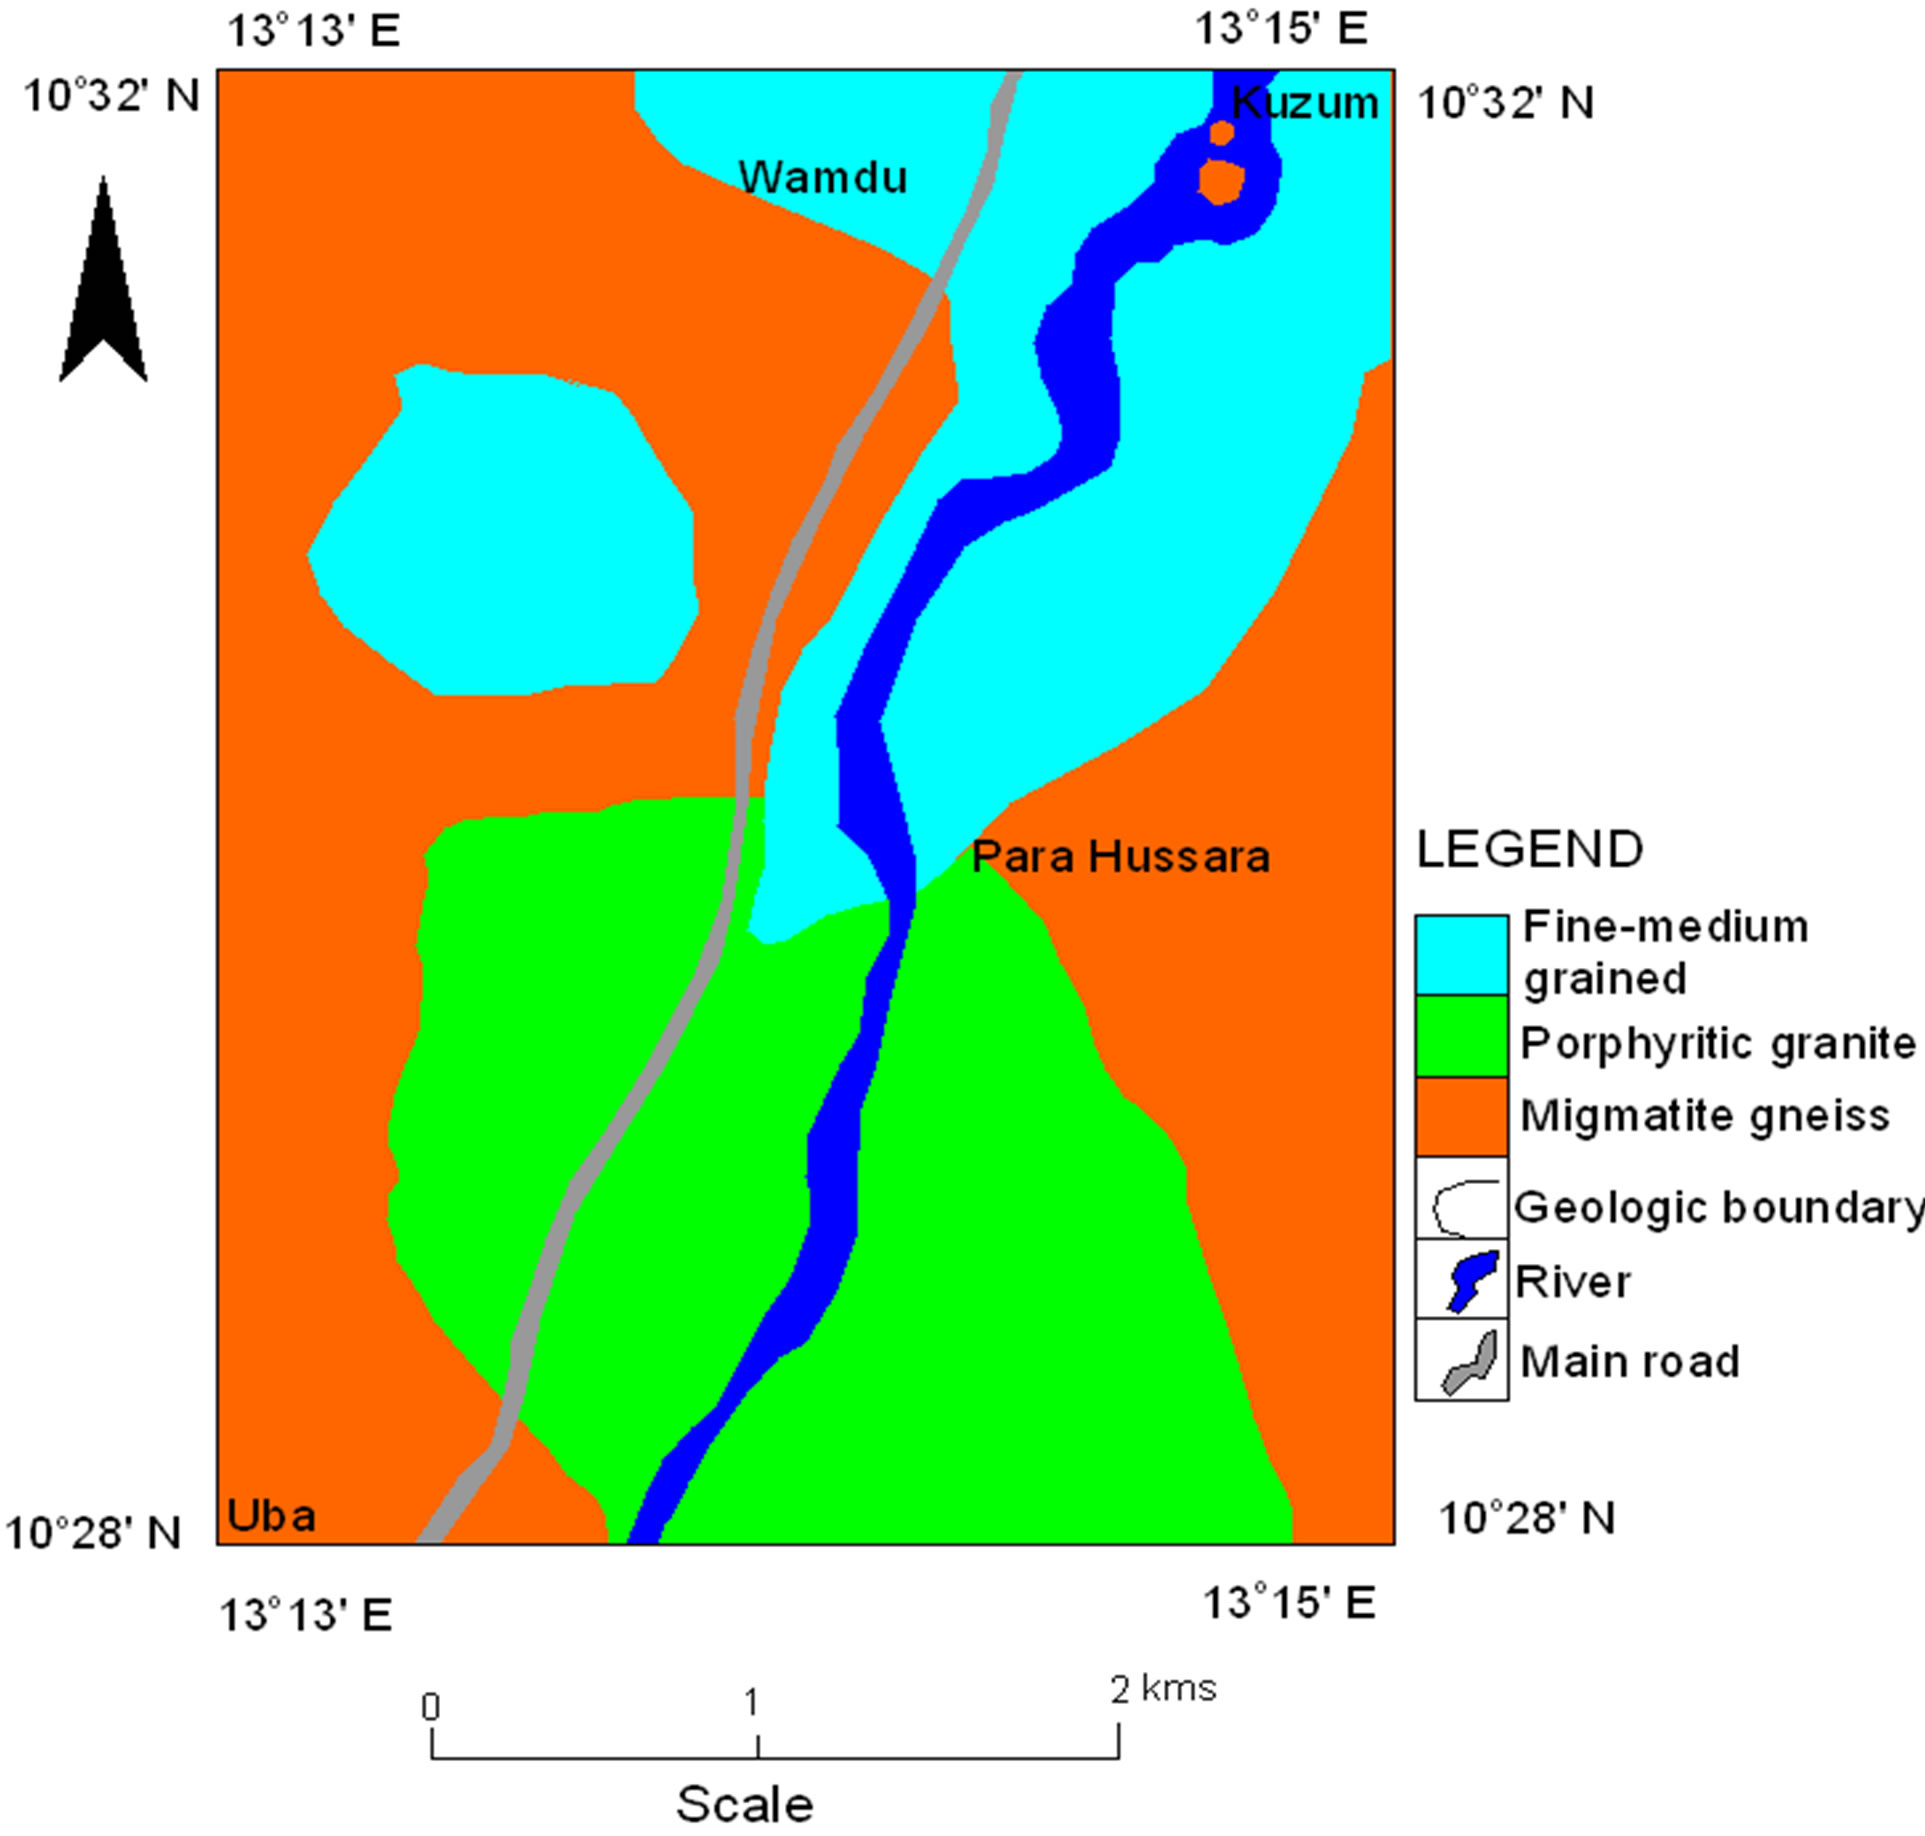
Figure 3. Geological map of study area.
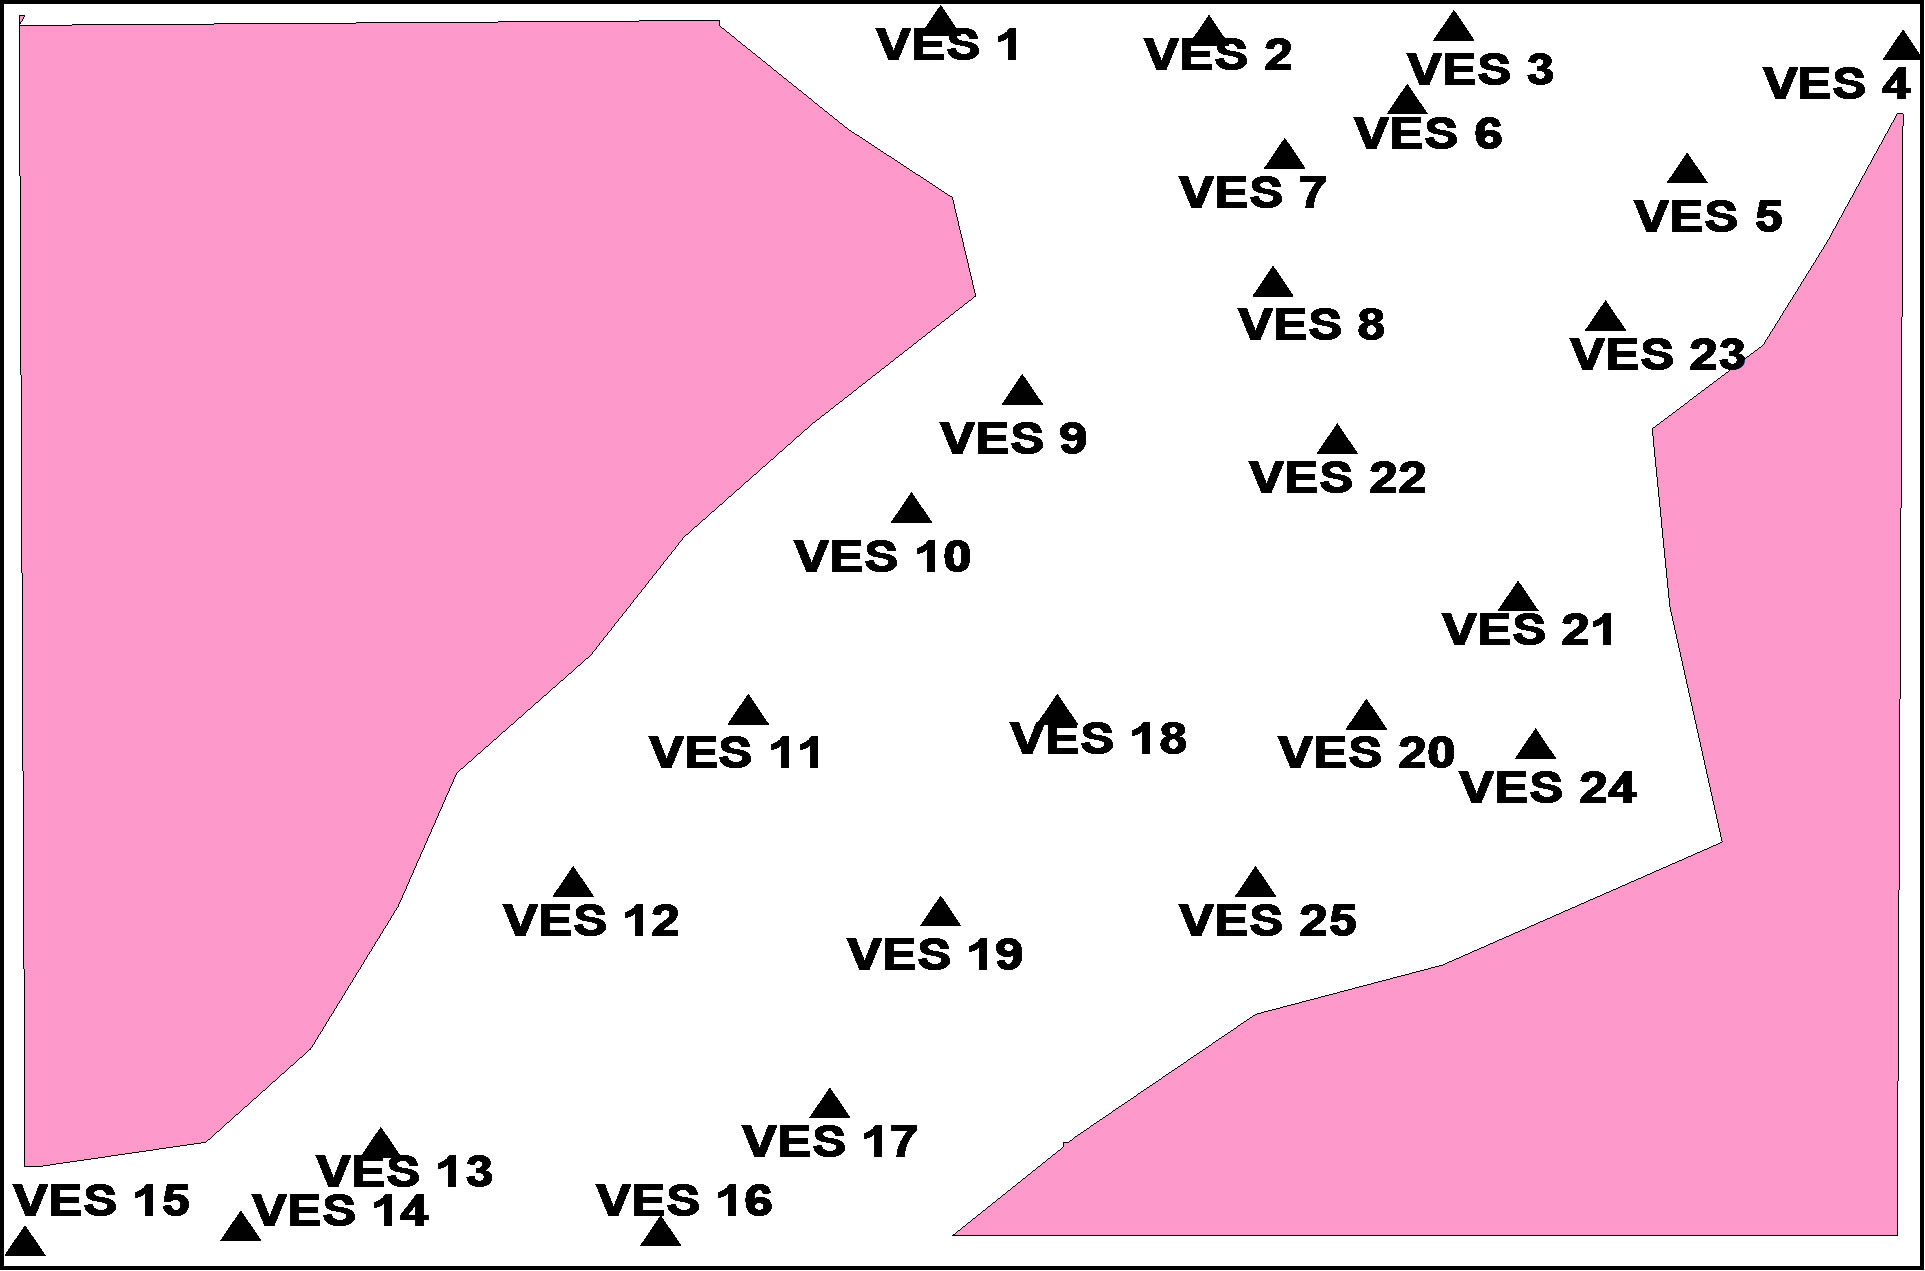
Figure 4. Location of the VES Stations.
the geoelectric layer sections. Porosity which is considered along the secondary parameters is a secondary effect imposed upon the rocks.
The third electrostatigraphic unit was considered most suitable for groundwater accumulation on the basis of depth of occurrence and/or resistivity values. For a given layer in a basement region where the substratum is resistance, the longitudinal conductance (SL) of the layer is defined by the equation:
 (2)
(2)
where h is the thickness and ρ is the resistivity of the layer.
Correlation between SL and the hydrogeological potentials of the weathered horizon places higher values of SL to greater thickness of the weathered bedrock. Lower SL values are linked to resistant substrata that approach the surface. Longitudinal conductance map of the layer under consideration is given in Figure 5. This map indicates a good conducting zone along the eastern part which may indicate possible concentration of conductive materials in the area [12,13]. Intermediate conductance contour levels striking from the north to the southeast may constitute an area with increased weathered basement materials. Lower conductivity values which dominate the western area may be associated to the presence of fine grained matrix in coarse grained fractions and/or fractured bedrock where the degree of decomposition of the rock fragment is minimal.
The transverse resistance (T) of the unit is given by:
 (3)
(3)
where h and ρ as previous defined.
The information given by this parameter correlates favourably well with the hydraulic transmissivity of the
Contours in Sm
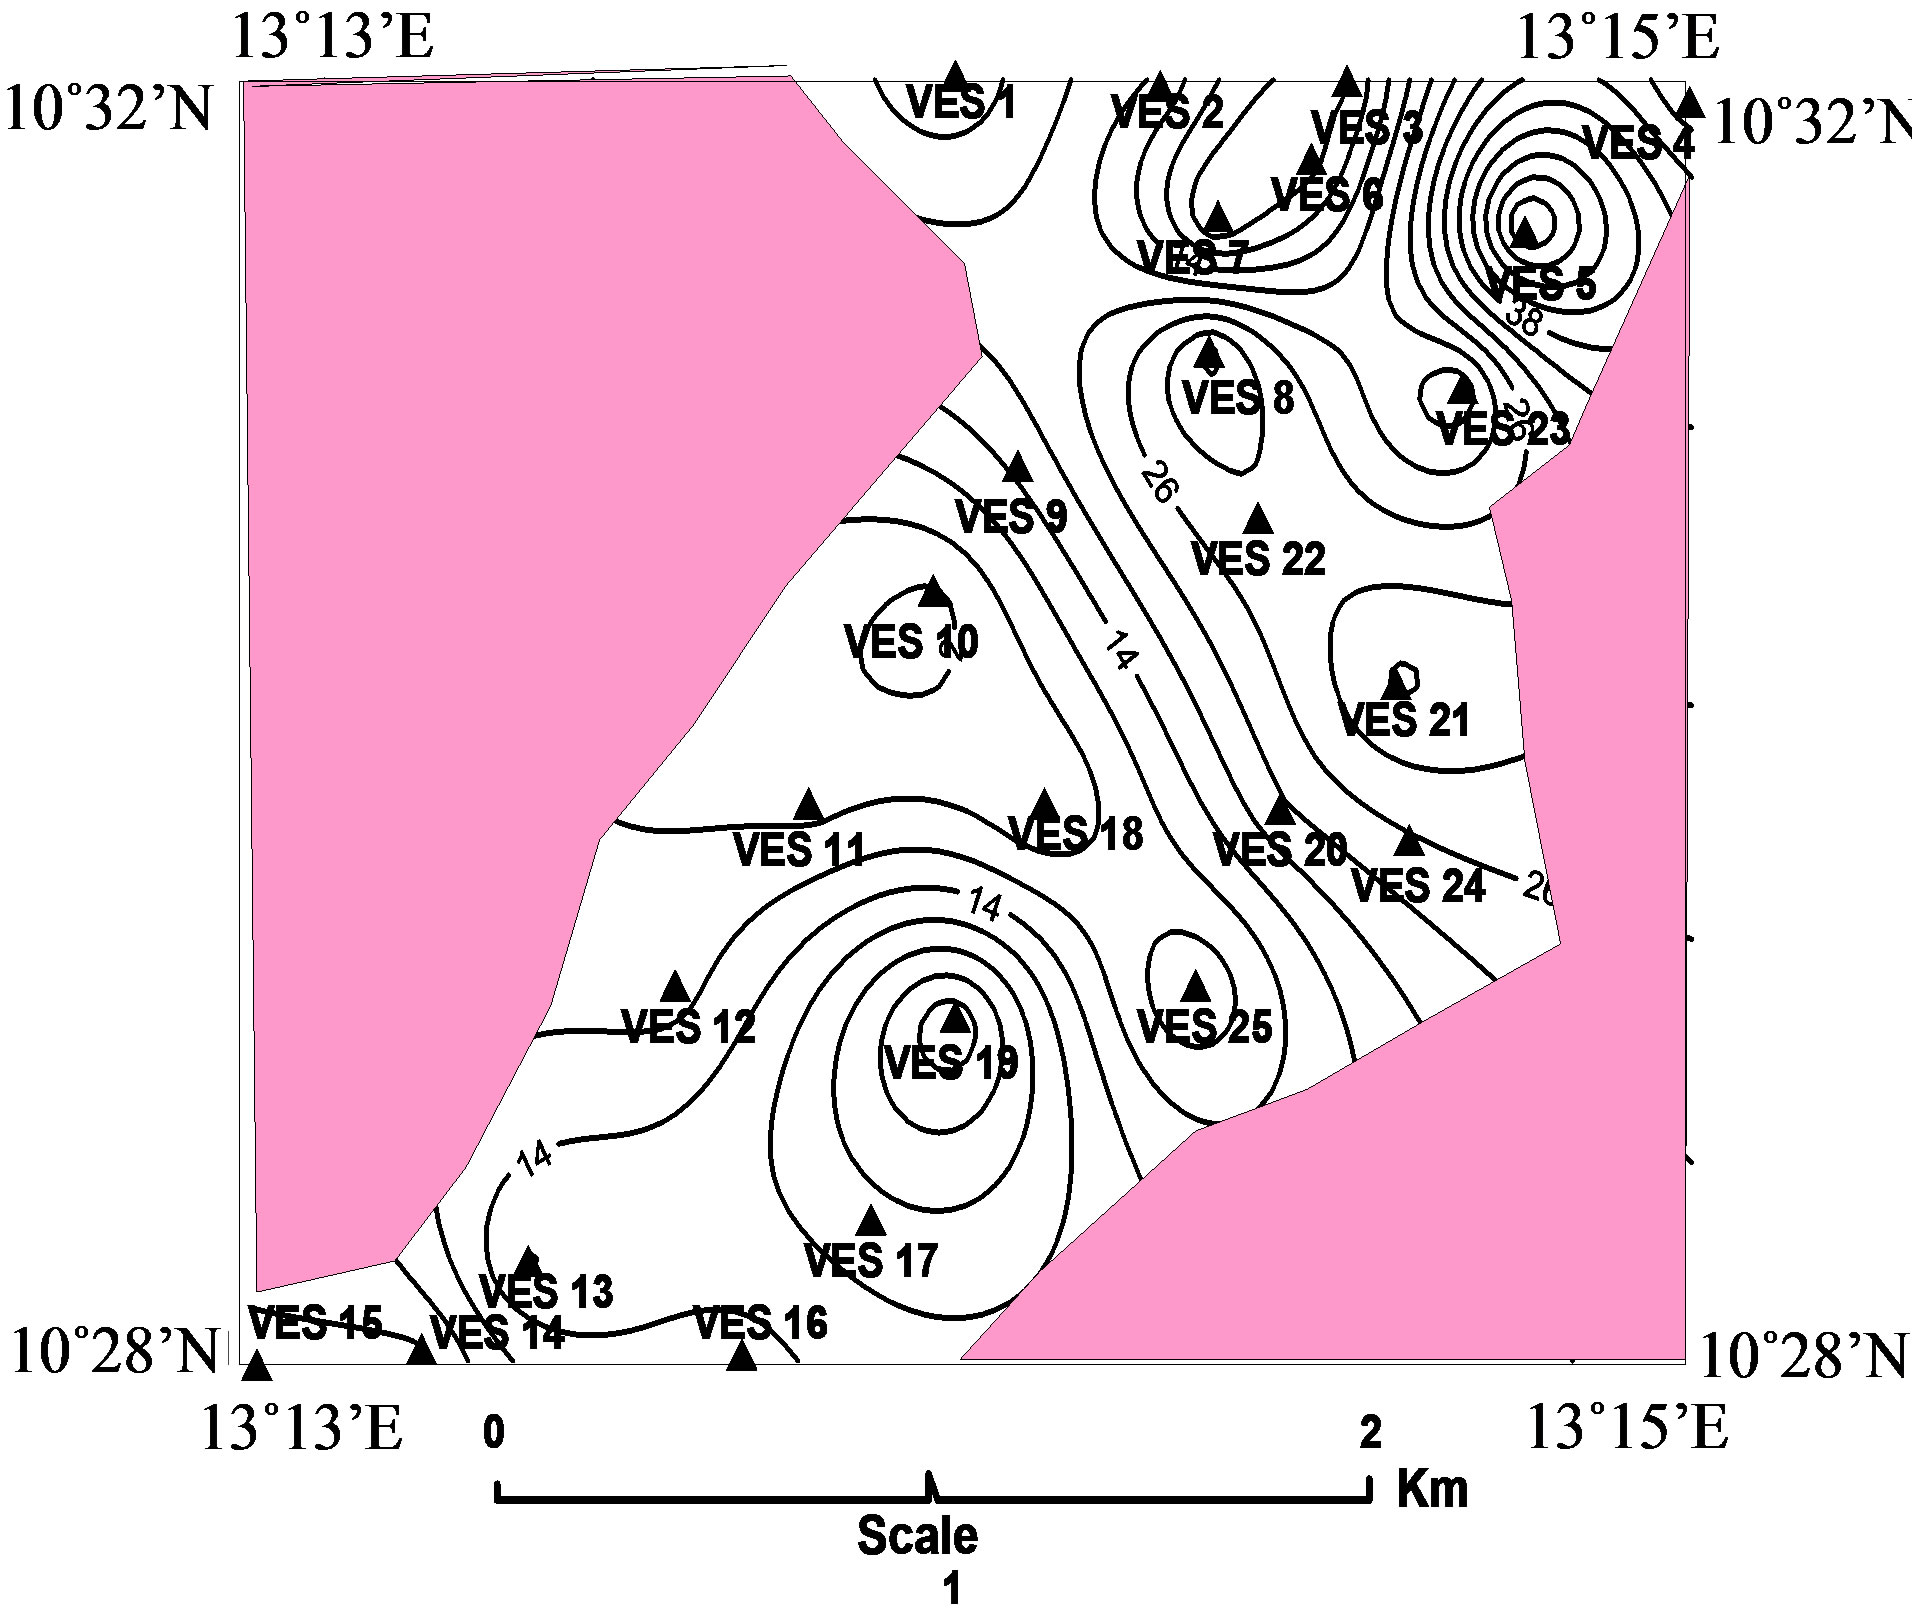
Figure 5. Longitudinal conductance map.
aquifer zone. The transverse resistance map of this horizon given in Figure 6 revealed the values of this parameter increasing from the west towards the east possibly due to the decrease in depth of the bedrock along the same trend.
An approach to estimating the porosity of the aquifer from the resistivity data involved the application of the well known Archie equation. [9,14] expressed this equation as:
 (4)
(4)
where F is the formation factor, Φ is the porosity, δb is the bulk formation resistivity derived from the resistivity values and δw is the pore water resistivity measured from a nearby hand dug well. Applying Equation (4) to results of interpretation of the geoelectric layer and resistivity values of 18.9 ohm-m measured from the hand dug well, yield porosity values contour map shown in Figure 7.
Contour in ohm.m2

Figure 6. Transverse resistance map.
Contour in percentage
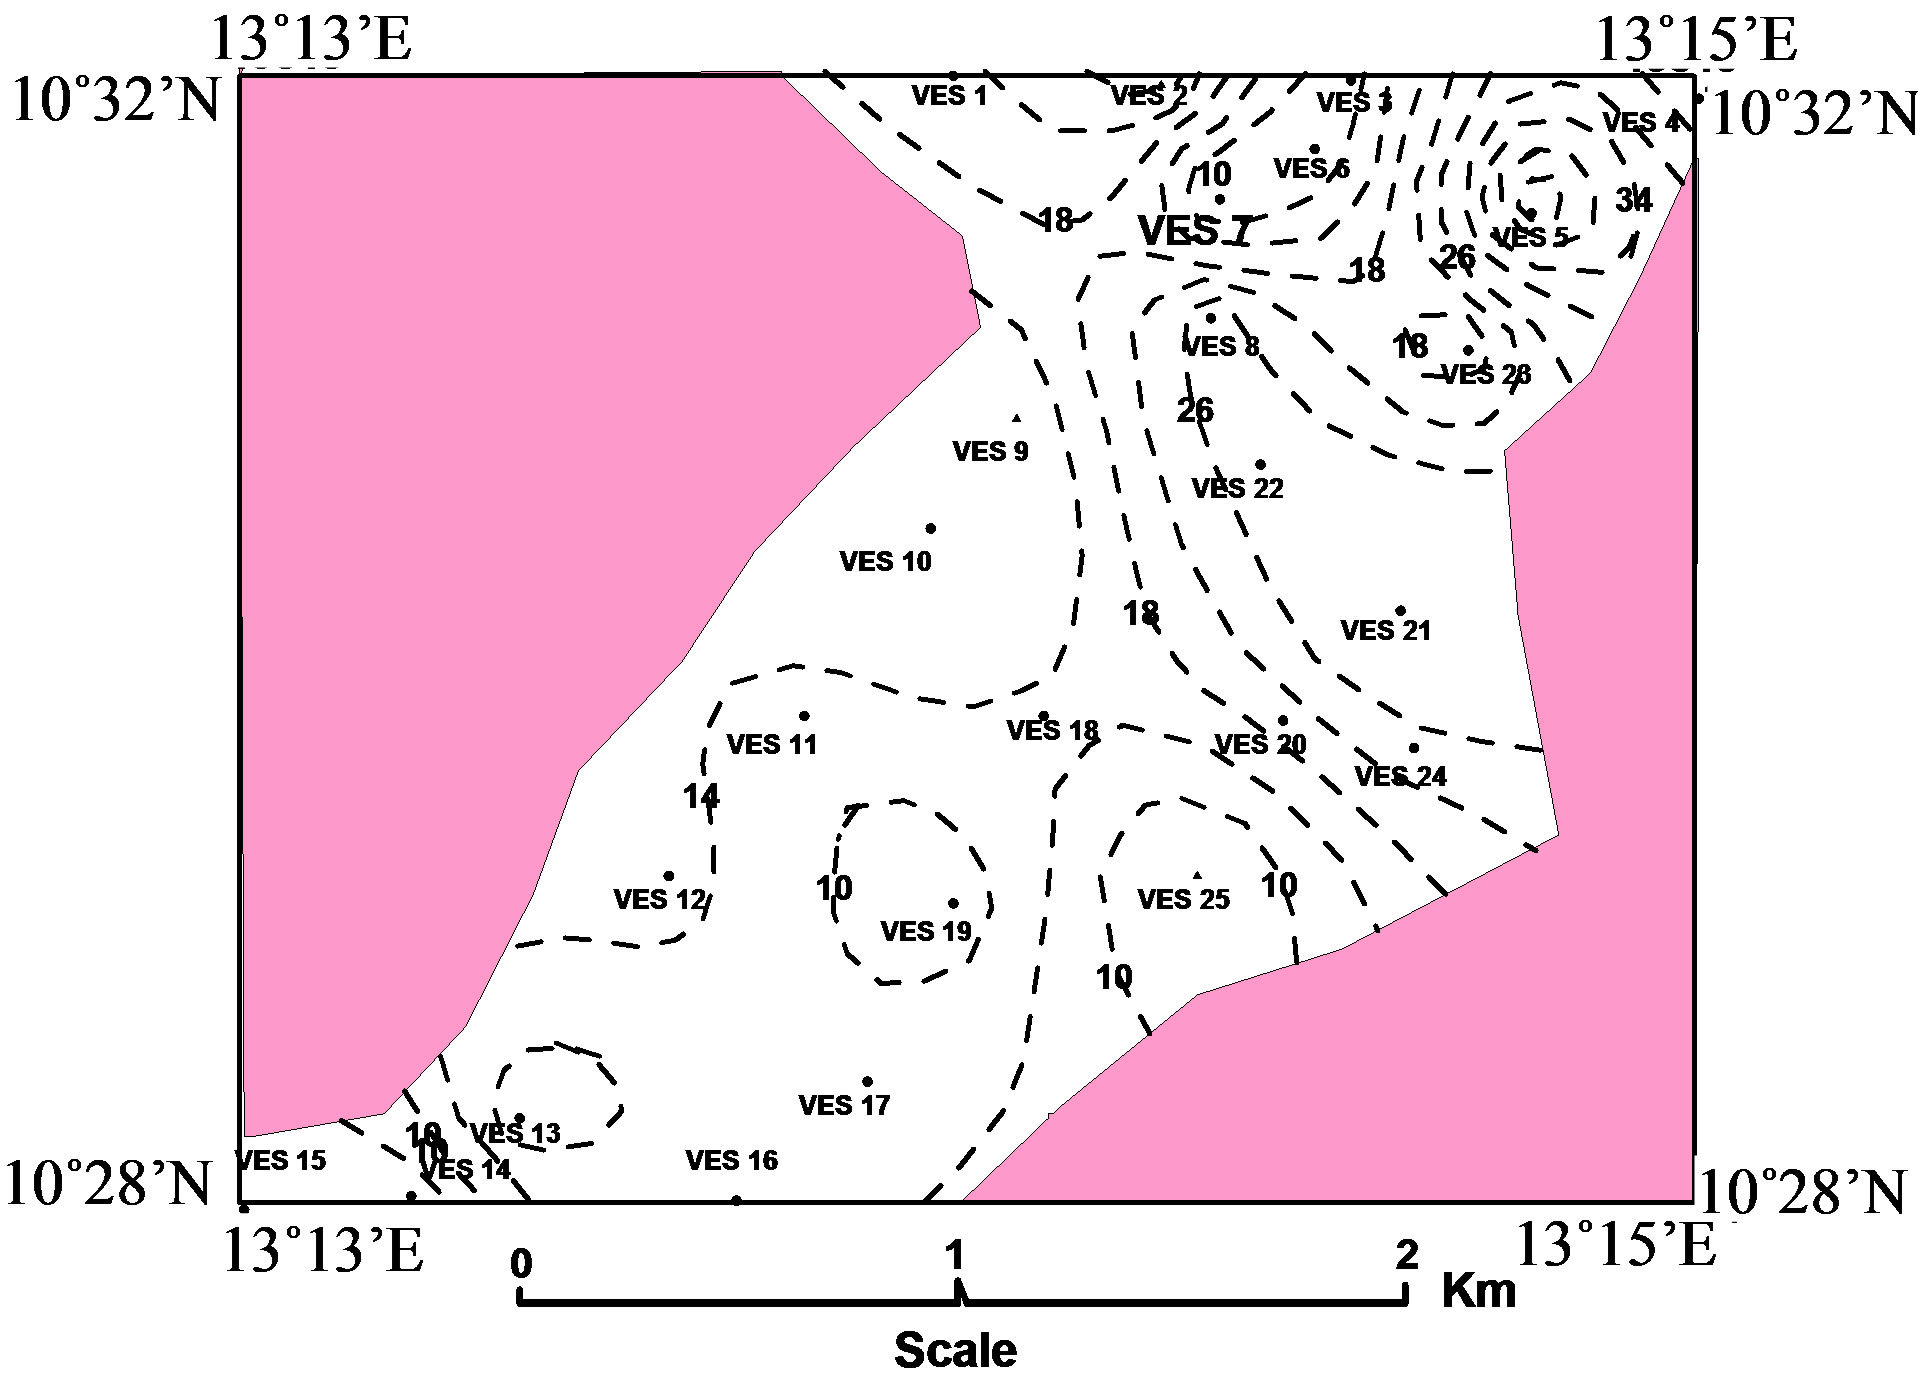
Figure 7. Porosity map.
In describing Figure 7, reference was made to the range in values of porosity given by [15,16]. Thus fractured crystalline bedrock may be encountered around the western part with few isolated pockets at the extreme northeastern and southern parts. Since the area is underlain by granite, weathered granite occupies a greater proportion of the area. This might have attracted settlements of Wandu, Uzum and Para Husara communities whose main occupation is farming. Dense crystalline rocks with porosity of five percent or less occur in pockets striking in the north-east direction and part of the east central. The area may best be described as being close to and/or on exposed granite outcrop.
4. Summary and Conclusion
Longitudinal conductance of the third geoelectric layer indicates a higher conducting zone along the eastern parts which consist probably of fine grained materials/weathered materials. Intermediate conductance striking from the north to the southeast constitutes a horizon with increased weathered materials, while the lower conductiveity value is underlain by fractured bedrock area. Contour values of the transverse resistance horizon increase from the west towards the east. Majority of the porosity contour levels fall within the range reasonable for weathered bedrock aquifer, however, some of the resistivity derived porosities are slightly lower, which depict high concentration of clay matrix in the aquifer zone. The study thus indicates that application of secondary resistivity parameters together with estimated secondary effect (porosity) imposed upon the rocks may yield satisfactory results in determining the viability of a potential aquifer unit.
REFERENCES
- Golden Software, IX1D, One Dimensional Resistivity Interpretation Software, Golden software Inc., Golden, 2004.
- A. M. MacDonold and J. A. Davies, “Brief Review of Groundwater for Rural Water Supply in Sub-Saharan Africa,” British Geological Survey, London, 2000.
- R. I. Acworth, “The Development of Crystalline Basement Aquifers in a Tropical Environment,” Quarterly Journal of Engineering Geology, Vol. 20, No. 4, 1987, pp. 265-272. doi:10.1144/GSL.QJEG.1987.020.04.02
- M. O. Olorunfemi and S. A. Fasuyi, “Aquifer Types and the Geoelectrical/Hydrogeologic Characteristics of Part of Central Basement Terrain of Nigeria,” Journal of African Earth Science, Vol. 16, No. 3, 1993, pp. 309-317. doi:10.1016/0899-5362(93)90051-Q
- A. E Edet and C. S. Okereke, “Assessment of Hydrogeological Conditions in Basement Aquifers of the Precambrian Oban Massif Southeastern Nigeria,” Journal of Applied Geophysics, Vol. 36, No. 4, 1997, pp. 195-204. doi:10.1016/S0926-9851(96)00049-3
- F. W. Schwartz and H. Zang, “Fundamentals of Groundwater,” John Wiley & Sons Inc, New York, 2004, p. 583.
- B. L. Morris, A. R. L. Lawrence, P. J. C. Chilton, B. Adams, R. C. Calow and B. A. Klinck, “Groundwater and Its Susceptibility to Degradation: A Global Assessment of the Problem and Option for Management,” Early Warning and Assessment Report Series, United Nations Environment Programme, Nairobi, 2003.
- J. Gruntorad and M. Karous, “Geoelectrical Methods,” In: M. D. Stanislav, Ed., Introduction to Applied Geophysics, Reidal Publishing Company, Dordrecht, 1984, pp 263- 387.
- J. F. Ayers, “Conjunctive Use of Geophysical and Geological Data in the Study of Alluvium Aquifer,” Groundwater, Vol. 25, No. 5, 1989, pp 625-635. doi:10.1111/j.1745-6584.1989.tb00475.x
- W. M. Telford, L. P. Geldart and R. E. Sheriff, “Applied Geophysics,” Cambridge University Press, London, 1990, p. 770.
- Golden Software, Surfer 8. Golden Software Inc., Golden, 2003.
- I. B. Goni, M. M. Aji, M. M. Uba, A. A. Zarma, S. C. Alkali, M. Kachallah, E. Gadzama and M. Sulum, “Investigations to Locate Borehole and Drilling Sites Along Gumsuri-Chibok Route in NE Nigeria,” Water Resources Journal of National Association of Hydrogeologists, Vol. 14, No. 1-2, 2003, pp. 38-41.
- S. C. Alkali, “Distribution of Shallow Sediments within the University of Maiduguri Campus: Significance in Hydrogeology and Structural Engineering,” Borno Journal of Geology, Vol. 4, No. 2, 2007, pp. 93-103.
- J. H. Dovetone, “Log Analysis of Subsurface Geology,” John Wiley and Sons Inc., New York, 1986, p. 273.
- S. N. Davis, “Porosity and Permeability of Natural Materials,” In: R. J. M. DeWeist, Academic Press, New York, 1969, pp. 54-89.
- F. W. Schwartz and H. Zang, “Fundamentals of Groundwater,” John Wiley & Sons Inc, New York, 2004, p. 583.