Journal of Water Resource and Protection
Vol.4 No.2(2012), Article ID:17423,10 pages DOI:10.4236/jwarp.2012.42008
RS-GIS Based Assessment of River Dynamics of Brahmaputra River in India
1National Institute of Hydrology, Roorkee, India
2Indian Institute of Technology, Roorkee, India
Email: archana@nih.ernet.in
Received September 6, 2011; revised November 7, 2011; accepted December 27, 2011
Keywords: Remote Sensing; GIS, NDWI; Brahmaputra River; Bank Erosion/Deposition
ABSTRACT
The Brahmaputra River is one of the largest alluvial rivers in the world characterized by frequent bank erosion leading to channel pattern changes and shifting of bank line. This study is aimed at quantifying the actual bank erosion/deposition along the Brahmaputra River within India for a period of eighteen years (1990-2008). The entire course of Brahmaputra River in Assam from upstream of Dibrugarh up to the town Dhubri near Bangladesh border for a stretch of around 620 km has been studied using an integrated approach of Remote Sensing and Geographical Information System (GIS). The channel configuration of the Brahmaputra River has been mapped for the years 1990 and 2008 using IRS 1A LISS-I, and IRS-P6 LISS-III satellite images respectively. The analysis of satellite data has provided not only the information on the channel configuration of the river system on repetitive basis but also has brought out several significant facts about the changes in river morphology, stable and unstable reaches of the river banks and changes in the main channel. The results provide latest and reliable information on the dynamic fluvio-geomorphology of the Brahmaputra River for designing and implementation of drainage development programmes and erosion control schemes in the north eastern region of the country.
1. Introduction
The river Brahmaputra has been the lifeline of northeastern India since ages. This mighty river runs for 2880 kms through China, India and Bangladesh. Any alluvial river of such magnitude has problems of sediment erosion-deposition attached with it; the Brahmaputra is no exception. The problems of flood, erosion and drainage congestion in the Brahmaputra basin are gigantic. The Brahmaputra River is characterized by its exceedingly large flow, enormous volume of sediment load, continuous changes in channel morphology, rapid bed aggradations and bank line recession and erosion. The river has braided channel in most of its course in the alluvial plains of Assam. The lateral changes in channels cause severe erosion along the banks leading to a considerable loss of good fertile land each year. Bank oscillation also causes shifting of outfalls of its tributaries bringing newer areas under waters. Thousands of hectares of agricultural land is suffering from severe erosion continuously in the Brahmaputra basin covering parts of states like Assam, Arunachal Pradesh, Meghalaya, Nagaland and Manipur.
Stream-bank erosion and its effects on channel evolution are essential geomorphic research problems with relevance to many scientific and engineering fields. Remote sensing satellite data having ability to provide comprehensive, synoptic view of fairly large area at regular interval with quick turn-around time integrated with Geographical Information System (GIS) techniques makes it appropriate and ideal for studying and monitoring river erosion and its bank line shifting. Various studies in this regard have been carried out for some major rivers all over the world [1-6]. Several investigators have used remotely sensed data for ascertaining channel changes of Brahmaputra River and its tributaries. NRSA has done the river migration study of the Brahmaputra using airborne scanner survey and has carried out repetitive survey to monitor changes in landuse, river channels and banks to provide a base for estimating the response of the rivers to flood events [7]. Bardhan [8] studied the channel behavior of the Barak River using satellite imagery and other data to identify the river stretches, if any, which remained reasonably stable during the period 1910-1988.
SAC (Space Application Centre), Ahmedabad and Brahmaputra Board jointly took up a study to access the extent of river erosion in Majuli island in order to identify and delineate the areas of the island which have undergone changes along the bank line due to dynamic behavior of the river [9]. Naik [10] studied the erosion at Kaziranga National Park using remote sensing data. Goswami [11] carried out a study on river channel changes of the Subansiri (northern tributary of Brahmaputra River) in Assam, India. Mani [12] studied the erosion in Majuli Island using remote sensing data. Bhakal [13] have quantified the extent of bank erosion in Brahmaputra River near Agyathuri in Assam, India over a period of thirty years (1973-2003) using remote sensing data integrated with GIS. Kotoky [14] studied selected reach of Brahamputra (from Panidihing Reserve Forest to Holoukonda Bil of the Brahmaputra River) with two sets of Survey of India toposheets (1914 and 1975) and a set of IRS satellite images (1998, IRS-1B, LISS II B/W geocoded data. Sarma [15] studied the nature of bank line migration of Burhi Dihing River (southern tributary of Brahmaputra River) course during a period of time from 1934 to 2004. Das and Saraf [16] made a study in respect to a trend in river course changes of Brahmaputra River and influence of various surrounding geotectonic features for varying period between 1970-2002 for different sections of the river using Landsat MSS, TM and ETM images. However, a comprehensive study of the bank erosion and channel migration of the entire Brahmaputra in India with most recent satellite data has not yet been reported in the literature.
The present paper briefly describes a study of the Brahmaputra river—its entire course in Assam from upstream of Dibrugarh up to the town Dhubri near Bangladesh border for a stretch of around 620 kms for a period of 18 years (1990-2008) using an integrated approach of Remote Sensing and GIS. The satellite data has provided the information on the channel configuration of the river system on repetitive basis revealing much needed data on the changes in river morphology, erosion/deposition pattern and its influence on the land, stable and unstable reaches of the river banks, changes in the main channel of the Brahmaputra River, etc. It is envisaged that the conjunctive use of the information generated out of this study with other ground based data will contribute substantially in more meaningful approach towards planning and execution of means and measures to combat recurring floods and erosion.
2. Study Area
The Brahmaputra River, termed a moving ocean, is an antecedent snowfed river which flows across the rising young Himalayan Range. Geologically, the Brahmaputra is the youngest of the major rivers of the world. It originnates at an altitude of 5300 m about 63 km south-east of the Mansarovar lake in Tibet. The river is known as Tsangpo in Tibet. Flowing eastward for 1625 km over the Tibetan plateau, the Tsangpo enters a deep narrow gorge at Pe (3500 m) and continues southward across the east-west trending ranges of the Himalayas, viz. the Greater Himalayas, Middle Himalayas and sub-Himalayas. After crossing the Indo-China border near Pasighat the river is called as the Siang or the Dihang. Two major rivers namely the Dibang and the Lohit join the Dihang at a short distance upstream of Kobo to form the river Brahmaputra. The river flows westward through Assam for about 700 km distance from Dhola until downstream of the town Dhubri, where it abruptly turns south and enters Bangladesh. The gradient of the Brahmaputra River is as steep as 4.3 to 16.8 m/km in the gorge section upstream of Pasighat, but near Guwahati it is as flat as 0.1 m/km. In the course of its 2880 km journey, the Brahmaputra receives as many as twenty two major tributaries in Tibet, thirty three in India and three in Bangladesh. The northern and southern tributaries differ considerably in their hydro-geomorphologic characteristics owing to different geological, physiographic and climatic conditions. Due to the colliding Eurasian (Chinese) and Indian tectonic plates, the Brahmaputra valley and its adjoining hill ranges are seismically very unstable.
For the present study, a reach of 620 km on the main stem of Brahmaputra River, i.e., its entire course in Assam from upstream of Dibrugarh up to the town Dhubri near Bangladesh border has been considered. The geographical bounds of the area are 25˚45' to 28˚N latitude and 90˚ to 96˚30'E longitude. Figure 1 shows the study reach of the river.
3. Material and Method
3.1. Data
The basic data used in this study are digital satellite images of Indian Remote Sensing (IRS) LISS-I (Path/Row 13/49; 14/47,48,49; 15/47,48; 16/47,48) and LISS-III (Path/Row 110/51,52; 111/51,52; 112/51,52; 113/51,52; 114/53) sensor, comprising of scenes for the years 1990 and 2008. The other collateral data used in the present study are Survey of India toposheets nos 78/J, K, N, O; 82/L, P; 83/B, E, F, I, J, M at 1:250,000 scale and Landsat ETM images (Path/Row 135/41, 42; 136/42; 137/42; 138/42;), which are freely downloadable from the website www.glcf.umiacs.umd.edu/data/landsat.
ERDAS Imagine 9.3 image processing software has been used for processing the satellite images. ArcMap 9.3 GIS software has been used for analysis of the river bank data.
3.2. Methodology
Satellite images for years 1990 and 2008 have been processed to obtain the required information about the study area. The following section describes the preparation of satellite images for information extraction.
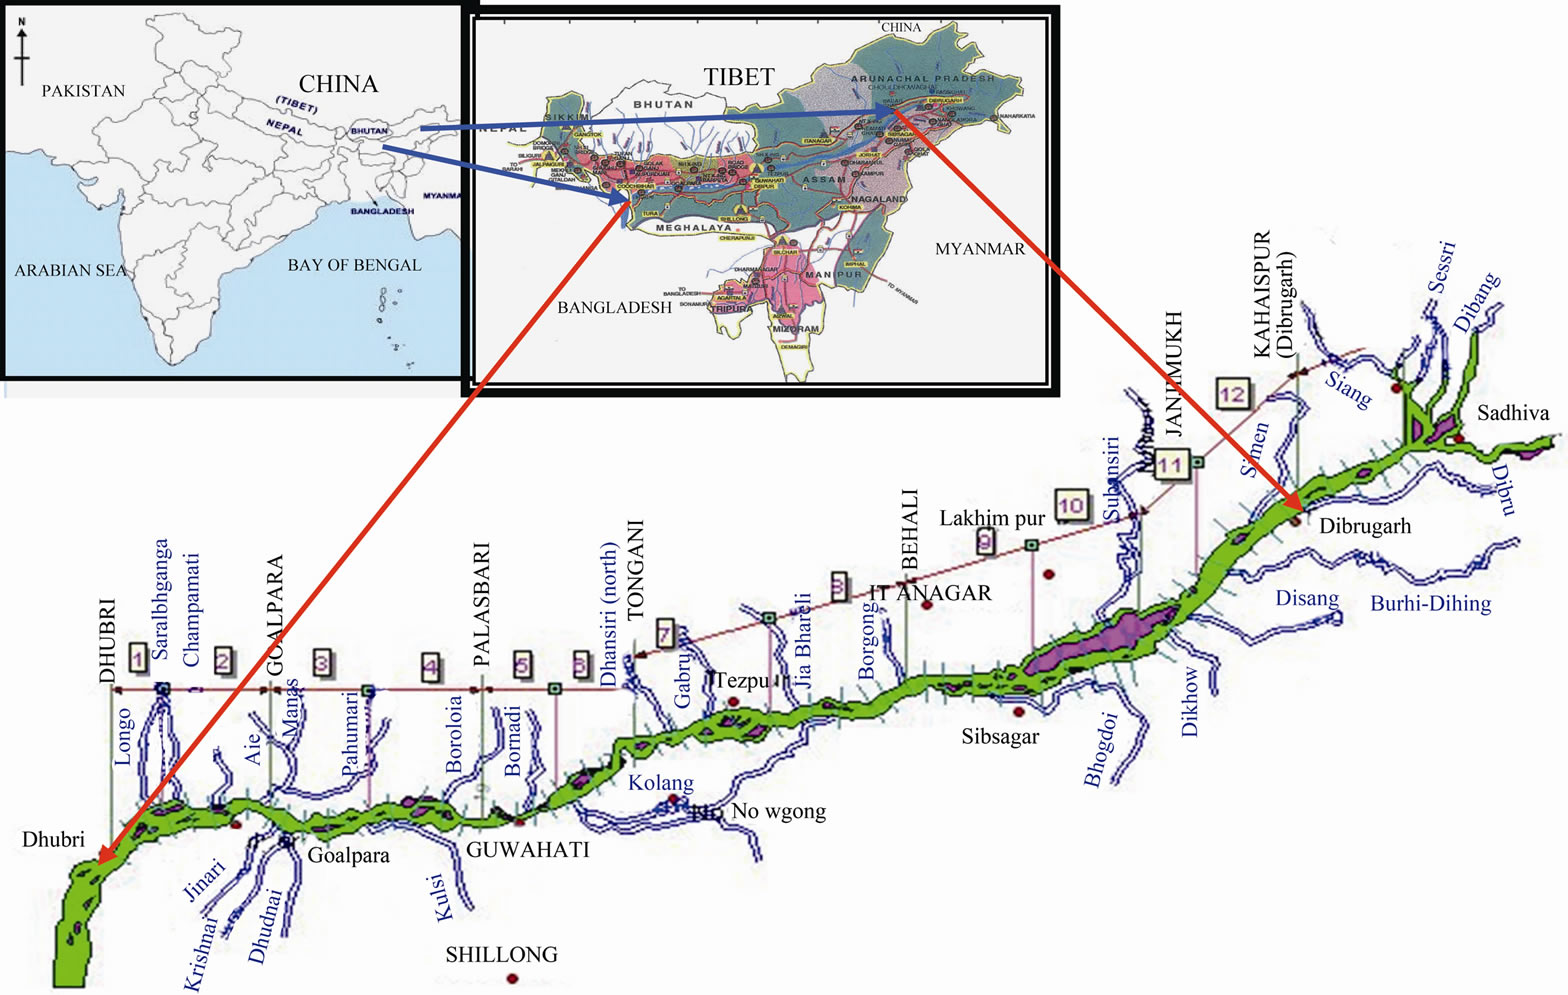
Figure 1. Study area.
3.2.1. Geo-Referencing and Digital Processing of Satellite Data
The satellite images procured from the NDC (NRSC Data Center), the official data supplier for IRS satellite images in India, do not have the global coordinate and projection systems. Therefore, the data need to be georeferenced before commencing the analysis. Since the topographic maps procured from Survey of India belong to year 1965, there are increased chances of error, if the toposheet data is taken as a reference for geo-referencing the satellite images. Therefore, Landsat ETM images have been taken as reference. Toposheets have been used for assistance in identification of features. The Landsat images are precisely ortho-rectified with the following parameters:
Projection Type: Universal Transverse Mercator (UTM)
Spheroid Name: WGS 84 Datum Name: WGS 84 Zone: 46-47 Landsat ETM images for the study area have been downloaded and a mosaic has been prepared. Then individual image of IRS has been registered with respect to the Landsat image. For each image an average of 18 GCPs (ground control points) have been taken and georeferencing has been carried out using second-order polynomial with nearest neighborhood resampling keeping grid size as 23 m. RMS (root mean square) error has been kept below 0.8 pixel. Survey of India toposheets have been utilized for accurately identifying the GCPs on IRS and Landsat images.
The geo-referenced images of the same year have been mosaiced together. Brahmaputra River is covered with clouds for most part of the year, therefore the satellite images of one year couldn’t be procured for same date or month. There is a time gap of about 2 to 4 months in the satellite images of one year. Therefore, radiometry of the images differ a lot. Making a mosaic without balancing the radiometry will not give good results. Therefore, radiometric normalization has been performed before mosaicing by histogram equalization and matching. This has given very good results, providing uniform brightness levels for similar features for the entire river basin. Also, feather option has been used for mosaicing to get the seamless boundaries between different images of same year. The mosaics for the years 1990 and 2008 have been prepared in this manner.
3.2.2. Preparation of NDWI Image
NDWI (Normalized Difference Water Index) shows the moisture content in soil and vegetation. NDWI image for IRS LISS-III data has been prepared using the following formula [17]

Since the IRS LISS-I doesn’t have SWIR band, therefore its NDWI image can be created using the following formula [18]

NDWI is useful to assess water content in a normalised way. This index increases with vegetation water content or from dry soil to free water. The SWIR reflectance indicates changes in soil and vegetation water content, while the NIR reflectance is affected by internal structure of leaf and soil but not by water content directly. The combination of the NIR with the SWIR removes variations induced by internal structure of leaf and soil, thus improving the accuracy in retrieving the vegetation and soil water content [19].
3.2.3. Delineation/Digitization of River Bank Line
The entire river from Dhubri to upper Assam beyond Dibrugarh has been divided into 120 strips at an equal spacing of approximately 5 km, reference cross sections have been drawn at the boundary of each strip. Each ten cross sections have been grouped as a reach with numbering from downstream to upstream of the river (of equal base length). Base line of latitude 25.966˚N and longitude 90˚E has been taken as permanent reference line, so that they maintain their identity when the morphology is changed. Table 1 shows some important locations within various reaches of the river.
The river bank-line has been identified and delineated for all the satellite image mosaics of 1990 and 2008. NDWI image proved very useful in identifying the river bank line. While the shallow water channels have been considered the part of river, old and new soil/sand deposits at the river banks posed some ambiguity of interpretation as the river. A few of these soil/sand patches are at considerable distance from active water channel, but have dark tone on satellite image, indicating higher moisture. On the other hand, several soil patches very close to the active water channel bear bright signature, an indication of low moisture. NDWI has been used in delineating the soil/sand areas which have higher moisture content. It has been observed that the areas with recent soil deposits have higher moisture in comparison to other areas adjacent to river bank, due to the river related activities associated with them. Either the river was flowing through that area in the recent past, or that area was submerged in water, when there was high flow in the river. These areas have been marked as a part of river. Thus the use of NDWI image helped in delineating/demarcating the river bank line.
The identified river bank lines for the left (south) and right (north) banks of the river, have been digitized using ArcMap software. Two river bank lines have been prepared for the years 1990 and 2008. The length of arcs of both the left and right banks for all the above years have been calculated using GIS software. Erosion and deposition area has been estimated through area estimation using GIS software tools for polygon areas with the shifting bank-lines in study period.
4. Results and Discussion
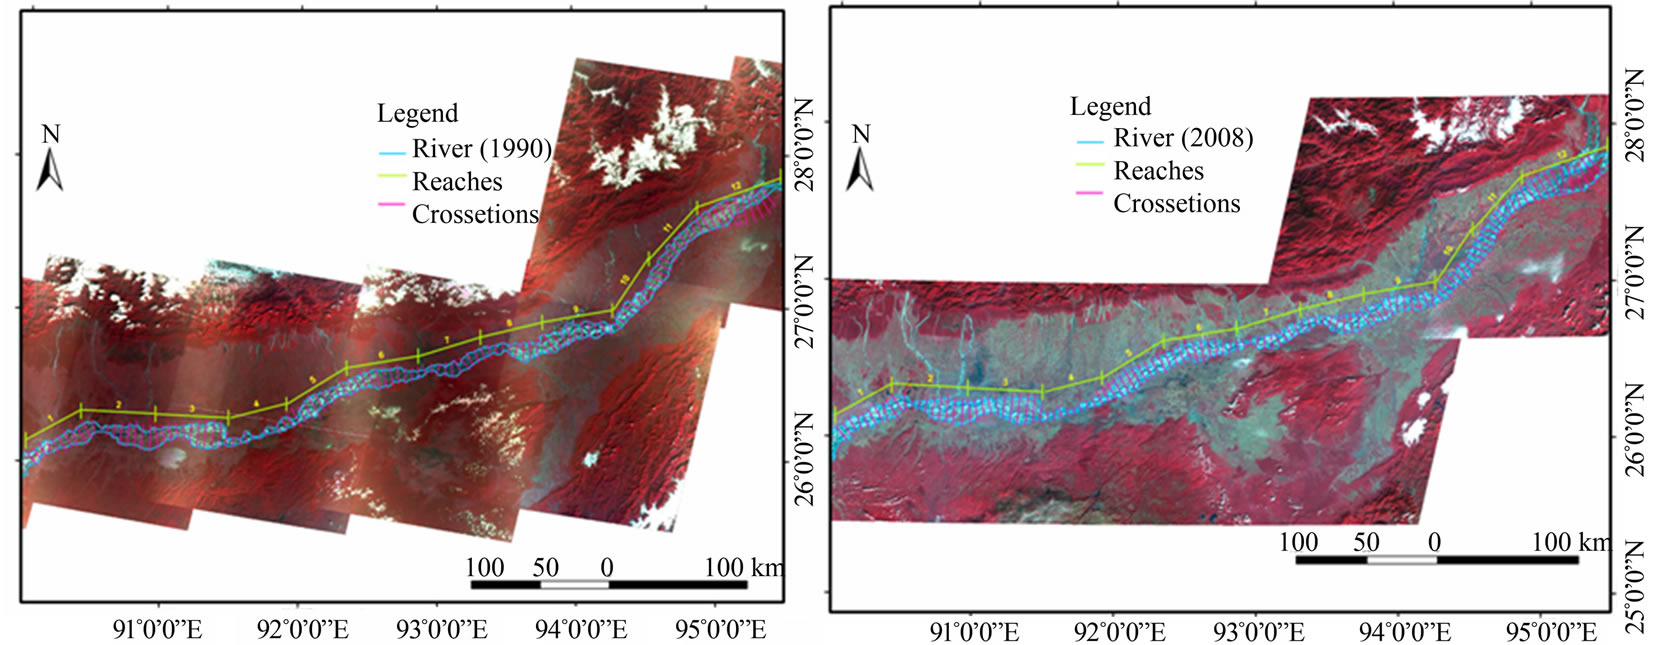
Mosaic images of year 1990 and 2008 with digitised bank lines and reference cross-sections drawn are presented in Figures 2(a) and (b). Table 2 accounts for the reach wise erosion and deposition area for the period 1990-
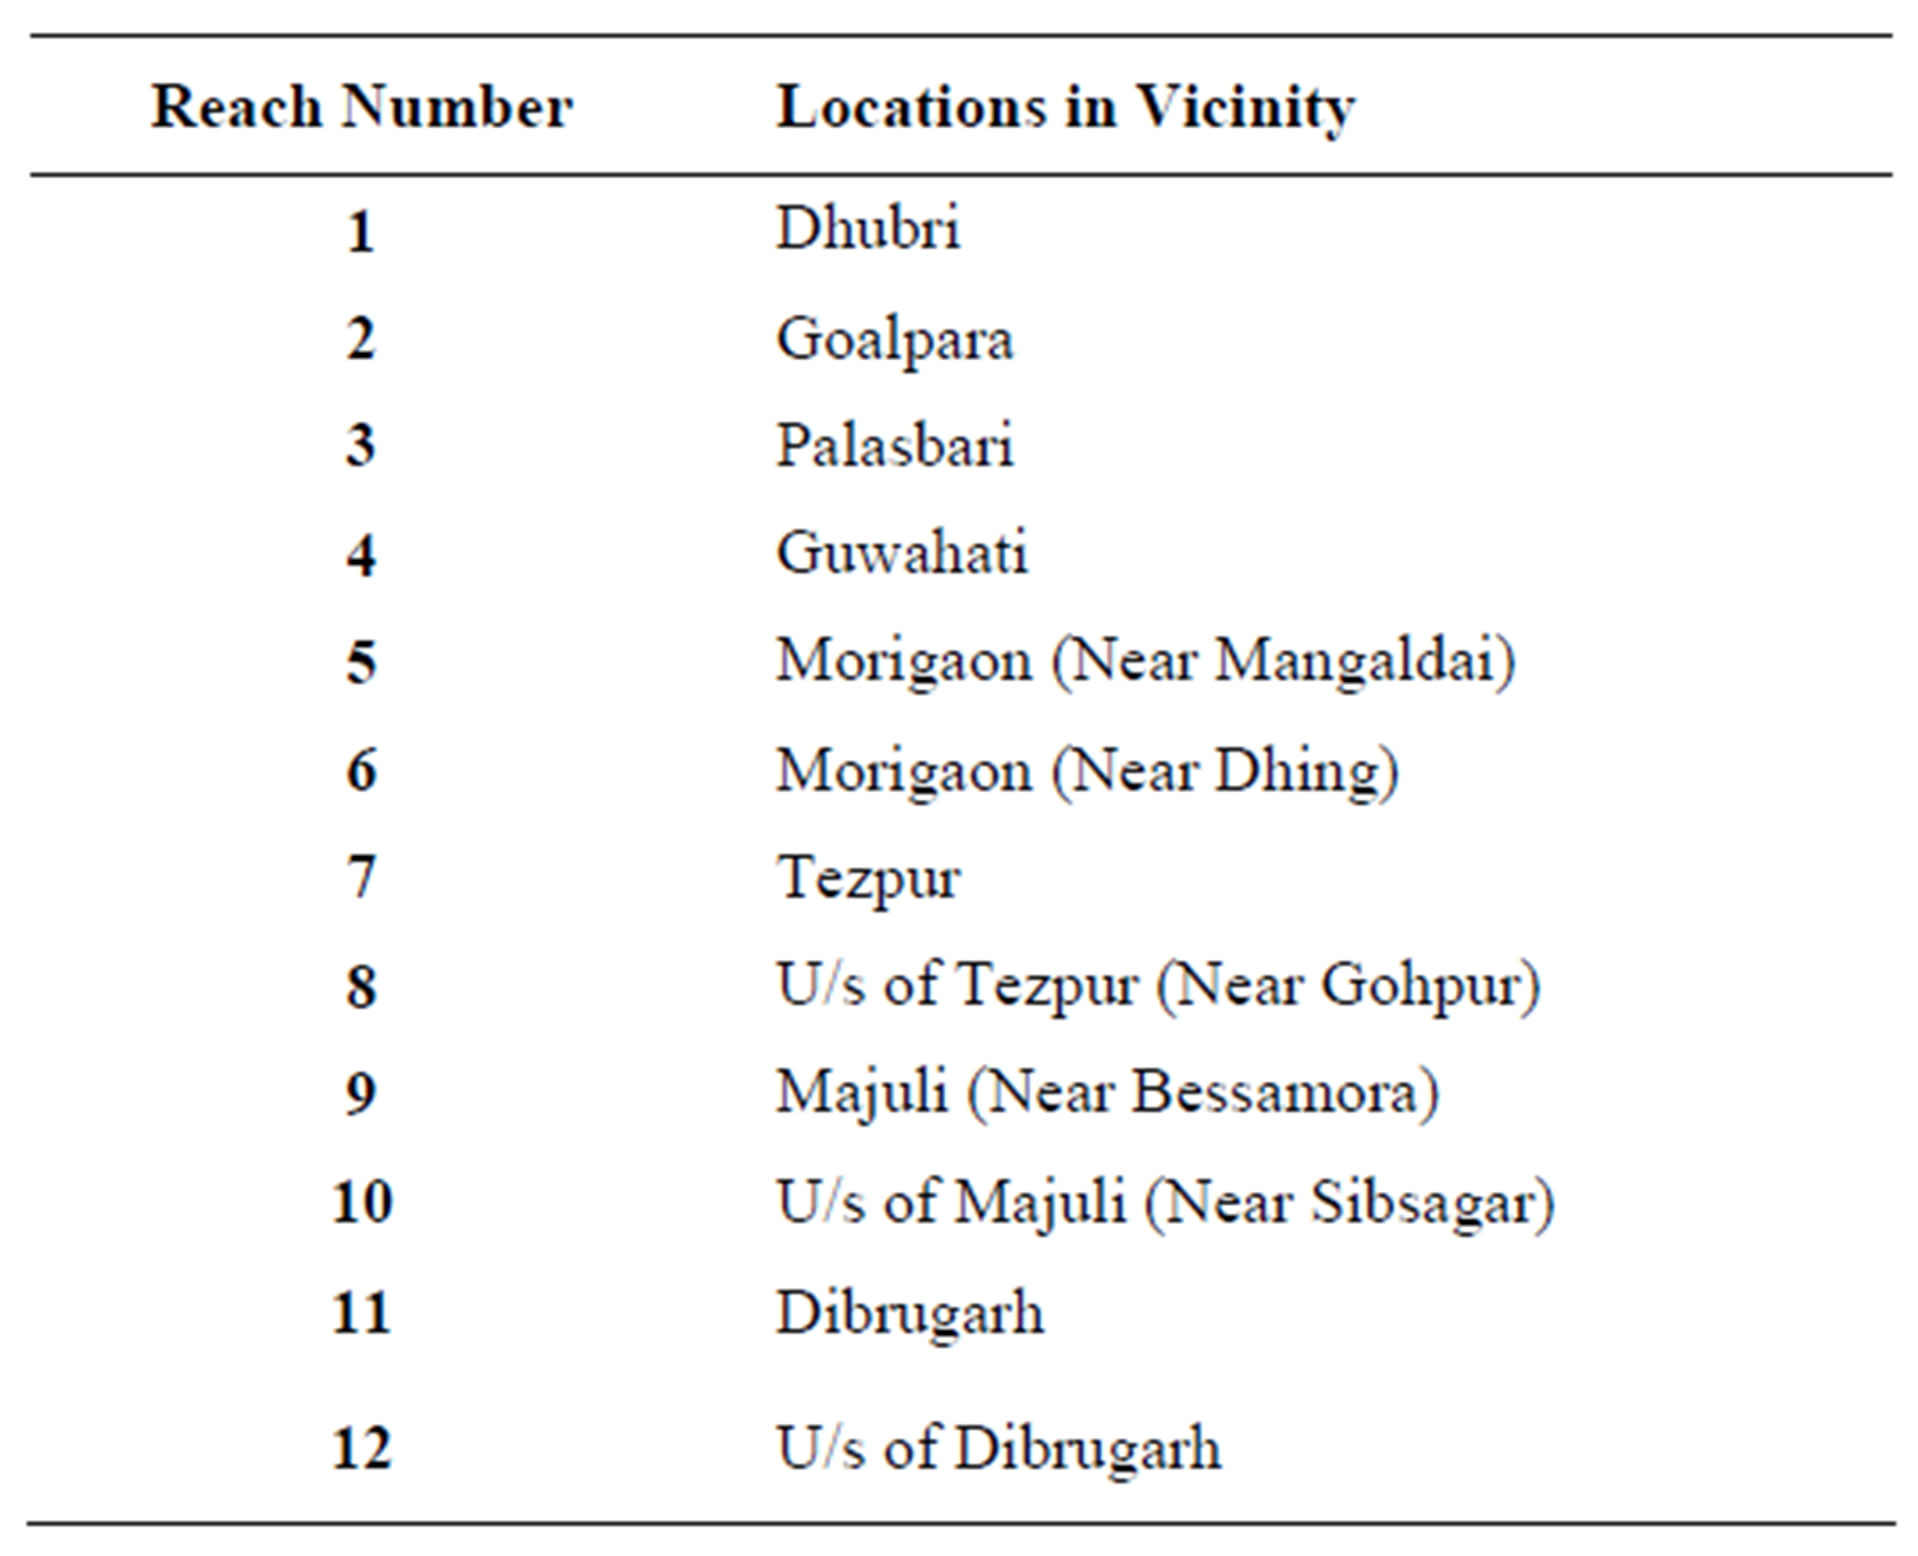
Table 1. Identification of reaches in respect of the location in the vicinity.
 (a) (b)
Figure 2. Satellite image of entire Brahmaputra river from U/s Dibrugarh to Dhubri (a) 1990; (b) 2008.
2008.
It is seen from Table 2 that there has been significant erosion in the river during a period of 18 years as compared to deposition. Erosion is more pronounced in the southern bank and overall rate of erosion and deposition work out to be 62.7 km2/year and 12.6 km2/year respecttively. The erosion rate has been calculated after excludeing forest area of southern bank in Reach 12.
Figure 3 depicts the river bank lines in the year 1990 and 2008. The integration of river bank lines of year 1990 and 2008 revealed that the Brahmaputra River has shifted its bank line drastically causing severe damage to the good agriculture as well as habitat area on its both sides. The erosion sites are located throughout its reach between U/s of Dibrugarh to Dhubri within India. Figure 4 depicts the erosion and deposition in study reach of the river for a period of 18 years. Figure 5 gives a graphical plot of reach wise total erosion/deposition in both banks of the river. It is evident from this graph that three to four major geological control points are present in the Brahamputra in Assam flood plains which are holding the river. These geological control points are in the vicinity of Jogighopa near Goalpara, Pandu near Guwahati, Tezpur and Bessemora near Majuli. Each control point usually has well defined hydrographic profile. Within geologically controlled reaches, intermittent fanning out and fanning in are exhibited which are being temporally severed in the geological increasing time scale.
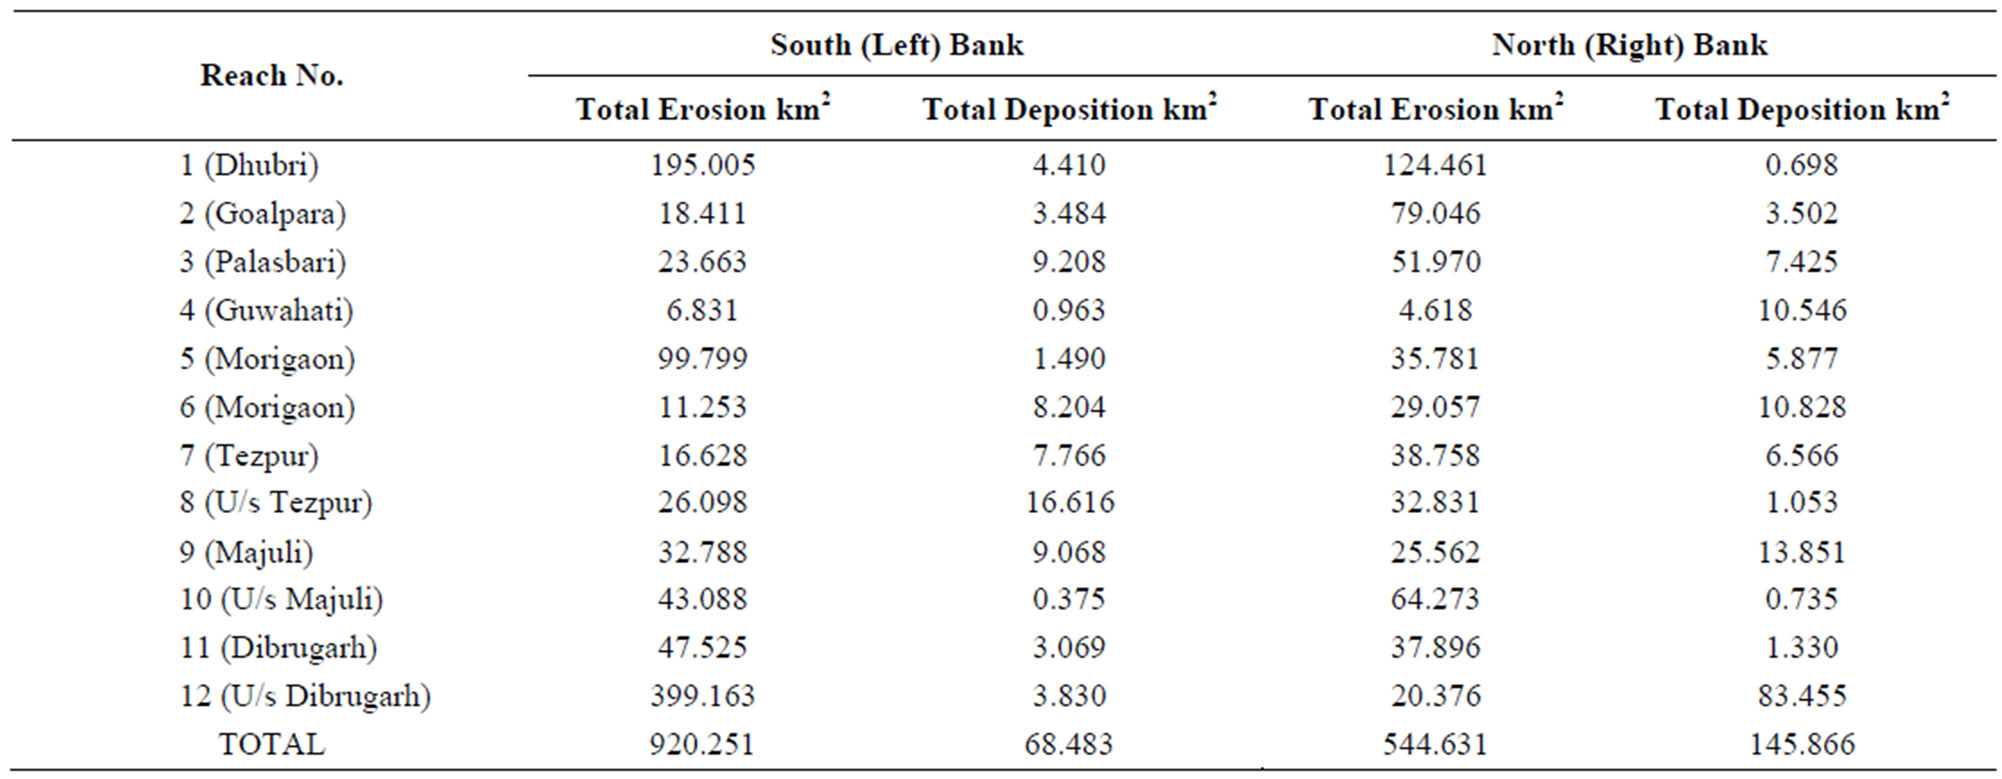
Table 2. Erosion/deposition area along Brahmaputra for the period 1990 to 2008.

Figure 3. River bank lines in discrete years.
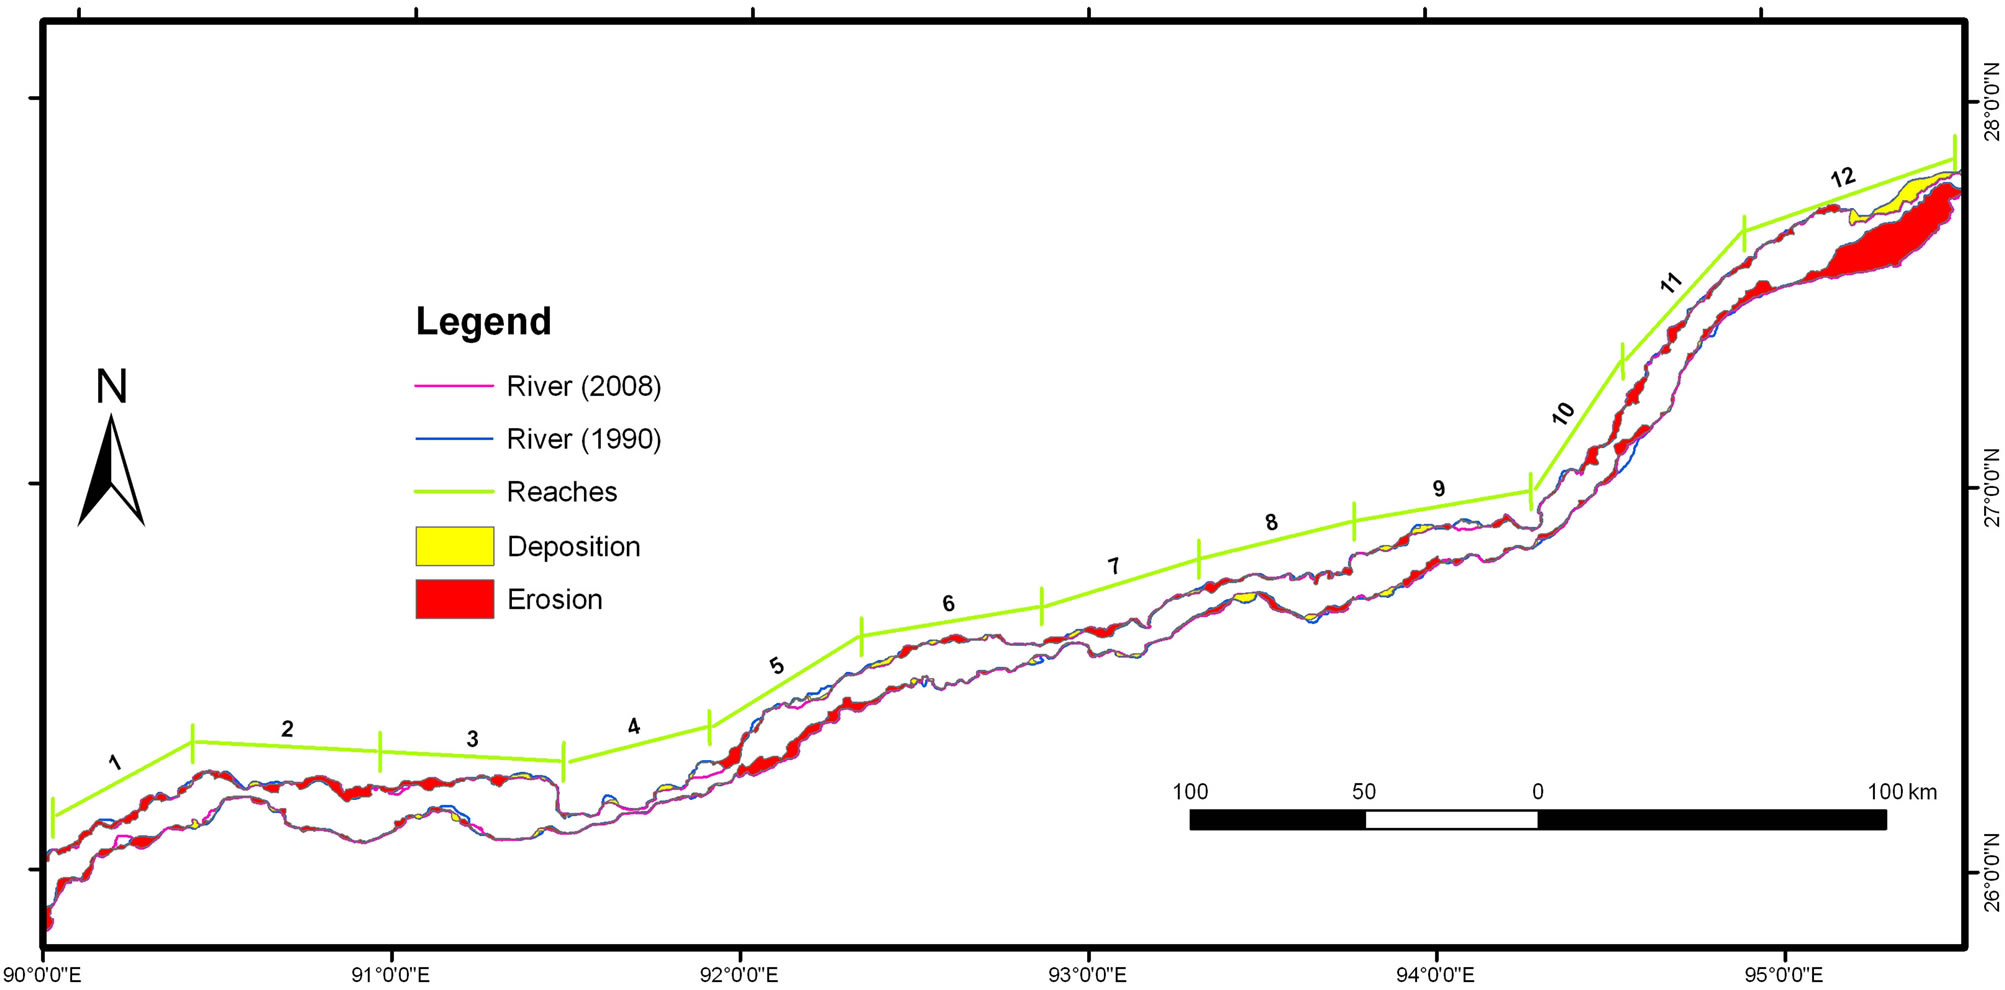
Figure 4. Erosion & deposition (1990-2008).
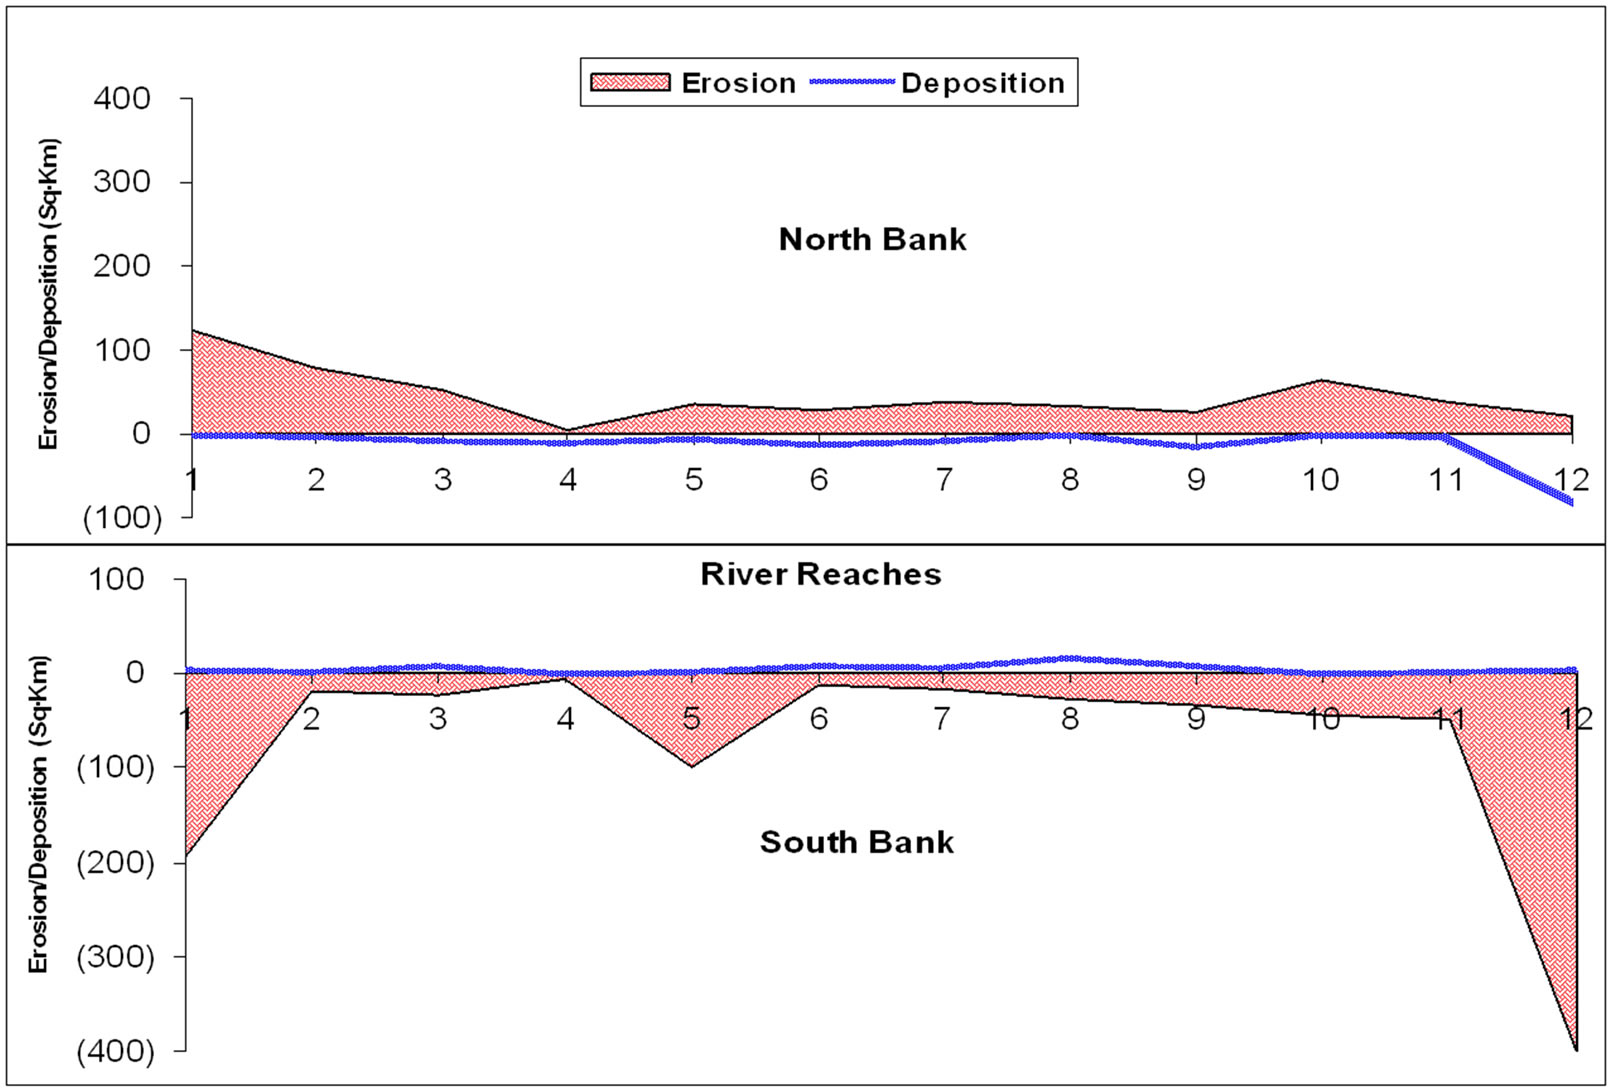
Figure 5. Total Erosion & Deposition over eighteen years (1990-2008) in various reaches of the Brahmaputra River.
Figure 6 depicts erosion and deposition in all the twelve reaches of the river. In reach-1 (in the vicinity of Dhubri) the river takes a southwesterly turn which is mainly due to the existence of a highland in the northern part of the turn which has prevented further westward flow of the river. This reach exhibits huge erosion in both the banks with more north-westward expansion. In reach- 2 and reach-3 near Goalpara and Palasbari respectively, the Brahmaputra River flows along the northern edge of the Shillong Plateau and through numerous inselbergs (granitic and gneissic hills) belonging to an exposed part of the Shillong Massif [16]. In these two reaches, right bank (northern) shows considerable shifting by following a preferred course closer to the northern edge of the Shillong Plateau with narrowing down to incised channel at Pandu near Guwahati. This change has probably occurred


Figure 6. Erosion/deposition in various reaches of the brahmaputra river over a period of 18 years (1990-2008).
due to the developed lowlands along the fault affected plateau edge causing the river to slowly respond to that tectonic change. Reach-4 is in the vicinity of Guwahati and it is seen that in downstream of Guwahati, river tends to move towards north side whereas, in upstream it tends towards south side keeping the control point at Guwahati invariant. Erosion is also minimum in both the banks compared with other reaches.
In reach-5 and reach-6 near Mangaldai and Dhing respectively, Brahmaputra River takes a huge northward curvature and the images depict huge erosion in the south bank (left bank). It is inferred that the Main Frontal Thrust (MFT) has developed in the Himalayan foothills, north of these two reaches which might have caused vertical tectonic loading of sediments of the basin resulting in the development of a northward slope and very strong northward migration. Reach-7 and reach-8 in the vicinity of Tezpur and upstream of Tezpur (near Gohpur) respecttively are north of the Mikhir Hills Massif (MHM) and the river basin becomes very narrow in these two reaches. Das & Saraf [16] have reported that the Brahmaputra River first shifted northward in front of MHM and later the river started shifting southward mainly due to the southward migration of Siwalik fold belts of the Himalayan region which is probably forcing the river to shift back in these two reaches. It is evident from the higher erosion in the north bank over last eighteen years.
Reach-9 is in the vicinity of Majuli Island and it can be seen from the river bank lines for this reach that the Brahmaputra River which was flowing in a south-westward direction upstream of this reach takes a sudden westward turn at Neamati, south of Majuli Island with higher erosion of the south bank during 1990-2008. The sudden westward turn of the river at Neamati is probably influenced by the occurrence of relatively higher landform to the south of the river and by the subsurface east-west trending Jorhat Fault zone, located along the southern bank of the river in this reach. Sarma and Phukan [20] suggested existence of the Brahmaputra River along a northern course around the present Majuli Island in the late seventeenth century but it avulsed its course southward. Reach- 10 in the vicinity of Sibsagar (U/s of Majuli) shows higher erosion in the north bank compared to the south bank during 1990-2008. This reach indicates a tendency of a northward expansion of the river course that should be due to the development of a northward slope of the basin.
The next reach, i.e., reach-11 in the vicinity of Dibrugarh shows a southward expansion with higher erosion of the south bank compared to the north bank. Although the main river channel has expanded in the southern direction, into the Dibrugarh town, the northward expansion is of much higher order. This is probably due to the formation of the northward dipping Main Frontal Thrust (MFT) in the Himalayan foothills very close to the Brahmputra River causing vertical tectonic loading of sediments resulting in the development of northward sloping land. Avulsion activities are seen during this period in the upstream of Dibrugarh (reach-12) where Lohit River changed its path and avulsed southward. This reach shows a very high amount of erosion in the south bank during 1990-2008 and it is marked by numerous abandoned channels, a meandering scar and water saturated zones.
Table 3 presents prioritization of various reaches in both banks of the river with respect to the land area lost. In the south bank, reach-5 in the vicinity of Morigaon (U/s of Guwahati) has undergone maximum erosion followed by reach-10 which is upstream of the Majuli Island. In north bank, reach-1 in the vicinity of Dhubri followed by reach-3 in the vicinity of Palasbari (D/s of Guwahati) exhibit maximum erosion. These prioritized reaches require in depth study for erosion management in the vicinity.

Table 3. Prioritization with respect to Land Area Lost.
5. Conclusions
The present work using remote sensing and GIS based approach with on multi-date satellite data has revealed sharp changes in fluvial land form in recent years resulting in considerable inhabited land loss. The braided Brahmaputra River within the study reaches exhibits differential rate of erosion and deposition during eighteen years (1990-2008). It is observed that in general the river has eroded both the banks throughout its course except at a few sites where its banks are well defined as the river is constricted due to presence of rocks. River adjustment processes that affected fluvial system of the Brahmaputra include the channel control points, surmised to be the major co-actors, working in unison with other forcing functions like channel degradation and aggradation, lateral river migration, widening or narrowing, avulsion, changes in the quantity and character of the sediment load at spatial and temporal scale, intensely powerful monsoon regime, recurring earthquakes and adverse impact of anthropogenic factors. Many reaches along the Brahmaputra River have been perceived as suffering from high erosion that endanger nearby settlements and infrastructure. The reaches have been prioritized with respect to the land area lost in eighteen years. There arises the need for in-depth study of interaction of geo-tectonic activities conjunctively with fluvial regime in the region to understand the complex physical processes completely for suggesting more practical result oriented river management interventions.
This study has proved the utility and application of satellite remote sensing which allows a retrospective, synoptic viewing of large regions and so provides the opportunity for a spatially and temporally detailed assessment of changes in river channel erosion/deposition. This study has further demonstrated how the use of GIS has been expedient in organization of geo-spatial databases and facilitation of channel position mapping and measurement. Conjunctive use of the information compiled and generated through this study with other collateral data on climate, flood control measures and in situ observations will serve towards taking up long term flood/erosion protection measures in the Brahmaputra basin.
REFERENCES
- N. Surian, “Channel Changes Due to River Regulation: The Case of the Piave River, Italy,” Earth Surface Processes and Landforms, Vol. 24, No. 12, 1999, pp. 1135- 1151. doi:10.1002/(SICI)1096-9837(199911)24:12<1135::AID-ESP40>3.0.CO;2-F
- X. Yang, M. C. J. Damen and R. A. van Zuidam, “Satellite Remote Sensing and GIS for the Analysis of Channel Migration Changes in the Active Yellow River Delta, China,” International Journal of Applied Earth Observation and Geoinformation, Vol. 1, No. 2, 1999, pp. 146- 157. doi:10.1016/S0303-2434(99)85007-7
- M. Rinaldi, “Recent Channel Adjustments in Alluvial Rivers of Tuscany, Central Italy,” Earth Surface Processes and Landforms, Vol. 28, No. 6, 2003, pp. 587-608. doi:10.1002/esp.464
- I. C. Fuller, A. R. G. Large and D. J. Milan, “Quantifying Channel Development and Sediment Transfer Following Chute-Off in a Wandering Gravel-Bed River,” Geomorphology, Vol. 54, No. 3-4, 2003, pp. 307-323. doi:10.1016/S0169-555X(02)00374-4
- L. Q. Li, X. X. Lu and Z. Chen, “River Channel Change during the Last 50 Years in the Middle Yangtze River: An Example of the Jianli Reach,” Geomorphology, Vol. 85, No. 3-4, 2007, pp. 185-196. doi:10.1016/j.geomorph.2006.03.035
- M. Kummu, X. X. Lub, A. Rasphonec, J. Sarkkulad and J. Koponen, “Riverbank Changes along the Mekong River: Remote Sensing Detection in the Vientiane-Nong Khai Area,” Quaternary International, Vol. 186, No. 1, 2008, pp. 100-112. doi:10.1016/j.quaint.2007.10.015
- NRSA, “Brahmaputra Flood Mapping and River Migration Studies-Airborne Scanner Survey,” National Remote Sensing Agency, Hyderabad, 1980.
- M. Bardhan, “Channel Stability of Barak River and Its Tributaries between Manipur-Assam and Assam-Bangladesh Borders as Seen from Satellite Imagery,” Proceedings National Symposium on Remote Sensing Applications for resource Management with Special Emphasis on N.E. Region, Guwahati, 25-27 November 1993, pp. 481-485.
- SAC and Brahmaputra Board, “Report on Bank Erosion on Majuli Island, Assam: A Study Based on Multi Temporal Satellite Data,” Space Application Centre, Ahmedabad and Brahmaputra Board, Guwahati, 1996.
- S. D. Naik, S. K. Chakravorty, T. Bora and I. Hussain, “Erosion at Kaziranga National Park, Assam, a Study Based on Multitemporal Satellite Data,” Project Report. Space Application Centre (ISRO) Ahmedabad and Brahmaputra Board, Guwahati, 1999, p. 70.
- U. Goswami, J. N. Sarma and A. D. Patgiri, “River Channel Changes of Subansiri in Assam, India,” Geomorphology, Vol. 30, No. 3, 1999, pp. 227-244. doi:10.1016/S0169-555X(99)00032-X
- P. Mani, R. Kumar and C. Chatterjee, “Erosion Study of a Part of Majuli River-Island Using Remote Sensing Data,” Journal of Indian Society of Remote Sensing, Vol. 31, No. 1, 2003, pp. 11-18. doi:10.1007/BF03030747
- L. Bhakal, B. Dubey and A. K. Sarma, “Estimation of Bank Erosion in the River Brahmaputra near Agyathuri by Using Geographic Information System,” Journal of Indian Society of Remote Sensing, Vol. 33, No. 1, 2005, pp. 81-84. doi:10.1007/BF02989994
- P. Kotoky, D. Bezbaruah, J. Baruah and J. N. Sarma, “Nature of Bank Erosion along the Brahmaputra River Channel, Assam, India,” Current Science, Vol. 88, No. 4, 2005, pp. 634-640.
- J. N. Sarma, D. Borah and U. Goswami, “Change of River Channel and Bank Erosion of the Burhi Dihing River (Assam), Assessed Using Remote Sensing Data and GIS,” Journal of Indian Society of Remote Sensing, Vol. 35, No. 1, 2007, pp. 94-100. doi:10.1007/BF02991837
- J. D. Das and A. K. Saraf, “Remote Sensing in the Mapping of the Brahmaputra/Jamuna River Channel Patterns and Its Relation to Various Landforms and Tectonic Environment,” International Journal of Remote Sensing, Vol. 28, No. 16, 2007, pp. 3619-3631. doi:10.1080/01431160601009664
- B. C. Gao, “NDWI—A Normalized Difference Water Index for Remote Sensing of Vegetation Liquid Water from Space,” Remote Sensing of Environment, Vol. 58, No. 3, 1996, pp. 257-266. doi:10.1016/S0034-4257(96)00067-3
- S. K. Jain, A. K. Saraf, A. Goswami and T. Ahmad, “Flood Inundation Mapping Using NOAA AVHRR Data,” Water Resources Management, Vol. 20, No. 6, 2006, pp. 949- 959. doi:10.1007/s11269-006-9016-4
- P. Ceccato, S. Flasse, S. Tarantola, S. Jacquemond and J. M. Gregoire, “Detecting Vegetation Water Content Using Reflectance in the Optical Domain,” Remote Sensing of Environment, Vol. 77, 2001, pp. 22-33. doi:10.1016/S0034-4257(01)00191-2
- J. N. Sarma and M. K. Phukan, “Origin and Some Geomorphological Changes of Majuli Island of the Brahmaputra River in Assam, India,” Geomorphology, Vol. 60, No. 1-2, 2004, pp. 1-19. doi:10.1016/j.geomorph.2003.07.013