Journal of Water Resource and Protection
Vol. 3 No. 11 (2011) , Article ID: 8679 , 17 pages DOI:10.4236/jwarp.2011.311089
Developing a Framework to Measure Watershed Sustainability by Using Hydrological/Water Quality Model
1Currently at International Water Management Institute (IWMI), Colombo, Sri Lanka
2Department of Bioresources Engineering, University of Delaware, Newark, USA
E-mail: *a.sood@cgiar.org
Received September 1, 2011; revised September 30, 2011; accepted October 25, 2011
Keywords: Sustainability, Development, Framework, Watershed, Resilience, Reliability, Vulnerability, Hydrological models application, Landuse
ABSTRACT
A framework is built, wherein hydrological/water quality model is used to measure watershed sustainability. For this framework, watershed sustainability has been defined and quantified by defining social, environmental and biodiversity indicators. By providing weightage to these indicators, a “River Basin Sustainability Index” is built. The watershed sustainability is then calculated based on the concepts of reliability, resilience and vulnerability. The framework is then applied to a case study, where, based on watershed management principles, four land use scenarios are created in GIS. The Soil and Water Assessment Tool (SWAT) is used as a hydrology/water quality model. Based on the results the land uses are ranked for sustainability and policy implications have been discussed. This results show that landuse (both type and location) impact watershed sustainability. The existing land use is weak in environmental sustainability. Also, riparian zones play a critical role in watershed sustainability, although beyond certain width their contribution is not significant.
1. Introduction
The concept of sustainable development has been there since the mid twentieth century but it was promoted by UNEP in the 70s and later by the World Bank in the early 80s. Sustainability implies maintaining natural resources for future generations and sharing them in an equitable manner in the current generation [1]. In reality there is no clear consensus on how to achieve development that can be considered sustainable [2]. Some scholars try to define sustainability based on the level of substitution of human and non-human capital allowed [3,4]. Others have defined sustainability from urban perspective [5,6]. Wackernagel and Rees [7] look at sustainability from an ecological perspective. Vliet [8] suggests nine principles of sustainability whereas Afgan [9] has done a good job of compiling a set of definitions of sustainability from different organizations and perspectives. Goodland [3] broke the sustainability debate into three paradigms—technocentric paradigm, ecocentric paradigm, and sustaincentric paradigm. Another way to look at sustainability is by broadly classifying it as social, economic and environmental [10]. Each class of sustainability focuses on maintaining its own capital. From human society’s perspective, natural capital can be considered as a “stock of environmentally provided assets” that provide useful service to humans [3]. From the ecological perspective, natural capital includes all the living and nonliving (like air, water, soil) matter. Out of the three classes of sustainability, environmental sustainability takes precedence [4]. Social and economic sustainability depends upon the success of environmental sustainability.
Many frameworks have been developed over the last two decades so as to try to measure the impact of human activity on the society and the environment. The approaches to develop these frameworks can be broadly divided into four groups: media approach, stress response approach, resource accounting approach, and ecological approach [11]. The media approach looks at the indicators from the environmental component perspective like air, water, land etc. The stress response approach considers the impact of human activity on the environment and the environment’s response to that. The resource accounting approach deals with the whole life cycle of the project from the flow of natural resources perspective. Finally, the ecological approach also includes ecological models along with other models and monitoring techniques. Within these four groups, four major international models have been developed.
“Framework for the Development of Environmental Statistics (FDES) developed by the United Nations Statistical Office, relates environmental components to four information categories—social and economic activities, natural events; environmental impacts of activities/events; responses to environmental impacts; and inventories, stocks and background conditions. Pressure-State-Response (PSR) framework developed by the Organization for Economic Cooperation and Development (OECD), has three components that are measured by indicators—pressure that the human society puts on the environment; the resulting state or condition of the environment; and the response of the society to these conditions. It forms a closed loop since the response of the society further impacts the environment. The Driving Force-State-Response (DSR) framework developed by the Commission on Sustainable Development, groups the indicators in three categories— driving force indicators deal with human activities and processes that impact the environment; state indicators measure the state of sustainable development; and the response indicator looks at the policies and other responses to the state of environment and development. Agenda 21 is based on this framework. The Driving ForcePressure-State-Impact-Response (DPSIR) framework developed by the European Environmental Agency (EEA) and the Statistical Office of the European Communities (Eurostat) is a further enhancement of PSR and DSR framework. It breaks up indicators into five groups— driving force that deals with social, economic and demographic development; pressure measures the processes that have harmful effect on the environment; state indicators deal with the state of environment; impact indicators measure the impact of the state of the environment on society; and response is the reaction of various organizations and society.
To bring the debate of sustainable development from out of the theoretical realm and make it useful, sustainability indicators are required. These indicators are affected by the cultural, technical, economical, physical and social conditions [2]. Heintz [12] suggests four major categories of indicators—system capacities and their allocation, consequences of water allocation, effects on people and underlying processes and driving forces. Afgan [9] suggests grouping the indicators for each subsystem and then combining them into a sustainability indicator. Indicators should be large enough to be comprehensive but small enough to be practical and understandable [13]. Each region or watershed will have to come up with its own set of sustainability indicators but the underlying principle has to be the same. Barlow et al. [14] define water sustainability as the “development and use of water resources in a manner that can be maintained for an indefinite time without causing unacceptable environmental, economic, or social consequences”. Gleick [15] defines sustainable water use as “the use of water that supports the ability of human society to endure and flourish into the indefinite future without undermining the integrity of the hydrological cycle or the ecological systems that depend on it”.
Various attempts have been made previously to come up with set of indicators or an index to quantify measure and monitor the social and environmental impact of human development. Most of these indicators, like Human Development Index (HDI), Water Poverty Index (WPI), Climate Variability Index (CVI), Environmental Sustainability Index (ESI) have been developed to evaluate national trends at global level [16]. Efforts are being made at the national level, for e.g. in US, the Sustainable Water Resources Roundtable (SWRR) came up with over 400 indicators for water sustainability and SWRR selected 17 critical ones [13]. Among the recent indices development, Chaves and Alipaz, 2007 used the pressure-state-response and the concept of UNESCO’s International Hydrology Program framework of hydrology, environment, life and policy issues (HELP) to define a watershed level watershed sustainability index (WSI). This study considers the previous five years for building and measuring their index. There are few studies targeted at regional or watershed level and none (to the best knowledge of the authors) that use hydrological models. Most of the studies done and indices developed have focused on the past performances. These studies, although helpful to measure the impact of existing policy implementations, do not provide framework to measure the impact of future policy implications. Also, these studies look at various nations and regions from the same lens. Chaves and Alipaz [16] study measures the percentage variation in multiple indicators in the watershed but ignores the variability of different watersheds. The framework presented in this research uses hydrological/water quality model at watershed scale to consider various policy implementation scenarios in terms of land use before they are actually implemented. It takes into account the unique characteristics, local demands of each watershed. For example, one watershed can have higher assimilation property than other and hence can withstand higher development pressure than another. This framework is an example of a progressive, bottom-up approach. Thus, this paper adds to the ongoing research in sustainable development.
2. Methodology and Data Description
For this research, the following steps were followed:
Step 1: River Basin Sustainability Index was defined and developed (discussed in Section 4);
Step 2: The calibrated and validated watershed model was developed (not covered in this paper);
Step 3: Land use scenarios were created by using GIS (discussed in Section 5.2);
Step 4: The land use of the calibrated model was replaced with each scenario and the model run for 50 years;
Step 5: The River Basin Sustainability Index was measured for each land use scenario;
Step 6: Resilience, Reliability and Vulnerability was measured for each land use scenario.
SWAT2000 version incorporated in the EPA’s Better Assessment Science Integrating point and Nonpoint Sources (BASINS) (version 3.1) was used in the case study to model Millsboro Pond watershed in Inland Bays basin in southern Delaware region of USA. To analyze a watershed, the model divides it into sub-watersheds based on topography. The sub-watersheds are further divided into hydrologic response units (HRU) based on similar land use and soil properties. Major components of the model are hydrology, weather, erosion, soil temperature, crop growth, nutrients, pesticides, and agriculture management [17]. The water balance is the driving force behind all of model simulations. Hydrology simulation is based upon two divisions—the land phase of the hydrological cycle (which includes movement of water, nutrients, pesticides from precipitation till the main channel); and the water or routing phase of the hydrological cycle (which includes movement of water, nutrients and pesticides through the channel network to the watershed outlet) [18]. Surface runoff and infiltration are calculated from the modification of the Soil Conservation Service (SCS) curve number method or Green and Ampt infiltration method (but this method requires subdaily precipitation data). SWAT can estimate evapotranspiration by one of the three methods: Modified Penman Montieth, Hargreaves, and Priestley-Taylor. Sheet erosion and sediment yield are calculated based on the Modified Universal Soil Loss Equation (MUSLE). Channel sedimentation routing is estimated based on the modified version of Bagnolds sediment transport equation, which uses flow velocity to estimate transport concentration capacity. SWAT profiles the soil in multiple layers. Soil water processes include infiltration, runoff, evaporation, plant uptake, lateral flow, and percolation to lower layers. Nitrogen and phosphorus processes are handled in a similar manner as in the Erosion Productivity Impact Calculator (EPIC) model. Use of nitrogen and phosphorus by biomass from the soil is based upon supply and demand. Plant’s nitrogen (N) demand is a function of total biomass and the N concentration in the biomass. Supply is based on N in the soil. Nitrogen in the water is calculated as a product of nitrogen concentration and volume of water. Dissolved phosphorus is calculated based on the concept of partitioning phosphorus into solution and sediment phases. It uses labile P concentration in the top 10 mm of soil, runoff volume and a phosphorus soil-partitioning coefficient. Stream nutrient dynamics uses the kinetic routines from the water quality model QUAL2E. SWAT also allows simulation of land management practices. Management practices are broadly divided into agriculture management, water management and urban areas. Some of the management practices in agriculture management include plant growth cycle, timing of fertilizer, type of tillage, pesticide application, and removal of plant biomass. The crop model is a simplification of the EPIC crop model. Water management includes irrigation, tile drainage, impounded/depresssional areas, water transfer, consumptive water use, and loading from point sources. For the urban areas, the model estimates quantity and quality of the runoff based upon the impervious cover that are either directly connected to the drainage system and those that are not directly connected.
The terrain elevation data was downloaded from the USGS in digital raster form as Digital Elevation Model (DEM). The DEM used in this research was 1-degree DEMs (3- by 3-arc second data spacing) provides coverage in 1- by 1-degree blocks. The surface water data in the form of reaches data was also downloaded from the National Hydrography Dataset (NHD) developed by USGS based on 1:100,000 scale data. The NHD supersedes USGS Digital Line Graph (DLG) hydrography data and the EPA Reach File Version 3 (RF3). The soil profile was created from the data downloaded from STATSGO developed by the National Cooperative Soil Survey. The weather data, which includes precipitation, maximum and minimum temperature, solar radiation, and wind speed, was obtained for the Georgetown station from the Office of Delaware State Climatologist’s website. The groundwater level data was obtained from the Delaware Geological Society, University of Delaware’s website. The hydrological data was downloaded from the National Water Information System of the USGS for the station 01484525 at Millsboro Pond outlet at Millsboro, DE. The nutrient data (i.e. nitrogen and phosphorus) for the Millsboro pond outlet was retrieved from the Delaware Inland Bays Water-Quality Database (DIBWQDB) distributed by the Delaware Geological Survey (DGS). This database was built as part of the “Nutrient Inputs as a Stressor and Net Nutrient Flux as an Indicator of Stress Response in Delawares’ Inland Bays Ecosystem” (CISNet) and the “Inland Bays Tributary Total Maximum Daily Load” (IBTMDL) projects and has data from 1998 to 2002. For land use land cover (LULC), National Land Cover Database (NLCD) 2001 land cover was used. NLCD has been created through a cooperative project conducted by the Multi-Resolution Land Characteristics (MRLC) Consortium.
SWAT uses its own weather generator, which is based on the WXGEN weather generator model. The weather generator is used either to predict weather information in the future or fill in the gaps in the existing weather data. The accuracy of this weather generator was not evaluated in this study, but it has been widely used in multiple studies (e.g. most of the studies using SWAT model [19, 20]. Although there are shortcomings with this generator but this is still popular stochastic model that is available [21]. Additionally, the focus of this research is on the framework of sustainability and a more reliable weather generator, when available, can be used in future studies. For the weather generator to function, an input file containing the statistics of the historic weather needs to be input. It is recommended to use at least 20-years’ worth of historic data. For this research, 50 years of historic data, i.e. from 1958 to 2007 was used. The historic weather data was collected from the same weather station (i.e. Georgetown station) that was used to calibrate and validate the model. A program called WXPM3020, developed and supported by the staff of SWAT development team, was used to generate the statistical values to be input in the SWAT weather generator model. Before using WXPM3020 program, the historic weather data was run through another program called WXGN3020, which simulates any missing data. The output from WXPM3020 was used as an input for the .wgn file in SWAT.
3. Framework
Development in the context of this research means change in land use from its natural function to provide goods and services to the mankind. The change in land use can be either development for residential, commercial, recreation or agriculture purposes. Sustainability in a watershed context means development of the watershed so as to provide at the minimum the basic services to its stakeholders at all the times (including drought) without compromising the quality of water, its ability to perform its ecological function and reserving sufficient resources for the biodiversity to proliferate. Goods and services provided by the development is the economic benefit to the community. Basic services provided by water to humanity are safe water for drinking, water for sanitation, water for livelihood (either agriculture or manufacturing). The term “all the times” is significant for sustainability. Water, being a natural resource, is an uncertain commodity. Droughts and floods create stress in the watershed—both to humans and non-human population. The development of a watershed can be called sustainable only when it can “cope with and recover” from these stresses. Hence the goal of water sustainability is not to have enough water available all the time, but rather have the system in place so as to adapt to the changing water scenario in a region. The system should be resilient enough to recover from occasional drought or floods and hence be less vulnerable to the whims of nature. Also, from an ecological perspective, there is a minimum amount of water required to fulfill its ecological obligations especially for aquatic systems. During the extreme conditions, these obligations should be met to a level so as not to impact the biota adversely. Finally, since land use is the main management tool in the watershed management, it is necessary to consider the continuity of undeveloped areas in a watershed so as to provide an undisturbed haven to the local wildlife. Given enough space and resources, the local wildlife can prosper as long as there is no interference from the humans. Fragmentation of wildlife habitat can adversely interfere with biodiversity. Hence continuity of human-interference-free land use can lead to sustaining the biodiversity of the region (this is a narrower view of biodiversity—a broader view would include consideration at eco-region scale).
3.1. Reliability, Resilience and Vulnerability
Sustainability in a water system can be measured in terms of reliability, resilience and vulnerability [22]. It can be measured in terms of the time required by the system to return to the equilibrium state after it has been disturbed from the equilibrium (also called “engineering resilience” [23]). Klein et al. [24] consider vulnerability to be “degree of incapability to cope with” disturbances. While the resistance is the ability of the system to avoid disturbance, the resilience (as discussed above) is the system’s capacity to respond. Fara [25] uses the definition of vulnerability as “the characteristics of a person or group in terms of their capacity to anticipate, cope with, resist and recover from the impact of a natural hazard”.
In this research, the mathematical representation of reliability, resilience and vulnerability as developed by Loucks and Gladwell [22] have been used. Such methodology has been successfully used in engineering based water resource systems [22,26]. By defining the acceptable range for the indicator, it can be seen that how many times the system fails (i.e. indicators fall outside the pre-defined acceptable limits). Thus reliability has been defined as the probability of a system to be within the range of satisfactory values over a period of time under consideration. Resilience has been defined as a measure of the “speed of recovery” from an unsatisfactory condition. Finally vulnerability has been defined as the statistical measure of the extent of failure. These three parameters can be used together to measure sustainability in a quantitative way.
3.2. Indicators for Watershed Sustainability
Indicators for watershed sustainability can be divided into social development, environment and biodiversity (Figure 1). For this framework, it has been assumed that the economic system is constrained by the availability of the natural resources (land and water to support livelihoods). As long as these resources are used in a way to provide for livelihood, it will lead to economic wellbeing. Since the issues related to watershed sustainability are region specific, the indicators should measure the performance of the region relative to its requirements. Thus two regions with very different hydrological profile may be equally sustainable because the demands within the watershed may be different. The indicators are defined in Table 1. The range of all the indicators are from 0 (worst case) to 1 (best case).
3.3. River Basin Sustainability Index (RBSI)
As discussed earlier, river basin sustainability incorporates social, environmental and biological sustainability. Hence river basin sustainability index can be created by summing up the social, environmental and bio-diversity indicators as discussed above. Based on the region, some indicators could be more critical than others. Thus a proper weight needs to be applied to these indicators based on the subjective judgment regarding the issues for the region under study. This is shown in the following equation:
IWS = WWD*IWD + WWL*IWL + WRE*IRE
+ WWP*IWP + WWE*IWE + WUL*IULwhere Wx is the weightage for “x”.
The RBSI gives a measure of the watershed’s sustainability on an annual basis. A natural system cannot be sustainable all the time. During extreme events like drought or flooding, a system becomes unsustainable. Applying the analogy of sustainable livelihoods to sustainable watershed, a good measure of watershed sustainability is the ability of the system to cope and eventually recover from the stresses of such extreme (non-sustainable) events.
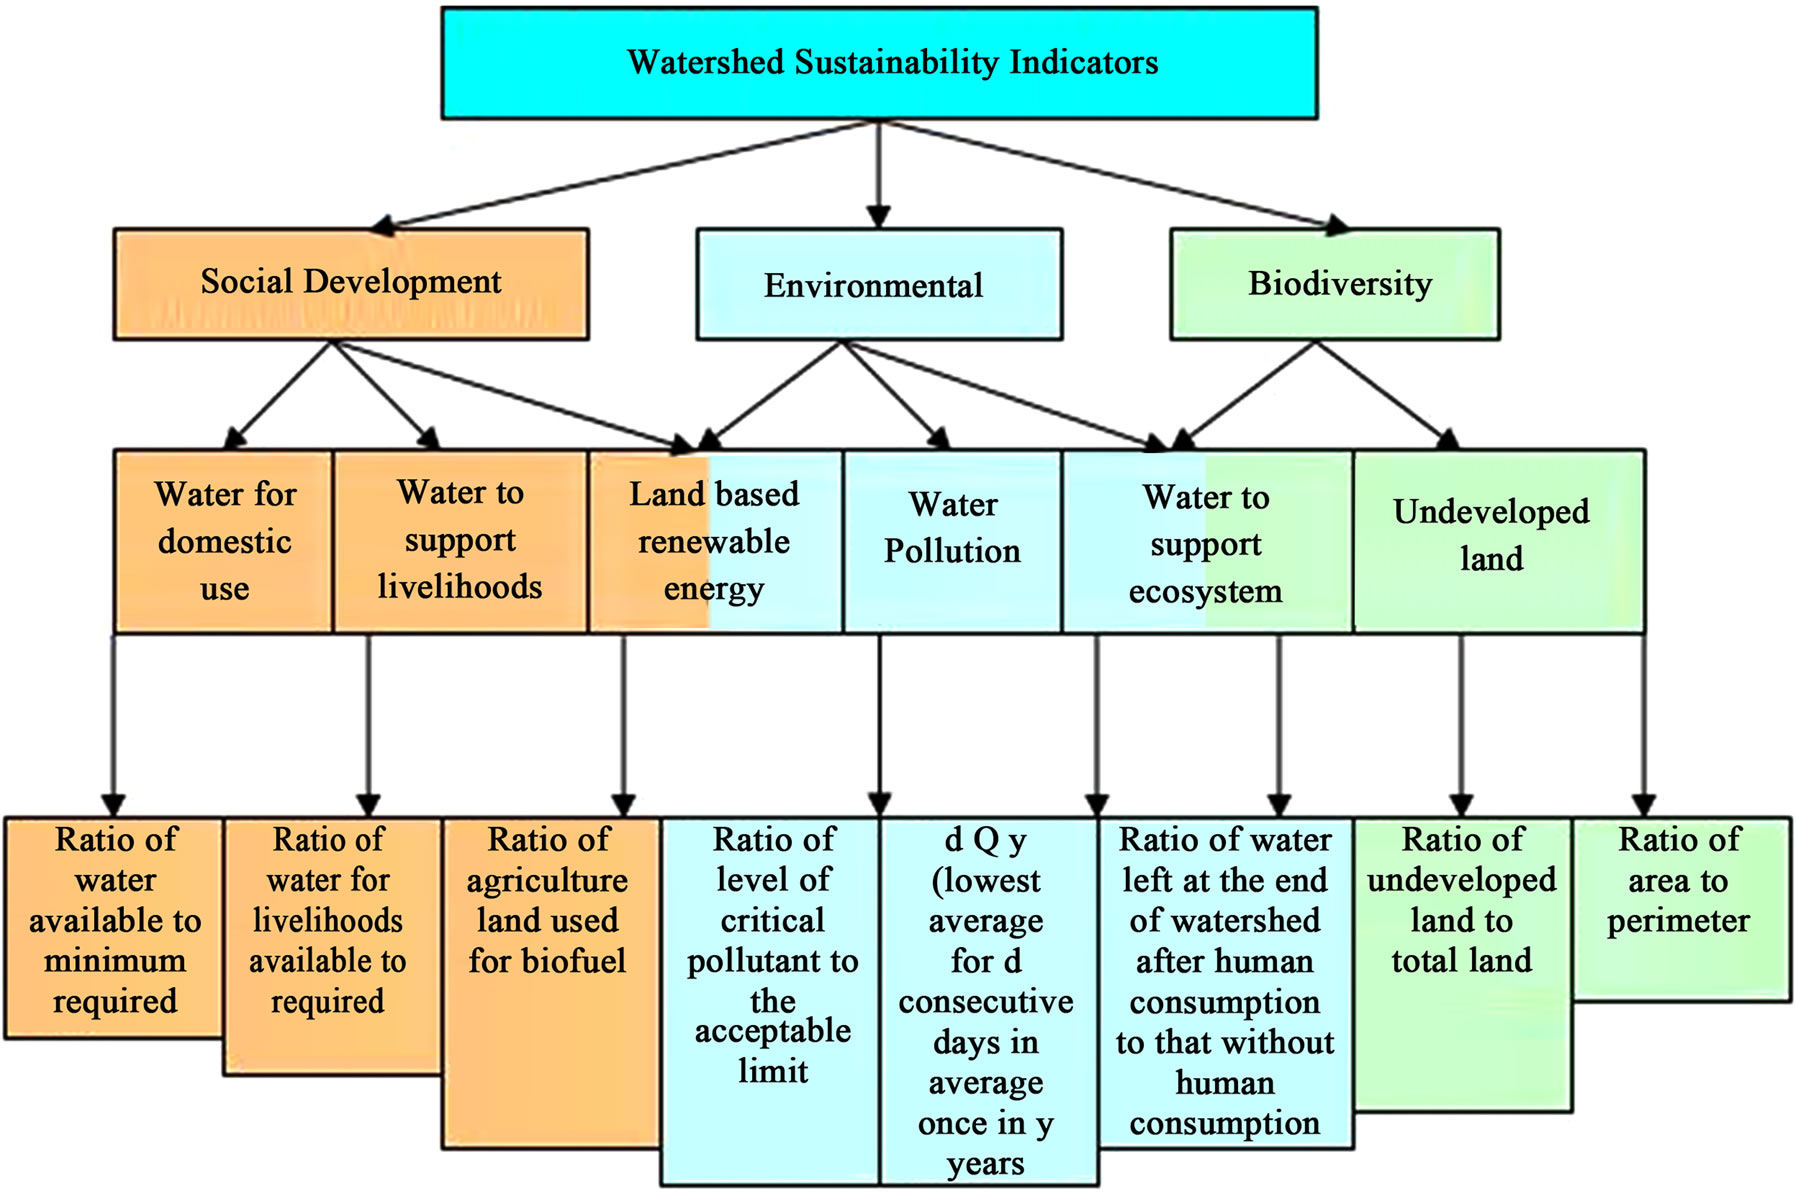
Figure 1. Watershed sustainability indicator.
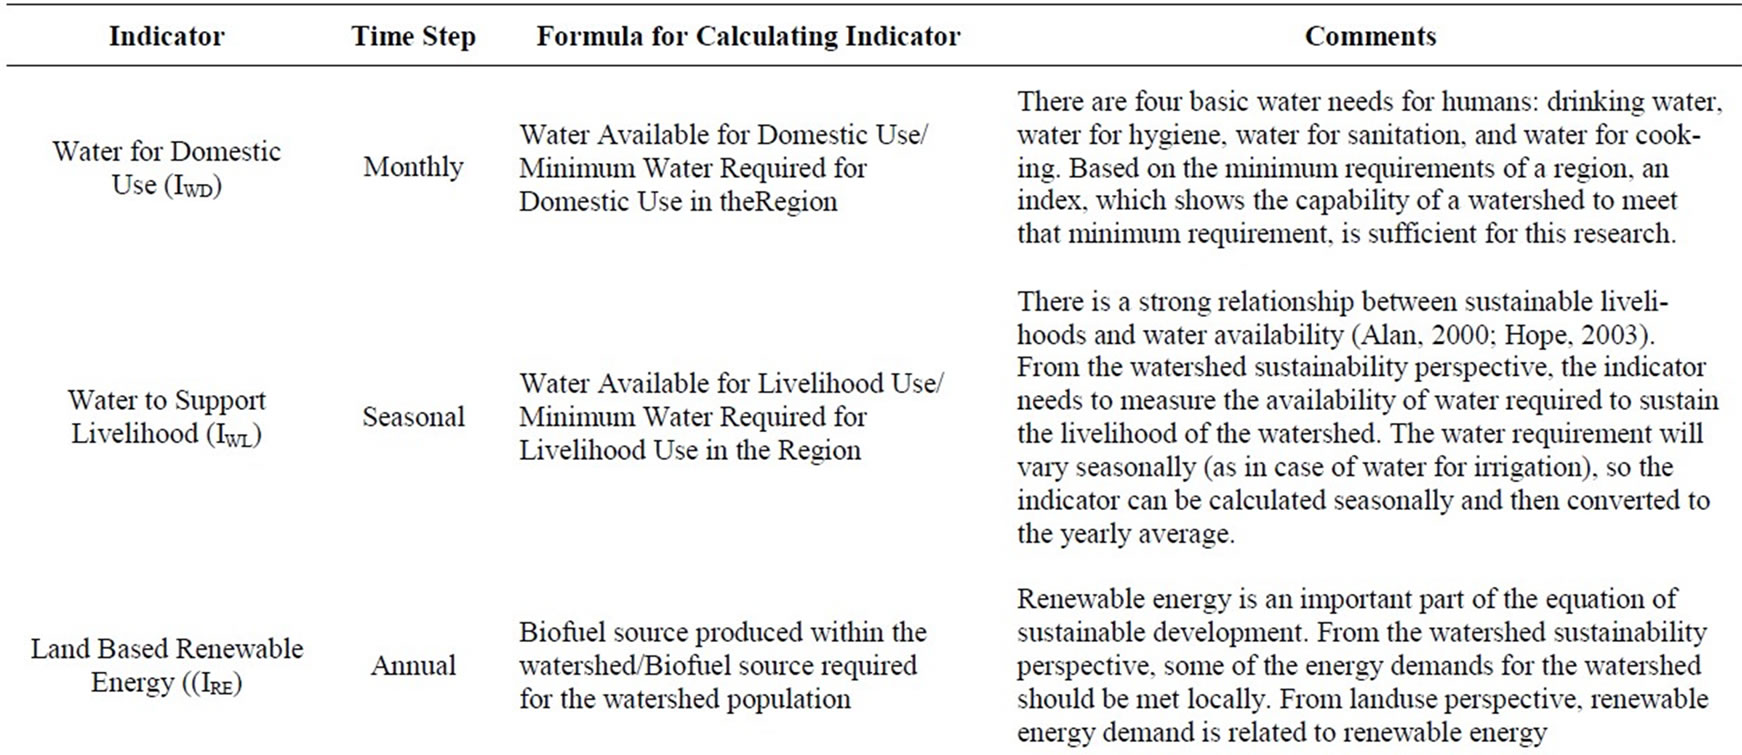
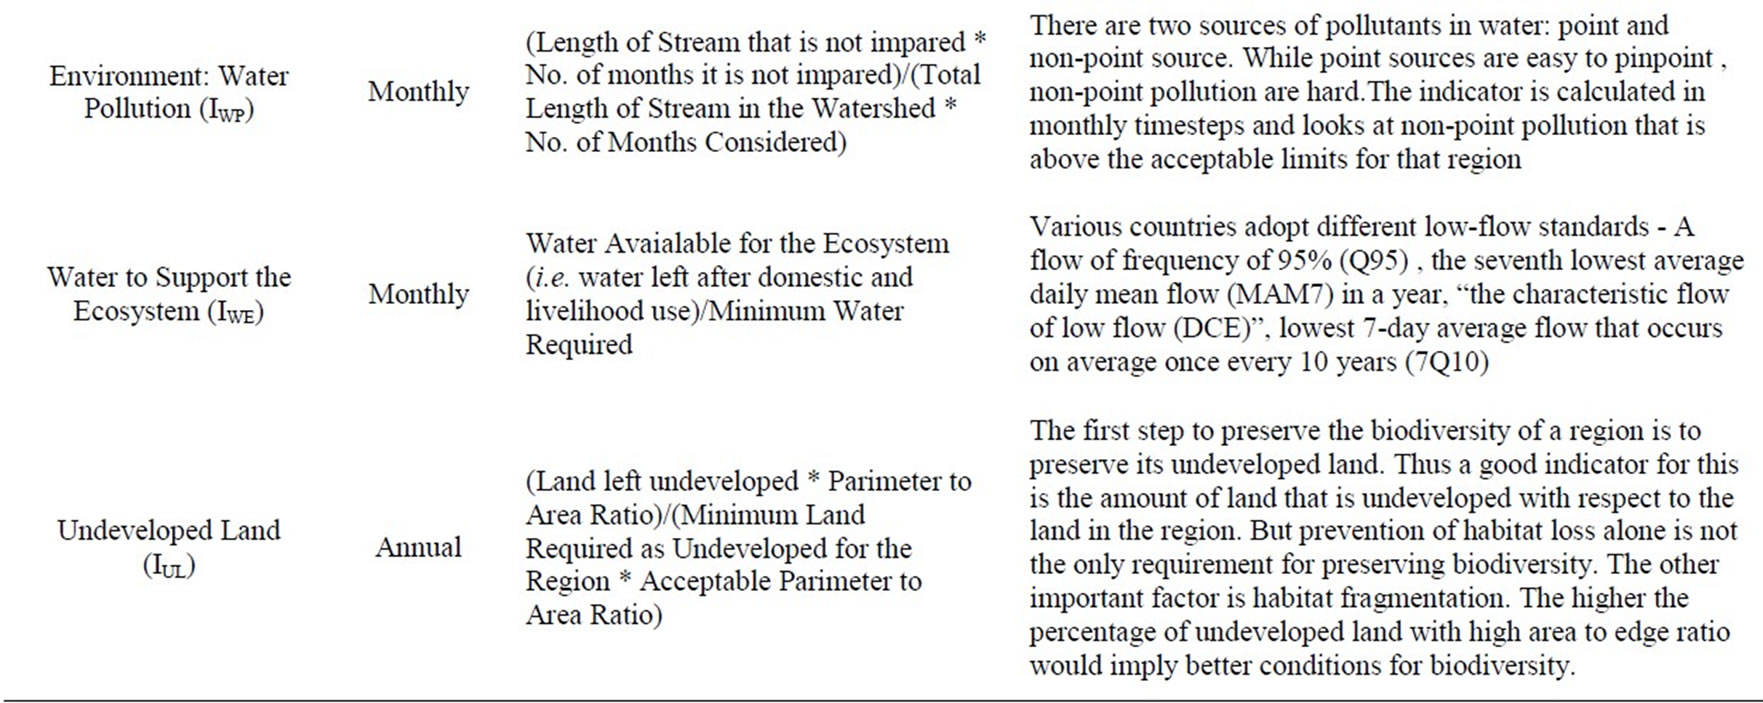
Table 1. Descriptions of indicators used in this study.
3.4. Measuring Sustainability by Using Reliability, Resilience and Vulnerability Concepts
To measure such ability of a watershed, reliability, resilience and vulnerability can be measured by methodology developed by Loucks and Gladwell [22]. Once the RBSI is plotted (as shown in Figure 2), an acceptable range needs to be decided for the watershed. This decision is subjective based on the local conditions of the region. The acceptable range could have both the upper and lower limit or it could just have upper limit or only lower limit. For example if both drought and flooding is a critical issue in a watershed, the acceptable range would have lower and upper limit but if drought only is the main concern, then the framework could have only the lower limit, i.e. anything under that is unacceptable. The reliability, resilience and vulnerability are calculated as follows:
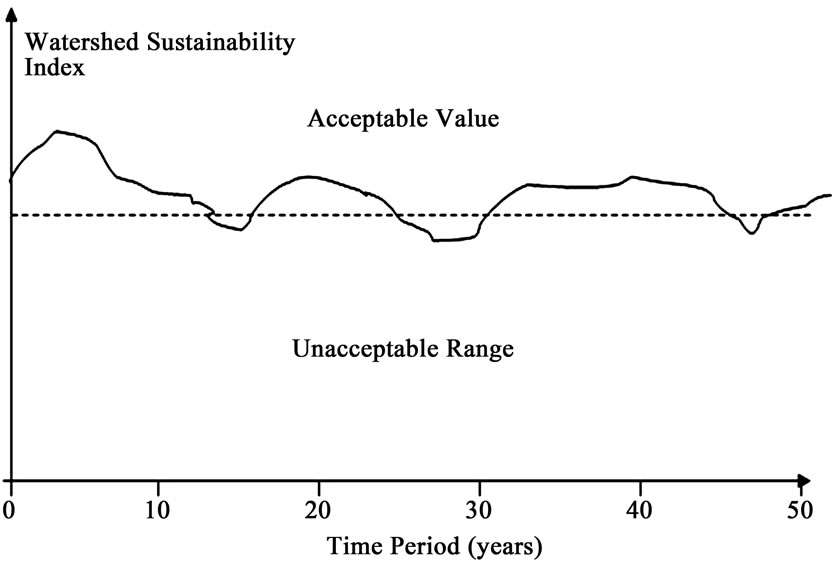
Figure 2. Watershed Sustainability Index (WSI) against time.


where 
and 
Thus Watershed Sustainability
where “Relative SVul” = Vulnerability/Maximum Vulnerability among all alternatives.
Relative SVul is subtracted from 1 to make it consistent with reliability and resilience.
4. Case Study
4.1. Description of the Watershed
The Inland Bays is an estuary located in Sussex County in southeastern Delaware. It is one of the four drainage basins in the state of Delaware, draining into Atlantic Ocean. It is approximately 51 kilometers in size and drains roughly 810 square kilometers of watershed. The Millsboro Pond sub watershed is representative of other sub-watersheds in the Inland Bays basin. The Millsboro Pond watershed is 8708 hectare (87 Km2) in area, out of which row crop agriculture occupies 41.8 percent, followed by 30.3 percent of deciduous forest cover and 11.5 percent of pasture land. The quality of the Inland Bays has been degraded over the years due to anthropogenic activities. The waters of the Inland Bays are rich in nutrients i.e. nitrates and phosphates. This nutrient enrichment can lead to eutrophication of the Bays. These conditions have been reported in the waters of Inland Bays as recently as 1998, 1999 and 2000 [27]. The nutrients entering the Bays are from various sources like agriculture, urban, wastewater and storm water. The watershed has also faced occasional droughts. The existing land use is highly fragmented. The current land use have about 45 percent of agriculture land, about 40 percent of forested land, roughly 9 percent of pasture land, 3 percent of water and wetland and rest is low residential development and other pervious land uses. This is a predominantly rural and agricultural watershed. According to the DNREC reports, 1256.7 kilograms (kg) of total nitrogen and 51.1 kg of total phosphorus are being added to the Bays daily.
4.2. Applying Framework to the Watershed
The prerequisite for applying the theoretical framework is to model a watershed as accurately as possible. The first step was to calibrate and validate the SWAT model. This was done as discussed in Sood and Ritter [28].
Two criteria that are critical to linking land use with water quantity/quality were considered to create land use scenarios. These are:
1) The recharge potential of the land: Andres [29], defines groundwater recharge as both the process and quantity of the precipitation that infiltrates through the unsaturated zone to the saturated zone.
2) The riparian zone along the water body: The vegetation in the riparian zones plays a critical role in the quality of water in the watershed.
Figure 3 shows the land use scenarios. The first (Case-1) is the existing land use (Figure 3(a)). The second scenario (Case-2) was created only on the basis of the recharge potential of the watershed (Figure 3(b)). Areas with high recharge potential should not only be left undeveloped, so that maximum water infiltrates, but it should also not be used for agriculture since it will cause high infiltration of nutrients (from fertilizers) into the groundwater system. For this research, a groundwater recharge map (and GIS data) provided by Delaware Geological Survey, University of Delaware [29] were used. The recharge potential of the watershed is classified as excellent, good, fair and poor. Thus keeping the percentage of types of land use the same, a hypothetical land use was created, with all the excellent, good, fair and poor recharge potential land being assigned to forest, pasture, agriculture, and development in that order. For the first land use scenario, no particular attention was paid to the riparian zones. Based on the second land use scenario, two more land use scenarios were created – one with 50 m riparian zone (Case-3) (Figure 3(c)) and the other with 200m riparian zone (Case-4) (Figure 3(d)). Changing proportions of land use type with in a watershed has economic implications, which is not being considered in this research.
 (a)
(a)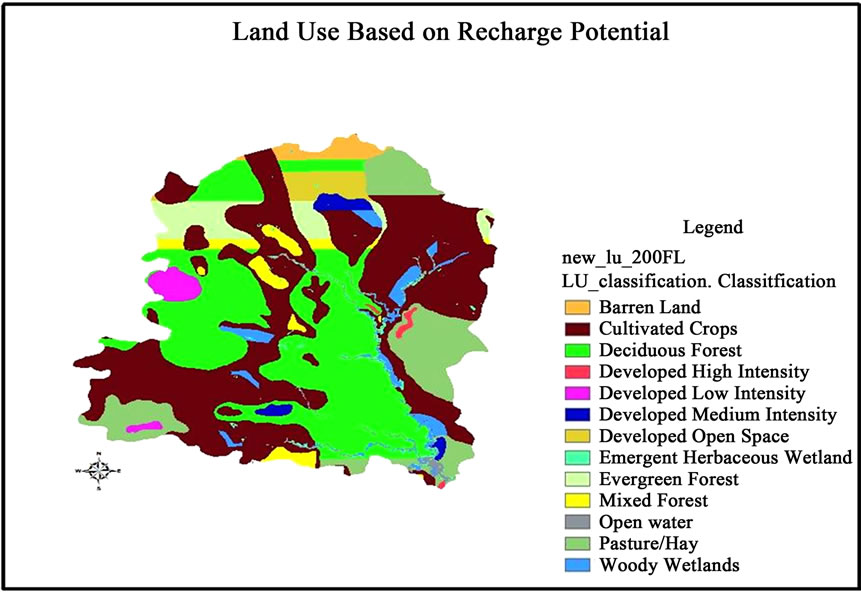 (b)
(b)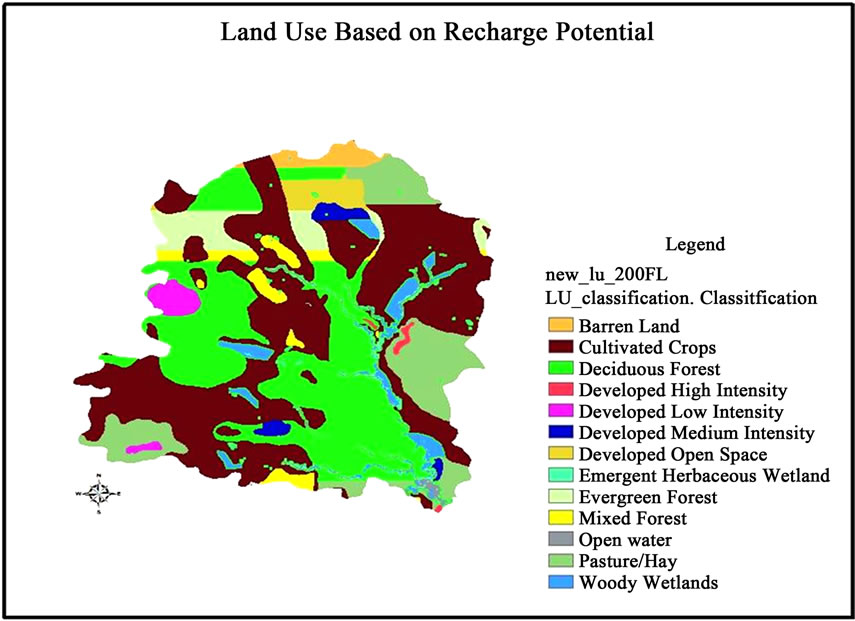 (c)
(c)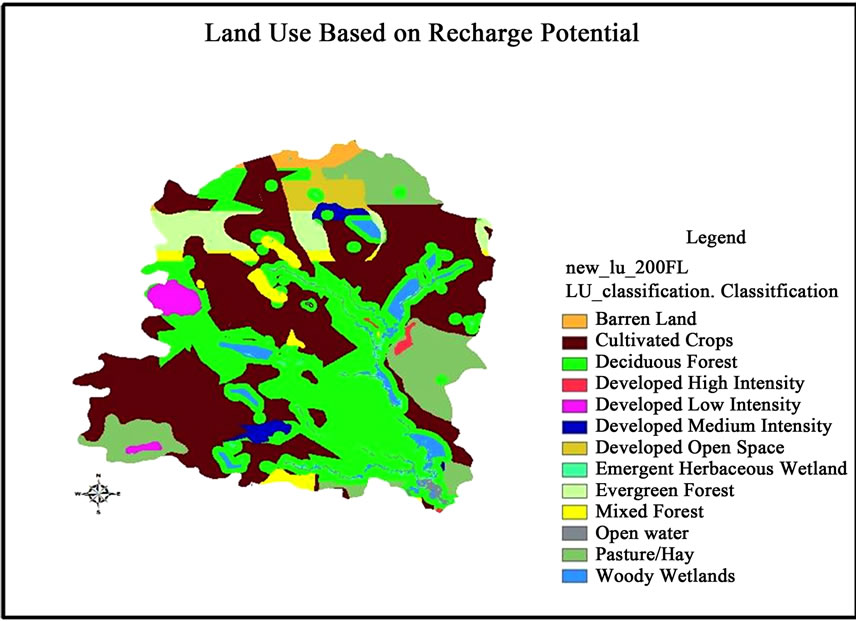 (d)
(d)
Figure 3. (a) Current land use—case 1. (b) land use based on recharge potential—case 2. (c) land use based on recharge potential and 50 m riparian zone—case 3. (d) land use based on recharge potential and 200 m riparian zone—case 4.
The calibrated SWAT model was the basis for the simulation of the new land use scenarios. The GIS data of the new scenarios were used to replace the old land use data. The model had to be reconfigured for each land use scenario. Because of this the calibrated values of the parameters were lost each time and had to be reassigned. The model was run with the different land use scenarios one at a time, with all the data collected and analyzed as discussed in the next section.
4.3. Indicators
The social, environmental and biodiversity indicators were calculated for 50 years. The total water available for human use and minimum stream flow was calculated as the sum of stream flow (which is made up of surface runoff and base flow) and deep aquifer percolation. It is safe to assume that the 100% of the percolation is available for human consumption because it is a renewable source and would not deplete the groundwater. The parameters used in calculating the indicators are shown in tables 2, 3 and 4.
After an extensive literature research, nothing substantive was found to suggest any specific combination of weightage. Weightage to environmental, social and biodiversity issues are region specific and is shaped by the priorities in a concerned region (or watershed) and how policymakers perceive the future threats. Since the priority of any region is availability of water, the direct use of water was given more weightage than other indicators. From a water use perspective, humans have been considered on par with other species. Thus the requirement for minimum flow for the ecosystem was given the same importance as water required for human consumption and livelihood. The greatest threat facing biodiversity is the dwindling undisturbed habitat. Pollution can be controlled by technological advances and energy demands of a watershed can be either managed better or energy can be imported from outside the watershed but there is no substitute for unaltered habitat. Thus biodiversity was given slightly more importance than pollution and energy requirements. In a scale of 100, domestic, livelihood and ecological water usage was given a weightage of 18 each, pollution and energy was given a weightage of 15 whereas biodiversity was given 16.
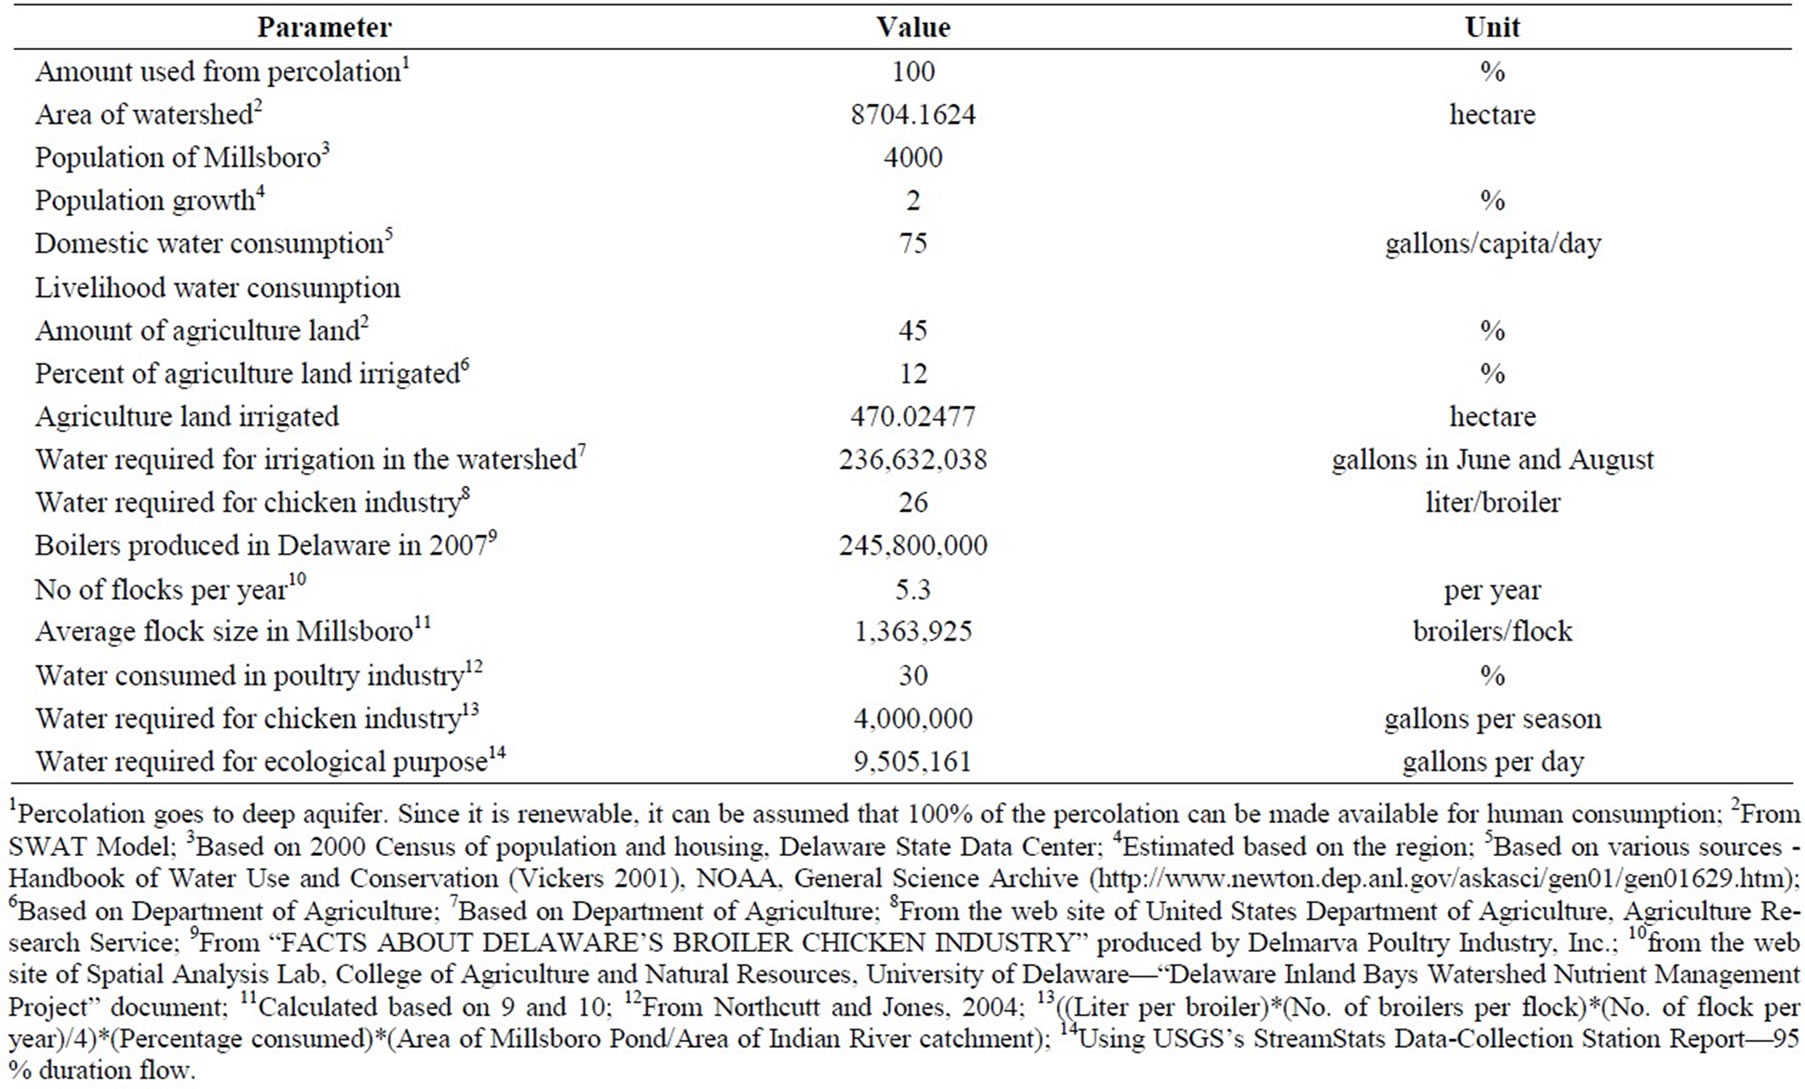
Table 2. Parameters used in calculating the hydrological indicator.
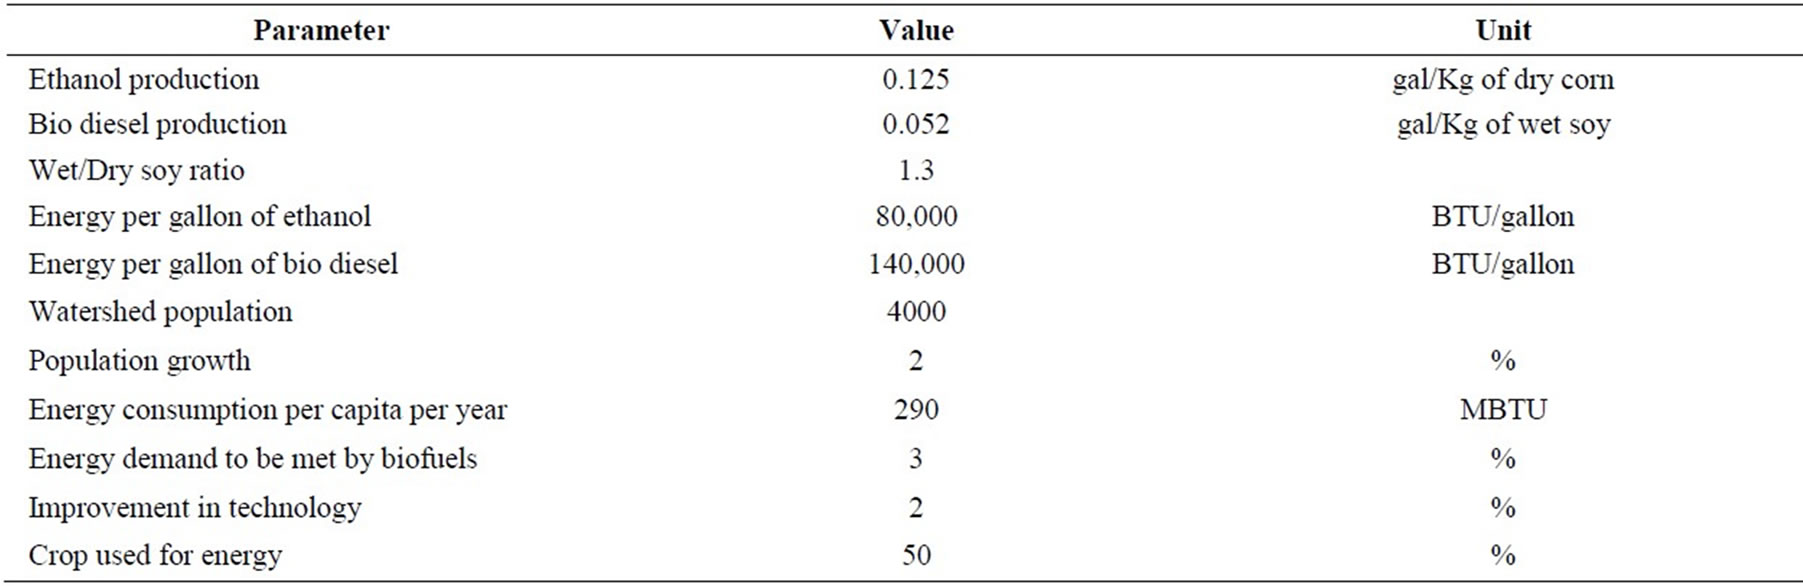
Table 3. Parameters used in calculating the energy indicators.
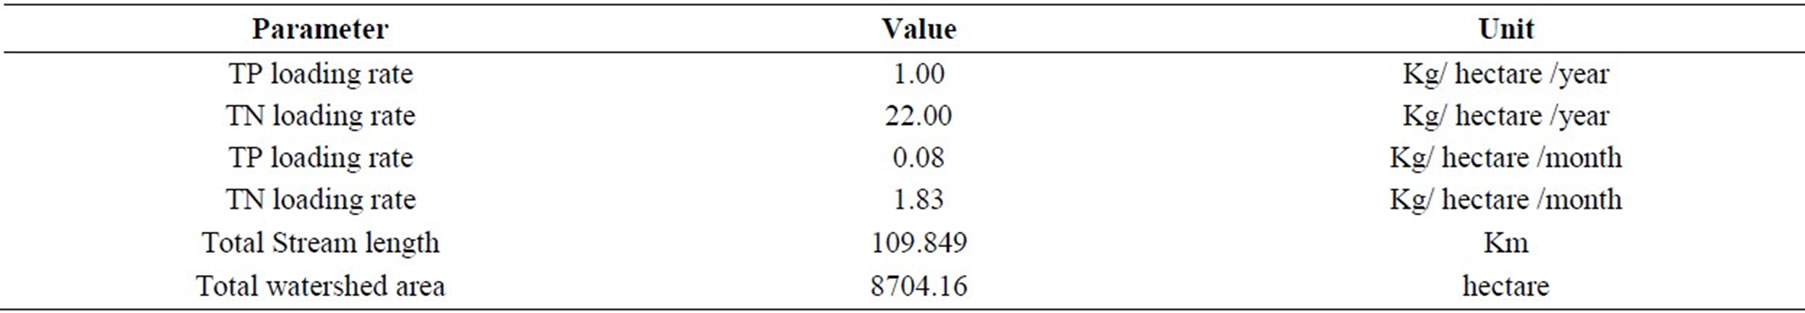
Table 4. Parameters used in calculating the environmental (pollution) indicator.
For domestic indicator, it was assumed that the domestic water consumption in the region is 282 liters (75 gallons) per capita per day. The population of the watershed was taken as 4000 with a growth rate of 2%. Based on these parameters, the domestic indicator was calculated for each month and then averaged over the year. After the demand for domestic water needs was met, the remaining water was grouped together at three months intervals to measure the seasonal demand of water for livelihood. For the Millsboro watershed, there are two major livelihoods, i.e. agriculture and the poultry industry. About 12% of the agricultural land in the watershed is irrigated from June and August at the rate of roughly 5 cm per week. In the poultry industry, roughly 98.4 litters (26 gallons) of water are used per broiler [30]. Approximately 5.3 flocks per year are produced and each flock contains 1,364,000 broilers in the watershed. Based on this, the livelihood water demand for the watershed was calculated on seasonal basis and the indicator calculated. The minimum stream flow was based on the stream flow statistics collected by USGS at their gauging station at the Millsboro Pond outlet at Millsboro, DE (Station number 01484525). A 90 percentile flow of 0.76 m3/sec was used as the minimum stream flow required from an ecological perspective.
For the energy indicator calculations, the per capita energy requirement of the population was taken as 306 × 109 joules per capita per year. The population in the watershed was taken as 4000 with a growth rate of 2%. It is assumed that only 3 percent of the total watershed energy demand will be met by bio fuels and 50% of biomass (i.e. corn and soybean) grown in the watershed will be used for energy. The yield (i.e. Kilograms per hectare) from the SWAT model was used as the biomass generated from the watershed. Also, it was assumed that due to technological innovation, the increase in production in the energy from the same amount of biomass will be at the rate of 2%. Since the land under agriculture was kept the same in all the scenarios, there was not much difference in the energy indicators for all the scenarios.
For the biodiversity indicator, GIS was used to calculate area and perimeter of the forested land in the watershed. The best case area to perimeter ratio was calculated by considering all the land area in the watershed as forested. This gave the value of the area to perimeter ratio as almost three times higher than the best case land use scenario.
5. Results and Analysis
5.1. Indicators
Figures 4-9 show the values of all the six indicators over the period of 50 years (i.e. from 2009 to 2059). There are three years (i.e. 2013, 2046, and 2058), where the domestic water demands is not met. These years probably indicate drought situation. The livelihood indicator is similar in the most of the scenarios except in 2052 and 2053, when land use case 2 performs the worst among all the scenarios. The indicator dips frequently in the first decade and then once and then towards the end of the simulation period. Looking at the figure closely, it is evident that although none of them meet the ecological water demand all the time in the year, case 3 and case 4 of the land use perform better than other cases most of the time. From the perspective of nutrients in the water system, the current land use fares the worst. Although case 2 performs better than case 1 most of the times, it is not very different from the current land use performance. That is understandable as the case 2 lacks a good riparian zone. Numerous studies have shown that the riparian zone land use has a substantial effect on the nutrient pollution in the water system. Land use case 3 and 4 perform much better than the other two scenarios, although
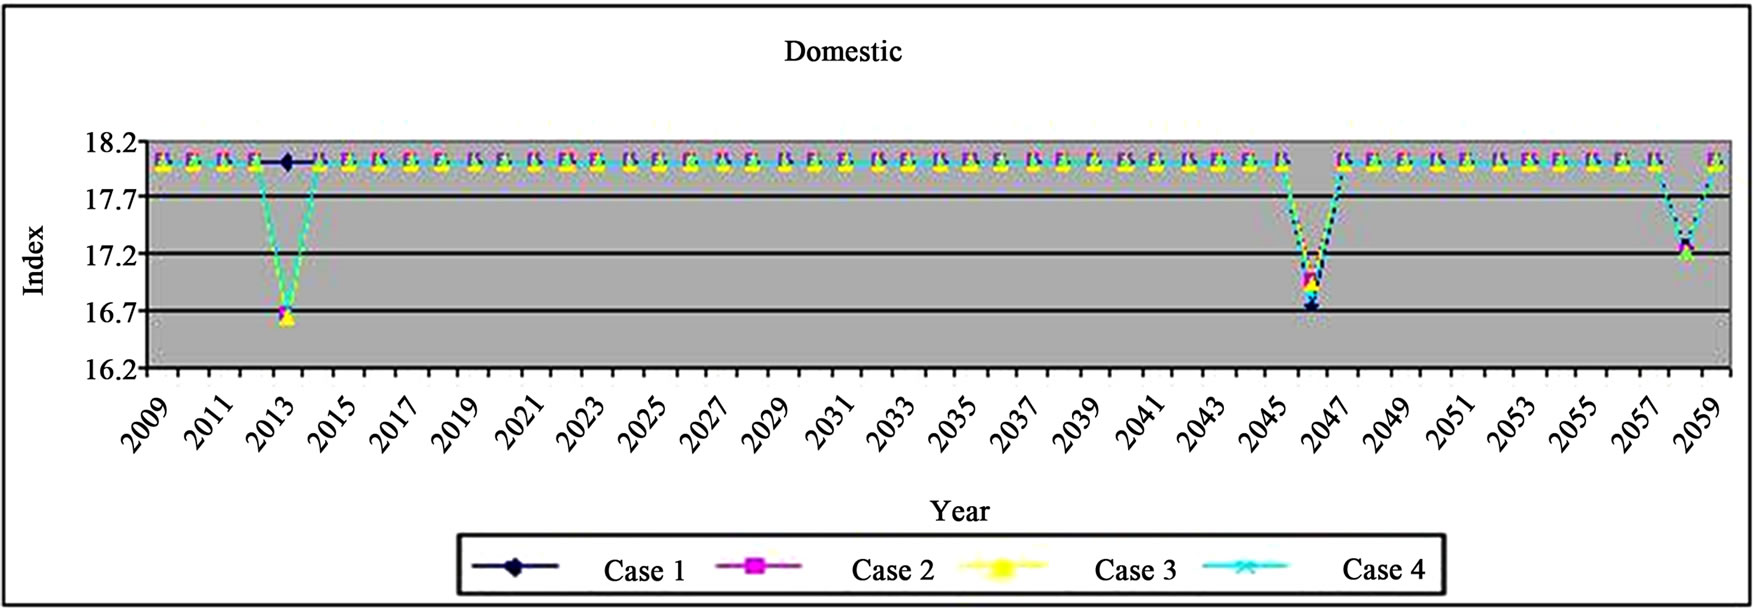
Figure 4. Plot of domestic indicator for the four land use cases.
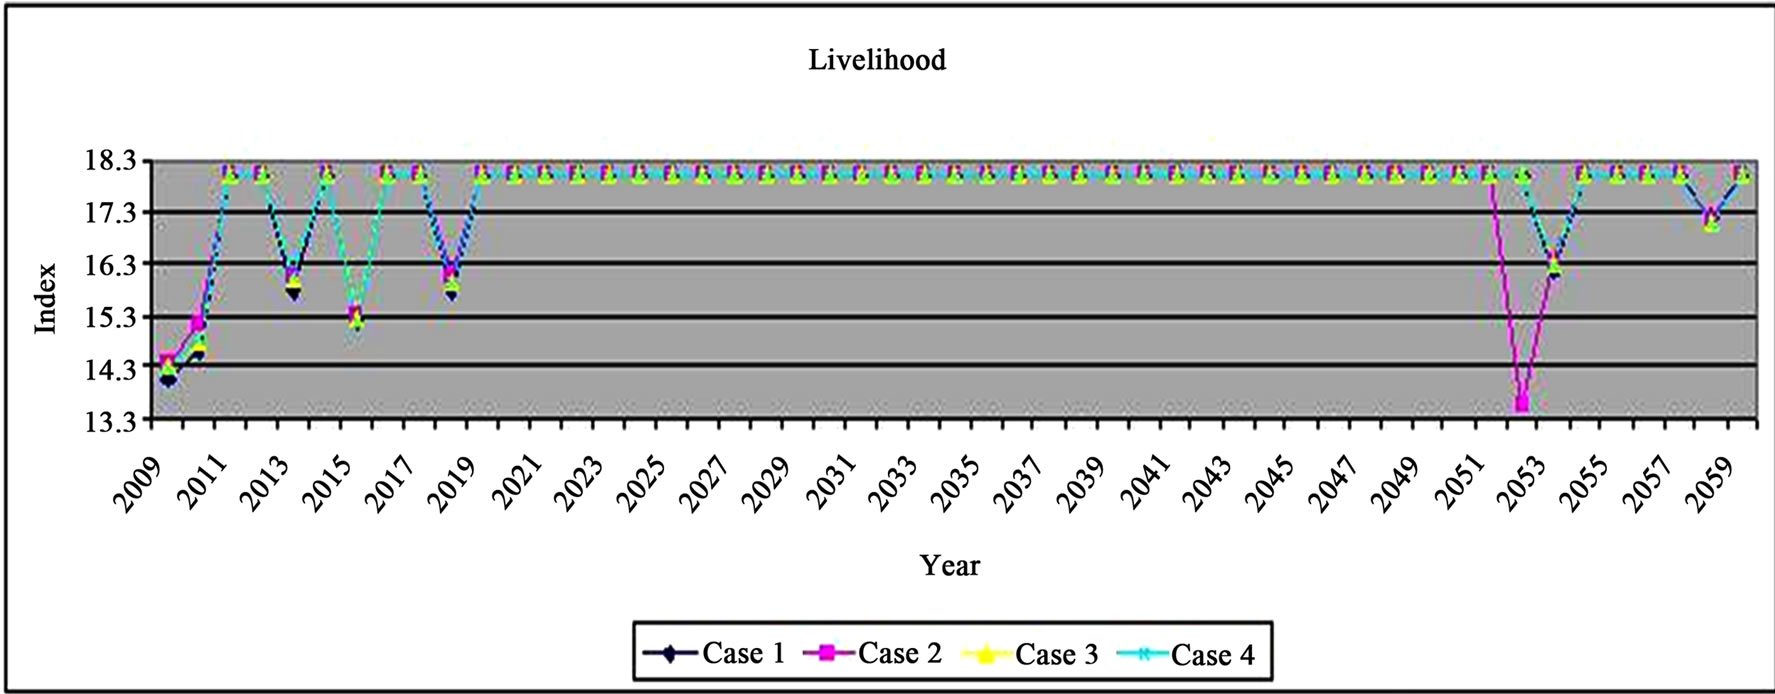
Figure 5. Plot of livelihood indicator over time (years) for the four cases of land use.

Figure 6. Plot of ecological indicator over time (years) for the four cases of land use.
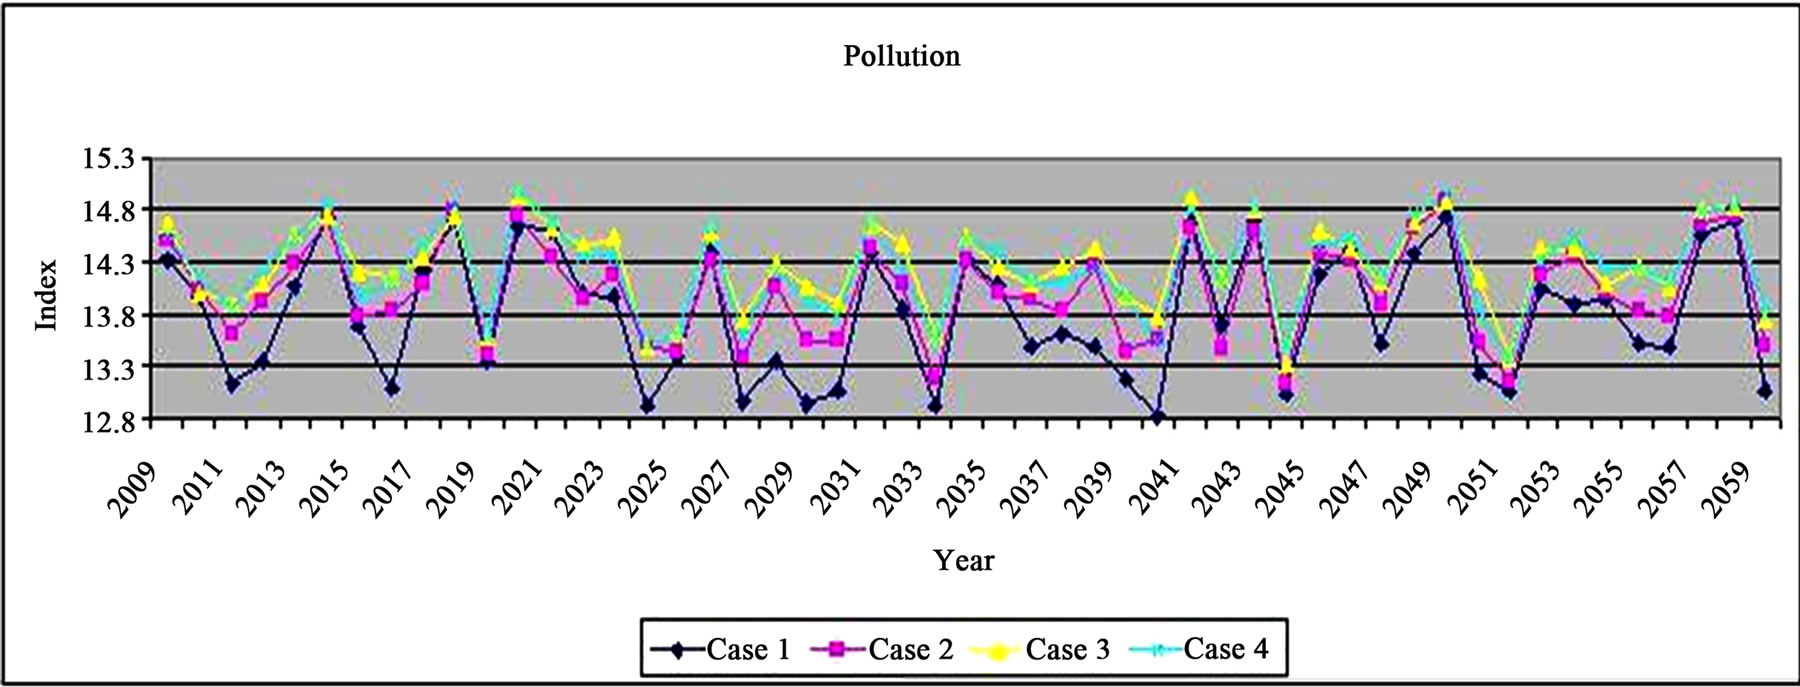
Figure 7. Plot of pollution indicator over time (years) for the four cases of land use.
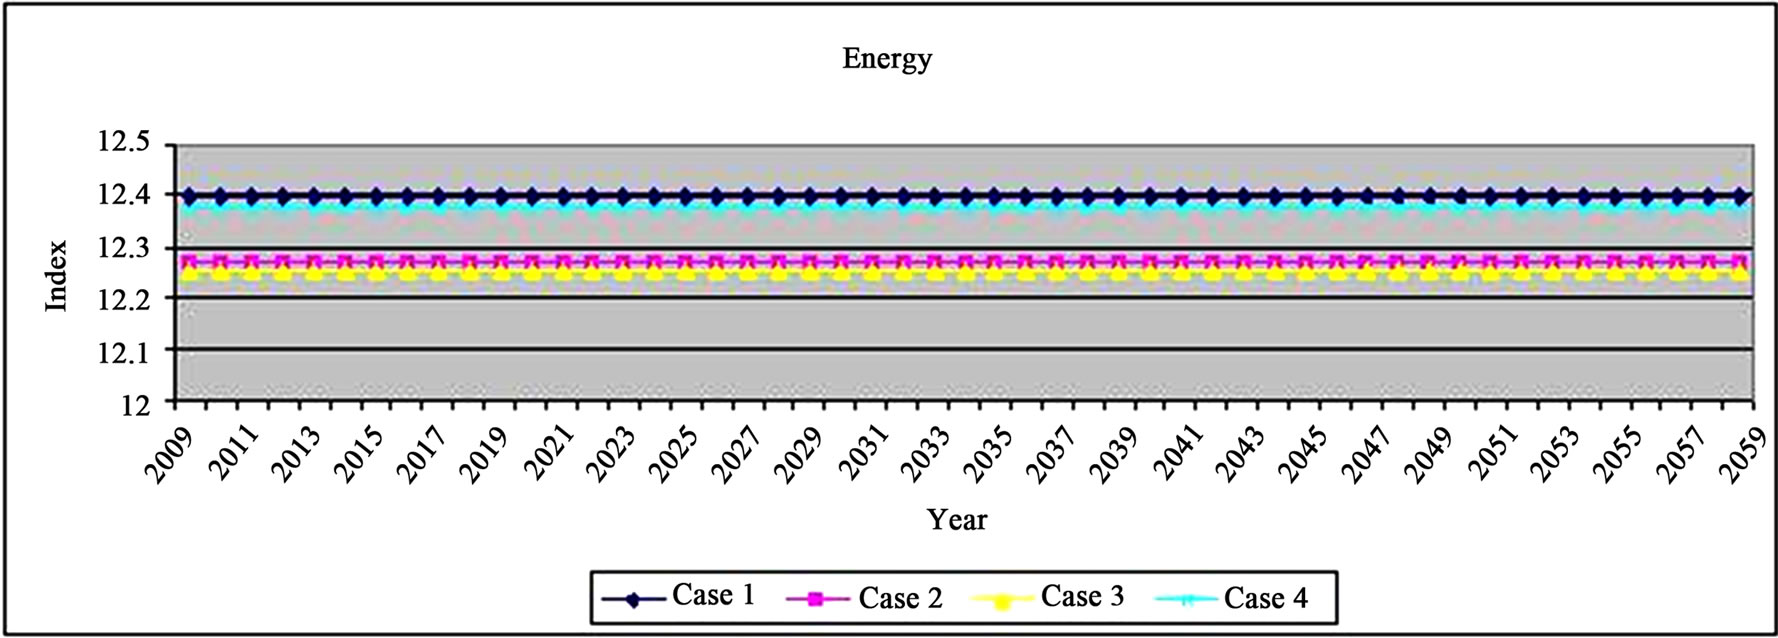
Figure 8. Plot of energy indicator over time (years) for the four cases of land use.
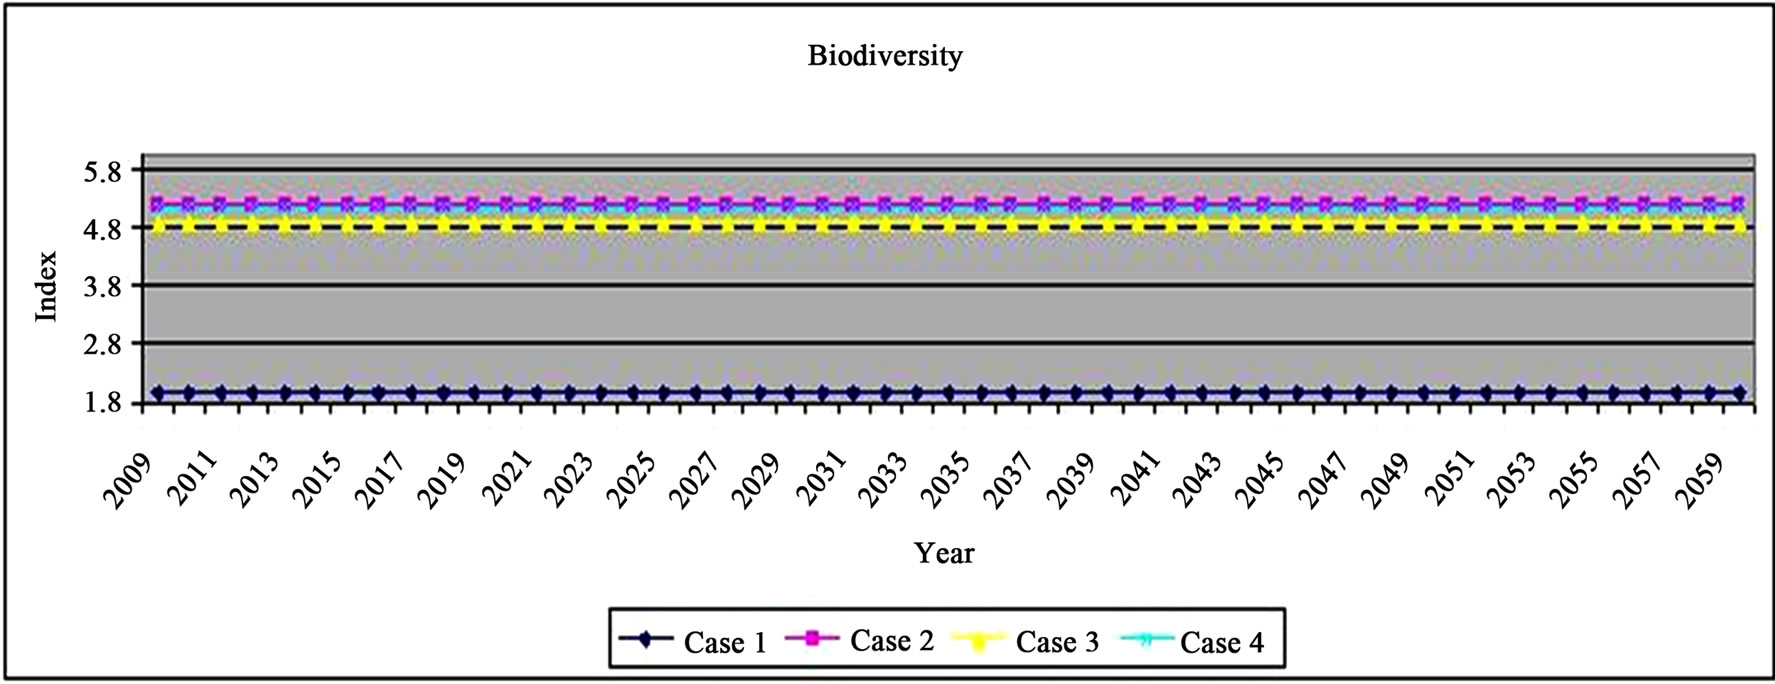
Figure 9. Plot of biodiversity indicator over time (years) for the four cases of land use.
the difference between them is not significant. This implies that there is not much difference in having a riparian zone 50 meter wide as compared to having a riparian zone 200 m wide for nutrient management. Thus it is clear that although a vegetative riparian zone in necessary to control the nutrients in the water way, but after a certain width, its effectiveness is reduced. The effectiveness of riparian zones in reducing nutrients is site specific, as it depends upon soil conditions, water table, type of vegetation etc. Thus to define an adequate riparian buffer width, each watershed needs to be modeled separately and appropriate riparian width defined. Land use cases 1 and 4 come up slightly higher than the other scenarios for energy indicator but as mentioned before, the difference is not significant. The current land use (case 1) is highly fragmented and as such had a very low area to perimeter ratio (roughly eight times less than the best case scenario). Among the four scenarios, case 2 has the highest value for the indicator.
5.2. Watershed Index
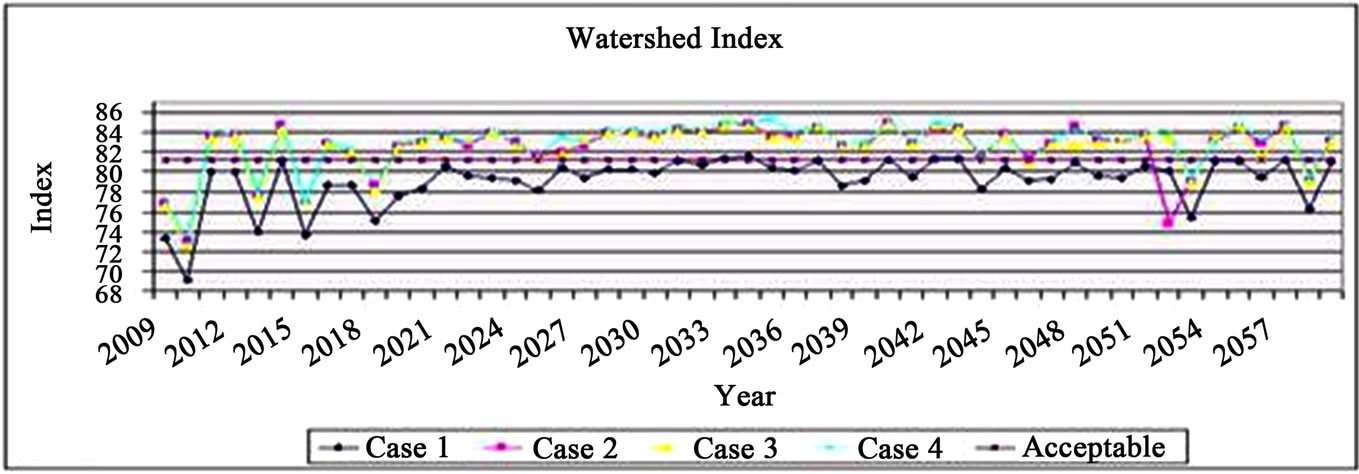
The watershed index was calculated by adding the weighted indicators for each of the land use scenarios. The indicators were then plotted against time (in years) for the next 50 years. The results are shown in Figure 10(a). On visual inspection, land use case 1 is much below the other scenarios and can be outright rejected. The majority of the difference is due to the biodiversity indicator. As discussed in the above section, the current land use, because of high fragmentation, fared badly with biodiversity indicator. That indicator outstrips (and hides) the significance of other indicators. Thus another graph was plotted without the biodiversity indicator (Figure 10(b)) and the watershed index compared. For the index without the biodiversity indicator, a different weightage, (Domestic—22, Livelihood—22, Ecological—22, Pollution—17, Energy—17) was used. The new weightage was used to keep the ratio between the various indicators the same. In this case, it can be seen that “as is” scenario is comparable to other scenarios and in fact sometimes performs better that the case 2 (without any riparian zones).
5.3. Watershed Sustainability
To calculate the watershed sustainability, the first step is to define the acceptable value for the indicator. The decision on acceptable values for the indicator is subjective and is based on practicality and best judgment. Full availability of water for domestic, livelihood and ecological purposes was considered necessary. Hence they were all assigned a value of 1. On the other hand, if the pollution level falls to 0.8 of the “no pollution” value, could be considered acceptable. For energy, 70 percent of demand met would be considered acceptable. For the biodiversity indicator, 30 percent of the best possible scenario was considered because it is necessary to maintain the agriculture land to forest land ratio (since changing that would impact the economy of the region and it is not being considered in this research). Considering that 45 percent of the watershed land is agriculture, it will be hard to achieve a high value for this indicator. An unachievable value will make the whole system unsustainable and hide the other influence of other indicators.
 (a)
(a)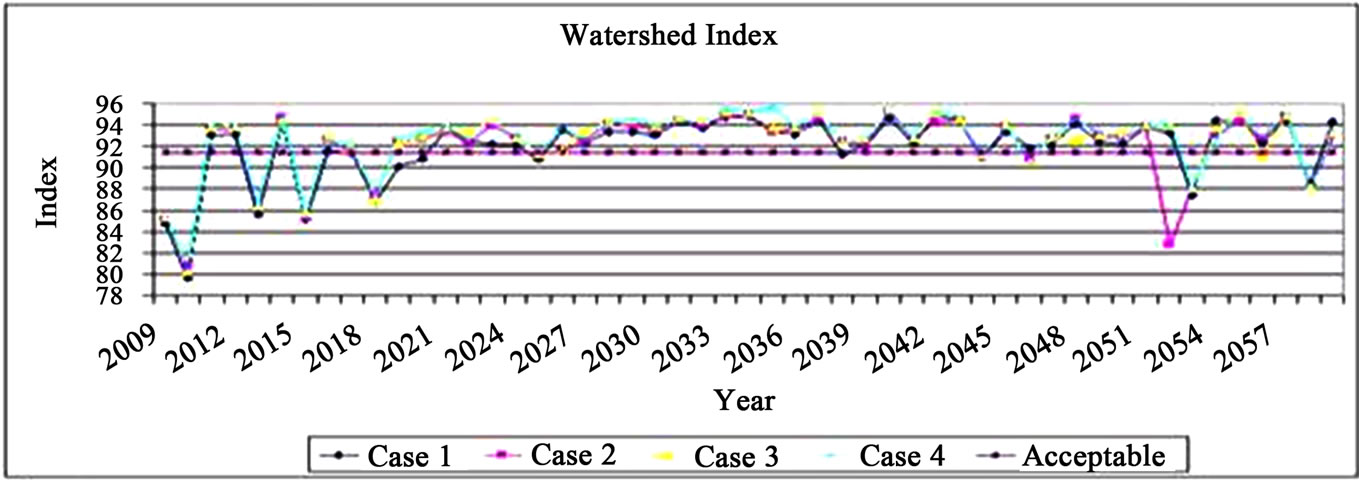 (b)
(b)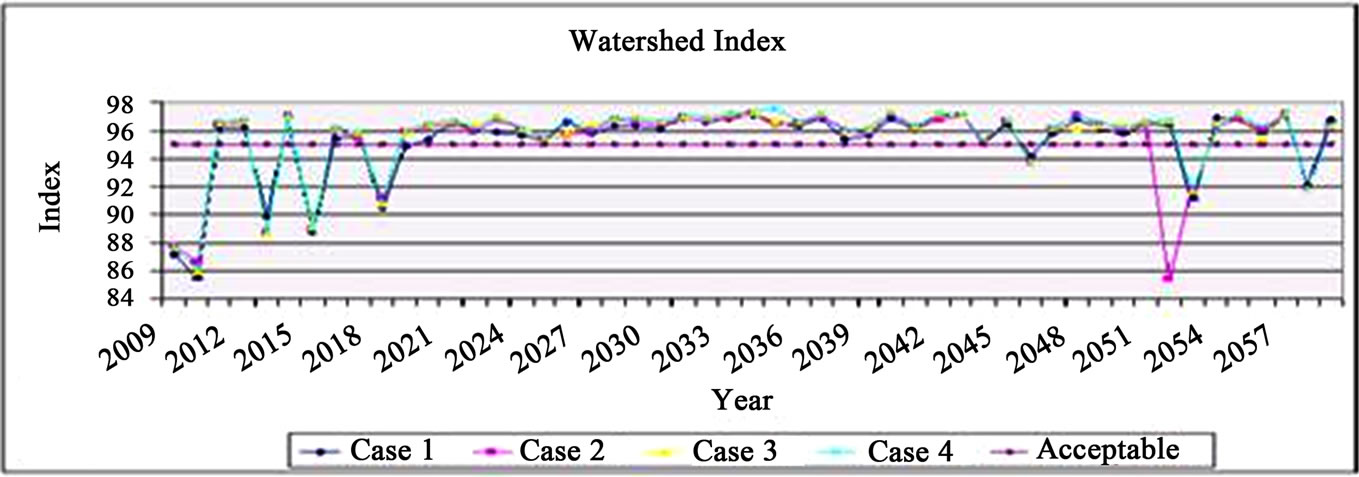 (c)
(c)
Figure 10. Watershed Index for the four land use scenarios plotted over 50 years (a) All indicators; (b) Without biodiversity indicator; (c) Without biodiversity indicator and weightage—Domestic—22, Livelihood—22, Ecological—22, Pollution—17, Energy—17.
Table 5 shows the results of the sustainability calculation for (a) all the indicators, (b) all indicators except the biodiversity indicator, and (c) all indicators (without biodiversity) and higher weightage to human use. In the first case, when all the indicators are considered, the current land use has the least reliability and resilience and very high vulnerability. This is because the current land use’s biodiversity indicator is very low. Land use case 3 and 4 are almost similar, with case 4 just outstripping case 3. These two scenarios are less vulnerable and a little more resilient than case 2.
When the biodiversity indicator is removed, it is seen, that in fact land use case 2 is worse off than the current land use scenario. The vulnerability for the case 2 is higher. This can be explained due to the lack of the good riparian buffer in the case 2. Thus, although it has the highest biodiversity indicator value, its pollution indicator is lower than the other scenarios. Without the biodiversity indicator, land use case 3 is the most sustainable alternative of the four scenarios. Thus, it is seen that providing large riparian buffer widths does not necessarily make the system better off. If biodiversity is ignored (i.e. zero weightage is given) and the ecological water needs, pollution and energy are given less importance (i.e. lesser weightage), the outcome is much different. The domestic water requirement and the livelihood water requirement were given a weightage of 35 whereas the other relevant indicators were given a weightage of 10. Table 5(c) shows the resilience, reliability, vulnerability and watershed sustainability for this new weightage scenario. In this case, the current land use scenario (case 1) is more sustainable than the other scenarios. Thus if biodiversity is ignored and other environmental and ecological issues are given less significance, the current land use works fine. In other words, the current land use is developed by keeping only anthropogenic requirements in mind and ignoring other ecological issues. Thus, it seems, the planning for existing land use, although meeting human needs, did not consider a holistic approach.
6. Discussion
The concept of reliability, resiliency and vulnerability has been applied previously to evaluate and select alternative design and operational policies for water resources projects [22,26,31,32]. But the scale of such an application has been restricted to a single project level. Also, there are not too many case studies using such a concept [26]. This research is an attempt to expand the scope of the concept of reliability, resiliency and vulnerability to the scale of watershed.
Most of the future global population growth is expected to take place in developing nations. Both, due to direct and indirect needs of increasing population and development, there is going to be extreme pressure on the limited land in these countries. This research shows that the location of development within a watershed is critical for sustainability of water resources and biodiversity. Along with how much land is converted to development, it is also necessary to consider where in the watershed that development is taking place. High recharge potential landuse should be either left in its natural state or used for the type of activities which require less impervious cover and have lesser scope of pollution
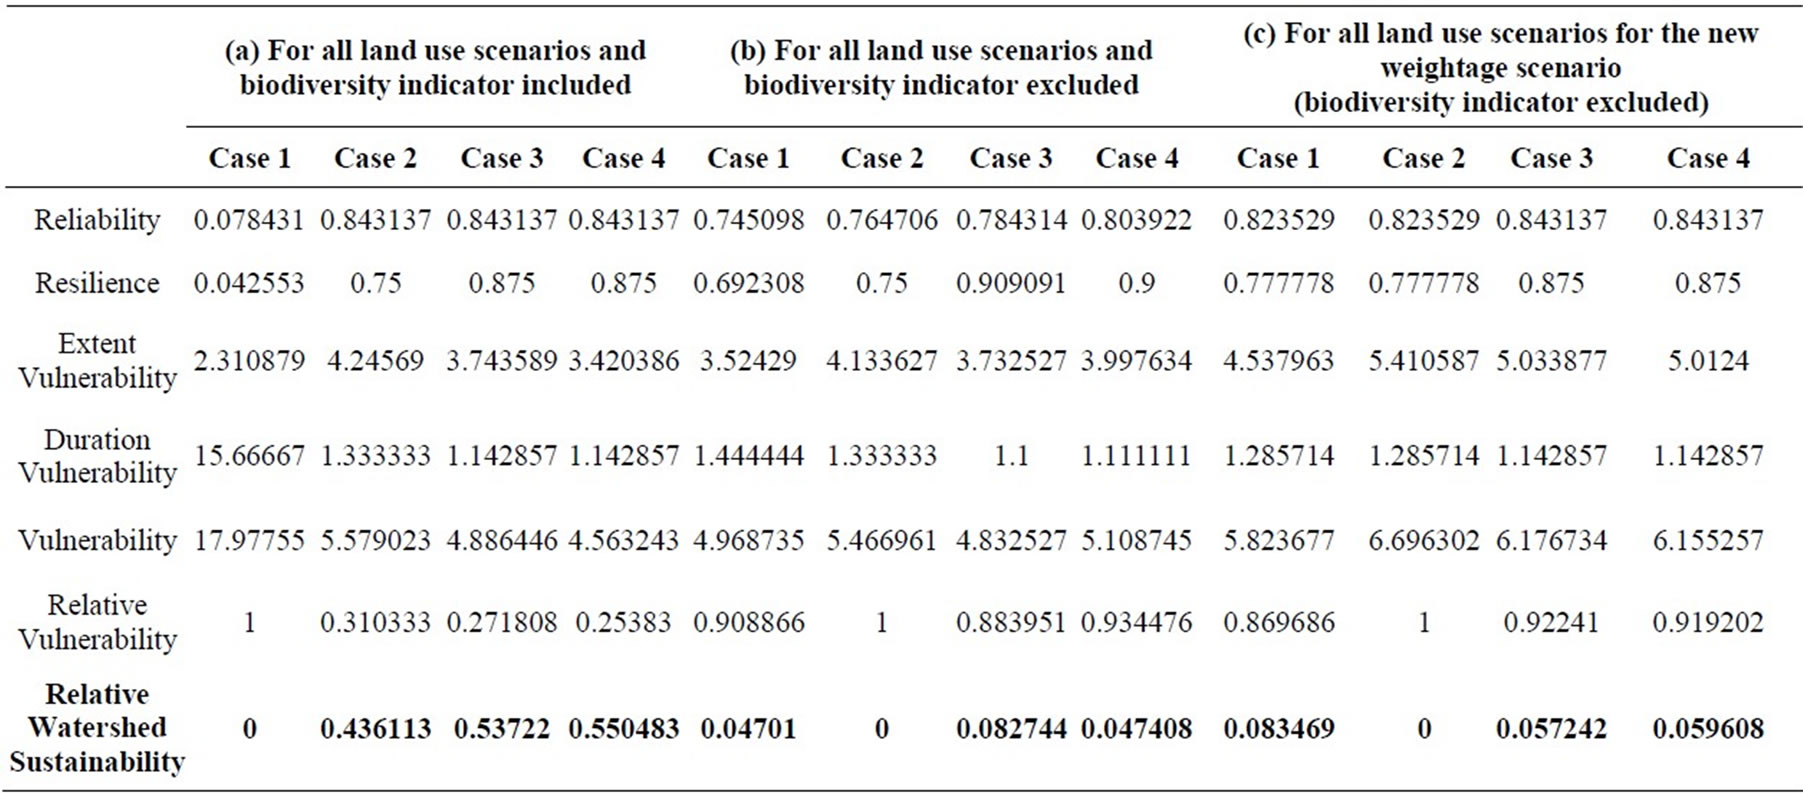
Table 5. Resilience, reliability, and vulnerability for (a) All indicators; (b) All indicators except biodiversity; (c) All indicators except biodiversity with more weightage to human requirements.
infiltration. Also, riparian zones play a critical role in reducing the sediments and nutrient load in the streams flowing out of the watershed. Thus there should be adequate buffer between agriculture landuse and stream system. Based on the climatic conditions, this framework simulates the renewable water available over a long period of timeframe. It also takes into consideration minimum land and water required for biodiversity. Thus, in a sense, this framework helps in defining the carrying capacity of a watershed.
Although the framework proposed in this research was implemented in the watershed of a developed nation, it can be applied with slight modifications to the watersheds of the developing nations. In the developing nations the line between forested and developed land is a little blurred. There are subsistence communities that depend on non-timber forest products (NTFP) for their daily needs and livelihoods. A separate category of land use needs to be created. Many communities have water storage structures as “commons ponds”, which have important significance in the social structure. The hydrological model needs to incorporate such ponds as they affect the water cycle in the watershed. These ponds would also play an important role in the supply side management of the water resources in the watershed.
The indicators to calculate the watershed sustainability could be created based on the critical issues of the watershed. Also the water needs and requirements in developing nations are different than those in the developed nations. So, although the indicators will stay the same, the acceptable values (denominators in the indicators used in this study) will change. Where excess water is an issue, for example in the floodplains and low lying areas, an upper limit, along with a lower limit needs to be considered for calculating reliability, resilience and vulnerability for the watershed. This framework could be used to identify the most effective adaptive measure, both in terms of its effectiveness and cost wise, to reduce the vulnerability of the watershed.
Some of the shortcomings of this framework are that the indicators used in this study are simplistic. Although the indicators cover the hydrological aspect well, they do not cover the social and biodiversity completely. Social issues and biodiversity are more complex than presented here and are outside the scope of this analysis. In a more detailed study, these aspects of landuse could be represented better by integrating other relevant models within this framework. Second, the land use scenarios in the case study were developed based on the recharge potential and riparian zones. Only four scenarios were created in this study. This limits the scope of land use possibilities. A more thorough study could include computer generated land uses linked to the model within the framework to generate the best land use after running hundreds of iterations. In deciding the land use scenarios, the computer program could use recharge potential, riparian zones, fragmentation in randomly creating land uses and/or any watershed specific parameter. Then the model could be run for these different land uses and a ranking given based on watershed sustainability calculated as defined in the framework. Then a subjective decision can be made by policy makers as to select the direction of future land use for the watershed. Third, although the SWAT model does a good job of hydrological analysis for surface runoff, root zone and channel flow, it does not include a detailed groundwater modeling that takes into consideration the coastal effect, large scale groundwater withdrawal and treated wastewater disposal using groundwater infiltration. Since groundwater is an important component of hydrological cycle and water use in the watershed, a dedicated model could be combined with the SWAT model for a better simulation and prediction of groundwater in the watershed. Forth, an important consideration in any watershed study is the scale of the watershed. A watershed can be as small as a catchment or as big as a river basin. Each scale would lead to a different outcome. The question is how to decide the appropriate scale of watershed to be considered for the study. If the watershed is too small, it will not be able to capture the holistic picture. If the watershed is too big, it would hide some of the local issues and not be as effective. Also a densely populated area like a big city will require much a bigger watershed to be sustainable within its boundaries. Thus watershed scale, which has not been an issue (because of low human population) in this study, needs to be incorporated in the framework.
Lastly, climate change has the potential to disrupt and modify hydrological regimes and thus affect watershed management. Along with land use scenarios, different climate change scenarios need to be considered. This research has not taken into consideration the future climate change scenarios, which has a potential to have a significant impact on the land use and water availability in the region.
7. Conclusions
This framework has many policy implications. Foremost, it provides a tool to policy makers, land use planners, zoning officials, watershed managers to look at land use in a holistic way. Currently, most of the planning is done using political boundaries. Thus land use is planned on the basis of local requirements within a district or a municipality boundary, without considering its impact on the larger “eco system” or the river basin. No consideration is given to population living outside the political boundary. In some instances, this leads to conflict between people. If the demand for the water is looked-upon at the watershed scale, such conflicts can be avoided. Since this framework takes into account the water requirement for the ecosystem, it also helps in reducing the conflicts with respect to water, between people and environment. The land use planning will become even more critical with the popularity of bio fuels and need for more land under cultivation. The greatest threat to biodiversity is the fragmentation of pristine land and interference due to human activity. Using recharge potential as a guiding principle for land use planning has two advantages—one, since the high recharge potential areas are left free of human development; it helps in recharging the groundwater faster. Also, infiltrating water is less polluted due to lack of human activities in these areas; second—since, recharge potential is based on soil properties and since soils with similar properties are grouped together, it is easier to plan with less fragmentation. Some of the limitations of this research, as mentioned in the section above, can be addressed in the future research. The biodiversity indicator needs to be further developed to better depict the biodiversity issues of a region. Also, an economic indicator can be added to the existing indicators to represent the social sustainability better. With the inclusion of an economic indicator, scenarios with less water intensive industries to replace agriculture (water intensive) land use could be played out and its affect analyzed with respect to sustainability, especially in the watersheds with high water scarcity.
REFERENCES
- WCED (World Commission on Environment and Development), “Our Common Future,” Oxford University Press, Oxford, 1987.
- C. Tortajada, “Sustainable Development: A Critical Assessment of Past and Present Views,” In: A. K. Biswas and C. Tortajada, Eds., Appraising Sustainable Development: Water Management and Environmental Challenges, Oxford University Press, Oxford, 2005.
- R. Goodland, “The Concept of Environmental Sustainability,” Annual Review of Ecology and Systemetics, Vol. 26, 1995, pp. 1-24. doi:10.1146/annurev.es.26.110195.000245
- R. Goodland and D. Herman, “Environmental Sustainability: Universal and Non-Negotiable,” Ecological Applications, Vol. 6, no. 4, 1996, pp. 1002-1017. doi:10.2307/2269583
- D. Satterthwaite, “Sustainable Cities or Cities That Contribute to Sustainable Development?” Urban Studies, Vol. 34, no. 10, 1997, pp. 1667-1691. doi:10.1080/0042098975394
- G. McGranahan and D. Satterthwaite, “Urban Centers: An Assessment of Sustainability,” Annual Review of Environment and Resources, Vol. 28, 2003, pp. 243-274. doi:10.1146/annurev.energy.28.050302.105541
- M. Wackernagel and W. Rees, “Our Ecological Footprint, Reducing Human Impact on the Earth,” New Society Publishers, Gabriola Island, 1996.
- D. R. Van Vliet, “Sustainable Subdivision Planning and Design: Analysis, Literature Review and Annotated Bibliography,” In Issues in Urban Sustainability: Institute of Urban Studies, University of Winnipeg, Winnipeg, 1994.
- N. H. Afgan, “Sustainability Concept for Energy, Water and Environment Systems,” In: Bogdan and Duic, Eds., Sustainable Energy Technologies, Swets and Zeitlinger B.V., Lisse, 2004.
- R. Kranz, S. P. Gasteyer, H. Theodore, R. Shafer and A. Steinman, “Conceptual Foundations for the Sustainable Water Resources Roundtable. Universal Council on Water Resources,” Water Resources Update, no. 127, 2004, pp. 11-19.
- R. Shah, “International Frameworks of Environmental Statistics and Indicators,” Inception Workshop on the Institutional Strengthening and Collection of Environment Statistics, 25-28 April 2000, Samarkand.
- H. T. Heintz Jr., “Conceptual Foundations for the Sustainable Water Resources Roundtable,” Water Resources Impact, Vol. 8, no. 4, 2006, pp. 7-10.
- E. T. Smith and H. X. Zhang, “Overview/Introduction: Developing Indicators for the Sustainable Water Resources Roundtable,” Water Resources Impact, Vol. 8, no. 4, 2006, pp. 3-6.
- P. M. Barlow, W. M. Alley and D. N. Myers, “Hydrological Aspects of Water Sustainability and Their Relation to a National Assessment of Water Availability and Use,” Water Resource Update, Vol. 127, No. 1, 2004, pp. 76-86.
- P. H. Gleick, “Water in Crisis: Paths to Sustainable Water Use,” Ecological Applications, Vol. 8, no. 3, 1998, pp. 571-579. doi:10.1890/1051-0761(1998)008[0571:WICPTS]2.0.CO;2
- H. M. L. Chaves and S. Alipaz, “An Integrated Indicator for Basin Hydrology, Environment, Life, and Policy: The Watershed Sustainability Index,” Water Resources Management, Vol. 21, No. 5, 2007, pp. 883-895. doi:10.1007/s11269-006-9107-2
- C. Santhi, R. Srinivasan, J. G. Arnold and J. R. Williams, “A Modeling Approach to Evaluate the Impacts of Water Quality Management Plans Implemented in a Watershed in Texas,” Environmental Modelling & Software, Vol. 21, No. 8, 2006, pp. 1141-1157. doi:10.1016/j.envsoft.2005.05.013
- S. L. Neitsch, J. G. Arnold, J. R. Kiniry, J. R. Williams and K. W. King, “Soil and Water Assessment Tool Theoretical Documentation, Version 2000,” Grassland, Soil and Water Research Laboratory, Blackland Research Center, Temple, 2002.
- P. W. Gassman, M. R. Reyes, C. H. Green and J. G. Arnold, “The Soil and Water Assessment Tool: Historical Development, Applications, and Future Research Directions,” American Society of Agricultural and Biological Engineers, Vol. 50, No. 4, pp. 1211-1250.
- R. D. Harmel, C. W. Richardson and K. W. King, “Hydrologic Response of a Small Watershed Model to Generated Precipitation,” Transactions of the ASABE, Vol. 43, No. 6, 2000, pp. 1483-1488.
- T. W. R. Wallis and J. F. Griffiths, “An Assessment of the Weather Generator (WXGEN) Used in the Erosion/ Productivity Impact Calculator,” Agricultural and Forest Meteorology, Vol. 73, No. 1-2, 1995, pp. 115-133. doi:10.1016/0168-1923(94)02172-G
- P. D. Loucks and J. S. Gladwell, “International Hydrology Series—Sustainability Criteria for Water Resource Systems,” Cambridge University Press, Cambridge, 1999.
- L. H. Gunderson, “Ecological Resilience—In Theory and Application,” Annual Review of Ecology and Systematics, Vol. 31, 2000, pp. 425-439. doi:10.1146/annurev.ecolsys.31.1.425
- R. J. T. Klein, M. J. Smit, H. Goosen and C. H. Hulsbergen, “Resilience and Vulnerability: Coastal Dynamics or Dutch Dikes?” The Geographical Journal, Vol. 164, No. 3, 1998, pp. 259-268. doi:10.2307/3060615
- K. Fara, “How Natural Are ‘Natural Disasters’? Vulnerability to Drought of Communal Farmers in Southern Namibia,” Risk Management, Vol. 3, No. 3. 2001, pp. 47-63. doi:10.1057/palgrave.rm.8240093
- T. R. Kjeldsen and D. Rosbjerg, “Assessment of the Sustainability of a Water Resources System Expansion,” Integrated Water Resources Management, Vol. 272, 2001, pp. 151-156.
- DNREC, “Inland Bays/Atlantic Ocean Basin,” Delaware Department of Natural Resources and Environmental Control, Dover, 2001.
- A. Sood and W. F. Ritter, “Evaluation of Best Management Practices in Millsboro Pond Watershed Using Soil and Water Assessment Tool (SWAT) Model,” Journal of Water Resource and Protection, Vol. 2, No. 5, 2010, pp. 403-412. doi:10.4236/jwarp.2010.25047
- A. S. Andres, “Ground-Water Recharge Potential Mapping in Kent and Sussex Counties, Delaware,” Delaware Geological Survey, Report of Investigations No. 66, University of Delaware, Newark, 2004.
- J. K. Northcutt and D. R. Jones, “A Survey of Water Use and Common Industry Practices in Commercial Broiler Processing Facilities,” Journal of Applied Poultry Research, Vol. 13, No. 1, 2004, pp. 48-54.
- T. Hashimoto, J. R. Stedinger and D. P. Loucks, “Reliability, Resiliency, and Vulnerability Criteria for Water Resource System Performance Evaluation,” Water Resources Research, Vol. 18, No. 1, 1982, pp. 14-20. doi:10.1029/WR018i001p00014
- S. K. Jain and P. K. Bhunya, “Reliability, Resilience and Vulnerability of a Multipurpose Storage Reservoir,” Hydrological Sciences Journal, Vol. 53, No. 2, 2008, pp. 434-447. doi:10.1623/hysj.53.2.434