Journal of Biomedical Science and Engineering
Vol.6 No.3(2013), Article ID:28642,5 pages DOI:10.4236/jbise.2013.63031
Accurate preterm labor diagnosis using a CD55-TLR4 combination biomarker model
![]()
1Microarray & Bioinformatics Core, Department of Microbiology and Immunology, Meharry Medical College, Nashville, USA
2Department of Computer Science, Michigan Technological University, Houghton, USA
3Department of Obstetrics & Gynecology, Meharry Medical College, Nashville, USA
Email: #bnowicki@mmc.edu
Received 11 January 2013; revised 14 February 2013; accepted 27 February 2013
Keywords: Preterm Labor (PTL); CD55; Decay Accelerating Factor (DAF); Toll-Like Receptor 4 (TLR4)
ABSTRACT
We previously demonstrated immune activation in the maternal peripheral circulation associated with preterm labor (PTL). There was an elevation in WBC mRNA of anti-inflammatory complement decay-accelerating factor (CD55) and the innate-immune response activating toll-like receptor 4 (TLR4). These findings suggested that collectively, these two molecules might serve as useful biomolecules to aid in the diagnosis of PTL. In this study, we used a combined marker approach to determine whether a dual marker model utilizing both CD55 and TLR4 mRNA levels to classify PTL would increase diagnostic accuracy compared to either molecule alone. Two methods were evaluated; a linear discriminant (LD) method and a distribution free (DF) method, in order to find the optimal linear combination of TLR4 and CD55 data to diagnose PTL accurately. Our results indicated that a combined CD55-TLR4 dual marker model could provide statistically significant improvements compared to CD55 or TLR4 single marker models for PTL classification performance.
1. INTRODUCTION
Preterm labor (PTL) is a leading cause of feto-maternal morbidity and mortality worldwide and affects approximately 12% of pregnant women in the US [1]. The medical cost for management of premature infants in the first year of life exceeds $8 billion annually [2]. Research has resulted in a clear improvement in the medical management of premature neonates, however the rate of preterm delivery has not decreased over the past several decades [3]. Instead it appears to be gradually increasing in the United States [1,4]. Subclinical infections of the genital and urinary tracts have been implicated in 40% - 70% of all PTL cases [5,6].
It is currently postulated that an inflammatory response in the feto-maternal unit leads to increased levels of pro-inflammatory factors including interleukins, tumor necrosis factor-α, and prostaglandins which initiate uterine contractility and the PTL cascade [1,7-10]. The above signaling pathways represent the later stages of PTL and have been intensively investigated. However, the cascade(s) of early signaling steps including proinflammatory toll-like receptor 4 (TLR4) and anti-inflammatory CD55 (also known as complement DecayAccelerating Factor, DAF) are not well characterized and require further study.
We previously proposed that PTL cascades that occur in the feto-maternal unit may result in activation of the maternal immune system and therefore activation of white cells in maternal peripheral blood. We reported that mRNA levels of CD55 and TLR4 were significantly higher in women who exhibited clinically diagnosed PTL. Specifically, CD55 mRNA expression was increased nearly 1.5 fold in the peripheral WBCs of subjects with PTL compared with control pregnant woman. Using the lower 95% confidence interval of the mean mRNA expression in PTL subjects as a threshold to define “elevated”, we found that 71% of PTL patients expressed elevated CD55 mRNA levels compared to only 6.7% of control subjects [11]. Further, 25/41 (60.9%) of PTL patients expressed elevated TLR4 mRNA as compared to 0/41 (0%) in control subjects.
At the protein level, patients with PTL also exhibited increased levels of CD14+ maternal blood monocytes, each bearing enhanced expression of TLR4 receptors, indicating that the peripheral circulatory system was activated in patients with PTL. TLR4+/CD14+ monocytes were 2.3 times more frequent (70% vs. 30%) and TLR4 receptor density was 2.6-fold higher in PTL women compared to pregnant controls (750 vs. 280 molecules per cell, respectively) [12]. Interestingly, the TLR4 receptor levels in the granulocyte fractions in PTL and pregnant control women were similar and there was no difference in the levels of TLR4 in patients at term.
An elevation of WBC TLR4 and CD55 mRNA in PTL suggests that these two molecules may serve as biomarkers for the diagnosis of PTL. In this study, we use a combined marker approach to determine if using CD55 and TLR4 mRNA levels as markers for PTL would increase the accuracy of classification versus either marker alone. Our results indicated that a combined dual marker approach can have statistically significant improvements for PTL diagnostic accuracy versus a single marker model.
2. MATERIALS AND METHODS
2.1. Patient Recruitment
The study was approved by the IRB Human Research Committee and written informed consent was obtained from all enrollees. A case was defined as a pregnant woman who presented at the labor and delivery ward and was diagnosed by a physician as exhibiting idiopathic PTL. The clinical criteria for PTL were those used by the American College of Obstetricians and included regular contractions, cervical dilation of 2 cm and/or cervical effacement. Exclusion criteria included maternal illness, anemia, uterine malformations, placental abruption, placenta previa, and steroid use. Women diagnosed with a urinary tract infection (UTI), bacterial vaginosis (BV) or chorioamnionitis were also excluded from the study as were women with idiopathic PTL who developed a clinical infection during their stay in labor and delivery. Additional exclusion criteria include patients who exhibited recurrent PTL, patients with a high risk of PTL, and patients who admitted to using drugs. Pregnant control patients were evaluated in a similar fashion during a prenatal clinical visit and presented at the same hospital. Both case and control populations were 18 years old or older. Neither cases nor controls were offered financial compensation for participation in the study.
2.2. Sample Size and Power Analysis
In order to estimate the required sample size to achieve statistical significance, a priori power analysis was conducted with G*Power software version 3.0, using a twotailed t-test with an alpha error probability of 0.05 and an effect size of 0.5 [13]. The results were that 26 patients (13 cases and 13 controls) would be required to achieve 80% power; 42 patients (21 cases and 21 controls) would be required in order to achieve 95% power. The actual study population, however, consisted of 62 pregnant women. The number of women with PTL (as defined in the section 2.1) was N = 34; the number of control pregnant women was N = 28. Demographic analysis showed no significant differences between the PTL and control populations in terms of race, median age, parity, or smoking status.
2.3. mRNA Isolation and Quantitation
A single/peripheral venous blood (5 mL) sample was drawn into heparinized vacutainers from each case prior to treatment of PTL and from controls during a scheduled prenatal clinic visit. White blood cells were separated from erythrocytes by dextran sedimentation and pelleted by centrifugation and total RNA isolated using Tri-Reagent (Sigma, St. Louis, Mo). The isolated RNA was quantified by optical density readings at 260 nm, and the purity was estimated by the ratio of 260/280 nm. The Dual Gene Quantitative (Maxim Biotech) and iQ SYBR Green Real Time PCR (Bio-Rad) methods were used to determine CD55 and TLR4 mRNA levels as described in Pawelczk et al. 2011 [12]. Briefly, the intensities of the PCR products were digitally captured and quantitated using an AlphaImager HP image-scanning system (Alpha Innotech Corporation, San Fernando, CA). CD55 and TLR4 mRNA expression levels were determined using the absolute standard curve method with 18S rRNA as a normalization standard. Total copy numbers were determined by extrapolation from a standard curve generated using linearized plasmid DNA (pCR2.1) that contained the CD55, TLR4 and 18S rRNA amplicons, respectively. The correlation coefficients of the standard curves were >0.99 and encompassed the entire range of experimental copy numbers.
2.4. Receiver Operator Characteristic (ROC) Curve and Area under the Roc Curve (AUC) Analysis
To obtain measures of sensitivity and specificity for the single and combined marker models, a receiver operating characteristic (ROC) curve analysis was conducted using MATLAB software (version 8.0). This technique calculates the false positive rate (1-specificity) versus true positive rate (sensitivity) across the full range of classification thresholds, avoiding the selection of a single value as the threshold for classification. The area under the ROC curve (AUC) gives a single metric to assess and compare the performance of different models.
2.5. Combination Model Using CD55 and TLR4
A linear combination of the biomarkers based on CD55 and TLR4 mRNA levels was used to create models for PTL diagnosis [14-16]. Both CD55 and TLR4 mRNA levels were log-transformed in order to compensate for different scales and/or distributions of these markers in the population. The CD55 and TLR4 levels were also normalized (by setting the mean to 0, and the standard deviation to 1) in order to estimate parameters in the combined marker models. The combined model takes the general form of
 (1)
(1)
where beta denotes maximal AUC coefficient determined by variance-covariance matrices. We used an alternative formulation where alpha = beta_2/beta_1 and ranges in value from (negative infinity to infinity). The combination was of the form
 (2)
(2)
The coefficient of the models was selected to maximize accuracy as measured by the AUC. The combined models were created by a linear discriminant and distribution free approach. The linear discriminant approach (LD) assumes a multivariate normal distribution and used the mean and variance-covariance matrices of the case and control groups to calculate the alpha coefficient [15]. The distribution free (DF) method does not make distributional assumptions but determines the optimal coefficient via a search of possible coefficient values (alpha) to maximize the AUC, made by the MannWhitney U statistic (an estimate of AUC from ranks) [14,15, 17].
3. RESULTS AND DISCUSSION
The performance of all models was assessed using a stratified, 10 × 5-fold nested cross validation design. The value of alpha was optimized in the inner loop, and the generalized performance AUC was estimated using the reserved 20% of the data in the outer loop. This procedure was replicated 10 times to provide estimates of standard error and confidence intervals on the metrics. The results for PTL are shown in Table 1. The AUC, sensitivity, and specificity with 95% confidence intervals are presented for models using CD55 alone, TLR4 alone, a combined-LD method, and combined-DF method to diagnose PTL (calculations performed in MATLAB and using MedCalc software v11.6.1.0). A representative ROC curve for the four models is presented in Figure 1. The AUC for CD55 alone was the smallest of the four models at 0.85. The AUC of TLR4 alone (0.94) was higher than that of CD55. The AUCs of the combinedLD method and combined-DF method models (both 0.96) were higher than CD55 alone and TLR4 alone. An AUC value of 0.5 means that the classifier or variable in question is no better than random guessing; therefore the classifier is not useful for a prediction or diagnosis. An AUC of 1.0 signifies that the classifier is perfect. With no absolute consensus of opinion on AUC value thresholds, conventions are that an AUC from 0.90 to 1.0 is considered an “excellent” classifier, an AUC from 0.8 to 0.9 is “good”, and an AUC from 0.5 to 0.6 represents a “failure”. Using these criteria, the CD55 single marker model was a “good” classifier (AUC = 0.85), diagnostic models using TLR4 alone (AUC = 0.95), combined-LD method (AUC = 0.96), and combined-DF method (AUC = 0.96) models were in the “excellent” range for classification accuracy.
Sensitivity and specificity were also increased with the combined-LD and combined-DF methods compared to single marker classifiers (Table 1). The threshold used to calculate the single sensitivity and specificity value was selected as optimal for each model, when given equal weighting to incorrect classifications. The combined-LD method had the highest sensitivity of the four models at 86%, the combined-DF method had a sensitivity of 83%, and CD55 alone and TLR4 single marker models each had a sensitivity of 79%. Specificity was the highest in the combined-DF method at 99%. The combined-DF method, TLR4 alone, and CD55 alone had specificities of 98%, 96%, and 93%, respectively.
All models were compared using pair-wise tests of significance of the difference in AUC values using a t-test with the 10 replications [17]. The p-values of each comparison are reported in Table 2. From these resultsTable 1. Preterm labor receiver operating characteristic analysis.
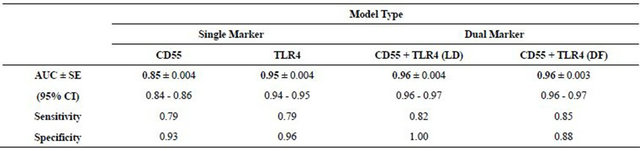
Standard errors (SE) of AUC values were calculated from the 10 replicates of the cross validation procedure. Confidence intervals (CI) were calculated using exact binomial data (AUC ± 1.96 SE). LD = combination model linear discriminant method, DF = combination model distribution free method.
Table 2. Matrix of p-values from statistical tests of difference of AUC values for all pair-wise comparisons of the single marker and combined marker models.
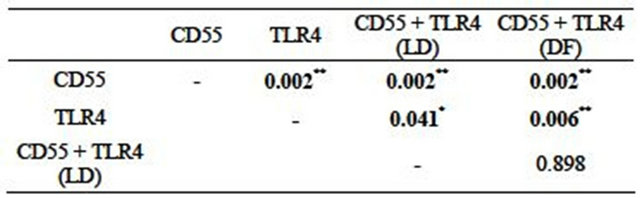
The stars indicate levels of significance, *= p-value < 0.05, **= p-value < 0.01; (LD) = combination Linear Discriminant method, (DF) = combination Distribution Free method.
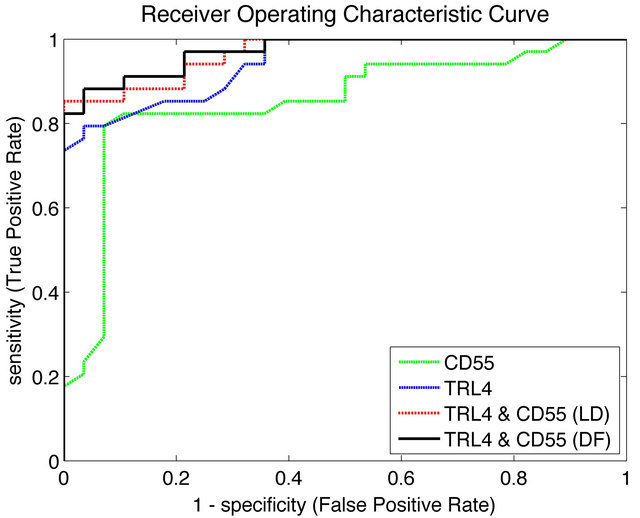
Figure 1. Receiver Operator Characteristic (ROC) plots of false positive rate (1-specificity) versus true positive rate (sensitivity) for classification of preterm labor (PTL) by single CD55, single TLR4 and CD55 + TLR4 combination biomarker models using either the Linear Discriminant (LD) method or the Distribution Free (DF) method.
the combined models show better performance at a statistically significant level compared to single biomarker models. Compared to CD55 alone, statistically significant classifier accuracy was observed in TLR4 alone, DF-combined and LD-combined models; all with pvalue < 0.01. Compared to TLR4 alone, the DF-combined (p-value < 0.05) and LD-combined (p-value < 0.01) models showed statistically improved performance. No statistically significant differences in AUCs were found when comparing the LD-combined method with the DF-combined method (p-value = 0.90).
Overall, the combination models both outperformed the single marker models in terms of sensitivity, specificity and AUC. This points to the concept that using a single marker as a diagnostic evaluation for a multi-factorial problem such as PTL might be an over-simplification. Further, this research offers an intriguing advance to the single marker approach by demonstrating that significantly better classifiers can be achieved by a relatively simple linear combination of two individual biomarkers.
4. CONCLUSIONS
PTL is frequently associated with a subclinical, silent infection detected only post-partum. The resulting slow injury process that occurs in fetal membranes is postulated to be associated with the release of fetal fibronectin. A quest for a biochemical test for PTL resulted in the discovery of the fetal-fibronectin assay with a high negative predictive value. This provided at least an aid to physicians who wanted to counsel patients. A negative fetal fibronectin test therefore gives a >95% likelihood of remaining undelivered for the next 2 weeks. Studies that explored the identification of biochemical markers with a high positive predictive value were less successful.
We previously proposed the concept that PTL cascades that occur in the feto-maternal unit may result in activation of the maternal immune system and therefore activation of white cells could be easily detected in maternal peripheral blood. We further reported that two independent markers of PTL (CD55 or TLR4 mRNA) were significantly higher in women who exhibited a clinically diagnosed PTL. In this study, we used a combined marker approach to determine if using both CD55 and TLR4 mRNA levels as biomolecular markers for PTL diagnosis would out-perform a diagnostic classifier model using individual markers.
In conclusion, our combined-marker approach showed promise with improved performance over single-maker models, suggesting a synergy gained by applying the dual marker approach. While we have previously demonstrated the utility of using CD55 or TLR4 mRNA levels to diagnose PTL effectively [11,12,18]. In this current study, we find that a combination model using both CD55 and TLR4 as biomarkers for PTL adds a statistically significant enhancement. This is demonstrated by increases in AUC, sensitivity and specificity in the combination models compared to the single marker models. Future studies with a larger samples size are being conducted in order to address whether our findings are generalizable and to assess the use of these molecules for prediction of PTL and consequent prediction of pre-term birth.
5. ACKNOWLEDGEMENTS
This research was funded in part by the NIH Research Centers in Minority Institutions Program (RCMI), MD03032 (NCRR), MD007586 (NIMHD), the Meharry Translational Research Center (MeTRC) grants RR026140 (NCRR), MD007593 (NIMHD), MD008149 (NIMHD), DK42029 (NIDDK), HD055648 (NICHD), and HD041687 (NICHD).
REFERENCES
- Goldberg, R.L., et al. (2008) Epidemiology and causes of preterm birth. The Lancet, 371, 75-84. doi:10.1016/S0140-6736(08)60074-4
- Beck, S., Wojdyla, D., Say, L., Betran, A.P., Merialdi, M., Requejo, J.H., et al. (2010) The worldwide incidence of preterm birth: A systematic review of maternal mortality and morbidity. Bulletin of the World Health Organization, 88, 31-38. doi:10.2471/BLT.08.062554
- Haas, J.S., et al. (2005) Prepregnancy health status and the risk of preterm delivery. Archives of Pediatrics & Adolescent Medicine, 159, 58-63. doi:10.1001/archpedi.159.1.58
- Moore, M.L. (2003) Preterm labor and birth: What have we learned in the past two decades? Journal of Obstetric, Gynecologic, & Neonatal Nursing, 32, 638-649. doi:10.1177/0884217503257367
- DiGiulio, D.B., et al. (2008) Microbial prevalence, diversity andabundance in amniotic fluid during preterm labor: A molecular and culture-based investigation. PLoS One, 3, e3056. doi:10.1371/journal.pone.0003056
- Romero, R., Espinoza, J., Gonçalves, L.F., Kusanovic, J.P., Friel, L. and Nien, J.K. (2006) Inflammation in preterm and term labour and delivery. Seminars in Fetal & Neonatal Medicine, 11, 317-326. doi:10.1016/j.siny.2006.05.001
- Robinson, J.N., Regan, J.A. and Norwitz, E.R. (2001) The epidemiology of preterm labor. Seminars in Perinatology, 25, 204-214. doi:10.1053/sper.2001.27548
- Goldenberg, R.L., Hauth, J.C. and Andrews, W.W. (2000) Intrauterine infection and preterm delivery. The New England Journal of Medicine, 342, 1500-1507. doi:10.1056/NEJM200005183422007
- Arntzen, K.J., et al. (1998) TNF, IL-1, IL-6, IL-8 and soluble TNF receptors in relation to chorioamnionitis and premature labor. Journal of Perinatal Medicine, 26, 17- 26. doi:10.1515/jpme.1998.26.1.17
- Dudley, D.J. (1997) Pre-term labor: An intra-uterine inflammatory response syndrome? Journal of Reproductive Immunology, 36, 93-109. doi:10.1016/S0165-0378(97)00065-X
- Nowicki, S., et al. (2009) Preterm labor: CD55 in maternal blood leukocytes. American Journal of Reproductive Immunology, 61, 360-367. doi:10.1111/j.1600-0897.2009.00702.x
- Pawelczyk, E., et al. (2011) Spontaneous preterm labor is associated with an increase in the proinflammatory signal transducer TLR4 receptor on maternal blood monocytes. BMC Pregnancy and Childbirth, 10, 66. doi:10.1186/1471-2393-10-66
- Faul, F., et al. (2007) G*Power 3: A flexible statistical power analysis program for the social, behavioral, and biomedical sciences. Behavior Research Methods, 39, 175-191. doi:10.3758/BF03193146
- Pepe, M.S. and Thompson, M.L. (2000) Combining diagnostic test results to increase accuracy. Biostatistics, 1,123-140. doi:10.1093/biostatistics/1.2.123
- DeLong, E.R., DeLong, D.M. and Clarke-Pearson, D.L. (1988) Comparing the areas under two or more correlated receiver operating characteristic curves: A nonparametric approach. Biometrics, 44, 837-845. doi:10.2307/2531595
- Su, J.Q. and Liu, J.S. (1993) Linear combinations of multiple diagnostic markers. Journal of American Statistical Association, 88, 1350-1355. doi:10.1080/01621459.1993.10476417
- Hanley, J.A. and McNeil, B.J. (1982) The meaning and use of the area under a receiver operating characteristic (ROC) curve. Radiology, 143, 29-36.
- Pacheco, L.D., Hankins, G.D., Costantine, M.M., Anderson, G.D., Pawelczyk, E., Nowicki, S. and Nowicki, B.J. (2011) The role of human decay-accelerating factor in the pathogenesis of preterm labor. American Journal of Perinatology, 28, 565-570. doi:10.1055/s-0031-1274510
NOTES
*Equal author contribution.
#Corresponding author.
The authors declare that they have no competing interests.