Journal of Biomedical Science and Engineering
Vol. 5 No. 12 (2012) , Article ID: 25766 , 10 pages DOI:10.4236/jbise.2012.512088
Wavelet diagnosis of ECG signals with kaiser based noise diminution
![]()
1Faculty of Electrical and Electronics Engineering, University Malaysia Pahang, Kuantan, Malaysia
2School of Electrical, Computer and Telecommunications Engineering, University of Wollongong, New South Wales, Australia
Email: csridhathan@yahoo.co.in
Received 28 September 2012; revised 30 October 2012; accepted 7 November 2012
Keywords: Diagnostic Distortion; Wavelet Transforms; ECG; Noise Interferences, FIR Filter; Kaiser Window
ABSTRACT
The evaluation of distortion diagnosis using Wavelet function for Electrocardiogram (ECG), Electroencephalogram (EEG) and Phonocardiography (PCG) is not novel. However, some of the technological and economic issues remain challenging. The work in this paper is focusing on the reduction of the noise interferences and analyzes different kinds of ECG signals. Furthermore, a physiological monitoring system with a programming model for the filtration of ECG is presented. Kaiser based Finite Impulse Response (FIR) filter is used for noise reduction and identification of R peaks based on Peak Detection Algorithm (PDA). Two approaches are implemented for detecting the R peaks; Amplitude Threshold Value (ATV) and Peak Prediction Technique (PPT). Daubechies wavelet transform is applied to analyze the ECG of driver under stress, arrhythmia and sudden cardiac arrest signals. From the obtained results, it was found that the PPT is an effective and efficient technique in detecting the R peaks compared to ATV.
1. INTRODUCTION
Nowadays, Computer aided ECG signal analysis has gained thrust and incredible amount of work were carried out using these technologies for heart diagnosis. The ECG signal is characterized by five peaks and valleys labeled by the letters P, Q, R, S, T. In some cases, another peak called U is also used. The P-wave represents the activation of the upper chambers of the heart, atria, while the QRS complex and T-wave represent the excitation of the ventricles or the lower chamber of the heart [1, 2]. Normal ECG signal and its labeling are depicted in Figure 1 [3]. ECG signal contains anatomic and physicologic aspects of the whole cardiac muscle and other information that can be exploited in different manners.
ECG analyzing system depends mainly on the accurate and reliable detection of the QRS complex, T and P waves [1,2]. Electrodes and cables are connected to the patient in examination room and monitoring is carried out in other location. Hence, electromagnetic interference of the power frequency and some other biomedical signals like baseline wander, Electromyogram (EMG) and EEG are added to the ECG signal. ECG signal frequency is approximately between 0.5 Hz and 100 Hz. Baseline Wander frequency is below 1 Hz and EEG signal frequencies are above 100 Hz. EMG frequency can overlap with ECG frequency depending on body muscle movement which can be reduced to the barest by making the patient staying still and quiet [4-6].
The wavelet transform is a time-scale representation method that decomposes signals into basis functions of time and scale, which makes it useful in many applications such as signal de-noising, wave detection, data compression and feature extraction [1,7].
The wavelet transformation is based on a set of analyzing wavelets allowing the decomposition of ECG signal in a set of coefficients. Each analyzing wavelet has its own time duration, time location and frequency band [1]. In the wavelet based algorithm, the ECG signal is de-noised by removing the corresponding wavelet coefficients at higher scales [2]. One of the main applications of a filter is to sort out the unwanted parts of an
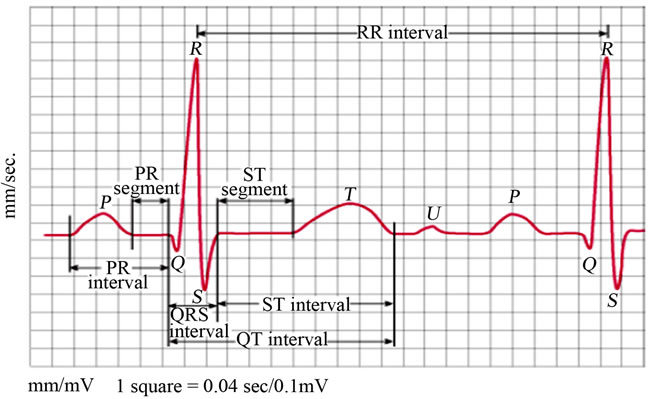
Figure 1. Normal ECG Signal with labeling.
input signal. These unwanted parts might be noise present out of the frequency band in the desired signal. During transforming the corrupted signal into the frequency domain, the frequencies that belong to the external noise can be easily detected [7,8].
Wavelet transform are used to compress the ECG signal. The main challenge in an ECG compression method is to minimize the storage requirements without losing the clinically significant information which can be achieved using Wavelet transform. Small variations in normal and noise corrupted ECG signal can been extracted using wavelet function [9,10].
The wavelet based signal de-noising is performed using wavelet shrinkage and thresholding technique. There are two types of thresholdings; hard and soft. In hard threshold, the elements whose absolute value is lower than the threshold are set to zero. Soft threshold is an extension of hard threshold. Here, the elements whose absolute values are lower than the threshold are first settled to zero, and then shrinking the nonzero coefficients towards 0 [11].
The series connection of Discrete Wavelet Transform, thresholding and Inverse Discrete Wavelet Transform can remove the noises and achieve high Signal-to-Noise ratios. This is due to the concentrating ability of the wavelet transform [12]. The combination of Shannon energy envelope estimator and Hilbert-transform technique can detect R-peaks in case of wider and small QRS complexes, negative QRS polarities, and sudden changes in QRS amplitudes [13].
Sharing the patient information and exchange of medical images and Electronics Patient Record between networked hospitals and healthcare centers is witnessed nowadays. Discrete wavelet packet transforms is used to protect the patient information in the form of watermark on the medical image using the hospital logo as a reference image. Since wavelet based watermarking method is robust against a wide range of attacks such as JPEG image format, contrast adjustment, Gaussian noise, histogram equalization, gamma correction etc. [14].
ECG analysis can be done reliably and accurately if the noises and artifacts are removed. The noise reduction in ECG has been reported in many research works. In our work the filtration of ECG is done using Kaiser based FIR filter which has attractive character both in time and frequency domain. Kaiser window has the ability to remove noise effectively than other windowing techniques. Here FIR filters are designed to remove the noise in a particular frequency range such as 0.5 Hz to remove the Baseline Wander, 50 Hz to remove the power line interference etc. Filtration is done prior to R peak detection to minimize the false detection rate. It can be seen from the results that the designed filter removes noise effectively. In many previous works the filtration is done on normal ECG signal. Wavelet transform is applied on normal or abnormal ECG such as tachycardia, bradycarida. In our work, we apply wavelet analysis for signals such as sudden cardiac arrest, and driver in stress.
The aim of the work is to remove the noises from the ECG signals and identify the R peak. After the noise removal, the ECG peaks are detected by the Peak Detection Algorithm (PDA) techniques. The wavelet of the abnormal ECG signals is compared with the normal one. The data for this analysis was collected from PhysioBank data base [15]. Section 1 gives a brief introduction about the ECG signals. Section 2 outlines the function of Kaiser based noise reduction using FIR filters. Wavelet transform is described in Section 3. Approach to PDA and Wavelet analysis is described in Section 4. Section 5 presents the results and discussion followed by conclusion.
2. KAISER BASED NOISE REDUCTION USING FIR FILTERS
FIR filter is one of the techniques successfully employed in processing ECG signals for measurement and noise reduction. They are used to modify the bio-signal by removing noise and the effect of a system on the input signal can be described in both time and frequency domains. The time domain method of ECG signal analysis is not always sufficient to study all the features of ECG signals. Therefore, the frequency representation of a signal is required [5,6]. Hence, filters are designed in frequency domain so that the noisy signals can be filtered from the measured bio-signals. If this filters where designed in time domain it would not be possible to remove the noises effectively since the frequencies that belong to the external noise cannot be detected easily. In this section more details about the filters and filtration process are presented.
2.1. Notch Filter (NF)
The noise presented at 50/60 Hz is known as a power line hum (noise), caused by any electrical appliances and lights [5,6]. NF is used to filter this noise. The frequency response of NF is shown in Figure 2 and the transfer function of a NF is given by,
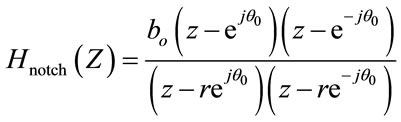 (1)
(1)
where,
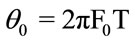
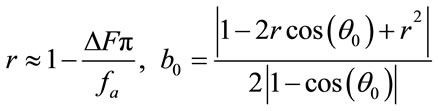 (2)
(2)
B0 = filter coefficient,
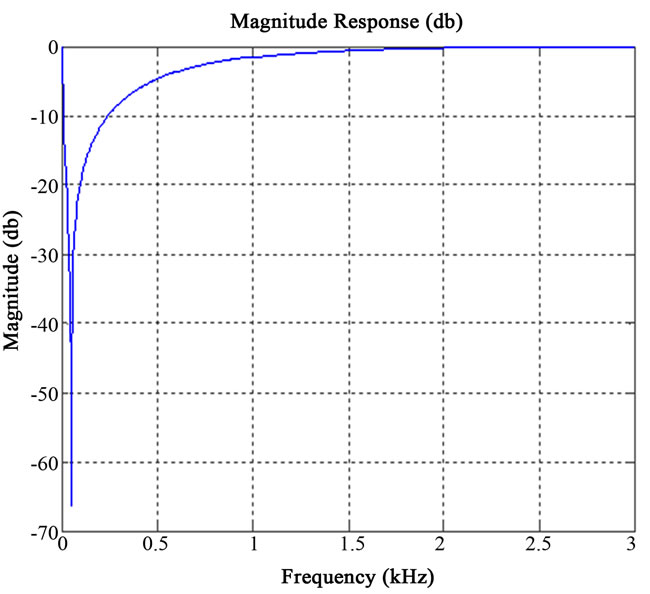
Figure 2. Frequency response of a 50 Hz NF.
z = unit delay operatorr = pole radius,
 F0 = Notch frequencyfs = sampling frequency,
 = Notch Band.
2.2. High Pass Filter (HPF)
The HPF removes the corrupting low frequency noises in ECG signal. HPF is designed with the cut off frequency is 0.5 Hz and the sampling frequency is 6 KHz. The frequency response of designed HPF is shown in Figure 3. The transfer function of an ideal HPF is determined by the following constraints,
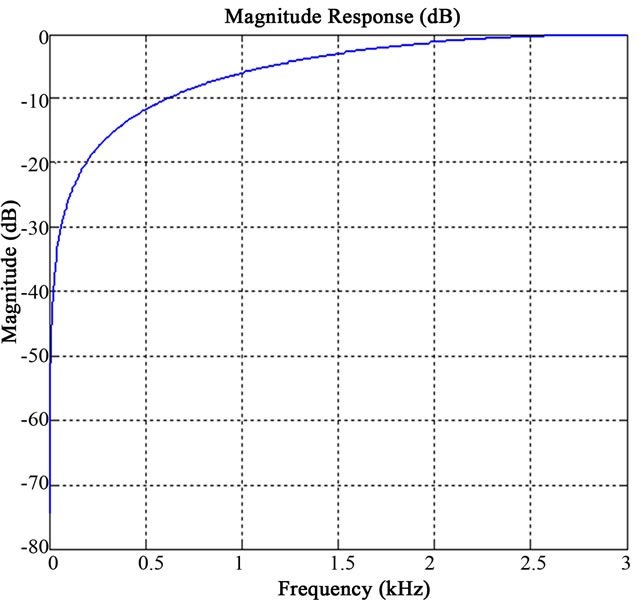
Figure 3. Frequency response of HPF.
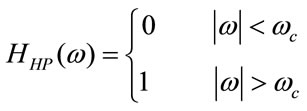 (3)
(3)
where 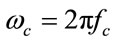 is the filter cut-off frequency.
2.3. Low Pass Filter (LPF)
The LPF removes the corrupting high frequency noises in ECG. The transfer function of an ideal LPF is given by Equation (4). Here the LPF is designed with the cut off frequency (fc) 100 Hz with the sampling frequency (fs) of 6 KHz. The frequency response of designed low pass filter is shown in Figure 4.
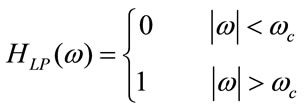 (4)
(4)
2.4. Kaiser Window (KW)
Kaiser based FIR filter is designed to remove the unwanted frequency component which corresponds to the noise. Kaiser window has very desirable characteristics both in time domain and frequency domain. A typical KW function is depicted in Figure 5. A good window should be a time limited function with a Fourier transform that is band limited and Kaiser Window possesses such characteristics [6]. The Kaiser window is given by,
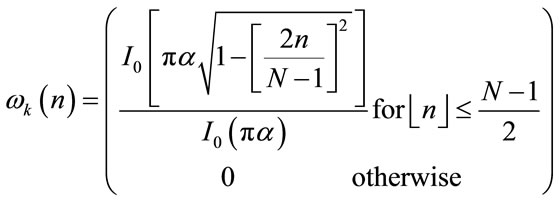 (5)
(5)
where α is the adjustable parameter and  is the
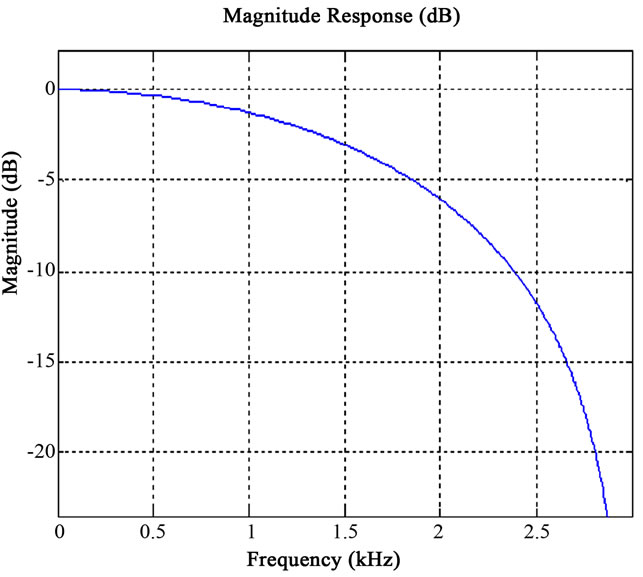
Figure 4. Frequency response of LPF.
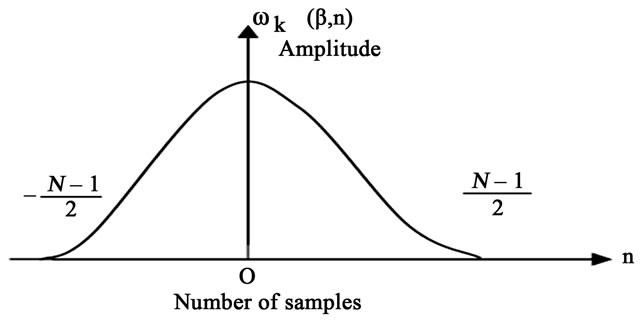
Figure 5. Kaiser window function.
modified zero order Bessel functions of the first kind. In some works the factor β is also used, in this case Equation (5) is modified into,
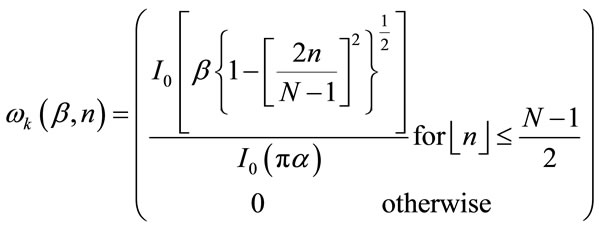 (6)
(6)
3. WAVELET TRANSFORM
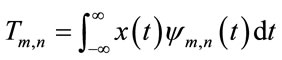
A signal as the function of  can often be better analyzed and expressed as a linear decomposition of the sums; coefficient products and function. In the wavelet transform, the original signal is transformed using predefined wavelets. These wavelets are orthogonal, orthonormal, biorthogonal, scalar or multi wavelets. The wavelet transform is a convolution of the wavelet function
  with thesignal
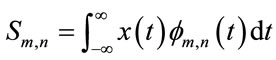
 . Orthonormal dyadic discrete wavelets are associated with scaling functions
 . The scaling function can be convolved with the signal to produce approximation coefficients “S” [1,2,8, 10-12,16]. The Discrete Wavelet Transforms (DWT) can be written as,
 (7)
(7)
The original signal can be reconstructed by choosing orthonormal wavelet with the approximation coefficient as,
 (8)
(8)
The signal approximation at a specific scale is a combination of the approximation and detail at the next lower scale is,
 (9)
(9)
In order to keep the total number of data points similar at each level, every other data point of the output sequences is discarded; this process is known as downsampling. Using up-sampling the original data set is reconstructed [17].
In discrete, the wavelet transform is modified to a filter bank tree using the decomposition/reconstruction as shown in Figures 6 and 7. ECG signal is decomposed into a sequence of wavelet coefficients using linear phase bi-orthogonal filter bank DWT.
Referring to Figure 6, the input signal is fed to “h” and “g”, where “h” is the high pass filter and “g” is a low pass filter. The output of the high pass filter is down sampled to get detailed coefficients and approximation coefficients from low pass filter after down sampling. If there are many levels of decompositions, at each level, the high pass filter produces detail information, while the low pass filter produces approximation information.
As seen from Figure 7, the approximation and detail coefficients at every level are up-sampled, passed through the low pass and high pass synthesis filters and then added. Same number of levels as in the decomposition process must be used to obtain the original signal.
The Decomposition Coefficient Vector (DCV) is
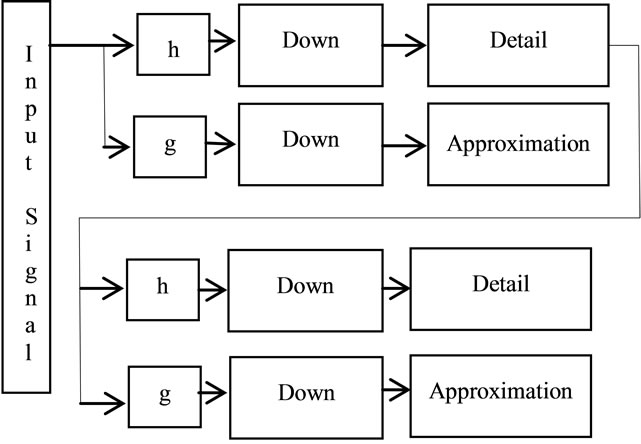
Figure 6. Filter bank tree decomposition.
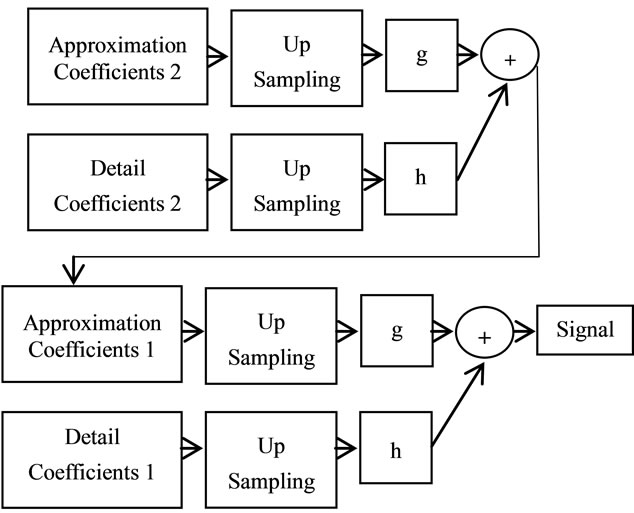
Figure 7. Filter bank tree reconstruction.
obtained by concatenating the Approximation band Coefficients (AC5) at the fifth level and the entire Detail band Coefficients (DC5 - 1) start from the last level of the decomposition to first level [10-12,16]. The decomposition coefficient vector is given by,
 (10)
(10)
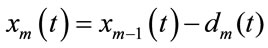
In this work Daubechies [1,3] wavelet analysis is performed on ECG signals of automobile drivers under stress and sudden cardiac arrest. Although the Daubechies algorithm is conceptually more complex and has a slightly complicated computation, yet this algorithm picks up minute detail that is missed by other wavelet algorithms, like Haar wavelet algorithm. For Daubechies wavelet transforms the decomposition is given by,
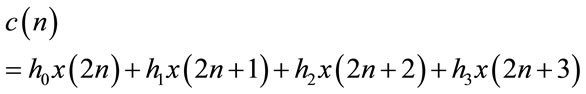 (11)
(11)
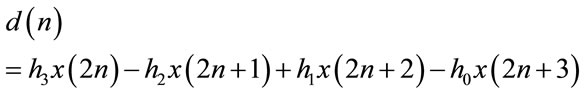 (12)
(12)
where the multipliers are found by,
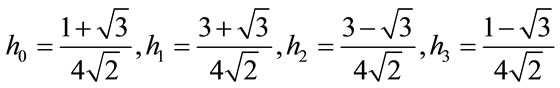 (13)
(13)
4. PEAK DETECTION ALGORITHM IN WAVELET ANALYSIS
Biomedical signals are needed to be filtered so that the physician can evaluate the patient condition clearly. The QRS complex in the ECG reflects the electrical activity of heart during the ventricular contraction, the time of its occurrence and shape provide good information about the current state and condition of the heart based on peak detection for QRS signals using threshold values. In this work, FIR filter with Kaiser Window approach was selected because of its ability to remove noise in the ECG. The noise corrupted ECG signal is applied to the 50 Hz NF in order to remove the power line interference or hum. Deviations in the normal ECG patterns indicate various cardiac disorders. Table 1 demonstrates features of various abnormalities and their characteristic [1].
The proposed approach is used to remove the power line interference, baseline wander frequency and other noisy signals which overlap with ECG frequency and also to identify the R peaks in ECG. In this approach, Filtered ECG signal is fed to the PDA using two approaches ATV and PPT so that the R peaks can be detected. After filtration, signal is scanned for R peaks using PDA. The flowchart of ATV PDA algorithm is shown in Figure 8 and the steps of such approach are listed.
1) ECG signals whose values are positive are considered and the negative values are neglected using zero threshold (x(s) ≥ 0), retain same value, else zero;
2) Amplitude Threshold Value (ATV) is calculated from the ECG signal (ATV = 0.7 maximum amplitude value);
3) ATV is used to rectify the ECG signal (x(s) ≥ ATV), retain same value, else zero;
4) In ECG signals, R peaks are detected by clipping the unwanted parts by using the ECG clipper. Clipper uses logical conditions to identify the R peaks;
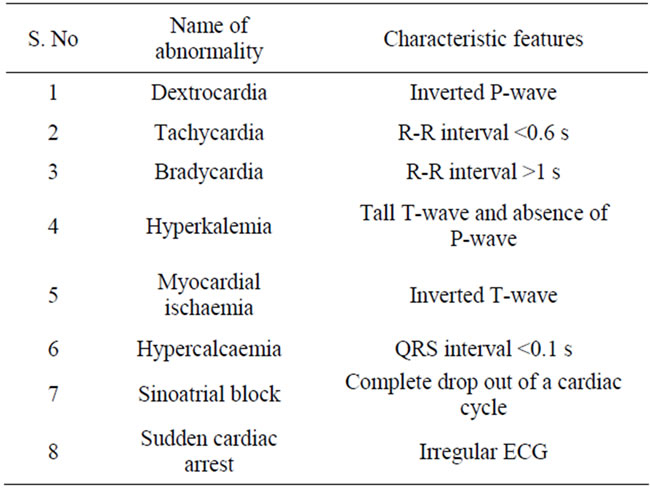
Table 1. Various abnormalities and their characteristic features.
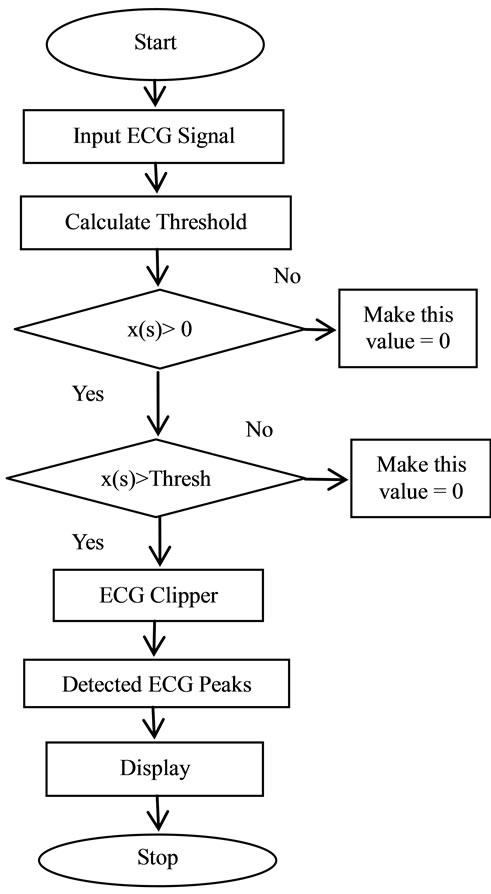
Figure 8. The flowchart of ATV PDA.
5) The detected peaks are displayed.
The flowchart of PPT is depicted in Figure 9. As seen from flowchart, PPT identifies the highest value point between valleys. This method searches the maximum peak value in the signal and stores the value and the address location. It compares stored values to define the peak point in the signal.
The performances of the PDA can be assessed by evaluating the sensitivity, positive prediction and false negatives as,
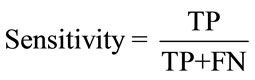 (14)
(14)
 (15)
(15)
 (16)
(16)
whereTP: number of true positive detections;
FN: number of false negatives;
FP: number of false positives.
5. RESULT AND DISCUSSION
The crucial step in the ECG analysis is to remove the noise and differentiate waves forming the entire cardiac cycle. Matlab environment was used to design and evaluate
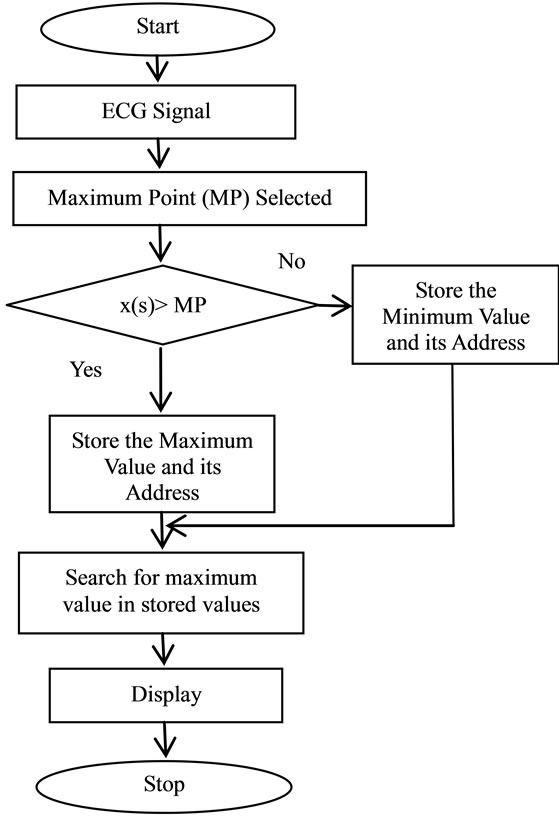
Figure 9. The flowchart of PPT.
the performance of the filter in removing noise and to analysis the wavelet of different ECG signals. The design uses FIR filter with Kaiser Window built in the Matlab. The NF designed here is used to remove the 50/60 Hz power line interference. FIR filter designed for the pass band and stop band frequency of 0.5 Hz and 100 Hz with Kaiser Window. In Figures 10-12, (a) is the ECG signal before filtering is displayed in green colour and ECG signal after filtering is shown in blue colour and (b) the noise removed from ECG. It can be observed that the filter reduced noises in ECG to a considerable level as seen in Figures 10-12. This filtered ECG signal is passed through PDA techniques.
Figures 13-16 show the output after applying the PDA to the ECG signals. In these figures, the first part is
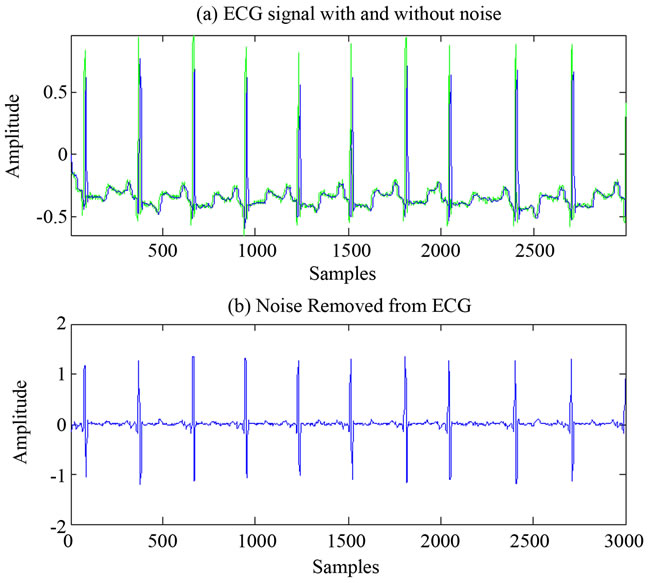
Figure 10. ECG signal before and after filtration (green color ECG signal with noise, blue color ECG signal after filtration).
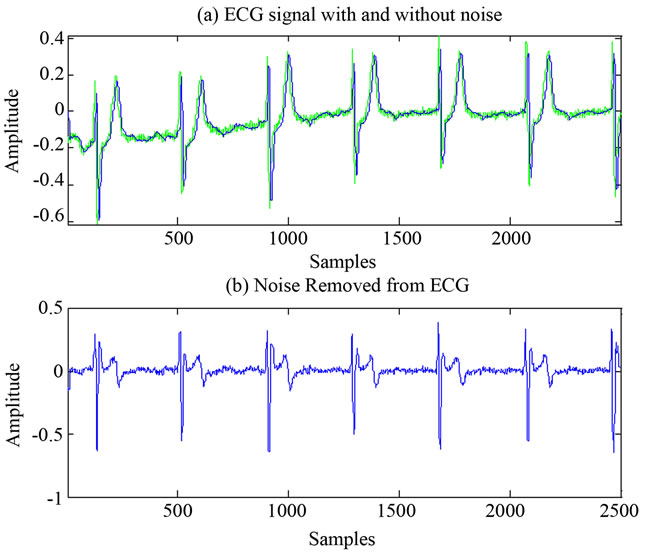
Figure 11. ECG signal before and after filtration.
the ECG signal whose peak has to be detected. The second part is the detected peaks which are incorporated and highlighted in ECG signals. Third part is the peaks that are detected. Figures 13-14 show the results after applying ATV to the ECG signals. As seen from these figures, ATV detects the R peaks when the noise level is less. If noise level or artifacts are more in ECG, the ATV fails to detect the R Peaks. Figures 15-16 show the results after applying PPT to the ECG signals. From these figures it is clearly seen that PPT detects the R peaks when the noise level or the artifacts in ECG is more. The false detection is also less in PPT compared to ATV. From information given in Table 2, the sensitivity, positive prediction and error rate can be calculated.
Daubechies wavelet transform is applied using Wavelet GUI in Matlab on the ECG signals such as arrhythmia, drivers under stress and sudden cardiac arrest. Here five levels of dB wavelet decomposition (d1 to d5) and approximations (a1 to a5) are performed on the ECG sig-
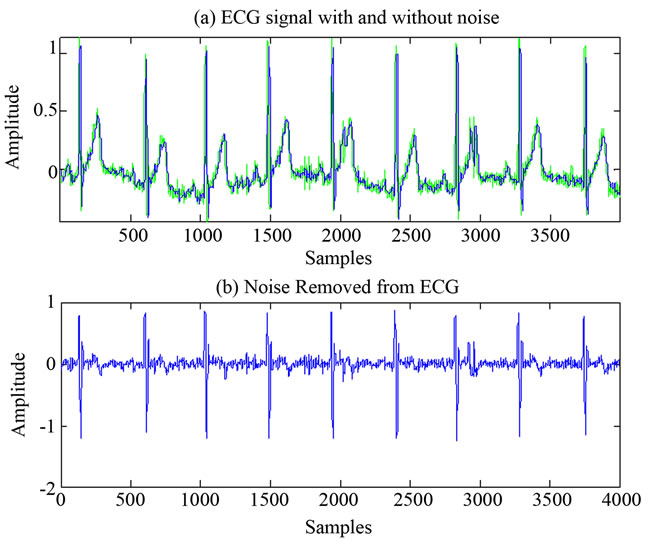
Figure 12. ECG signal before and after filtration.
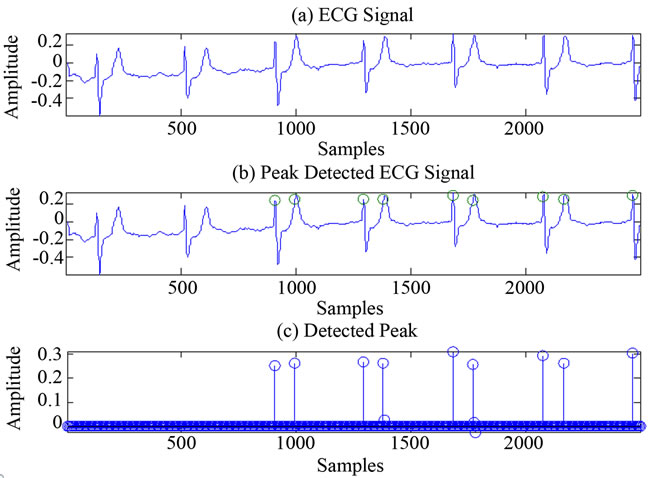
Figure 13. R peaks detection using ATV.
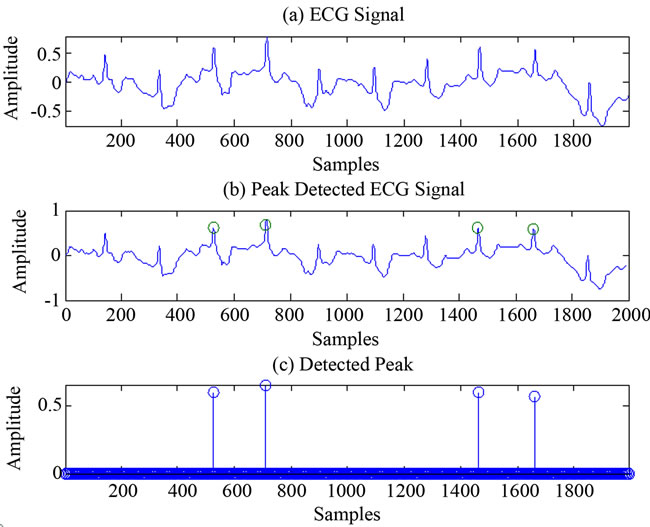
Figure 14. R peaks detection using ATV.
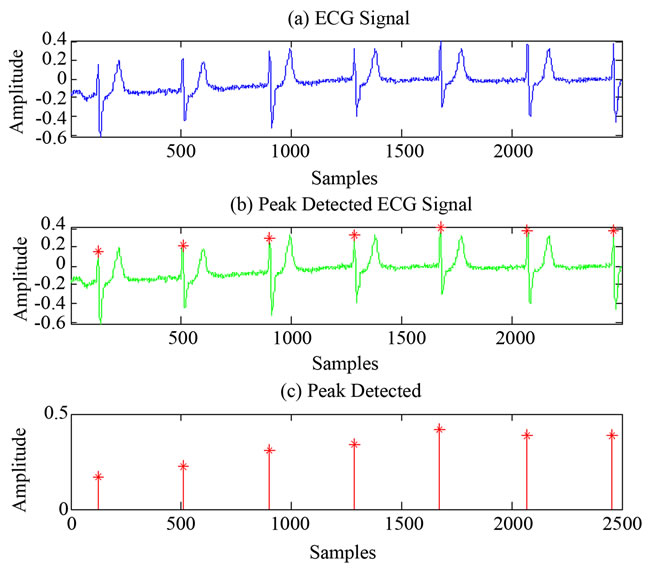
Figure 15. R peaks detection using PPT.
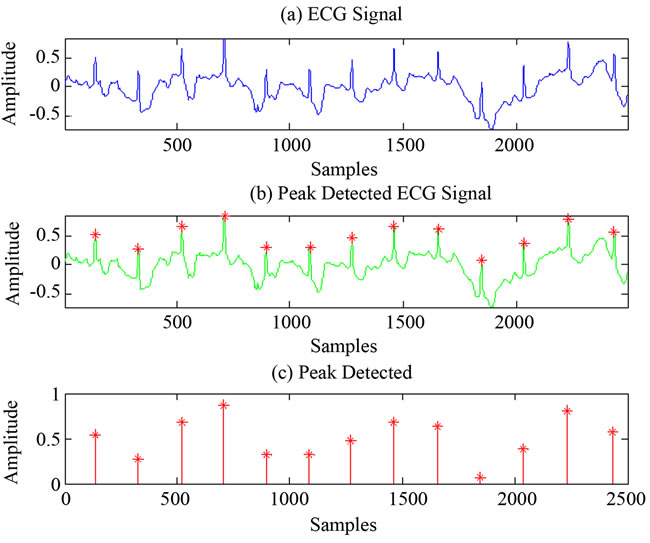
Figure 16. R peaks detection using PPT.
nals. The steps involved for applying wavelet transform to the signals using MATLAB tools is described here. The wavelet GUI is opened using command window by typing wave menu, wavelet 1-D is selected from the menu. The signal is imported and required wavelet transform is applied on the signals and based on that, the decomposition and approximation coefficients are obtained and analyzed. The Daubechies wavelet transform is applied for the different ECG signals taken for physiobank database and the results of these analyses are graphically shown in Figures 17-20.
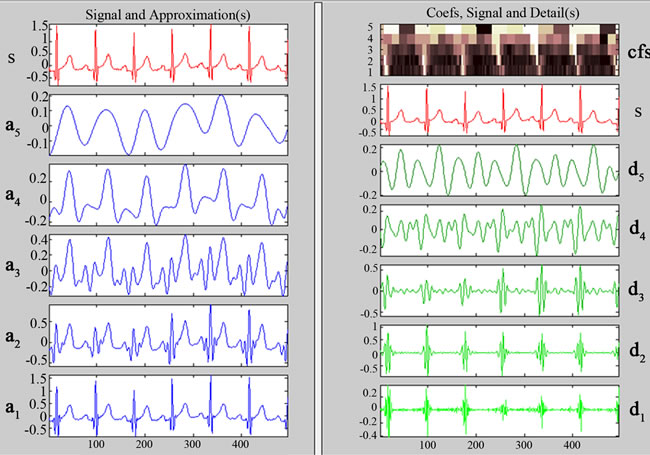
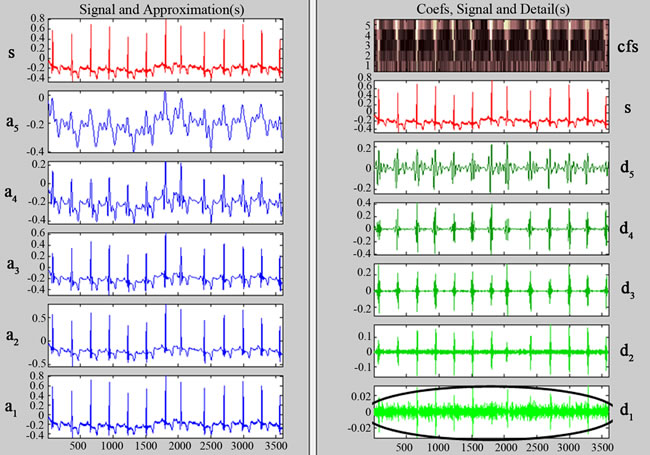
The wavelet transformation is worth investigating especially in P and T wave recognitions. The peaks of QRS complexes flatten; P and T waves containing lower frequencies become more visible [2]. In Figure 17(a) (left hand side) “S” is the normal ECG wave and a1 to a5 are the approximation coefficients. ECG signal, d1 to d5 decomposition coefficients are shown on the right hand side of the Figure 17. It can clearly be seen from the decomposition coefficients d1 to d3, that the frequency and amplitude components correspond directly to the QRS complex. In higher decomposition coefficients, the P and T components are more visible.
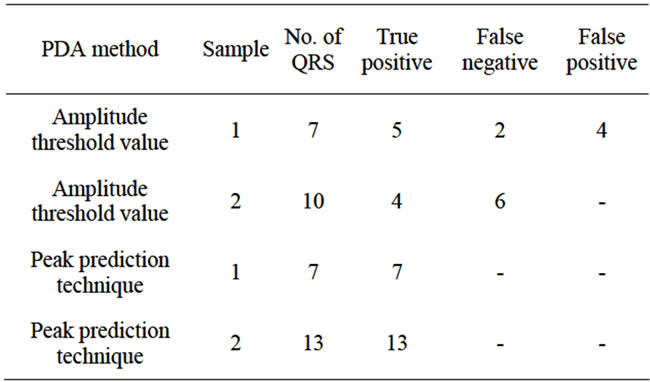
Table 2. Performance characteristic features of PDA.
 (a) (b)
Figure 17. (a) ECG and corresponding approximate coefficients; (b) Decomposition coefficients.
 (a) (b)
Figure 18. (a) Arrhythmia Signal and corresponding approximate coefficient; (b) Decomposition coefficients.
 (a) (b)
Figure 19. (a) ECG of driver under stress and corresponding approximate coefficients; (b) ECG of decomposition coefficients.
 (a) (b)
Figure 20. (a) Sudden cardiac arrest and corresponding approximate coefficients; (b) Decomposition coefficient.
In Figure 18, arrhythmia signal with approximation coefficients a1 to a5 are shown on the left hand side. Signal and its detailed coefficients d1 to d5 are shown on right hand side of Figure 18. In this signal, the duration of each cardiac cycle is not regular, it can be seen in the 7th and 8th cycle T and P wave are merged and in 8th cycle T wave is larger than the normal duration. When arrhythmia d1 coefficients is compared with the normal signal, it can be noted that d1is having more change in frequency which is highlighted by oval in Figure 18. The d4 and d5 coefficients have high frequency variation compared to normal signal.
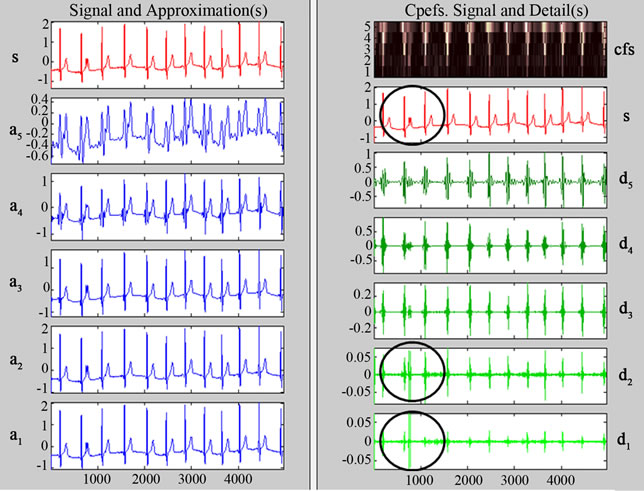
ECG Signals of an automobile driver under stress with approximation coefficient a1 to a5 and detailed coefficients d1 to d5 are shown in the left and right hand side of Figure 19 respectively. When the driver is in stress the ECG wave is having drastic change and deviates from the normal wave. From Figure 19, it is seen that the P wave is missing in the entire signal. In the second cardiac cycle, T wave is repeated that leads to amplitude and frequency shift in detailed coefficients d1, d2 which is highlighted by circle in Figure 19(b).
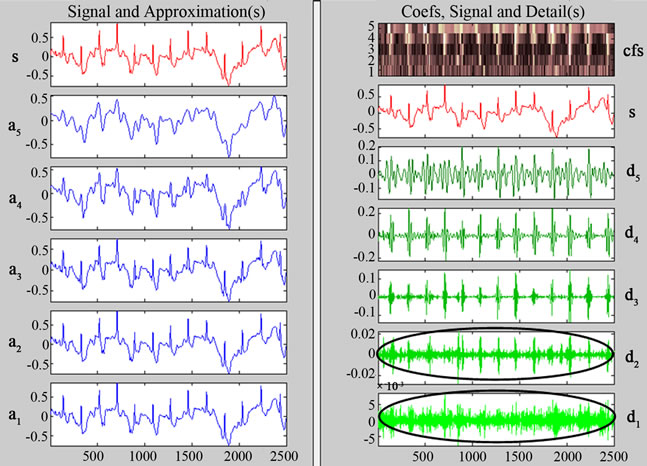
ECG signal of sudden cardiac arrest, its five scales of approximation coefficient a1 to a5 and decomposition coefficients d1 to d5 are shown in the left and right hand side of Figure 20. It is noted that the ECG is irregular from the normal wave pattern. In d1 and d2 coefficients, there are more changes in frequency compared to the normal ECG wave as highlighted. The decomposition coefficient d5 is extensively spread in the entire range of the signal with varying frequencies and amplitudes. From the results it can be concluded that detailed coefficients of wavelet transform can be used to analyses the normal and abnormal ECG signal.
6. SUMMARY
The objective of this work is ECG noise filtration, R Peak detection and wavelet analysis. The ECG data’s are obtained from the physio-bank database. From the database the ECG signals considered are normal, ECG of driver under stress, Sudden Cardiac arrest and Arrhythmia. FIR filter with Kaiser Window is used to remove the noises. The R-peak is detected in two techniques: a) Amplitude Threshold Value; b) Peak Prediction Technique. ATV uses threshold value to detect the peaks and is not effective and fails when ECG is having more artifacts. PPT identifies the R-peaks by combining threshold value and peak address position. So the R-peaks are detected more effectively compared to ATV. Analysis of ECG is done using Daubechies wavelet transform. The decomposition coefficients are considered and compared here. The d1 to d5 coefficients are studied for normal, ECG of driver under stress, Sudden Cardiac arrest and Arrhythmia. It was found that d1 to d3 coefficients reflects more in phase and frequency change in the abnormal signals compared to normal. PPT and wavelet is very useful tool for analyzing the ECG signals and help the physicians to identify cardiac disorders.
7. CONCLUSION
In this paper, ECG analysis using wavelet transform with PDA is presented. Kaiser Window incorporated with FIR filter is proposed as a tool for noise diminution. This approach has been tested for normal and abnormal ECG signals collected from the physio-bank database. Wavelet diagnosis helps in identifying the abnormalities in the ECG signal and it is reflected in its detailed coefficients. It can be concluded that the designed Kaiser based filter can remove the noises efficiently from the ECG. PPT is capable to detect the R-peak in ECG signal effectively when compared to ATV. The wavelets transform can be used in processing of ECG and other non-stationary signals. Most of the features in ECG signals can be obtained through the application of the wavelet transform. If the wavelet coefficients are having any amplitude or frequency variations compared with the normal ECG, it means that the ECG signal is abnormal. As know from the medical diagnosis, the ECG is extensively used for heart diseases and the high quality of signal is necessary to be achieved. Therefore, the presented technique in this work will help the physicians to identify clearly the deviations from the regular ECG patterns that indicate various cardiac disorders.
REFERENCES
- Saritha, C., Sukanya, V. and Murthy, Y.N. (2008) ECG signal analysis using wavelet transforms. Journal of Chemical Physics, 35, 68-77.
- Narayana, K.V.L. and Rao, A.B. (2001) Wavelet based QRS detection in ECG using MATLAB. Innovative Systems Design and Engineering, 2, 2222-1727.
- Bakul, G. and Tiwary, U.S. (2010) Automated risk identification of myocardial infarction using relative frequency band coefficient (RFBC) features from ECG. The Open Biomedical Engineering Journal, 4, 217-222. doi:10.2174/1874120701004010217
- Luo, S. and Johnston, P. (2010) A review of electrocardiogram filtering. Journal of Electrocardiology, 43, 486-496.
- Lee, J.-W. and Lee, G.-K. (2005) Design of an adaptive filter with a dynamic structure for ECG signal processing. International Journal of Control, Automation, and Systems, 3, 137-142.
- Mbachu, C.B., Onoh, G.N., Idigo, V.E., Ifeagwu, E.N. and Nnebe, S.U. (2011) Processing ECG signal with Kaiser Window-based FIR digital filters. International Journal of Engineering Science and Technology, 3, 6775-6783.
- Mahesh, S.C., Agarwala, R.A. and Uplane, M.D. (2008) Suppression of baseline wander and power line interference in ECG using digital IIR filter. International Journal of Circuits, Systems and Signal Processing, 2, 356-365.
- Leonardo, V.B., Elmar, U.K.M. and Luis, C.C. (2001) Compression of ECG signals by optimized quantization of discrete cosine transform coefficients. Medical Engineering & Physics, 23, 127-134. doi:10.1016/S1350-4533(01)00030-3
- Manikandan, M.S. and Dandapat, S. (2006) Wavelet threshold based ECG compression using USZZQ and Huffman coding of DSM. Biomedical Signal Processing and Control, 1, 261-270. doi:10.1016/j.bspc.2006.11.003
- Haque, K.M.F., Ali, Md.H., Kiber, M.A. and Hasan, Md.T. (2009) Detection of small variations of ECG features using Wavelet. ARPN Journal of Engineering and Applied Sciences, 4, 27-30.
- Zoltan, G.-S. and Petru, M. (2007) Wavelet transform based ECG signal denoising. Scientific International Conference, Romania, 15-16 November 2007, 1-7.
- Abdel-Rahman, A.-Q. and Khaled, D. (2010) ECG signal enhancement using wavelet transform. WSEAS Transactions on Biology and Biomedicine, 7, 62-72.
- Manikandan, M.S. and Soman, K.P. (2012) A novel method for detecting R-peaks in electrocardiogram (ECG) signal. Biomedical Signal Processing and Control, 7, 118-128.
- Salwa, A.K.M., Naser, El-S., Tolba, A.S., Abdelkader, F.M. and Hisham M.E. (2010) Wavelet packets-based blind watermarking for medical image management. The Open Biomedical Engineering Journal, 4, 93-98.
- Goldberger, A.L., Amaral, L.A.N., Glass, L., Hausdorff, J.M., Ivanov, P.Ch., Mark, R.G., Mietus, J.E., Moody, G.B., Peng, C.K. and Stanley, H.E. PhysioBank. PhysioToolkit, and PhysioNet: Components of a New Research Resource for Complex Physiologic Signal. http://physionet.ph.biu.ac.il/physiobank/database/mitdb/
- Manikandan, M.S. and Dandapat, S. (2007) Wavelet energy based diagnostic distortion measure for ECG. Biomedical Signal Processing and Control, 2, 80-96. doi:10.1016/j.bspc.2007.05.001
- John, D.E. and Joseph, D.B. (2011) Introduction to biomedical Engineering. 3rd Edition, Academic Press, Waltham, 2011.