Journal of Biomedical Science and Engineering
Vol.6 No.1(2013), Article ID:27045,11 pages DOI:10.4236/jbise.2013.61002
A novel approach for detection of deception using Smoothed Pseudo Wigner-Ville Distribution (SPWVD)
![]()
1Department of Biomedical Engineering, Shahed University, Tehran, Iran
2Faculty of Information and Communication Technology Engineering, Imam Hossein University, Tehran, Iran
3Faculty of Engineering, Islamic Azad University, South Tehran Branch, Tehran, Iran
Email: Elias.Ebrahimzadeh@yahoo.com
Received 25 September 2012; revised 2 November 2012; accepted 13 November 2012
Keywords: Lie-Detection; Electroencephalography (EEG); P300 Component; Odd-Ball Paradigm; Time-Frequency Transform
ABSTRACT
For many years, the uncertainty of lie-detection systems has been one of the concerns of defense related agencies. Clearly the results of these systems must be generalized by a high value of accuracy to be acceptable by judicial systems. In this paper, a new method based on P300-based component has been proposed for lie-detection. In this regard, the test protocol is designed based on Odd-ball paradigm concealed information recognition. This test was done on 32 people and their brain signals were acquired. After preprocessing, the classic features are extracted from each single trial. After that, time-frequency (TF) transformation is applied on the sweeps and TF features are produced thereupon. Then, the best combinational feature vector is selected in order to improve classifier accuracy. Finally, Guilty and Innocent persons are classified by KNN and MLP. We found that combination of Time-Frequency and Classic features have better ability to achieve higher amount of accuracy. The obtained results show that the proposed method can detect deception by the accuracy of 89.73% which is better than other previously reported methods.
1. INTRODUCTION
The detection of deception has a long history. The first proposed technology was the polygraph, which recorded autonomic arousal and was used in the determination of guilt or innocence [1]. A researchable hypothesis is that by looking at brain function more directly, it might be possible to understand and ultimately detect deception [2, 3]. Based on this hypothesis a number of neurophysiological signals have recently been investigated for the possible application to deception detection, including Functional Magnetic Resonance Imaging (fMRI) [4-10] and event related potentials (ERP) [2,11,12]. ERP based techniques have been more widely studied and have achieved more satisfying results [2,11]. Moreover, in [2] Farwell introduced another measure of participants’ responses to test items: the necessary time to classify each test item as a probe or irrelevant phrase reaction time (RT). Farwell approved that the response time to probe in guilty subjects is longer than innocent subjects while the response time to irrelevant stimuli are the same for both innocent and guilty subjects. Brain signal processing is one of the most common methods in detection of deception, first considered in the 1980s [13]. EEG background activities have been used in a few studies on detection of deception such as [14], however analyzing Event Related Potentials (ERPs), especially P300 wave form, has been becoming more popular in Guilty Knowledge Test (GKT) [15,16]. It has been shown that the P300 waveform is elicited in response to oddball paradigm; this paradigm is a sequence of usual stimuli in which some meaningful rare-unusual stimuli are presented [15]. P300 is a positive-going wave with a scalp amplitude distribution in which it is largest parietally (at Pz) and smallest frontally (Fz), taking intermediate values centrally (Cz). (Fz, Cz, and Pz are scalp sites along the midline of the head). Its peak has a typical latency of 300 - 1000 ms from stimulus onset. The size or amplitude of P300 at a given recording site is inversely proportional to the rareness of presentation; in practice, probabilities < 0.3 are typically used. The meaningfulness of the stimulus is also extremely influential in determining P300 size [17]. Also, GKT is a method of Polygraphy that is used in detection of concealed knowledge of the guilty persons. It is supposed that only guilty persons are aware of the detail information about the crime. Representation of these details in an oddball paradigm to guilty subjects will elicit P300 component in their EEG signals [19]. GKT method has three types of stimuli [18]:
1) Probe (P): This is related to crime that only guilty persons are familiar with this stimulus whereas innocents are not.
2) Irrelevant (I): This has not any relations with crime, so is unknown by all subjects.
3) Target (T): This is unrelated to crime but is known by all subjects.
The number of irrelevant stimuli is many times greater than the numbers of the other two types; and therefore probes and targets are rare stimuli. The T stimuli force the subject to pay attention to items, because failure in responding to these stimuli suggests that the subject is not cooperating [17]. Also, the T stimuli are rare and task relevant and thus evoke a P300 component that has been used in subsequent analysis of the probes as a typical P300 of the subject [2], although this assumption that the T-P300 is a classical rendition of standard P300 has been shown to be sometimes wrong [19]. The basic assumption in the P300-based GKT is that, if the subject has guilty knowledge of the probe stimuli, the infrequent nature of these items will cause them to elicit a P300 component like that for the T stimuli. However, if the person has no knowledge of the probe items, they will be perceived as belonging to the irrelevant stimulus set and thus elicit an ERP with only small or no P300 component. There are conventionally two approaches in the analysis of signals and detection of deception in P300-based GKT. In the first—used by Rosenfeld et al.—the amplitude of P300 response in P and I items are compared [19]. In guilty subjects, one expects P > I while in innocents P is another I and so no P-I difference is expected. Based on this theory, the Bootstrapped amplitude difference (BAD) method has been introduced and used by Rosenfeld. The second approach, introduced by Farwell and Donchin [2], is based on the expectation that in a guilty person, the P and T stimuli should evoke similar P300 responses, whereas in an innocent subject, P responses will look more like I responses. Thus, in this method the cross correlation of P and T waveforms is compared with that of P and I. In guilty subjects, the P-T correlation is expected to exceed the P-I correlation and the opposite is expected in innocents. However in many previous studies, GKT paradigm has been used in order to detection of concealed object recognition, it has been shown that the P300 component is also sensitive to concealed information recognition [13,20]. A simple method in ERP extraction is calculating the average of ERP-trials. In this method, the behavior of EEG background activity is assumed to be similar to the noisy signals and can be omitted by averaging, whereas ERP is a deterministic signal and remains in this process. One of the disadvantages of averaging method is to use a large number of single-trials to reduce the noises [21]. Because of difficulties of long-term EEG recording, it is reasonable to find some methods that are based on single-trials. In previous studies pattern recognition systems based on frequencywavelet and time domain analysis were introduced for P300 detection, in a P300-based GKT method [17,22]. Also, another method is introduced for ERP assessment in a P300-based GKT based on some wavelet features and a statistical classifier in [17].
In this study a new combinational feature vector which is obtained from Wigner Ville transform is introduced, then the principal component analysis (PCA) is applied to the optimal feature vector and finally two classifiers are used to discriminate between guilty and innocent subjects in a concealed information recognition test. Thus, a new algorithm has been presented for lie detection using ERPs sweep. In this algorithm, after preprocessing of EEG signal, and probe sweeps extraction, first some suitable features are extracted from each single trial. These features such as morphological and frequency features (classic features) will be those ones which contain suitable information about the inspected phenomena. In the next stage, time-frequency transformation is done on the sweeps and some other features are produced. The best features are selected in order to achieve the best combinational feature vector which is optimal. Then, PCA is applied to the feature space to reduce the features dimension. Finally, Multilayer perceptron (MLP) neural network and K-Nearest Neighbor (KNN) are used to classify guilty subjects and those of innocents. In Figure 1 summary of the algorithm is shown. Generally speak-

Figure 1. Flowchart of proposed algorithm.
ing, the aim of our research is to find a new combinational feature space from classic (morphological and frequency features) and Wigner-Ville features in order to detect Innocent and Guilty subjects, and also to compare its performance with the obtained results using the wavelet features and previously reported methods.
2. PARTICIPANTS
Thirty two Iranian subjects participated in the experiments that were generally undergraduate or postgraduate students and all had normal or corrected vision participated in this study. They did not have any neurological disease. Participants were naive to the experimental design. The mean age was 25 years. Data from three sub jects were discarded because of too many artifacts or machine failure.
3. DATA ACQUISITION
Thirty-two subjects participated in this study. They were randomly divided into two groups (16 guilty cases and 16 innocent ones). The implementation methodology used in this study is the same as method which was employed in the Ref [23].
EEG data was recorded by using Ag/AgCl electrodes which were placed at midline sites of the head (Fz, Cz and Pz); But only the results of Pz channel would be analyzed. The vertical and horizontal EOG were recorded. EEG was recorded continuously and digitized with a sampling rate of 256 Hz. All signals were filtered in the range of 0.5 - 30 Hz by a zero phase digital filter.
Procedure: Before experiments, seven different slides presenting seven different words were prepared for each subject. These slides were presented randomly and each one lasted 1500 ms with the 40 iterations on the computer screen with an inter stimulus interval of 1000 ms. Among these seven slides, one was probe stimulus, the other was target and the rest were irrelevant stimuli. It is necessary that subjects (both Guilty and Innocent) recognize the target stimuli well, thus it should be a word (name) related to one of subjects family members or from well-known people such as sport stars, politicians or movie stars and also from the most famous landmarks (such as most famous monuments, city icons, places of power and worship, sacred mountains and etc.). Slides of meaningless words were used as irrelevant. Probe for guilty subjects were taken from a meaningful word. In the case of innocent subjects, the word slide of probes had not been seen by them and they didn’t have any information about those words.
Two push buttons were given to each hand of the subjects and all subjects were asked to press one of them whenever they want to say “Yes, I know”, and press another one when they want to say “No, I don’t know”. Innocent subjects replied honestly to all stimuli, but guilty subjects replied honestly only to target and irrele vant ones. They replied falsely to probe stimulus.
Figure 2 shows different examples of slides shown to Guilty and Innocent subjects. As can be seen, these slides include different meaningful and meaningless words. Meaningless words are produced using some randomly selected characters. Whereas, name of famous places or know persons have been chosen as meaningful words.
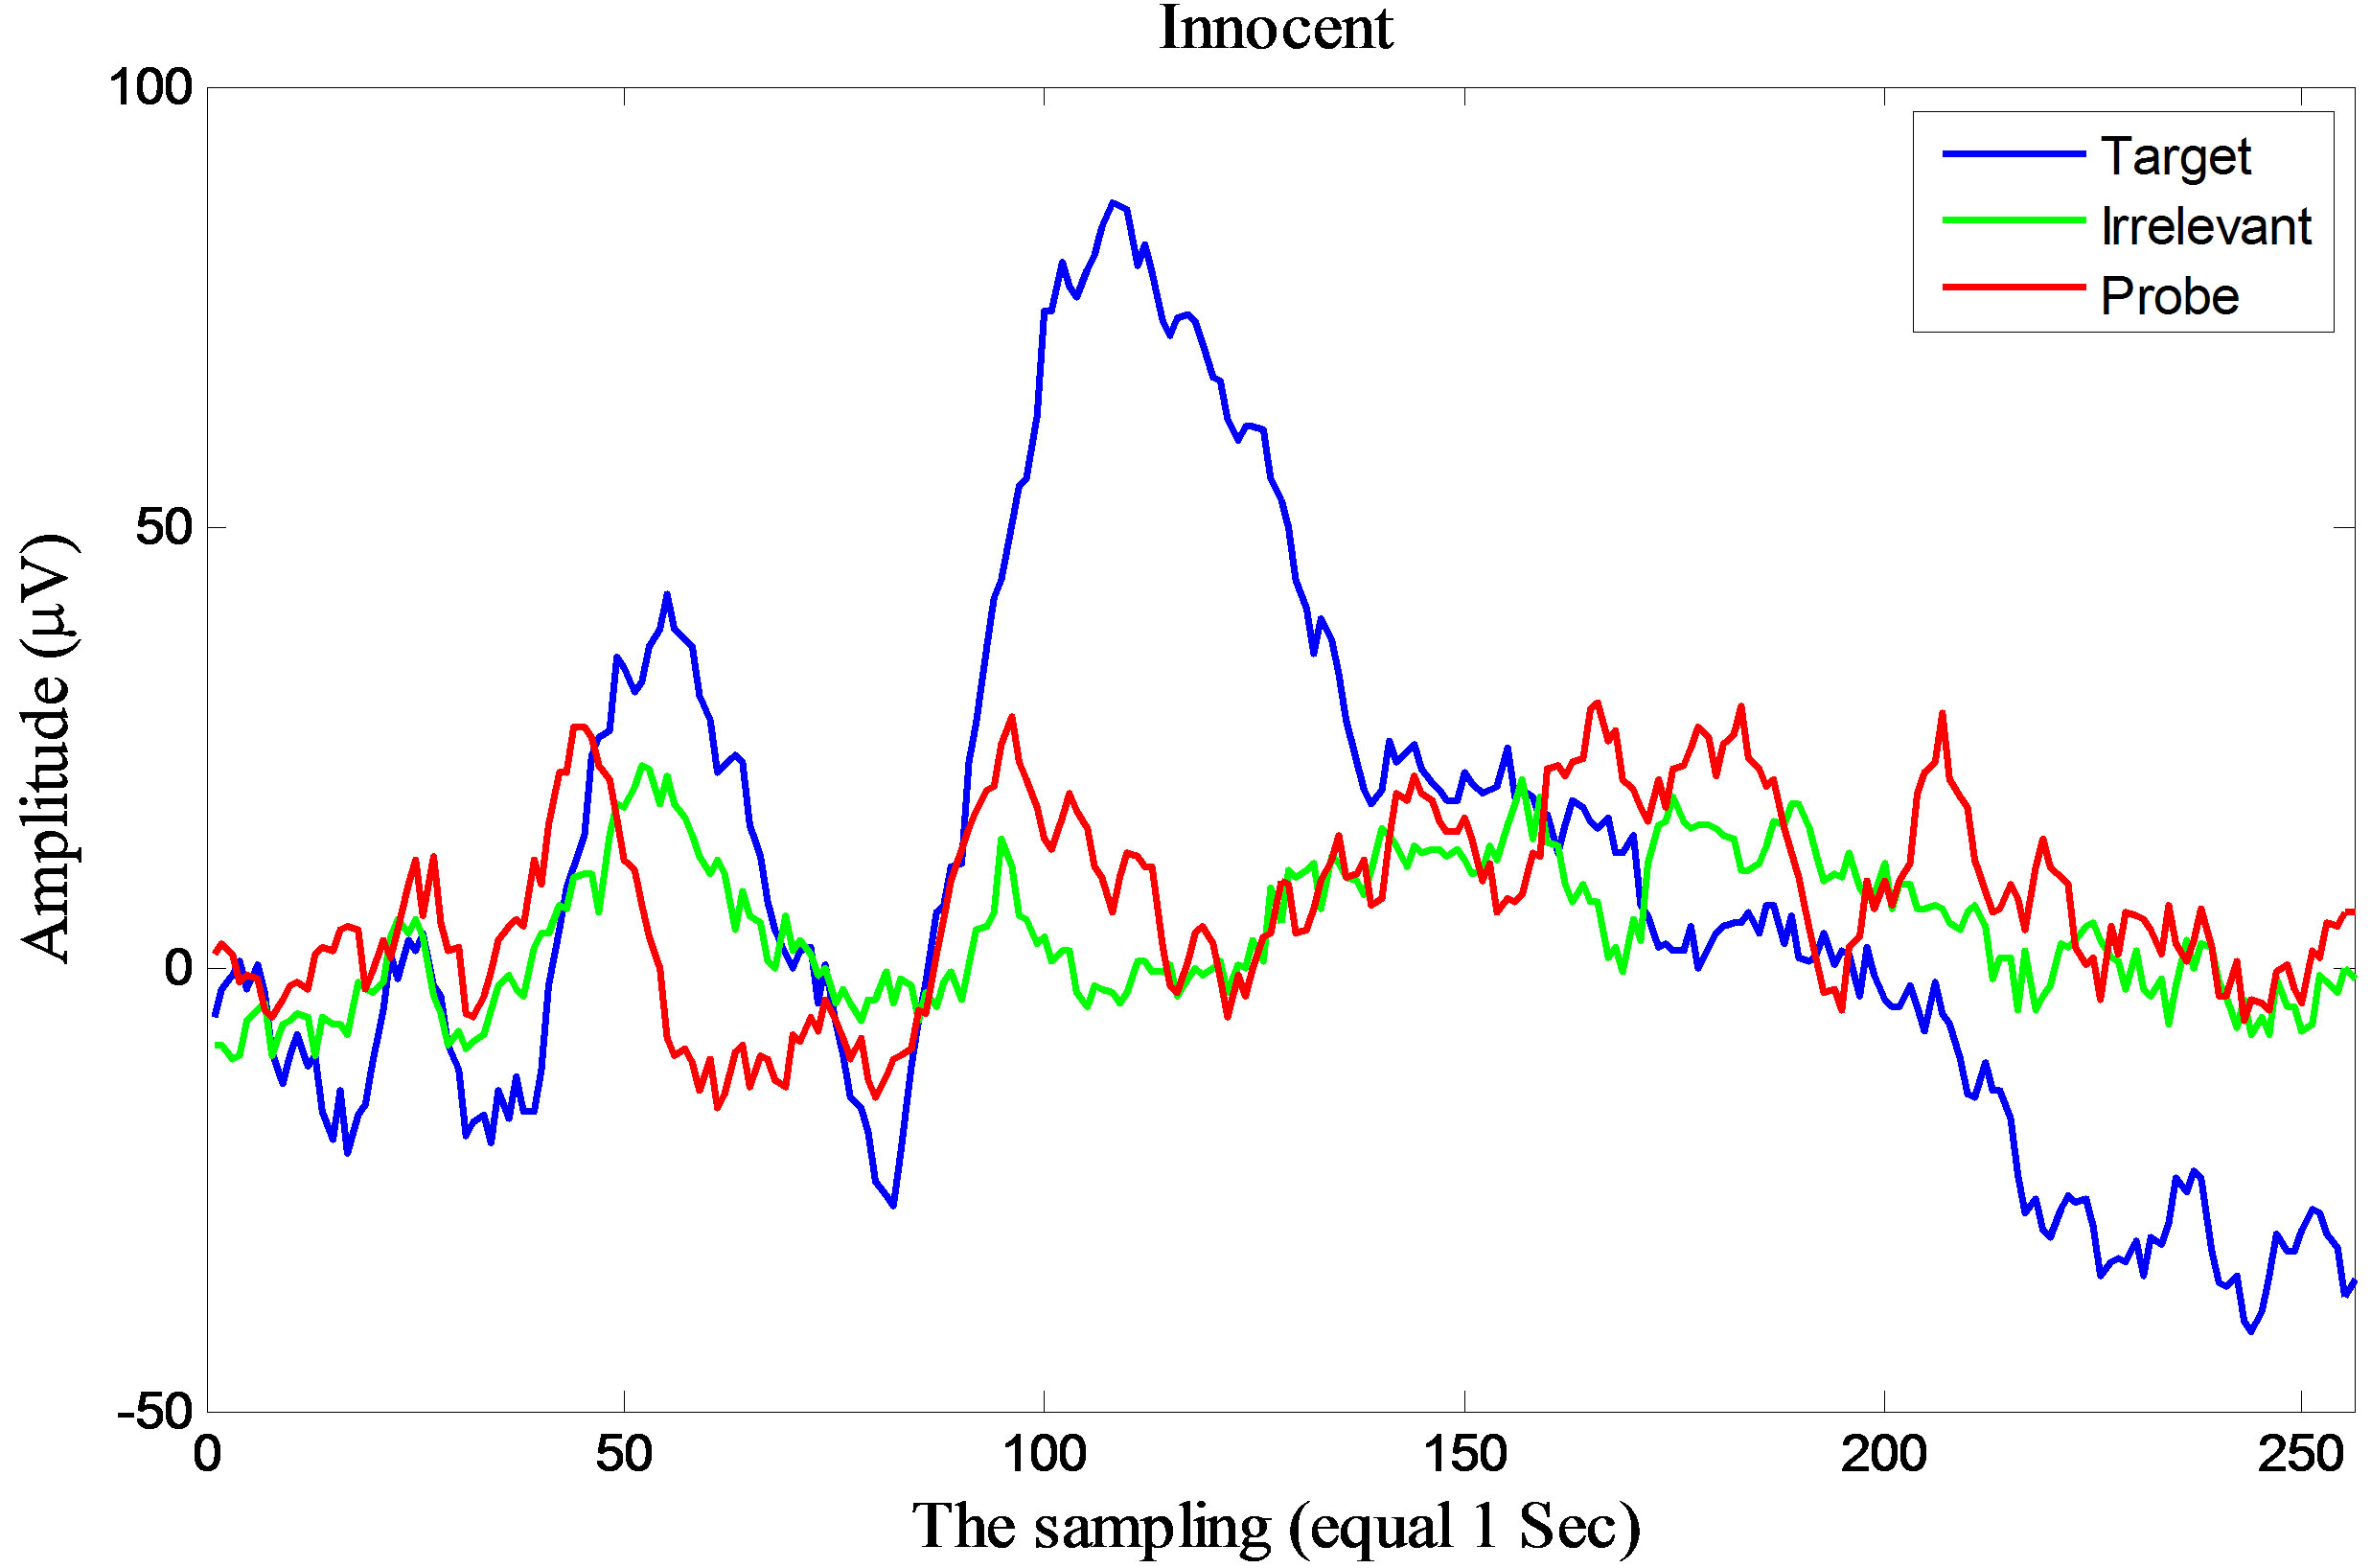
Figure 3 shows a one-second of EEG signal for both a guilty subject (a) and an innocent (b). It is reminded that each observation is obtained by average of single-trials of all 20 iterations for each subject. As it is seen in Figure 2(a), there is no P300 component in the probe stimulus of the innocent subject (It is not built) and is similar to the irreverent stimulus. That is because of the fact that the probe stimulus of the innocent subject is obtained by showing a meaningless word. However, the probe stimulus of the guilty subject which is shown in Figure 2(b) contains P300 component and is similar to the Target stimulus because of the guilty given answer (“I don’t know”) to the “slide of a meaningful word”(i.e., her/his name ).
4. MATERIAL AND METHODS
Based on the previous studies, in this research, two types of Morphological and Frequency features as Classic features have been proposed. These features have shown good performances in similar studies and hence, were

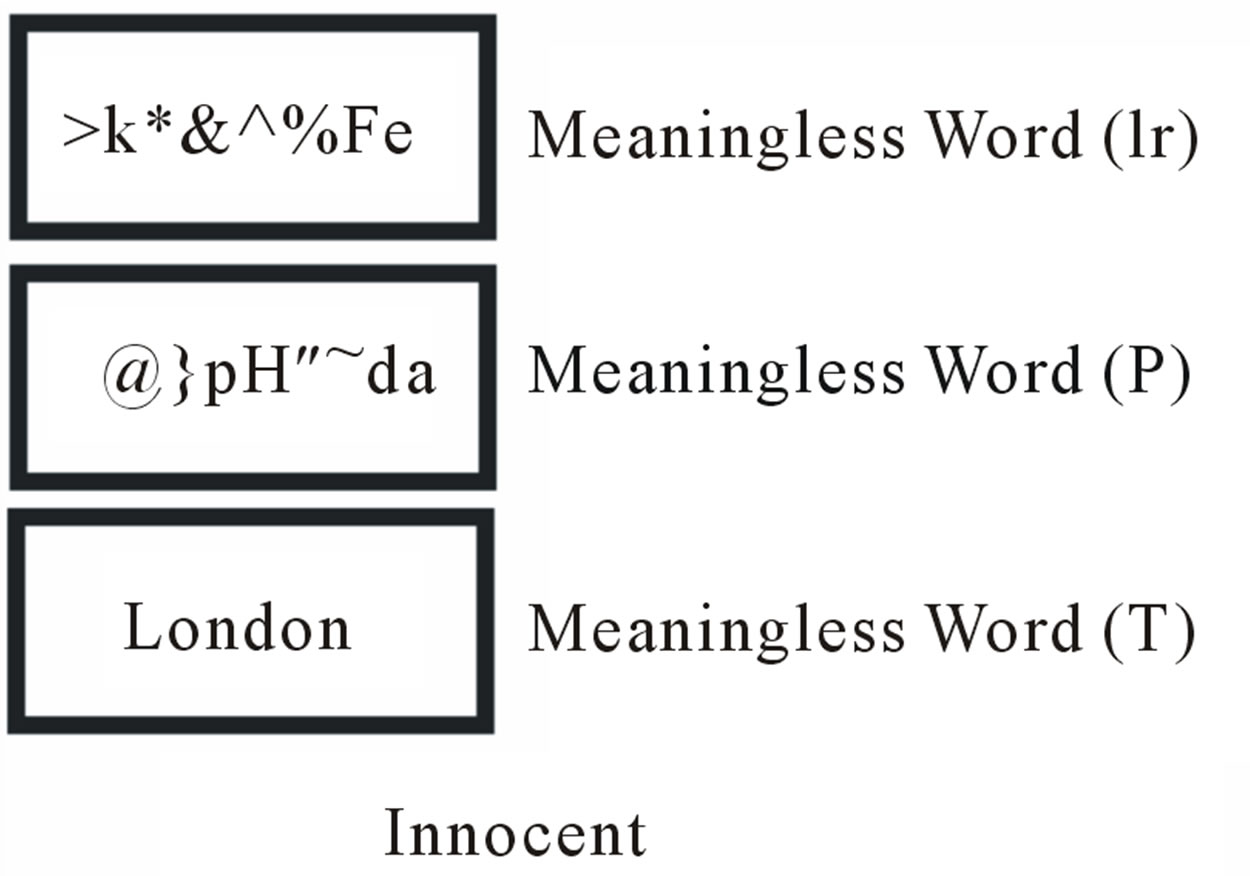
Figure 2. Some examples of slids represented to Guilty and Innocent groups for data acquisition. P and Ir slides are randomly shown for 40 times, and T slide is shown for one time to each subject.
 (a)
(a) (b)
(b)
Figure 3. Averaged EEG signals of single-trials of all 20 iterations after showing target, irrelevant and probe slides for two typical subjects: (a) Innocent subject; (b) Guilty subject.
believed to be useful as well for this application. Then, time-frequency transform features have been suggested that those are extracted through the Wigner Ville transform because it provides better time frequency resolution than nonparametric linear methods (i.e., wavelet and short-time Fourier transform), an independent control of time and frequency filtering, and power estimates with lower variance than parametric methods when rapid changes occur.
4.1. Pre Processing
After the filtering of signals, each continuous record was separated to single sweeps according to the known times of stimulus presentation. The length of each sweep is 1000 ms which contains 256 samples of signal. EOG data were checked for blink artifact by visual inspection and sweeps with blink artifacts were removed.
It should be noted that, in all description of P300 follow, only the results at site Pz was noted, since Pz is the site where P300 is usually reported to be maximal and therefore the analytic procedure (below) were performed on Pz data only.
4.2. Classic Features Analyses
These features are morphological and frequency features will be those which contain suitable information about the inspected phenomena.
4.2.1. Morphological Features
First group of features contains 17 morphologic features. These features were previously used by Kalatzis et al. in discriminating depressive patients from healthy controls using the P600 component of ERP signal [24]. These features are defined and calculated as follows [17] (due to the characteristics and typical delay of cognitive components of ERP, the time interval was confined between 400 ms and 800 ms after stimulus):
1) Amplitude (smax): the maximum signal value
 (1)
(1)
2) Absolute amplitude (|smax|).
3) Latency time: the time where the maximum signal value appears
 (2)
(2)
where s(t) is the ERP single trial during 400 - 800 ms after stimulus and smax is the maximum signal value in this time interval.
4) Latency/amplitude ratio ( ).
).
5) Absolute latency/amplitude ratio ( ).
).
6) Positive area (Ap): the sum of the positive signal values
 (3)
(3)
7) Negative area (An): the sum of the negative signal values
 (4)
(4)
8) Total area (Apn): the sum of the positive and negative signal values
 (5)
(5)
9) ATAR (|Apn|): Absolute total area.
10) TAAR (Ap|n|): Total absolute area.
 (6)
(6)
11) AASS :Average absolute signal slope 
 (7)
(7)
where τ is the sampling interval of the signal, n the number of samples of the digital signal, and s(t) the signal value of the sample.
12) Peak-to-peak (pp):
pp = Smax − Smin (8)
where Smax and Smin are the maximum and the minimum signal values, respectively:
 (9)
(9)
13) Peak-to-peak time window (tpp):
 (10)
(10)
14) Peak-to-peak slope :
:
 (11)
(11)
15) Zero crossings (ZC, nZC): the number of times t that s(t) = 0, in peak-to-peak time window:
 (12)
(12)
where  = 1 if s(t) = 0, 0 otherwise .
16) Zero crossings density (ZCD, dZC)—zero crossings per time unit, in peak-to-peak time window:
 (13)
(13)
where nZC are the zero crossings and tpp is the peakto-peak time window.
17) Slope sign alterations (nsa): the number of slope sign alterations of two adjacent points of the ERP signal:
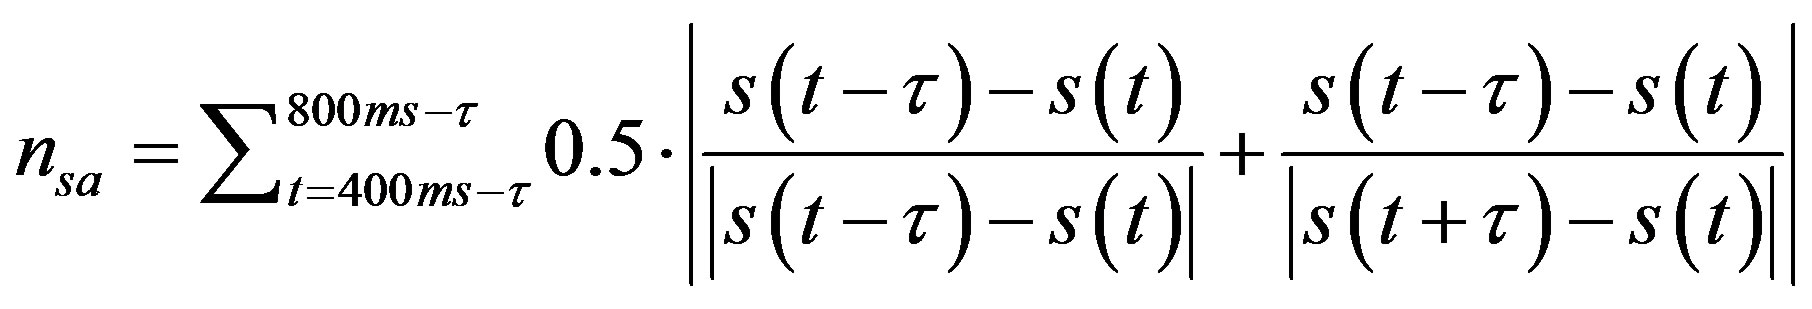 (14)
(14)
where τ is the sampling interval of the signal (τ = 3.9 ms, for the sampling rate of 256 Hz).
4.2.2. Frequency Features
The second group of defined features is three frequency characteristics of the signals. These features are mode frequency, median frequency and mean frequency, [17,25-28] which are described and calculated as follows:
1) Mode frequency: fmode is the frequency with the most energy content in the signal spectrum, so the maximum amplitude in the power spectrum density of the signal is at this frequency:
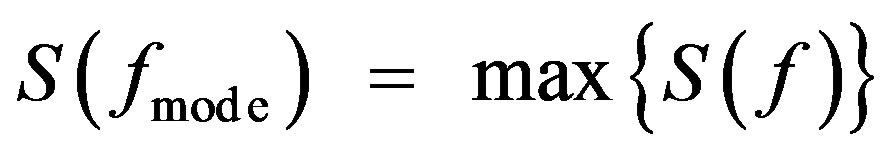
S is the power spectral density of signal and f is frequency.
2) Median frequency: Median frequency (fmedian) separates the power spectrum into two equal energy areas and is calculated from the following equation:
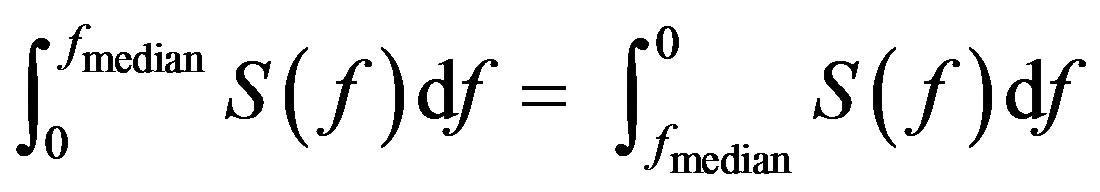 (15)
(15)
3) Mean frequency: Mean frequency (fmean) represents the centroid of the spectrum and is calculated from the weighted averaging of the frequencies in the power spectral density of signal:
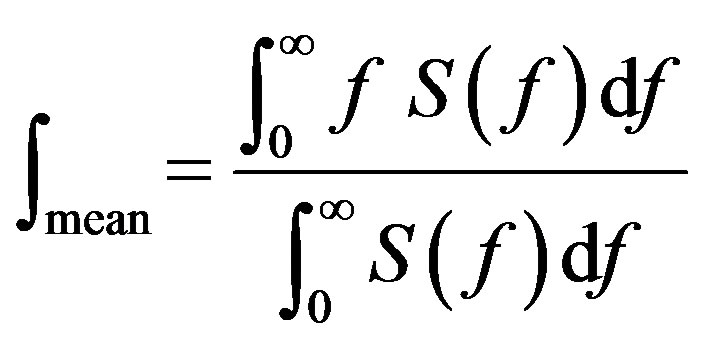 (16)
(16)
4.2.2.1. Time-Frequency Domain Analysis Time-frequency (TF) analysis transforms time-domain signals into the so called time-frequency distribution (TFD), which can be interpreted as joint (simultaneous) distributions of signal energy in the time and frequency domains, without the scaling effects of wavelet transforms [29].
An approach to analyze non stationary EEG signal, is time-frequency (TF) methods. This can be divided into three main categories: nonparametric linear TF methods based on linear filtering, including the short-time Fourier transform [30-32] and the wavelet transform [33-39], nonparametric quadratic TF representations, including the Wigner-Ville distribution [40-42] and its filtered versions, and parametric time-varying methods based on autoregressive models [43-50] with time-varying coefficients. In this paper the Smoothed Pseudo Wigner-Ville distribution (SPWVD) is preferred since it provides better time frequency resolution than nonparametric linear methods, an independent control of time and frequency filtering, and power estimates with lower variance than parametric methods when rapid changes occur [51]. The main drawback of the SPWVD is the presence of cross terms, which should be suppressed by the time and frequency filtering. The SPWVD of the discrete signal x(n) is defined by .
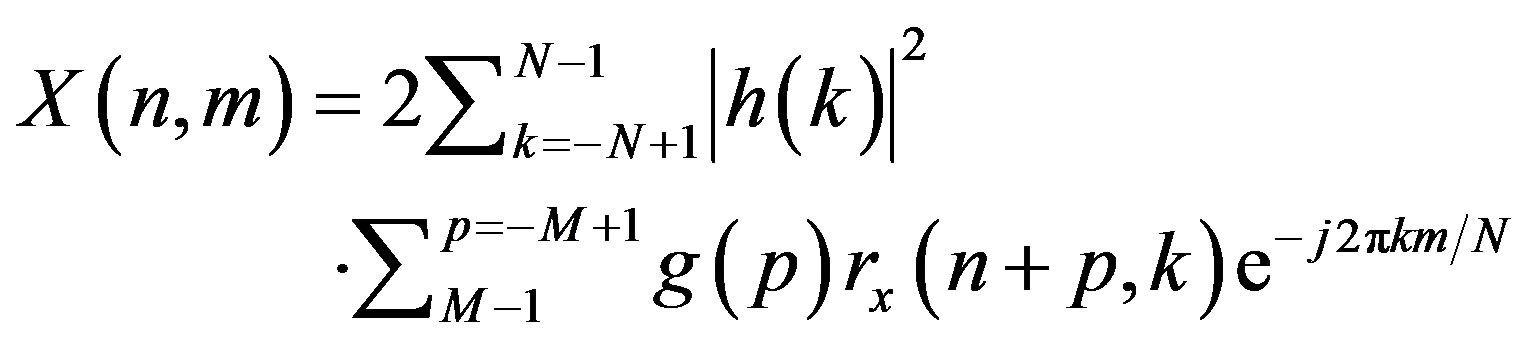 (17)
(17)
where n and m are the discrete time and frequency indexes, respectively, h(k) is the frequency smoothing symmetric normed window of length 2N − 1, g(p) is the time smoothing symmetric normed window of length 2M − 1 and rx(n, k) is the instantaneous autocorrelation function, defined as
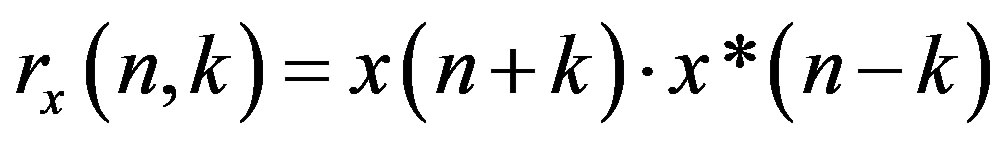 (18)
(18)
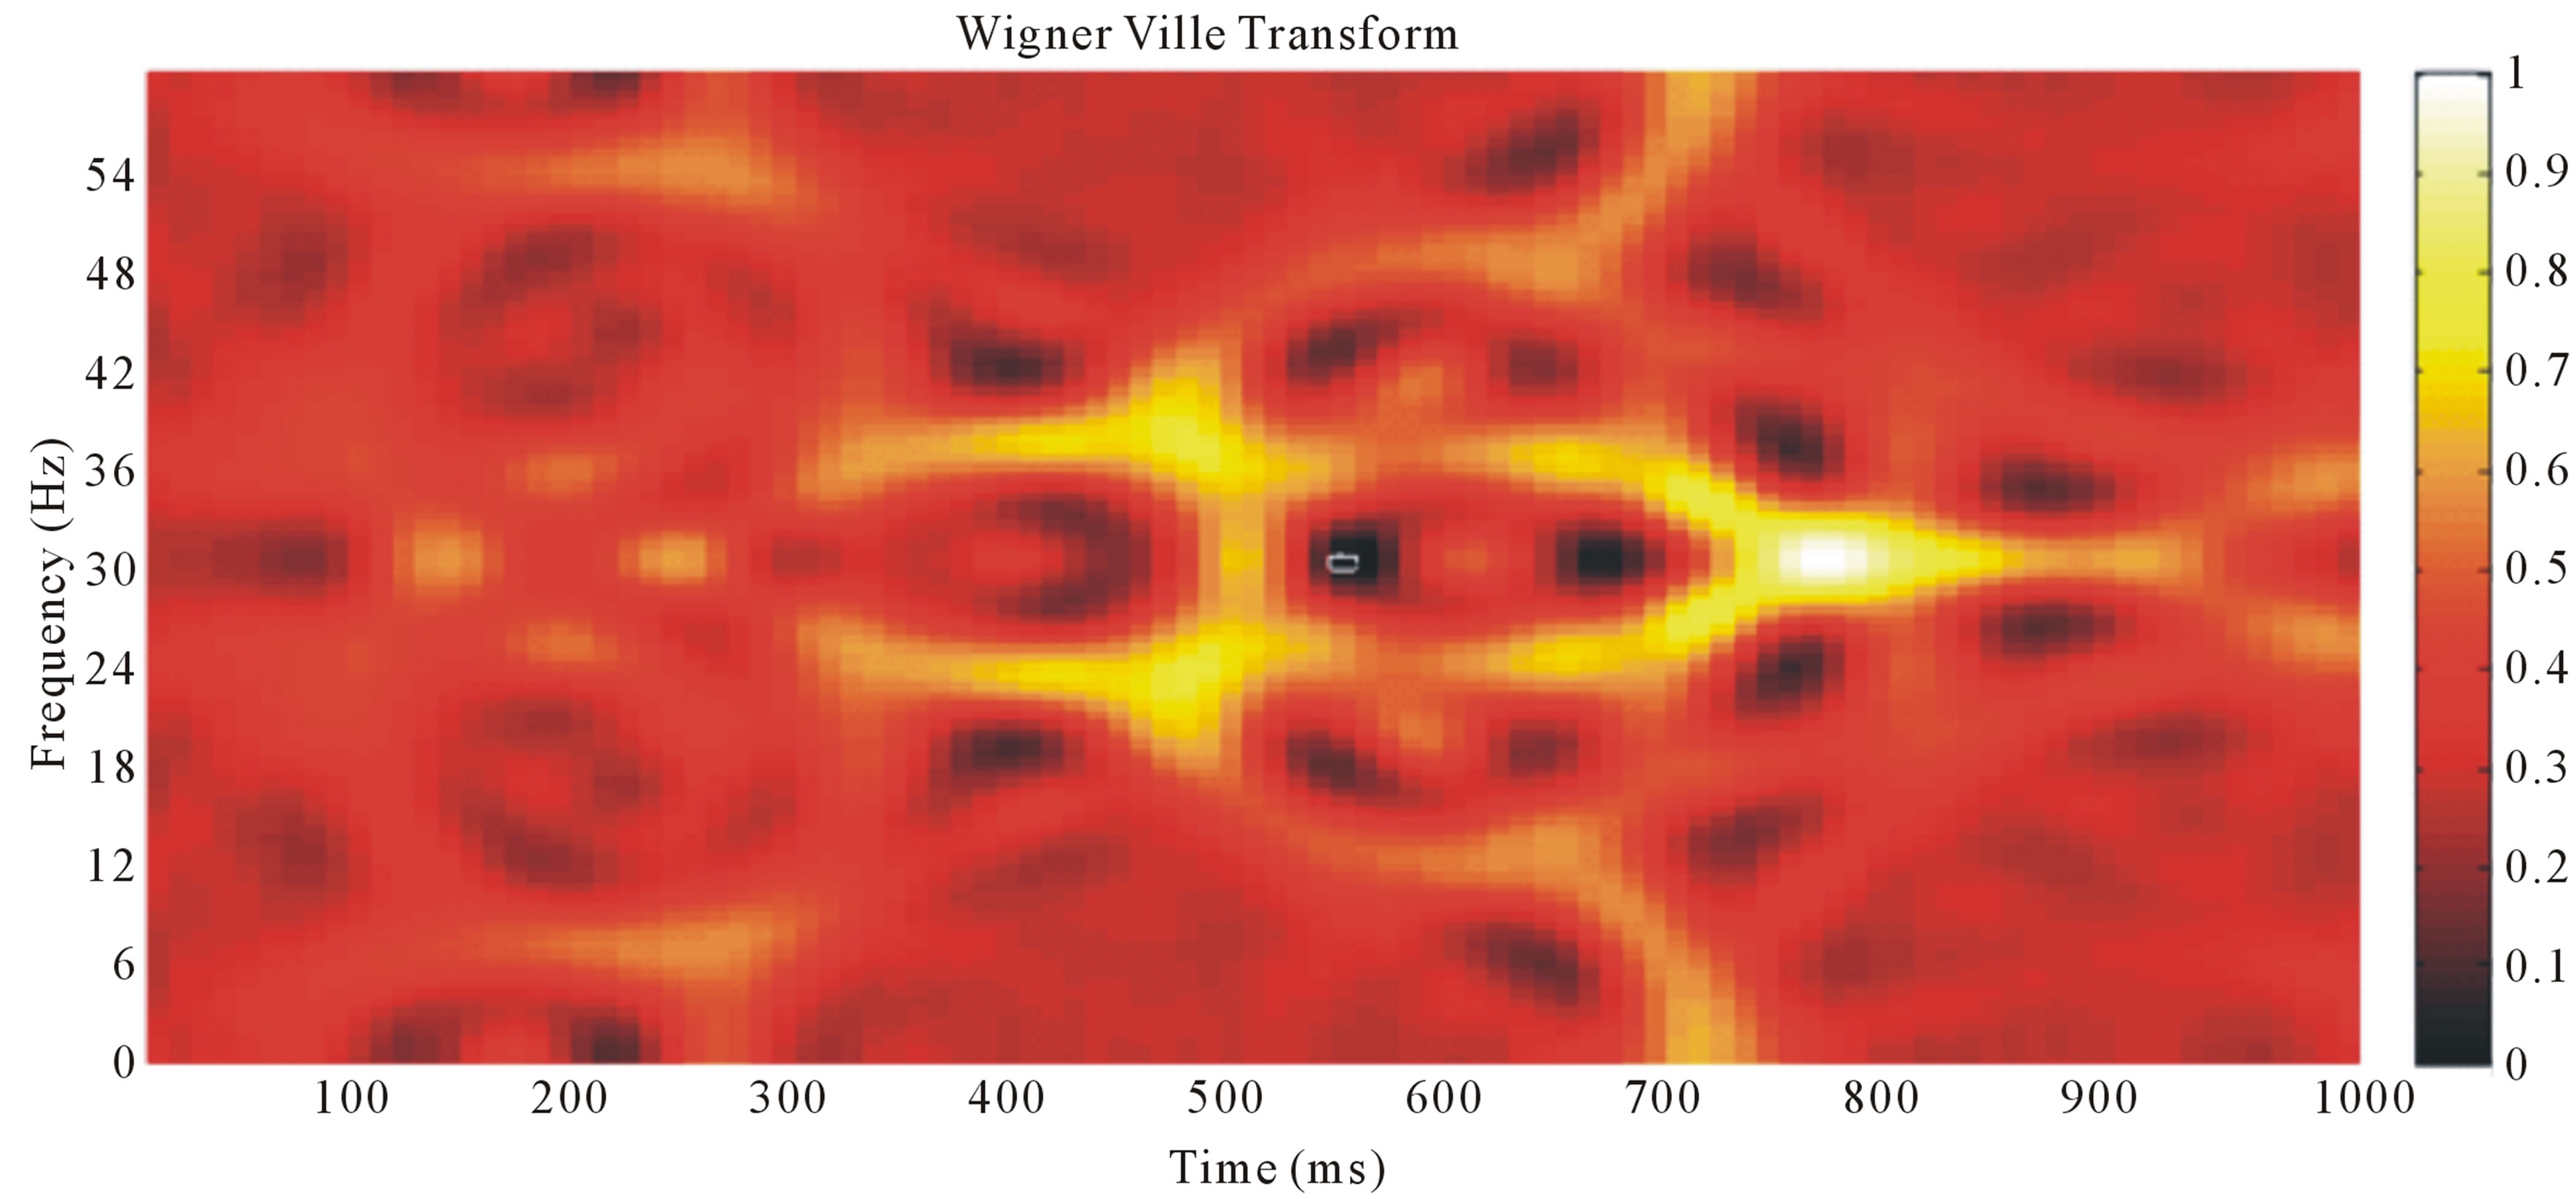
Figure 4 shows the result of applying Wigner Ville transform to the probe signal.
4.2.2.2. TF Features Extraction Each probe sweep is divided into 10 segments of equal length; each segment is approximately 100 ms in time domain. Then, the average energy of each segment was computed using our previously reported method in [52]. The features are:
FLT: Frequency of latency time (i.e., the frequency of the time where the maximum signal value appears).
MAX w: maximum amount of energy in each window.
MIN w: minimum amount of energy in each window.
DIF w: difference between maximum and minimum amount of energy between windows.
STD w: standard deviation between energy of time windows.
The obtained signal in TF domain is also divided into four frequency segments according to the brain wave frequency as below:
EDelta: the complex of energy signal in Delta frequency band (0.5 - 4) Hz, divided by length of band (3.5).
ETheta: the complex of energy signal in Theta frequency band (4 - 8) Hz, divided by length of band (4).
EAlpha: the complex of energy signal in Alpha frequency band (8 - 13) Hz, divided by length of band (5).
EBeta: the complex of energy signal in Beta frequency band (13 - 30) Hz, divided by length of band (17).
FDelta: the average of energy signal in Delta frequency band (0.5 - 4) Hz.
FTheta: the average of energy signal in Theta frequency band (4 - 8) Hz.
FAlpha: the average of energy signal in Alpha frequency band (8 - 13) Hz.
FBeta: the average of energy signal in Beta frequency band (13 - 30) Hz.
Also, we have defined the first order derivative as a feature to show the difference between adjacent windows. This derivative is the difference between the average energy in subsequent windows, so the first order derivative feature is computed as below
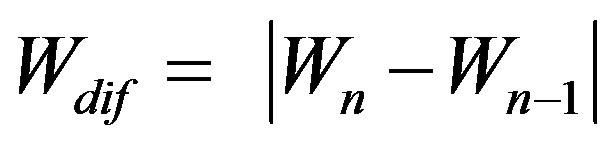 (19)
(19)
where Wn: average energy in window of n W(n–1) : average energy in window of (n – 1)
The result of features survey in time span of 100 ms illustrate that in guilty person the features changes from one window to next window is much more prominent so we define the first order derivative .
The defined features (34 features) were extracted from all probe sweeps of all subjects.
5. FEATURE SELECTION AND REDUCTION
5.1. Feature Selection
In any classification task, there is a possibility that some of the extracted features might be redundant. These features can increase the cost and running time of the system, and decrease its generalization performance. In this way, the selection of the best discriminative features plays an important role when constructing classifiers. To identify the best features (for classification) in feature space, searching selection method is applied. In such a way, first the classification has been applied separately to each feature. The best feature has been selected in accordance with the most value of classification accuracy. This feature will be combined with the other individual
 (a)
(a)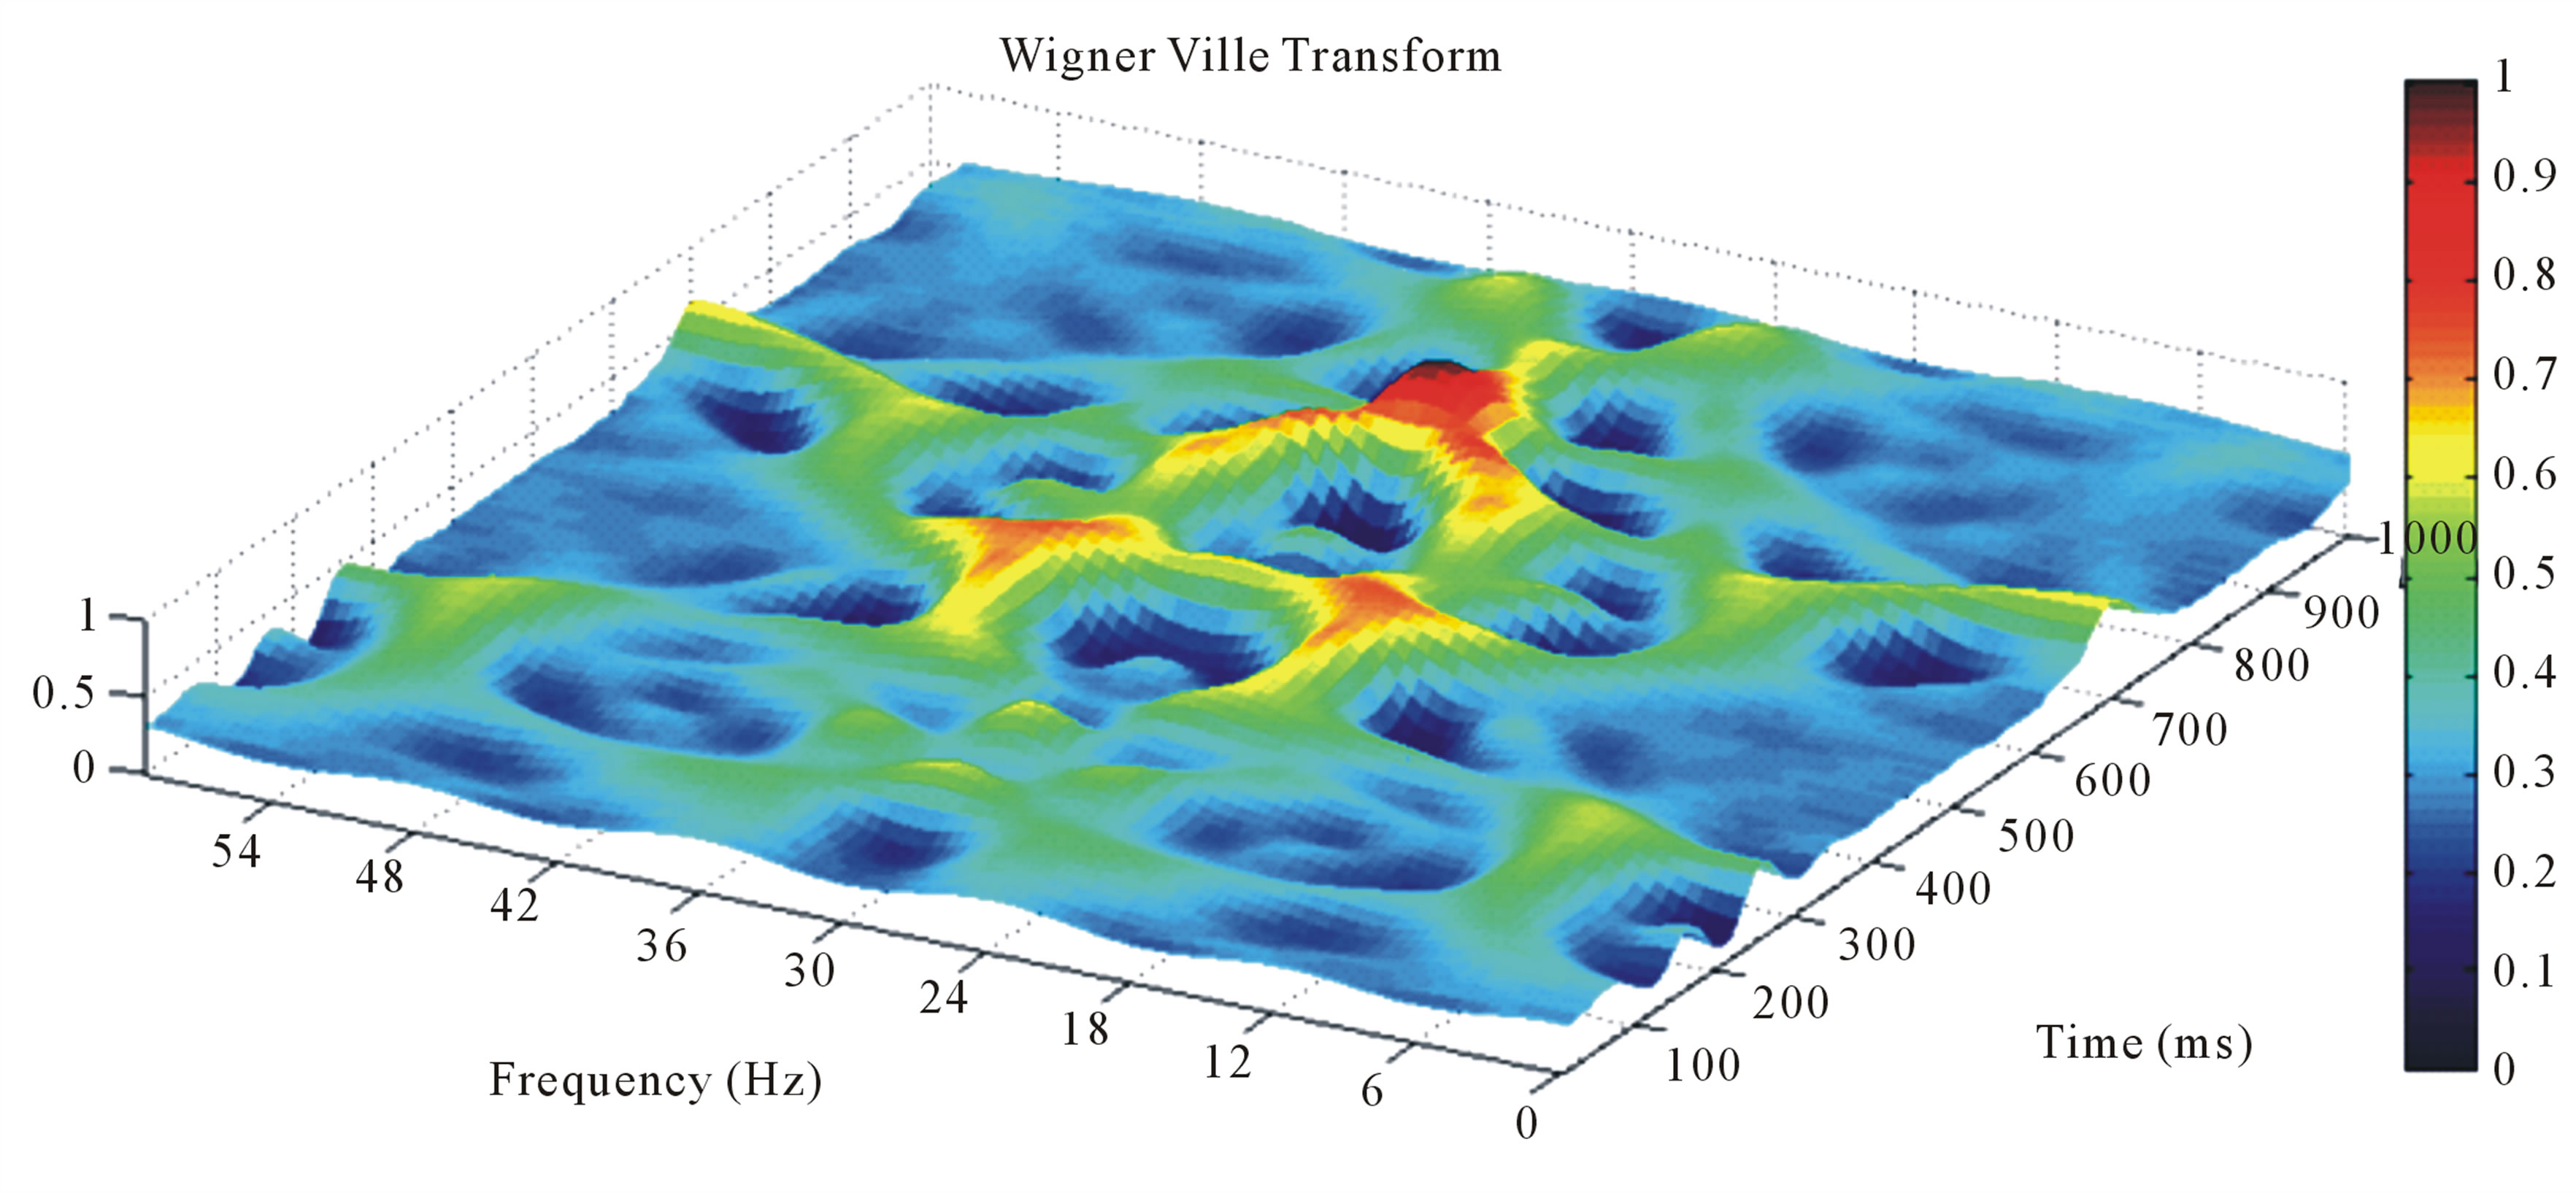 (b)
(b)
Figure 4. Wigner Ville transform of the probe signal of a guilty person: (a) 2D view; (b) 3D view.
features and thus the best pair combination will be produced. This process would be counting to achieve the best combination of features.
5.2. Principal Components Analysis
In order to reduce the dimensionality of input features, and to select the discriminating features, and to have better classification performance, and reduce the learning time, the principal components analysis (PCA) is used. The goal of the use of PCA, is finding a transform matrix to maximize the between class distribution and minimize the interclass distribution [53-57]. The obtained features from feature selection method (26 features) and without feature selection (34 features) were reduced to 21 and 25 features, respectively, by using PCA technique.
6. CLASSIFICATION
To discriminate between the probe stimuli of the guilty and innocent person, the Multilayer perceptron (MLP) neural network and k-Nearest Neighbor (KNN) classifier have been used. The extracted Features from the probe sweep of the guilty person were compared with the innocent person. For each subject, the probe sweeps of other subjects with their real labels (G-probe/I-probe) were used as training data, and then the trained classifier applied on the probe sweeps of the given subject.
6.1. Multilayer Perceptron Neural Network
The classifier using a three-layer MLP with error back propagation algorithm and variable learning rate. The input layer has a number of nodes equal to the input vector length. The output layer consists of one node, accounting for a possibility of only 2 classes to be classified. Also, all the possible combinations of the selected numbers of neurons in the hidden layer were selected and trained and finally the optimized number was equal to 5. The output nodes had linear transfer functions, and the hidden layer used a sigmoid function. Network training continued until the mean square error became less than 0.01 or the number of training iterations reached to 1000. Due to the limited input data set, Leave One Out crossvalidation method was done for training [58,59]. At each stage one of observations was selected as test data and 31 as train data, and this process repeated 32 times. Network error in each step was computed, and finally the average was calculated. One advantage of this approach is that all the input data set are present in both processes (train and test).
6.2. k-Nearest Neighbor
k-Nearest neighbor (KNN) algorithm is one of the most effective non-parametric methods in pattern recognition [60]. The k-NN algorithm is a method for classifying objects based on their distance to the training examples in the feature space. The algorithm is independent from statistical distribution of training examples. There are several distance measures that might be used in this algorithm. However Euclidean distance is commonly preferred as the distance measure. An object is classified by the majority vote of its neighbors, and the object is assigned to the class most common among its k nearest neighbors. The number k is usually chosen small. If k = 1, then the object is simply assigned to the class of its nearest neighbor. The selected feature set is then used to determine the best value of k for the classifier. Therefore, different numbers of nearest neighbors (k = 1, 3, 5, 7, 9, 11, 13) are tested in the k-NN classifier to obtain the best performance for the classifier [61]. Performances of all classifiers are calculated based on their accuracy. The maximum performance is provided by a 7-nearest neighbor classifier.
7. RESULT
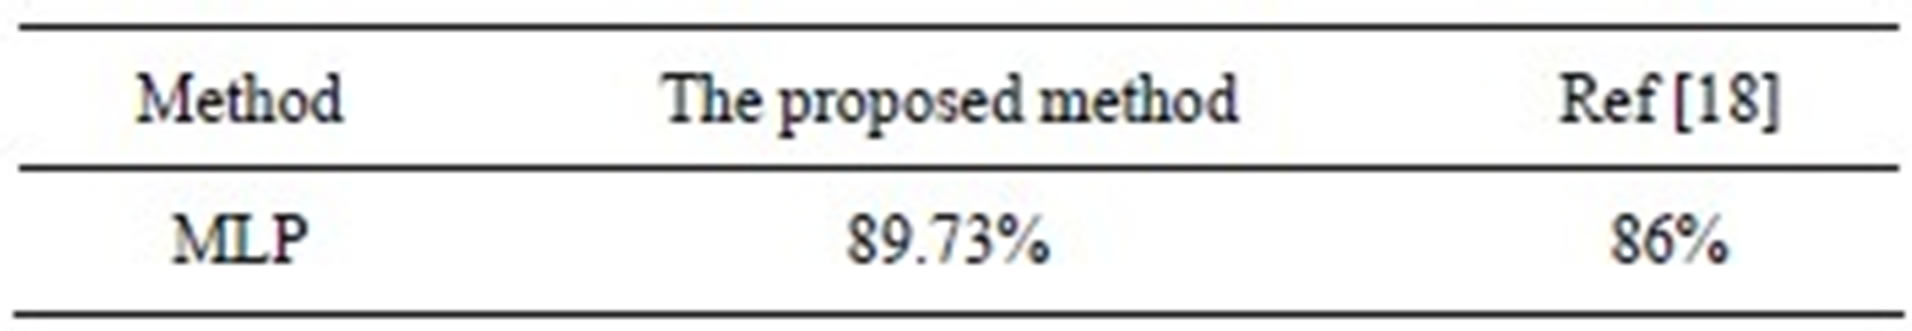
In this research, many types of features have been investigated to classify the Guilty and Innocent subjects. In this regard, after extraction of features, has been tried to find the best combinational feature vector through the feature selection method. Also, to improve the performance of the classifier and reduce the execution time, PCA method is applied and finally Guilty and innocent subjects are classified using a classifier which has the best accuracy in comparison with others. Mean values of the accuracy of classification for both MLP neural network and KNN classifier are given in Table 1. This table shows how simultaneous usage of Feature selection and PCA can increase the accuracy. As can be seen, in both cases (using of MLP or KNN), PCA has better results in comparison with Feature Selection whereas simultaneous usage of Feature Selection and PCA methods for producing a new combinational feature vector has increased the accuracy by 4% - 5%. Considering the obtained results, it’s clear that the optimal combinational feature vector has more ability to distinguish between Innocent and Guilty subjects. Table 2 shows the results of our proposed method and ones reported in [18]. As it is seen, the deception detection accuracy has been improved from 86% to 89%. It has been investigated that because of the presence of independent Time-Frequency controllers and also simultaneous usage of Time and Frequency information, extracted features from Wigner-Ville transform are better than wavelet based analyses.
8. DISCUSSION
P300-based GKT, as a new method for the psychophysiological detection of concealed information, was tested on innocent and guilty subjects who were concealing information regarding a mock crime committed as a part of the experiment.
As can be seen in Figure 1(a), EEG Acquisition through Odd-ball paradigm indicates that P300 component is sensitive to the “meaningful word” which is consistent with this notion that P300 component is sensitive to the “concealed information” [18,21,24]. In other words, the unexpected and significant stimulus of Target (T) and Probe (P) lead to the same production of P300- based brain responses in the guilty subject. Whereas, in the innocent subjects the response of probe stimulus is more similar to the response of Irrelevant stimulus.
Therefore these results are in accordance with our ex-
Table 1. The accuracy values of MLP and KNN classifiers with the feature dimension reduction methods (individual and combinational) for Guilty and Innocent groups.
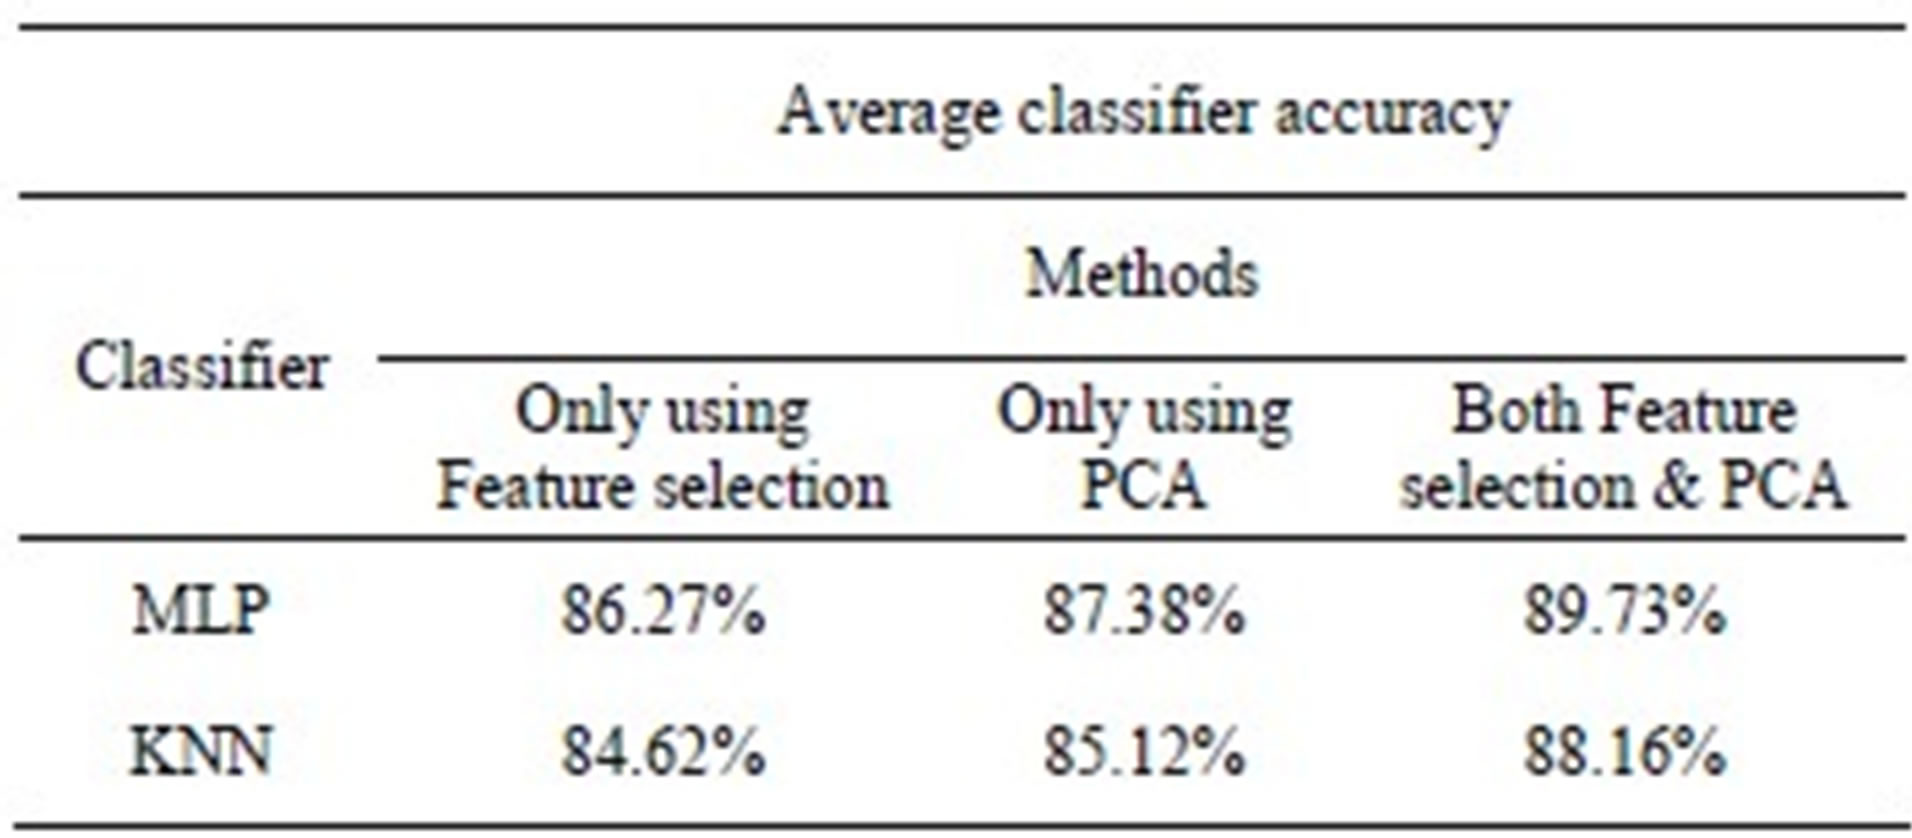
Table 2. Lie detection accuracy values for the proposed method and the method used in [18].
pectation that probe stimuli result in larger P300 in guilty subjects than innocents. Also the significant increase in positive area and total area features and the significant decrease in all frequency features for the guilty subjects are in accordance with the appearance of a positive peak with low frequency content (P300) in the brain response which is according to previous studies in [18].
In this research, by attention to the Oddball paradigm, some changes have been applied to the common GKT methods and the manner of implementation the reference test [24] so that the detection rate of P300 component improves in recognition of Concealed information and classification of Innocent and Guilty subjects. Also, in comparison with [24], the test time has been increased which is equivalent to increase the probability of number of iterations in the Oddball paradigm (increased from 30 to 40). Nevertheless, the negative outcomes of this task (to be tired, get used to the seeing the images, and an increase in the rate of blink artifact) must be considered. The obtained results show that an increase of the test time improves the detection rate of P300 component and as a result the accuracy of separation. Therefore, one of the probable reasons may be the increase of Test time in the process of the protocol.
Finally, comparing our findings with the results reported in [18], it is obvious that the optimal combined feature vector resulted from Wigner-Ville transform performs better than Classic and wavelet based methods, and has more ability to detect Guilty subjects, the most important reason might be the superiority of the Wigner-Ville method over Wavelet transform, simultaneous usage of the features (combinational form of Classic and Time-Frequency features), and also using the PCA method.
REFERENCES
- Fang, F., Liu, Y. and Shen, Z. (2003) Lie detection with contingent negative variation, International Journal of Psychophysiology, 50, 247-255. doi:10.1016/S0167-8760(03)00170-3
- Farwel, L.A. and Donchin, E. (1991) The truth will out: Interrogative polygraphy (lie detection) with event-related potentials. Psychophysiology, 28, 531-547. doi:10.1111/j.1469-8986.1991.tb01990.x
- Rosenfeld, J.P., Ellwanger, J. and Sweet, J. (1995) Detecting simulated amnesia with event-related brain potentials, International Journal of Psychophysiology, 19, 1- 11. doi:10.1016/0167-8760(94)00057-L
- Ganis, G., Kosslyn, S.M., Stose, S., Thompson, W.L. and Yurgelun-Todd, D.A. (2003) Neural correlates of different types of deception: An fMRI investigation. Cerebral Cortex, 13, 830-836. doi:10.1093/cercor/13.8.830
- Kozel, F.A., Revell, L.J., Lorberbaum, J.P., Shastri, A., Elhai, J.D., Horner, M.D., Smith, A., Nahas, Z., Bohning, D.E. and George, M.S. (2004) A pilot study of functional magnetic resonance imaging brain correlates of deception in healthy young men. The Journal of Neuropsychiatry and Clinical Neurosciences, 16, 295-305. doi:10.1176/appi.neuropsych.16.3.295
- Kozel, F.A., Padgett, T.M. and George, M.S. (2004) A replication study of the neural correlates of deception. Behavioral Neuroscience, 118, 852-856. doi:10.1037/0735-7044.118.4.852
- Langleben, D.D., Loughead, J.W., Bilker, W.B., Ruparel, K., Childress, A.R., Busch, S.I. and Gur, R.C. (2005) Telling truth from lie in individual subjects with fast event-related fMRI. Human Brain Mapping, 26, 262-272. doi:10.1002/hbm.20191
- Lee, T.M.C., Liu, H.L., Tan, L.H., Chan, C.C.H., Mahankali, S., Feng, C.M., Hou, J., Fox, P.T. and Gao, J.H. (2002) Lie detection by functional magnetic resonance imaging. Human Brain Mapping, 151, 57-164.
- Nunez, J.M., Casey, B.J., Egner, T., Hare, T., Hirsch, J. (2005) Intentional false responding shares neural substrates with response conflict and cognitive control. Neuroimage, 25, 267-277. doi:10.1016/j.neuroimage.2004.10.041
- Phan, K.L., Magalhaes, A., Ziemlewicz, T.J., Fitzgerald, D.A., Green, C. and Smith, W. (2005) Neural correlates of telling lies: A functional magnetic resonance imaging study at 4 Tesla. Academic Radiology, 12, 164-172.
- Rosenfeld, J.P. (2002) Event-related potentials in the detection of deception, malingering, and false memories, In: M. Kleiner (Ed.), Handbook of Polygraph Testing, Academic Press, New York, 265-286.
- Allen, J., Iacono, W.G. and Danielson, K.D. (1992) The identification of concealed memories using the event-related potential and implicit behavioral measures: A methodology for prediction in the face of individual differences. Psychophysiology, 29, 504-522. doi:10.1111/j.1469-8986.1992.tb02024.x
- Mohammadian, A., Torabi, Sh., Abootalebi, V. and Rezania, S. (2011) P300-Based Detection of Concealed Face Recognition. Proceedings of Iranian Conference on Electrical Engineering, Tehran, 17-19 May 2011.
- Stone, G.M. and Rothenheber, E. (1992) Advanced scientific detection of deception—ERP augmented polygraphy, Proceedings of IEEE International Carnahan Conference on Security Technology, Atlanta, 14-16 October 1992, 72- 73.
- Gao, J., Yan, X., Sun, J. and Zheng, Ch. (2011) Denoised P300 and machine learning-based concealed information test method. Computer Methods and Programs in Biomedicine, 104, 410-417. doi:10.1016/j.cmpb.2010.10.002
- Kubo, K. and Nittono, H. (2009) The role of intention to conceal in the P300 based concealed information test. Applied Psychophysiology and Biofeedback, 34, 227-235. doi:10.1007/s10484-009-9089-y
- Abootalebi, V., Moradi, M.H. and Khalilzadeh, M.A. (2010) A new approach for EEG feature extraction in P300-based lie detection. Computer Methods and Programs in Biomedicine, 94, 48-57. doi:10.1016/j.cmpb.2008.10.001
- Abootalebi, V., Moradi, M.H. and Khalilzadeh, M.A. (2006) A Comparison of Methods for ERP Assessment in a P300-based GKT. International Journal of Psychophysiology, 62, 308-320. doi:10.1016/j.ijpsycho.2006.05.009
- Rosenfeld, J.P., Soskins, M., Bosh, G. and Ryan, A. (2004) Simple, effective countermeasures to P300-based tests of detection of concealed information. Psychophysiology, 41, 205-219. doi:10.1111/j.1469-8986.2004.00158.x
- Meijer, E., Smulders, F., Merckelbach, H. and Wolf, A.(2007) The P300 is sensitive to concealed face recognition. International Journal of Psychophysiology, 66, 231- 237. doi:10.1016/j.ijpsycho.2007.08.001
- Schinkel, S. Marwan, N. and Kurths, J. (2009) Brain signal analysis based on recurrences. Journal of Physiology, 103, 315-323.
- Shojair, S. and Moradi, M.H. (2008) An evolutionary artificial immune system for feature selection and parameters optimization of support vector machines for ERP assessment in a P300-based GKT. Proceeding of Biomedical Engineering Conference, Cairo, 18-20 December 2008, 1-4.
- Mehrnam, A.H., Nasrabadi, A.M., Mohammadian, A. and Torabi, Sh. (2011) Concealed face recognition analysis based on recurrence plots. Proceeding of Biomedical Engineering Conference (ICBME), Tehran, 14-16 December 2011, 1-4. doi:10.1109/ICBME.2011.6168556
- Kalatzis, I., Piliouras, N., Ventouras, E., Papageorgiou, C.C., Rabavilas, A.D. and Cavouras, D. (2004) Design and implementation of an SVM-based computer classification system for discriminating depressive patients from healthy controls using the P600 component of ERP signals. Computer Methods and Programs in Biomedicine, 75, 11-22. doi:10.1016/j.cmpb.2003.09.003
- Basar, E., Schurmann, M., Demiralp, T., Basar-Eroglu, C. and Ademoglu, A. (2001) Eventrelated oscillations are “Real Brain Responses”: Wavelet analysis and new strategies. International Journal of Psychophysiology, 39, 91-127. doi:10.1016/S0167-8760(00)00135-5
- Basar, E., Basar-Eroglu, C., Karakas, S. and Schurmann, M. (2001) Gamma, alpha, delta, and theta oscillations govern cognitive processes. International Journal of Psychophysiology, 39, 241-248. doi:10.1016/S0167-8760(00)00145-8
- Basar, E., Basar-Eroglu, C., Karakas, S. and Schurmann, M. (1999) Are cognitive processes manifested in eventrelated Gamma, Alpha, Theta and Delta oscillation in the EEG. Neuroscience Letters, 259, 165-168. doi:10.1016/S0304-3940(98)00934-3
- Gevins, A.S. (1984) Analysis of the Electromagnetic signals of the human brain: Milestones, obstacles and goals. IEEE Transactions on Biomedical Engineering, 31, 833-850. doi:10.1109/TBME.1984.325246
- Cohen, L. (1995) Time frequency analysis. Prentice-Hall, Inc., Englewood Cliffs.
- Kemal Kıymıka, M., Güler, İ., Dizibüyük, A. and Akın, M. (2005) Comparison of STFT and wavelet transform methods in determining epileptic seizure activity in EEG signals for real-time application. Computers in Biology and Medicine, 35, 603-616. doi:10.1016/j.compbiomed.2004.05.001
- Shou, G., Ding, L. and Dasari, D. (2012) Probing neural activations from continuous EEG in a real-world task: Time-frequency independent component analysis. Journal of Neuroscience Methods, 209, 22-34. doi:10.1016/j.jneumeth.2012.05.022
- Hyvarinen, A., Ramkumar, P., Parkkonen, L. and Hari, R. (2010) Independent component analysis of short-time Fourier transforms for spontaneous EEG/MEG analysis. Neuroimage, 49, 257-271. doi:10.1016/j.neuroimage.2009.08.028
- Quiroga, R.Q. (1998) Quantitative analysis of EEG signals: Time-frequency methods and chaos theory. Phd. Thesis, Medical University of Lübeck, Lübeck.
- Quiroga, R.Q., Sakowitz, O.W., Basar, E. and Schurmann, M. (2001) Wavelet transform in the analysis of frequency composition of evoked potentials. Brain Research Protocols, 8, 16-24. doi:10.1016/S1385-299X(01)00077-0
- Demiralp, T., Istefanopulos, Y., Ademoglu, A., Yordanova, J. and Kolev, V. (1992) Analysis of functional component of P300 by wavelet transform. Proceedings of 20th Annual International Conference of IEEE in Medicine and Biology Society, Hong Kong, 29 October-1 November 1998, 1992-1995.
- Akay, M. and Mello, C. (1997) Time frequency and wavelets in biomedical signal processing. Proceedings of the 19th Annual International Conference of the IEEE, Chicago, 30 October-2 November 1997, 2688.
- Mallat, S. (1999) A wavelet tour of signal processing. 2nd Edition. Academic Press, San Diego.
- Yordanova, J., Kolev, V., Rosso, O.A., Schurmann,M., Sakowitz, O.W., Ozgoren, M. and Basar, E. (2002) Wavelet entropy analysis of event-related potentials indicates modality-independent theta dominance. Journal of Neuroscience Methods, 117, 99-109. doi:10.1016/S0165-0270(02)00095-X
- Unser, M. and Aldroubi, A. (1996) A review of wavelets in biomedical applications. Proceedings of the IEEE, 84, 626-638. doi:10.1109/5.488704
- Tağluk, M.E., Çakmak, E.D. and Karakaş, S. (2005) Analysis of the time-varying energy of brain responses to an oddball paradigm using short-term smoothed WignerVille distribution. Journal of Neuroscience Methods, 143, 197-208. doi:10.1016/j.jneumeth.2004.10.007
- Kortelainena, J., Koskinen, M., Mustola, S. and Seppänena, T. (2008) Time-frequency properties of electroencephalogram during induction of Anesthesia. Neuroscience Letters, 446, 70-74. doi:10.1016/j.neulet.2008.09.056
- Abdulla, W. and Wong, L. (2011) Neonatal EEG signal characteristics using time frequency analysis. Physica A: Statistical Mechanics and Its Applications, 390, 1096- 1110. doi:10.1016/j.physa.2010.11.013
- Vaz, F., Guedes de Oliveira, P. and José, C. (1987) A study on the best order for autoregressive EEG modeling. International Journal of Bio-Medical Computing, 20, 41- 50. doi:10.1016/0020-7101(87)90013-4
- Lawhern, V., Hairston, W.D., McDowell, K., Westerfield, M. and Robbins, K. (2012) Detection and classification of subject-generated artifacts in EEG signals using autoregressive models. Journal of Neuroscience Methods, 208, 181-189. doi:10.1016/j.jneumeth.2012.05.017
- Wada, M., Ogawa, T., Sonoda, H. and Sato, K. (1996) Development of relative power contribution ratio of the EEG in normal children: A multivariate autoregressive modeling approach. Electroencephalography and Clinical Neurophysiology, 98, 69-75. doi:10.1016/0013-4694(95)00187-5
- Ogawa, T., Sugiyama, A., Ishiwa, S., Suzuki, M., Ishihara, T. and Sato, K. (1984) Ontogenic development of autoregressive component waves of waking EEG in normal infants and children. Brain and Development, 6, 289- 303. doi:10.1016/S0387-7604(84)80042-X
- Möller, E., Schack, B., Arnold, M. and Witte, H. (2001) Instantaneous multivariate EEG coherence analysis by means of adaptive high-dimensional autoregressive models. Journal of Neuroscience Methods, 105, 143-158. doi:10.1016/S0165-0270(00)00350-2
- Schlögl, A. and Supp, G. (2006) Analyzing event-related EEG data with multivariate autoregressive parameters. Progress in Brain Research, 159, 135-147. doi:10.1016/S0079-6123(06)59009-0
- Pfurtscheller, G. and Haring, G. (1972) The use of an EEG autoregressive model for the time-saving calculation of spectral power density distributions with a digital computer. Electroencephalography and Clinical Neurophysiology, 33, 113-115. doi:10.1016/0013-4694(72)90034-X
- Kleine, B. (1973) Some comments on the use of an EEG autoregressive model for the time-saving calculation of spectral power density distributions with a digital computer. Electroencephalography and Clinical Neurophysiology, 35, 331-332. doi:10.1016/0013-4694(73)90246-0
- Bianchi, A.M., Mainardi, L.T, Meloni, C., Chierchia, S. and Cerutti, S. (1997) Continuous monitoring of the sympatho-vagal balance through spectral analysis. Engineering in Medicine and Biology Magazine, IEEE, 16, 64-73. doi:10.1109/51.620497
- Ebrahimzadeh, E. and Pooyan, M. (2011) Early detection of sudden cardiac death by using classical linear techniques and time-frequency methods on electrocardiogram signals. Journal of Biomedical Science and Engineering, 4, 699-706. doi:10.4236/jbise.2011.411087
- Baudat, G. and Anouar, F. (2000) Generalized discriminant analysis using a kernel approach. Neural Computation, 12, 2385-2404. doi:10.1162/089976600300014980
- Subasi, A. and Ismailursoy, M. (2010) EEG signal classification using PCA, ICA, LDA and support vector machines, Expert Systems with Applications, 37, 8659-8666. doi:10.1016/j.eswa.2010.06.065
- Rajendra A.U., Vinitha, S., Peng, C.A. and Suri, J. (2012) Use of principal component analysis for automatic classification of epileptic EEG activities in wavelet framework, Expert Systems with Applications, 39, 9072-9078. doi:10.1016/j.eswa.2012.02.040
- Polat, K. and Güneş, S. (2008) .Artificial immune recognition system with fuzzy resource allocation mechanism classifier, principal component analysis and FFT method based new hybrid automated identification system for classification of EEG signals. Expert Systems with Applications, 34, 2039-2048. doi:10.1016/j.eswa.2007.02.009
- M. Bernat, Williams, W. and Gehring, W. (2005) Decomposing ERP time-frequency energy using PCA, Clinical Neurophysiology, 116, 1314-1334. doi:10.1016/j.clinph.2005.01.019
- Cawley, G. and Talbot, N. (1998) Efficient leave-one-out cross-validation of kernel fisher discriminant classifiers. Pattern Recognition, 36, 2585-2592. doi:10.1016/S0031-3203(03)00136-5
- Vapnik, V.N. (1998) The nature of statistical learning theory. 2nd Edition, John Wiley and Sons, Inc., New York.
- [61] Cover, T.M. and Hart, P.E. (1967) Nearest neighbor patternclassification. Information Theory, 13, 21-27. doi:10.1109/TIT.1967.1053964
- [62] Kutlu, Y. and Kuntalp, D. (2012) Feature extraction for ECG heart beats using higher order statistics of WPD coefficients. Computer Methods and Programs in Biomedicine, 105, 257-267. doi:10.1016/j.cmpb.2011.10.002
ABBREVIATIONS
TF: Time-FrequencyERP: event related potentialsfMRI: Functional Magnetic Resonance ImagingGKT: Guilty Knowledge TestEEG: ElectroencephalographyP: ProbeI: IrrelevantT: TargetPCA: Principal Component AnalysisMLP: Multilayer perceptronKNN: K-Nearest NeighborTFD: Time-Frequency distributionSPWVD: Smoothed Pseudo Wigner-Ville distributionZCD: Zero crossings density.