Journal of Cancer Therapy
Vol. 3 No. 6A (2012) , Article ID: 24901 , 8 pages DOI:10.4236/jct.2012.326111
Adapting the PPRNet TRIP QI Model to Increase Colorectal Cancer Screening in Primary Care
![]()
1Medical University of South Carolina, Charleston, USA; 2West Virginia University, Morgantown, USA.
Email: *katassi111@yahoo.com
Received September 8th, 2012; revised October 8th, 2012; accepted October 17th, 2012
Keywords: Colorectal Cancer Screening; Primary Care; Practice-Based Research; Quality Improvement
ABSTRACT
Background: Established CRCS guidelines for providers and the public exist, but due to several versions of CRCS guidelines and the variety of test options, confusion often arises among patients and providers, adversely affecting CRCS rates. Improving providers’ opportunities to recommend CRCS through provider-directed office-system interventions is critical to increase CRCS rates. Objective: The purpose of this study was to demonstrate the feasibility of adapting provider-directed office-system interventions developed by the Practice Partner Research Network (PPRNet) Translation of Research into Practice (TRIP) Quality Improvement (QI) Model for implementation in an independent, rural West Virginia primary care practice, and to obtain estimates of variability for relevant outcome measures of the interventions to increase CRCS recommendation and rates. Methods: Retrospective and prospective patient data from medical records and electronic medical records were extracted to compare prewith post-intervention CRCS rates and analyze any significant demographic data. Also, office staff participated in a focus group interview. Results: The pre-intervention CRCS status/completion rate was 4.3% and increased to 36.2%. CRCS recommendation rate rose from 4.3% to 42.1%. Patients in the post group were almost 7 times more likely to get CRCS recommendation compared to patients in the pre group, adjusting for demographic information. Similar to findings for CRCS recommendations, patients in the post group were more than 12 times more likely to have CRCS completion compared to their counterparts in the pre-group (OR 12.61, p < 0.000, CI: 8.30, 19.15). Conclusions: This study demonstrated the feasibility as well as statistically significant preliminary indications that CRCS rates will increase after implementation of this model.
1. Introduction
In the United States, colorectal cancer (CRC) is the third leading cause of cancer-related deaths in men and women [1]. West Virginia (WV) has the highest CRC death rate in the nation (21.0 per 100,000 for WV versus 17.6 per 100,000 nationally) [2]. Obesity, physical inactivity, older age, higher poverty rates, lower educational levels, lower socioeconomic status, and lack of public transportation compound this population’s vulnerability [3-7] . These are disheartening facts because CRC is preventable and curable with early diagnosis and treatment [1].
Multiple CRCS guidelines have caused confusion for patients and providers, contributing to lower CRCS rates [8-11] . Other significant patient barriers include: lack of provider recommendation, low health literacy, embarrassment, fear, inadequate insurance, financial obstacles, perception of low risk, previous negative medical experiences of family or friends, and distrust of the health care system [12,13]. Provider barriers to CRCS guideline adherence include patient comorbidities, patient refusal, provider forgetfulness, lack of time, other health priorities, and lack of reminders and tracking systems [14,15].
The US Preventive Services Task Force (2008) recommends for all persons age 50 to 75 to undergo fecal occult blood testing (FOBT) annually, sigmoidoscopy every 5 years, or colonoscopy every 10 years [16]. Despite numerous patient and provider barriers to CRCS, the most influential factor determining adherence to the CRCS guidelines is provider recommendation [17-22] . Yet, due to those barriers, providers often miss CRCS opportunities for their patients [23,24].
Combining multiple provider-directed with officesystem-directed interventions in the primary care setting shows the most potential to increase CRCS rates [15, 25-27] . Ornstein, Nemeth, Jenkins, and Nietert (2010) used the Practice Partner Research Network (PPRNet) Translation of Research into Practice (TRIP) Quality Improvement (QI) Model (Figure 1) to significantly increase CRCS rates. This model, grounded in complexity science theory and microsystems theory, was developed
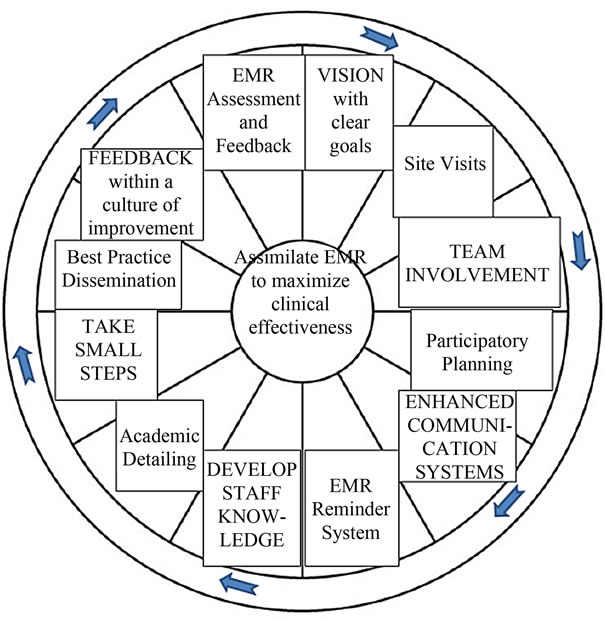
Figure 1. The PPRNet TRIP QI model.
specifically to utilize clinical guidelines to drive interventional improvements using a provider-directed officesystem approach [28-30] . The purpose of this study was to adapt the PPRNet TRIP QI Model in a single, rural primary care setting to evaluate feasibility of increasing CRCS outside a larger, practice-based network.
2. Methodology
A simple, interrupted time series pre-post design was used to collect preand post-intervention medical record data. Additionally, a post-interventional focus group interview was conducted with the office staff. Prior to implementation, Institutional Review Board approval was obtained from the Medical University of South Carolina.
This study was conducted in a rural, independent WV primary care office setting providing health care in a medically underserved area. There was no recruitment of patients; instead office staff members were recruited to participate in this study. Approaches to CRCS were undertaken by the office staff (n = 10), who were the target of the interventions.
Based on data from the previous calendar year, the goal was to collect data on 400 - 500 patients per group (80% power, odds ratio 1.5, α = 0.05). All patients between the ages of 50 and 75 years old were flagged in the EMR and screened if they were: 1) Active adult patients with a progress note, lab, or consultation record within the last year; 2) Between the ages of 50 - 75 years; 3) Without any history of CRCS; and 4) Requiring updated CRCS according to the recommended time-frames for FOBT, FS, or colonoscopy.
2.1. Pre/Post-Intervention Audit & Feedback
To determine patient characteristics and pre-interventional CRCS rates, a 3-month retrospective medical record review was conducted from October 2010 to January 2011. Post-intervention data were collected prospectively from October 2011 through January 2012 to compare similar time periods and control for potential seasonal variations. All pre-intervention data were collected from paper medical records, and all post-intervention data were collected through the EMR system. A onemonth follow-up period was included for both pre/postinterventional groups to allow sufficient time for CRCS test completion.
2.2. Interventions
The principal investigator (PI) made an initial site visit and met with all office staff present to initiate the provider-directed office-system interventions. First, academic detailing was initiated to increase CRCS knowledge and reinforced the need for change in the office setting. This discussion also presented best practice interventions utilized in the literature and the concept of quarterly EMR assessment and feedback. Participatory planning was introduced to encourage collective responsibility in establishing a new practice vision and goals to increase CRCS. Office staff members were taught about the EMR CRCS reminder that was programmed into the EMR system to pop up for patients meeting inclusion criteria. Further, office staff participatory planning took place to decide the implementation process and flow of assimilating the EMR CRCS reminder into practice. Upon closure of the site visit, the PI stated that another office staff meeting would occur in three months to provide EMR assessment and feedback data and conduct a focus group interview to evaluate the various best practice interventions used. The PI was available for questions by phone and made monthly site visits to provide support. Interventions were immediately launched.
2.3. Focus Group Interview with Office Staff
After 3 months of implementation, an office staff focus group interview was conducted to evaluate each intervention improvement strategy used. Quarterly EMR audit and feedback, reinforcement of academic detailing, participatory planning, and best practice dissemination were completed. The focus group interview was scheduled during a lunch break to reduce work hour conflicts. Each staff member received a $25 grocery/gas card for their participation.
3. Statistical Analyses
Data were analyzed using the Statistical Package for the Social Sciences (SPSS) version 20.0. Descriptive statistics were used to characterize the study sample while chi-square tests were used to compare outcomes for the preand post-intervention groups. Logistic regression was used to examine the relationship between CRCS results and the intervention (pre/post), adjusted for covariates such as age, gender, employment, and insurance. P values of 0.05 or less were considered to be significant.
For qualitative analysis, the office staff was informed of the purpose of the focus group interview, and signed informed consent was obtained from each staff member. Anonymity and confidentiality maintained for all office staff members. This session was digitally recorded and subsequently evaluated by the PI and a co-investigator, using the PPRNet TRIP QI Model as a framework for analysis to identify and assess key strategies, barriers, facilitators, and organizational culture.
3.1. Quantitative Results
3.1.1. Office Staff Demographic Characteristics
The office staff (n = 9) was overwhelmingly female (89%). Age ranged from 21 - 50 years old with a mean of 35 years-old. The office staff was 100% Non-Hispanic. Seventy-eight percent of the staff identified themselves as white and 22% as black. Eleven percent had a high school degree, 56% had attended some college, 11% had earned a bachelor’s degree, and 22% held a master’s/doctoral/professional degree.
3.1.2. Pre/Post Comparison
Data were collected on 599 eligible patients (50.9%) in the pre-intervention and 819 patients (100%) in the postintervention group with a total sample size of n = 1,418. Detailed pre/post-intervention group characteristics of patients are illustrated in Table 1. Patients in the preintervention group were younger compared to the postinterventional group (p < 0.002) and were more likely to be unemployed (50.9%) compared to the post interventional group (16.2%) (p < 0.000). The majority of the pre-interventional group (66.1%) were privately insured and only 29.9% had Medicare compared to 47% with private insurance and 40.8% with Medicare for postinterventional patients (p < 0.000). Education level was only available for post-intervention and could not be compared.
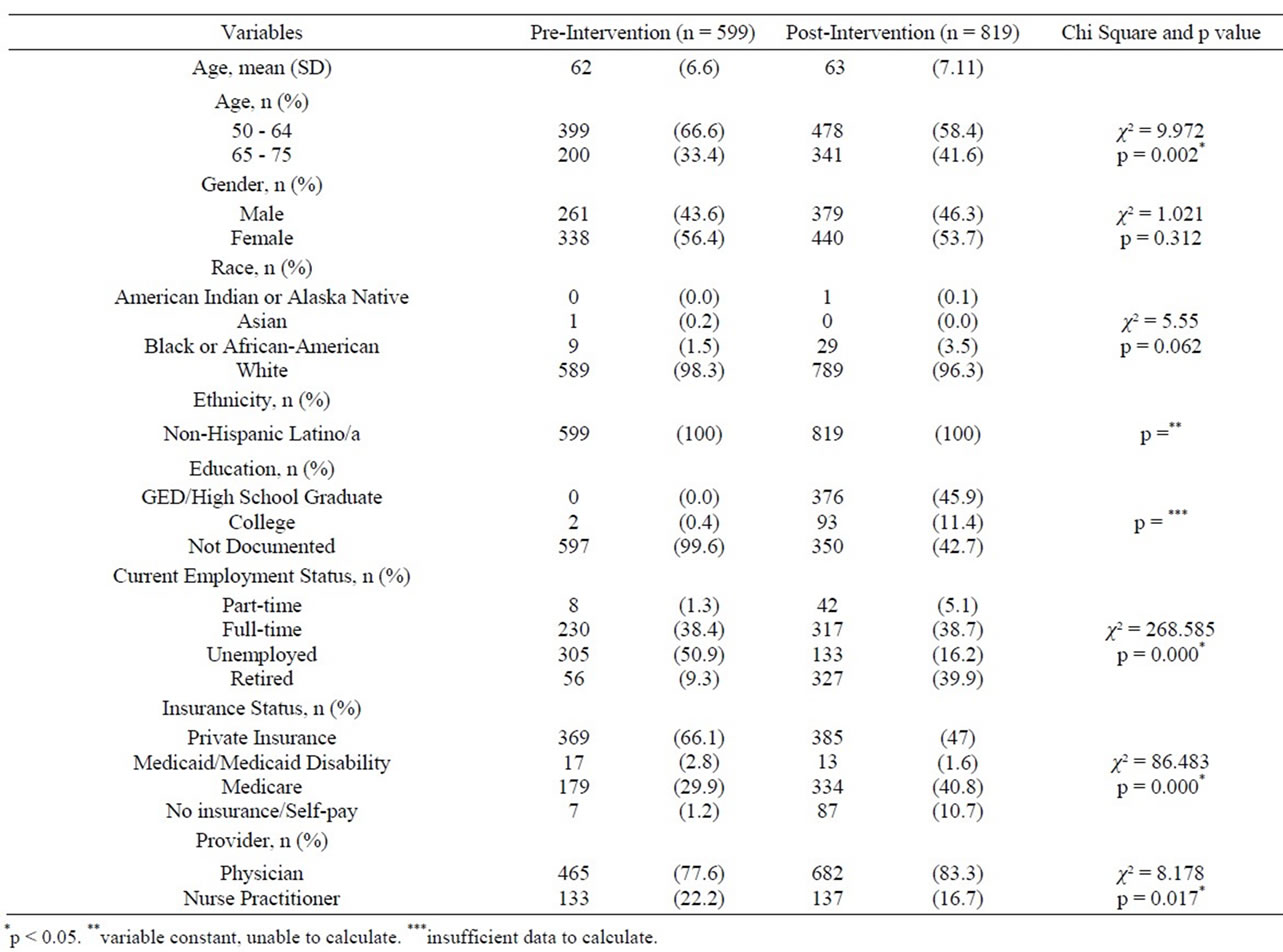
Table 1. Demographic characteristics of sample preand postinterventions.
The CRCS characteristics for the preand post-intervention groups are listed in Table 2. The documentation of CRCS recommendation rose from 4.3% to 42.1% (p < 0.018). In the pre-intervention group, 38.4% had no documentation of CRCS recommendation compared to 32.4% of patients in the post-intervention group. Refusal rates were 4.3% in the pre-intervention group and 6.7% in the post-intervention group. With more dialogue occurring between patients and providers, the patients’ CRCS preferences, positive or negative, were documented.
The number of patients up-to-date with CRCS completion increased from 4.2% in the pre-intervention group to 36.2% in the post-intervention group (p < 0.000). Of the 345 patients who received CRCS recommendation, 298 (86%) completed a CRCS test.
Statistically significant associations were found between the documentation of CRCS recommendation and age (p < 0.019), employment status (p < 0.017), and insurance status (p < 0.052). Patients between 65- and 75 years old were more likely to have completed some form of CRCS (55%) compared to 50 and 64 years old (51.9%). In addition, patients between 50- and 64 years old were more likely to have no documented discussion of CRCS recommendation (41.6%) in their medical records compared to 32% of patients between 65- and 75 years old. These age differences may be attributed to the variance of insurance-; the 65 - 75 year-old patients having Medicare as their primary insurance and the 50 - 64 year-old patients having another form of insurance or no insurance. Patients having some form of insurance (private 62.8%, Medicaid 3.8%, and Medicare 32.8%) had statistically significant higher CRCS rates than patients without insurance (0.6%). Interestingly, retired (10.1%) and part-time (1.6%) working patients had lower CRCS rates than unemployed (54.3%) or full-time working (34.1%) patients. No statistically significant relationships were found between demographic characteristics and documentation of CRCS status/completion.
Similarly, statistically significant associations were found between the documentation of CRCS recommendation and education (p < 0.001), employment status (p < 0.02), insurance (p < 0.010), and provider (p < 0.006). The education data collected represented only 42.7% of the post-intervention group, and this factor must be taken into consideration. Working (44.3%) and retired (43.2%) patients were more likely to have received a CRCS recommendation than unemployed (12.5%) patients. Patients with Medicare (48.7%) or private insurance (42.2%) were more likely to complete some form of CRCS than patients with Medicaid (1.9%) or no insurance (5.8%). The physician (85.5%) was more likely to discuss and order CRCS than the nurse practitioner (16.4%), and the physician’s patients were more likely to follow through with completion of CRCS. An association between the documentation of CRCS status/completion and race was found in the post-intervention group (p < 0.030). No screening tests were completed for 69% of blacks and 63.5% of whites. There was no significant statistical association between gender and CRCS recommendation (p = 0.631) or gender and CRCS status/completion (p = 0.482).
3.1.3. Logistic Regression
Logistic regression analysis (Table 3) was conducted with CRCS recommendation as the dependent variable, group pre/post as primary independent variable of interest, and age, gender, race, employment, and insurance as independent variables. Individually, only two variables showed a statistically significant relationship with CRCS recommendation: employment (OR 0.49, p < 0.000, CI 0.36, 0.66) and insurance (OR 3.23, p < 0.000, CI 1.94, 5.36). In the full model including all adjustment variables, a statistically significant association was found between
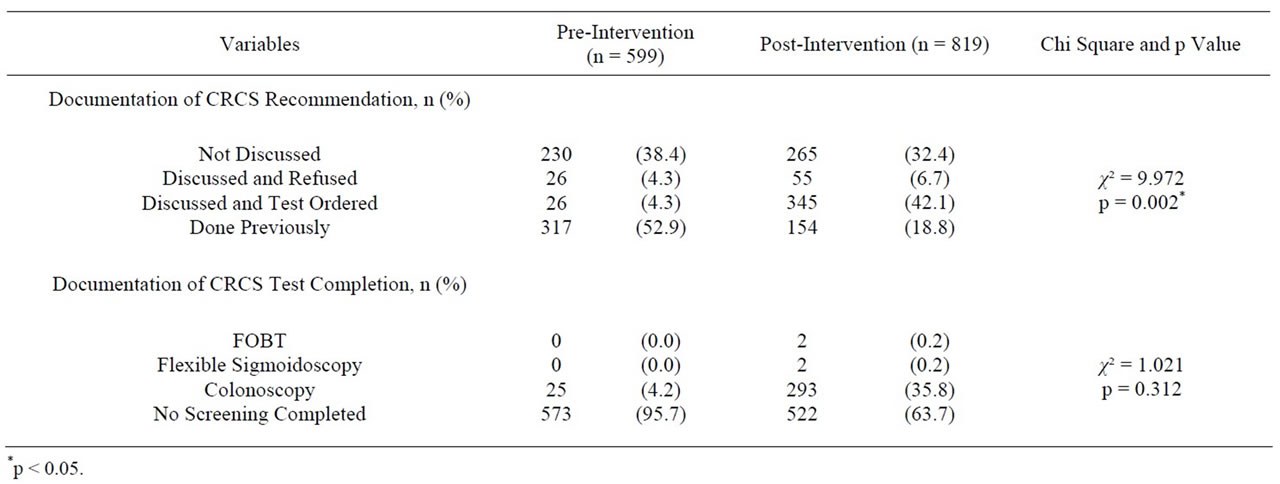
Table 2. CRCS characteristics of sample preand post-interventions.
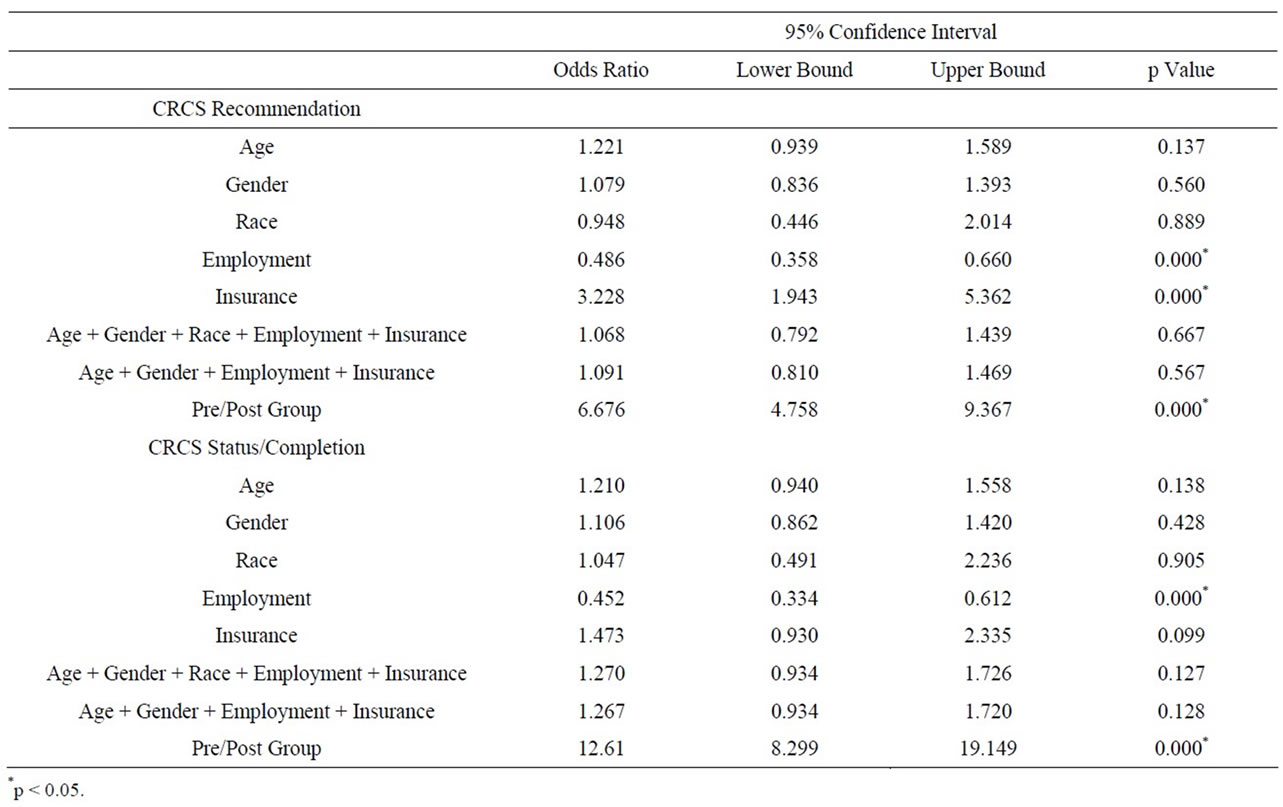
Table 3. Summary of logistic regression analyses.
CRCS recommendation and pre/post group (OR 6.68, p < 0.000, CI 4.58, 9.37). Patients in the post group were almost 7 times more likely to get CRCS recommendation compared to patients in the pre group, adjusting for demographic information.
In addition, logistic regression analysis was conducted with CRCS status as the dependent variable, group (pre/ post) as primary independent variable of interest, and age, gender, race, employment, and insurance as the adjustment variables. In individual models, age, gender, and race were not significantly associated with CRCS status. Employment was found to be statistically significantly related to CRCS status (OR 0.45, p < 0.000, CI 0.33, 0.61). Similar to findings for CRCS recommendations, in the full model with the pre/post group variable as primary independent variable of interest, patients in the post group were more than 12 times more likely to have CRCS completion compared to their counterparts in the pre-group (OR 12.61, p < 0.000, CI 8.30, 19.15).
3.1.4. Qualitative Analysis
In congruence with the PPRNet TRIP QI Model, the process of change was initiated upon the first PI site visit mid-September 2011. Together, all office staff members agreed upon the vision of increasing CRCS rates as the clear objective. The office staff tried to make the transition smoothly, taking small steps, communicating daily, and making small changes when problems materialized. Office staff members provided valuable feedback to continue improvement of CRCS rates. Suggestions were made for repeat EMR reminders for patients who refused CRCS as well as tracking results to keep the EMR upto-date. Sensing the value of this new process of change, the office staff also collectively decided to start using EMR reminders for other screening tests.
The opportunity to have quarterly practice meetings was not fully implemented due to the study’s short time frame. However, the value of a quarterly practice meeting was evident in the staff’s desire to know CRCS improvement rates for the quarter. The use of FOBT or a more sensitive immunochemical FOBT was attempted by both providers, but with less than positive results. Patients who took the FOBT cards never returned them. The office staff successfully incorporated all three specific strategies related to delivery system design. The utilization of CRCS EMR reminders brought attention to clearly documenting CRCS status for all patient visits and immediately created standing orders upon patient agreement, to proceed with testing. Patient education and activation were conducted as CRCS education materials provided to all patients meeting the inclusion criteria.
In summary, the EMR reminder system was the guiding force to increase CRCS and the easiest to use. The main difficulty was dealing with some irritated patients who refused CRCS. A second difficulty was that most gastroenterologists and specialists did not routinely send the colonoscopy reports back. The office staff adapted well to the process of change and was able to follow through the steps to utilize and modify specific strategies that maximized the ease and benefits of implementation.
4. Discussion
This study confirmed the feasibility of implementing the PPRNet TRIP QI Model in an independent, rural primary care practice. Qualitative results confirmed that the process of change within the PPRNet TRIP QI Model was fully implemented with relative ease and success. The most effective intervention was found to be the EMR reminder system. This value of the EMR system was found in previous studies [31,32].
Additionally, this pilot study provided preliminary indications of effectiveness for the PPRNet TRIP QI Model to increase CRCS recommendation and CRCS completion. The post-intervention group were 7 times more likely to get CRCS recommendation (OR 6.68, p < 0.000, CI: 4.58, 9.37) and 12 times more likely to have CRCS completion (OR 12.61, p < 0.000, CI: 8.30, 19.15) when compared to the pre-intervention group. These findings are consistent with previous research that also established the significance of a provider-directed office-system approach to increase CRCS [26,33].
5. Limitations
There are several limitations to this study, many of which are related to the design. While the study proved the feasibility, it may not have allowed sufficient time for patients in the post-intervention group to complete a CRCS test. Therefore, the post-intervention results are preliminary signals of CRCS status/completion and may be higher than what is reported here. The demographic variable of education could not be thoroughly examined due to the lack of documentation. Due to the lack of resources for this unfunded study, only 50.9% of the preintervention data was collected, contributing to unequal preand post-intervention sample sizes. The pre-intervention sample was randomized in the master list and the data collector followed that master list. Pre-intervention data were collected from medical records, a process that was very labor intensive and time consuming. Only one employee was trained to collect data, which limited data collection and did not allow for periodic validity testing.
Chi-square analyses revealed that there were some significant differences between the preand post-intervention groups by age group, employment status, insurance status, and provider. These variations between preand post-intervention groups may be due to a difference in patient sample population seen preand post-intervention. Variations in employment and insurance status are not that uncommon in rural WV, as many of these patients work in the coal mining industry and face seasonal hiring and layoffs due to coal demand. This unpredictability and the physical demands in the coal mining industry also lead to early retirement, which is another potential factor. The difference in providers may be due to the fact that the nurse practitioner usually saw more walk-in patients than the physician. Additionally, the nurse practitioner was a new graduate hired in September 2010. The differences found between races is consistent with previous study findings showing blacks at higher risk of not receiving screening [34,35]. Both chi-square and logistic regression analyses confirmed the significant relationship between employment and insurance with CRCS recommendation and CRCS completion. In this population, employment is most often associated with the receipt of health insurance, which makes CRCS more affordable for patients. Part-time jobs often lack health insurance and paid time off to complete screening tests. These results support previous research that showed patients with health insurance are more likely to have had some form of CRCS [17,31,33,36] . The Hawthorne Effect could be negated in future studies with randomization. Because the study is limited to one site in WV and was a convenience sample, the results are not generalizable on a national level.
Strengths of this study included randomization of the pre-intervention sample, and larger sample sizes for both preand post-intervention groups. Focus group interview provided additional, supportive information about the application of the PPRNet TRIP QI Model.
6. Conclusions
The results from this pilot study provided evidence demonstrating the feasibility of implementing the PPRNet TRIP QI Model in an independent, rural, WV primary care setting. This model was found to be applicable and produced positive results demonstrated by an increase in CRCS recommendation and completion rates.
Future recommendations for research include expanding to multiple rural, independent primary care sites in WV and conducting the study with a randomized controlled study with a longitudinal design to allow more time for completion of CRCS tests as well as to include those patients requiring follow-up according to the USPTFS CRCS screening guidelines. Finally, future studies should include other cancer screening tests, closer examination of the cost, reimbursement, the role of nurse practitioners/physician assistants, and value of the various CRCS tests from patient and provider perspectives.
REFERENCES
- American Cancer Society, “Cancer Facts and Figures 2012,” 2012.
- US Cancer Statistics Working Group, “Unites States Cancer Statistics: 1999-2007 Incidence and Mortality Web-based Report,” US Department of Health and Human Services, Centers for Disease Control and Prevention and National Cancer Institute, Atlanta, 2010.
- B. Behringer and G. H. Friedall, “Appalachia: Where Place Matters in Health,” Preventing Chronic Disease, Vol. 3, No. 4, 2006, p. 113. http://www.cdc.gov/pcd/issues/2006/oct/06_0067.htm
- C. A. Coyne, C. Demian-Popescu and D. Friend, “Social and Cultural Factors Influencing Health in Southern West Virginia: A Qualitative Study,” Preventing Chronic Disease, Vol. 3, No. 4, 2006, pp. A124-A124. http://www.cdc.gov/pcd/issues/2006/oct/06_0030.htm
- Kaiser Family Foundation, “West Virginia: People in poverty,” State Health Facts, 2009.
- E. J. Lengerich, S. W. Wyatt, A. Rubio, J. E. Beaulieu, C. A. Coyne and L. Fleisher, A. J. Ward and P. K. Brown, “The Appalachian Cancer Network: Cancer Control Research Among a Rural, Medically Underserved Population,” The Journal of Rural Health, Vol. 20, No. 2, 2004, pp. 181-187. doi:10.1111/j.1748-0361.2004.tb00026.x
- N. L. Lyttle, K. Stadelman, “Assessing Awareness and Knowledge of Breast and Cervical Cancer among Appalachian Women,” Preventing Chronic Disease, Vol. 3, No. 4, 2006. http://www.cdc.gov/pcd/issues/2006/oct/06_0031.htm
- J. S. Haas, G. Fitzmaurice, P. Brawarsky, S. Y. Liang, R. A. Hiatt, C. N. Klabunde, M. L. Brown and K. A. Phillips, “Association of Regional Variation in Primary Care Physicians’ Colorectal Cancer Screening Recommendations with Individual Use of Colorectal Cancer Screening,” Preventing Chronic Disease, Vol. 4, No. 4, 2007, pp. 1- 11. http://europepmc.org/abstract/MED/17875265/reload=0;jsessionid=kYFKFV5lt929Y5NJXK3g.6
- C. N. Klabunde, P. S. Frame, A. Meadow, E. Jones, M. Nadel and S. W. Vernon, “A National Survey of Primary care Physicians’ Colorectal Cancer Recommendations and Practices,” Preventative Medicine, Vol. 36, No. 3, 2003, pp. 352-362. doi:10.1016/S0091-7435(02)00066-X
- S. W. Vernon, H. Meissner, C. Klabunde, B. K. Rimer, D. J. Ahnen, R. Bastani, M. T. Mandelson, M. R. Nadel, S. Sheinfeld-Gorin and J. Zapka, “Measures for Ascertaining Use of Colorectal Cancer Screening Measures in Behavioral, Health Services, and Epidemiological Research,” Cancer Epidemiology, Biomarkers, & Prevention, Vol. 13, No. 6, 2004, pp. 898-905. http://cebp.aacrjournals.org/content/13/6/898.short
- E. K. Wei, C. T. Ryan, A. J. Dietrich and G. A. Colditz, “Improving Colorectal Cancer Screening by Targeting Office Systems in Primary Care Practices,” Archives of Internal Medicine, Vol. 165, No. 6, 2005, pp. 661-666. http://www.ncbi.nlm.nih.gov/pubmed/15795343
- D. C. Fyffe, S. V. Hudson, J. K. Fagan, D. R. Brown, “Knowledge and Barriers Related to Prostate and Colorecal Cancer Prevention in Underserved Black Men,” Journal of the National Medical Association, Vol. 100, No. 10, 2008, pp. 1161-1167. http://www.ncbi.nlm.nih.gov/pubmed/18942277
- C. N. Klabunde, S. W. Vernon, M. R. Nadel, N. Breen, L.C. Seeff and M. L. Brown, “Barriers to Coloretal Cancer Screening: A Comparison of Reports from Primary Care Physicians and Average-Risk Adults,” Medical Care, Vol. 43, No. 9, 2005, pp. 939-944. doi:10.1097/01.mlr.0000173599.67470.ba
- C. E. Guerra, J. S. Schwartz, K. Armstrong, J. S. Brown, C. Hughes Halbert, J. A. Shea, “Barriers of and Facilitators to Physician Recommendation of Colorectal Cancer Screening,” Journal of General Internal Medicine, Vol. 22, No. 12, 2007, pp. 1681-1688. doi:10.1007/s11606-007-0396-9
- J. Zapka, “Inovative Providerand Health System-Directed Approached to Improving Colorectal Cancer Screening Delivery,” Medical Care, Vol. 9, No. 1, 2008, pp. S62- S67. doi:10.1097/MLR.0b013e31817fdf57
- U.S. Preventive Services Task Force, “Screening for Colorectal Cancer: US Preventive Services Task Force Recommendations Statement,” Annals of Internal Medicine, Vol. 149, No. 9, 2008, pp. 627-637. http://cat.inist.fr/?aModele=afficheN&cpsidt=20868518
- H. A. Beydoun, M. A. Beydoun, “Predictors of Colorectal Cancer Screening Behaviors among Average-Risk Adults in the United States,” Cancer Causes and Control, Vol. 19 No. 4, 2008, pp. 339-359. doi:10.1007/s10552-007-9100-y
- I. Guessous, C. Dash, P. Lapin, M. Doroshenk, R. A. Smith, C. N. Klabunde and National Colorectal Cancer Roundtable Screening among the 65 Plus Task Group, “Colorectal Cancer Screening Barriers and Facilitators in Older Persons,” Preventative Medicine, Vol. 50, No. 1-2, 2010, pp. 3-10. http://europepmc.org/abstract/MED/20006644/reload=0;jsessionid=IfuFnFy4GFuJOwmNqoGS.8
- C. N. Klabunde, D. Lanier, E. S. Breslau, J. G. Zapka, et al., “Improving Colorectal Cancer Screening in Primary Care Practice: Innovative Strategies and Future Directions,” Society of General Internal Medicine, Vol. 22, No. 8, 2007, pp. 1195-1205. doi:10.1007/s11606-007-0231-3
- M. Sarfaty, R. Wender, “How to Increase Colorectal Cancer Screening Rates in Practice,” CA: A Cancer Journal for Clinicians, Vol. 57, No. 6, 2007, pp. 354-366. doi:10.3322/CA.57.6.354
- L. C. Seef, M. R. Nadel, C. N. Klabunde, et al., “Patterns and Predictors of Colorectal Cancer Test Use in the US Adult Population,” Cancer, Vol. 100, No. 10, 2004, pp. 2093-2103. doi:10.1002/cncr.20276
- S. Subramanian, M. Klosterman, M. M. Amonkar and T. L. Hunt, “Adherence with Colorectal Cancer Screening Guidelines: A Review,” Preventive Medicine, Vol. 38, No. 5, 2004, pp. 536-550. doi:10.1016/j.ypmed.2003.12.011
- S. A. Sabatino, N. Harbarta, R. C. Baron, R. J. Coates, et al., “Interventions to Increase Recommendation and Delivery of Screening for Breast, Cervical, and Colorectal Cancers by Health Care Providers: Systematic Reviews of Provider Assessment and Feedback of Provider Incentives,” American Journal of Preventive Medicine, Vol. 35, No. 1, 2008, pp. S67-S74. doi:10.1016/j.amepre.2008.04.008
- J. G. Zapka, S. C. Lemon, “Interventions for Patients, Providers, and Health Care Organizations,” Cancer, Vol. 101, No. S5, 2004, pp. 1165-1187. doi:10.1002/cncr.20504
- D. S. Lane, C. R. Messina, M. F. Cavanagh and J. J. Chen, “A Provider Intervention to Improve Colorectal Cancer Screening in County Health Centers,” Medical Care, Vol. 46, No. 9, 2008, pp. S109 - S116. doi:10.1097/MLR.0b013e31817d3fcf
- S. Ornstein, L. S. Nemeth, R. G. Jenkins and P. J. Nietert, “Colorectal Cancer Screening in Primary Care: Translating Research into Practice,” Medical Care, Vol. 48, No. 10, 2010, pp. 900-906. doi:10.1097/MLR.0b013e3181ec5591
- S. Ornstein, P. J. Nietert, R. G. Jenkins, A. M. Wessell, L. S. Nemeth and H. L. Rose, “Improving the Translation of Research into Primary Care Practice: Results of a National Quality Improvement Demonstration Project,” Joint Commision Journal on Quality and Patient Safety, Vol. 34, No. 7, 2008, pp. 379-390. http://www.ingentaconnect.com/content/jcaho/jcjqs/2008/00000034/00000007/art00002
- C. Feifer and S. M. Ornstein, “Strategies for Increasing Adherence to Clinical Guidelines and Improving Patient Outcomes in Small Primary Care Practices,” Joint Commission Journal on Quality and Safety, Vol. 30, No. 8, 2004, pp. 432-441. http://www.ingentaconnect.com/content/jcaho/jcjqs/2004/00000030/00000008/art00003
- L. S. Nemeth, C. Feifer, G. W. Stuart and S. M. Ornstein, “Implementing Change in Primary Care Practices Using Electronic Medical Records: A Conceptual Framework,” Implementation Science, Vol. 3, 2008, p. 3. doi:10.1186/1748-5908-3-3
- L. S. Nemeth, P. J. Nietert and S. Ornstein, “High Performace in Screening for Colorectal Cancer: A Practice Partner Research Network (PPRNet) Case Study,” Journal of the American Board of Family Medicine, Vol. 22, No. 2, 2009, pp. 141-146. doi:10.3122/jabfm.2009.02.080108
- C. N. Klabunde, D. Lanier, H. I. Meissner, E. S. Breslau and E. R. Brown, “Improving Colorectal Cancer Screening through Research in Primary Care Settings,” Medical Care, Vol. 46, No. 9, 2008, pp. S1-S4. doi:10.1097/MLR.”0b013e3181805e2a
- L. S. Nemeth, A. M. Wessell, R. G. Jenkins, P. J. Nietert, H. A. Liszka and S. M. Ornstein, “Strategies to Accelerate Translation of Research into Primary Care Within Practices Using Electronic Medical Records,” Journal of Nursing Care Quality, Vol. 22, No. 4, 2007, pp. 343-349. doi:10.1097/01.NCQ.0000290416.27393.d8
- D. Steinwachs, J. D. Allen, W. E. Barlow, et al., “National Institutes of Health State-of-the-Science Conference Statement: Enhancing Use and Quality of Colorectal Cancer Screening,” Annals of Internal Medicine, Vol. 152, No. 10, 2010, pp. 663-667. http://consensus.nih.gov/2010/images/colorectal/AIM_colorectal.pdf
- P. M. Green, B. A. Kelly, “Colorectal Cancer Knowledge, Perceptions, and Behaviors in African Americans,” Cancer Nursing, Vol. 27, No. 3, 2004, pp. 206-215. doi:10.1097/00002820-200405000-00004
- A. S. O’Malley, E. Beaton, K. R. Yabroff, et al., “Patient and Provider Barriers to Colorectal Cancer Screening in the Primary Care Safety-Net,” Preventative Medicine, Vol. 39, No. 1, 2004, pp. 56-63. doi:10.1016/j.ypmed.2004.02.022
- J. M. Daly, B. T. Levy, M. L. Merchant and J. Wilbur, “Mailed Fecal-Immunochemical Test for Colon Cancer Screening,” Journal of Community Health, Vol. 35, No. 3, 2010, pp. 235-239. doi:10.1007/s10900-010-9227-8
NOTES
*Corresponding author.