iBusiness
Vol.5 No.1A(2013), Article ID:29333,9 pages DOI:10.4236/ib.2012.51A006
Forecasting and the Role of Churn in Software-as-a-Service Business Models
![]()
1Advanced Ecommerce Research Systems Inc., Palo Alto, CA, USA; 2Gustavson School of Business, University of Victoria, Victoria, BC, Canada.
Email: anthony@terapeak.com, rgrant@uvic.ca
Received February 2nd, 2013; revised March 9th, 2013; accepted March 15th, 2013
Keywords: SaaS; Churn; Software; Subscription; Revenue Forecasting
ABSTRACT
This article demonstrates a revenue forecasting model for Software-as-a-Service (SaaS) business models. Due to the highly predictable nature of subscriptions, a SaaS business can often project future revenue on the basis of a few key metrics. However, understanding and predicting the churn rate of the subscription base is critical to successful projections. The authors explain SaaS churn and demonstrate the use of critical variables in a predictive SaaS revenue model. The model allows a business to project future revenues based on historical and expected customer subscription behavior. The methodology combines research with the experience of a senior executive in a SaaS-driven business to build the predictive platform.
1. Introduction
Software-as-a-Service (SaaS) is an application delivery model whereby software is delivered online over the internet. Also known as on-demand software, it is one of the most popular business models in the information age [1]. The SaaS model takes advantage of high data throughput over the internet, using virtual machines for serverside storage of data and associated code. The user interacts with the software via a thin client or web browser. The revenue model is a pay-for-service subscription, with regularly-scheduled, recurring payments in exchange for continued access to the application. Firms are rapidly moving from one time licenses for use of software and online services to recurring payments structured as subscription based services.
Worldwide SaaS revenue is forecast to reach $14.4 billion US in 2012, a 17.9 percent increase from 2011 revenue of $12.3 billion USD [2]. Industry watchers predict that SaaS-based delivery will experience healthy growth through 2015, with worldwide revenue reaching $22.1 billion US [3].
The shift from one-time license revenue to recurring service revenue has produced new business language dealing with revenue modeling and customer lifecycle. A clearly-defined and rigorous predictive model is critical to the ability of SaaS businesses to: 1) forecast the growth of their customer base; 2) predict revenue; and 3) project future cash flows.
This paper first defines key industry terms and maps the interactions among the variables representing them. It then demonstrates a model incorporating the key variables. The model, implemented as a computer algorithm, can then be used to predict revenue for a SaaS based businesses.
2. Software as a Service
2.1. Definition
SaaS uses software owned, delivered and managed remotely by one or more providers. The provider delivers software based on one set of common code and data definitions. The software is then consumed in a one-tomany model by contracted clients at any time.
There are two basic forms of SaaS billing, subscription and pay-per-use [4]. SaaS subscription model users pay a flat, fixed monthly fee for unlimited access to and usage of an online software application. With SaaS pay-per-use, often called “metered usage”, the client pays for each use of the service. Pay-per-use is distinguished from subscription SaaS by the fixed versus metered approach to billing. If the client has a scheduled use scenario with one or two uses per month, then pay-per-use provides the client with the best value. If the client accesses the application often, then a monthly recurring billing model typically provides better value for the client.
2.2. Key Characteristics of SaaS
SaaS can be distinguished from other software delivery models along five dimensions:
1) Method of Access—The software or service delivered in a SaaS product is accessed over a network and requires internet access;
2) Storage of Data—The client interacts with data stored on third-party servers;
3) Storage of Code—The code that defines the operation of the software and its output is executed server side;
4) System Compatibility—SaaS services are agnostic to hardware architectures or operating systems;
5) Hardware Architecture—The servers that store the client data and deliver the SaaS services are virtualized in a cloud based computing environment. Client-side computers require an internet browser to use the SaaS application.
The availability of high bandwidth internet connections is an important factor in the adoption of SaaS services. Clients can upload, download and access their data in real time over the internet with minimum latency. Since the service is delivered in a web browser, the code typically works independently of any hardware or operating system. The interoperability of SaaS helps organizations easily adopt and roll out the service across many types of computers running different operating systems on differing hardware [1].
Examples of current SaaS businesses include:
§ Salesforce (CRM)
§ Google Docs (Documents, Spreadsheets)
§ Drop Box (File Sharing)
§ Zuora (Payment System)
§ Badgeville (Loyalty, User Behaviour)
§ Eloqua (Marketing)
An example of a high-growth SaaS business is Salesforce, which has been based on the SaaS model since its first day of business. In FY 2005 Salesforce did approximately $172 million in revenues [5]. Over the past seven years in the SaaS business, Salesforce has grown quickly: In 2012 Salesforce did approximately $2.27 billion in revenues [6]. All Salesforce services are subscription-based, with recurring payments.
2.3. Advantages and Disadvantages of SaaS
The SaaS business model has a number of advantages over conventionally-installed, boxed software. First and foremost, the code is never exposed to the client, protecting the provider from having the software copied or pirated.
Second, the SaaS business can monitor and shut off the client’s access if the client is abusing or misusing the service. The ability to track and monitor service use also provides insight into client processes, which can be used to improve future versions of the application.
Third, all clients access the same code base. Thus, all clients benefit from improvements and upgrades.
Fourth, the highly predictable payment schedule in a subscription model provides significant financial benefits to the provider, in terms of being able to forecast revenues and cash flow.
Fifth, acquiring subscribers online has excellent economies of scale and efficiency—in many cases the potential subscriber will self-serve. The cost to acquire a customer is reduced as the process is automated through online signup.
From a client perspective, the ease of implementing a SaaS option is important. Clients can use the SaaS application from any internet-connected computer that has a web browser. This greatly simplifies the rollout of SaaS based services in large firms with many types of software and hardware.
SaaS models reduce the client’s upfront purchase costs; in essence, the client is trading a large purchase price for smaller, “rental” payments. The commitment is also decreased as often there is no long term commitment required to use a SaaS service.
The primary disadvantage of SaaS is the requirement that it be accessed over a network. Network outages make it impossible to use the SaaS application, leading to business slowdowns or—in extreme cases—shutdowns. The requirement to share resources with other clients means that service may sometimes be slow. An overloaded network can dramatically reduce the speed of delivery of the SaaS service [7].
SaaS clients also can have a negative experience with forced upgrades. The client can experience migration stress and waste time learning new features and functionality as the SaaS product is upgraded.
3. Review of Prior Research
3.1. Industry Research
Industry research is commonly presented as web content, published by a practitioner or practitioner organization. While recent and active, it is rarely peer-reviewed. The work is typically written from a practitioner perspective, using industry terminology and focusing on tactical case studies.
The industry literature describes numerous methods of analysis, often proposing industry-specific “in house” solutions for analyzing churn. For example, Bessemer Venture Partners’ analysis of churn [8] looks at SaaS businesses but differs from Shopify.com’s more pragmatic approach [9]. Zoura.com espouses a view that differs from both Bessemer and Shopify [10]. Industry firms all have their own take on SaaS metrics. This diversity of methods is one factor in our motivation for developing a more generic model. The approach proposed in this paper can help promote a standard method for looking at churn and retention within the SaaS business model.
3.2. Scholarly Research
Peer-reviewed scholarly work centers around some distinct research topics. The primary areas of research we identified are:
1) Pricing SaaS solutions [1,4,11];
2) SaaS scalability [12];
3) Risk and opportunity assessment of SaaS [7];
4) The SaaS business model [13];
5) Predicting SaaS churn [14-17].
While our review points to numerous studies about SaaS, most of the work tends to focus on a few applications. In particular, prior work on subscriber churn tends to base its analysis on data from subscribers in the areas of mobile phones [14,16,18], credit cards [15], and providing internet services [19].
Another stream of research develops algorithms to predict the likelihood that a subscriber will churn. That research concentrates on detecting at-risk subscribers (those likely to churn) and predicting the probability of churn. Its methods include:
1) ADTrees [14];
2) Partial Least Squares (PLS) Model [16];
3) Support Vector Machines (SVMs) [17].
Other authors have developed machine learning algorithms to target at-risk subscribers. The more accurate the predictions, the more effectively the business can develop communications to retain the customer and improve future products.
Pricing analysis [1,11] provides insight into the most profitable ways to price SaaS solutions and when to apply these pricing models. It is connected to the analysis of churn by the impact pricing can have on churn. Pricing can affect the client’s perception of the value delivered for the subscription payment. It also directly affects the lifetime value of a subscriber.
3.3. Contrast to Prior Research
The analysis presented in this paper differs from prior research in a number of ways.
First, we propose a foundational view of SaaS metrics that merges industry and scholarly perspectives. We have built a SaaS forecasting tool that can model churn to analyze subscribers, subscriptions, payments and revenue at a tactical level. In contrast, prior research has presented analyses that are tightly focused and often only consider a single element of the SaaS business model.
Second, our analysis uses data from a software application development firm with SaaS subscribers. This differs from prior research in that it is not a telecom, utility, or credit card data set, but instead is directly relevant to software-as-a-service subscribers. Thus the model is specific to the SaaS industry.
Third, prior research uses algorithms to predict churn, whereas our model uses historical cohort retention curves. This approach reduces complexity and produces a model accessible to any executive with the math and software skills of a typical mid-level manager. The model can be adapted to use more advanced machine learning techniques around churn prediction; however, that would increase the complexity and reduce the generalizable nature of the model.
Fourth and finally, this analysis does not depend on SaaS price analysis. Nor does it attempt to propose price optimization. Instead, it considers price as an exogenous variable determined by the business and inserted into the model.
4. Churn Rates—Retention Curves
Churn rate refers to the loss of subscribers (or clients). Churn impedes the growth of a SaaS-based business. It also determines the maximum number of users a business can support in a steady state [20]. Churn rates can be reported as “continuous” or “discrete”, each of which can provide different levels of accuracy. Continuous churn describes the behavior of a cohort of subscribers in which the rate of churn remains the same from month to month over the entire life cycle of the cohort. Discrete churn describes the behavior of a cohort in which each term of the subscription may have a different churn rate.
The churn rate curves shown in Figure 1 express the number of subscribers retained after a given number of months in their subscription, for five different churn scenarios. The cohort slowly shrinks in size as users end their subscriptions.
The discrete churn curve (orange line) shows how in months 1 - 7 of the subscription the discrete churn is greater than 20%, while for months 7 - 16 the churn rate is less than 20% but greater than 15%. For months 16 on, the churn rate is marginally better than 15%. No single continuous churn rate curve accurately matches the retention curve generated by a discrete set of churn rates.
From the authors’ experience, this concept is important to organizations because management teams often look for a single number with which to measure churn improvement. Since management understands that churn
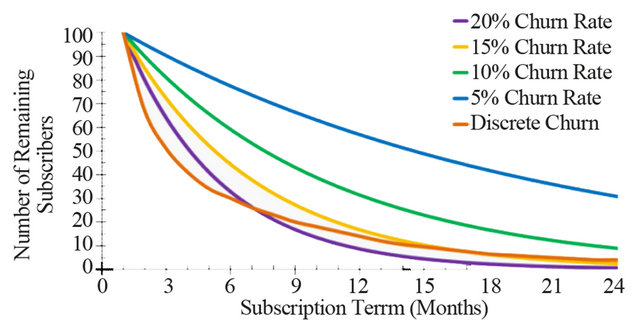
Figure 1. Continuous vs. discrete churn.
is bad the general goal is to reduce churn for all customers for all time. When the question “What is our churn rate?” is asked, the average churn rate is the number that is usually quoted. That average rate then becomes the reference to gauge future improvement and progress.
The average churn rate provides a level of accuracy similar to a continuous churn rate. As shown in Figure 1, above, the average churn rate will only be correct at two points in comparison to the actual discrete churn curve. Because the subscriber’s propensity to leave is higher at the beginning of the subscription, the churn rate is higher at the start of subscription. Once a subscriber has actively used the application and received value from the service, the probability of cancellation is reduced and the churn rate decreases. Because the subscriber’s behavior changes over the life cycle of the subscription, using a continuous churn rate over the life the subscription will result in inaccurate subscription analysis.
5. Key Variables
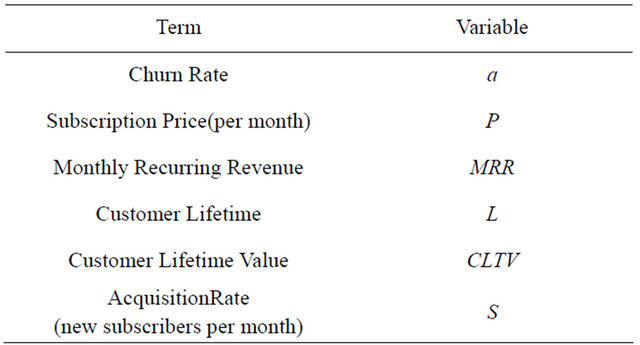
SaaS businesses have a few important metrics or variables, which create the foundation for predicting revenue. The subscription model makes use of these critical variables. Other metrics for measuring aspects of SaaS businesses exist, but those variables shown in Table 1 form the core needed to project revenue.
In order to demonstrate these variables and the relationships among them, our discussion uses exemplar values typical of those found in a subscription SaaS business:
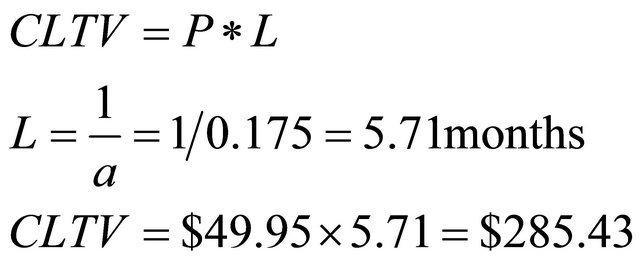
1) Subscription Price: $49.95 per month;
2) Churn Rate: 0.175%;
3) Acquisition Rate: Ranging from 1000 to 2000 new subscribers per month;
4) Total Subscriber base of 10,000.
5.1. Churn Rate (a)

where “a” is the monthly churn rate, “C” = number of
Table 1. Key terms and variables.
subscribers, “t” = term (in months), “CCancels” = Number of cancelled subscriptions in the period.
For example, imagine that 1000 subscribers signup for a service and, at the beginning of the next subscription period, 175 of those subscribers end their subscriptions. The churn rate in this example is 17.5% (175/1000). The corresponding retention rate is 82.5% because (825/1000) users remained for the second term of their subscriptions.
5.2. Subscription Price (P)
The subscription price is the fixed monthly fee charged to a single subscription client.
5.3. Monthly Recurring Revenue (MRR)
Recurring revenue is the amount of subscription revenue earned based on the value of services delivered in single month. SaaS providers have followed the practices of industries such as utilities, internet service providers, newspapers and telecom companies. These businesses typically bill for service on a monthly basis, with discount incentives to encourage clients to commit to yearly contracts. Subscription based billing models produces a reliable and predictable source of recurring revenues.
At a subscription price of $49.95, the MRR for a single subscriber is $49.95. The MRR for the company as a whole assuming a total subscriber base of 10,000 subscribers on monthly subscriptions is calculated as:

Using our exemplar values,

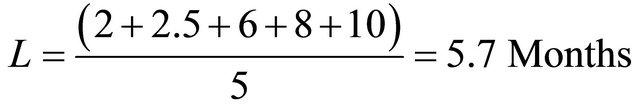
5.4. Customer Lifetime (L)
The term length of a subscriber is the amount of time, on average, from the start to the end of a subscription. One can calculate the term length as follows [20]:
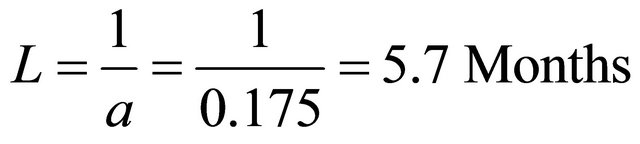
If the churn rate is not known, one can determine the average term length as follows:
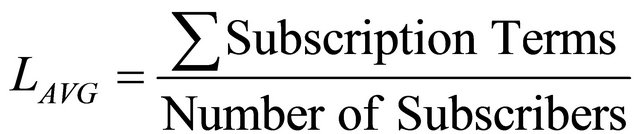
For example, if a client’s five subscribers have subscription lengths of 2, 2.5, 6, 8, and 10 months respectively. Using the formula above:
5.5. Customer Lifetime Value (CLTV)
The lifetime value of a customer in a subscription-based business is the sum of all subscription payments over the total lifetime of the subscriber [20].

Using our exemplar values,

One reaches same results is by calculating the average term length of a subscriber in months and multiplying that by the monthly subscription price.
5.6. Acquisition Rate (S)
The subscriber acquisition rate is the number of new clients that the business enrolls each month. This could also be the number of new paying subscribers, or the number of free trial users depending on the structure of the signup process. If 1000 new subscribers sign up for service each month then the customer acquisition rate is 1000 per month.
5.7. Cohort
A subscription cohort is a group of subscribers that joined in the same period or under the same subscription conditions. Members of a cohort exhibit similar behavior in terms of key variables.
6. Model Design
This analysis uses arrays to model the retention of subscribers in a given cohort. The arrays are appended together to determine the number of subscribers at any given time.
6.1. Time Frame
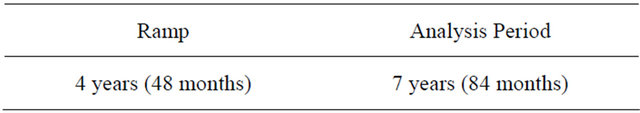
The model presented here covers a time frame of 11 years (132 months). We have chosen this time frame to:
• acknowledge that SaaS businesses experience an initial period during which the business is ramping up; and.
• provide a sufficient period of time to analyze the outcomes of changes in churn and acquisition rates in the model.
Because we are using a 48-month retention curve, resulting subscriptions for any given cohort span the subsequent four years. Small changes in acquisition rate or churn rate will be expressed over those 48 months. For that reason it is important to extend the model well beyond four years.
Any SaaS business with a churn rate greater or equal to 10% will capture 99.293% of a cohort’s revenue within the first 48 months of the cohort’s term.
At a churn rate of 5% the proportion of revenue captured within 48 months is 91.03%.
For SaaS businesses that have churn rates lower than 2.5% the discrete churn array can be extended to 96 months to accurately predict subscriber activity over an 8-year time frame.
6.2. Model Length Phases
When the SaaS business first starts, there are no previous historical subscribers contributing payments. Thus, revenues gradually increase as new subscribers sign up for service. This gradual increase in revenue is the “ramp” (Table 2).
The first cohort in the first month will equal the number of payments one will receive. In the second month, one will have payments from the second cohort as well as payments from the remaining subscribers of the first cohort. This continues as one fills the model with cohorts. In month 48, one should receive subscription payments from 47 historical subscriber cohorts. By the 48th month, one will a have full analysis of the first cohort that started the model.
7. Discrete Churn Cohort Maps
While a model based on continuous churn rate is easy to understand, it does not predict the discrete churn curve generated from 48 discrete and incremental month-overmonth churn rates.
The use of a discrete churn rate for each term increases the accuracy of SaaS predictive models. When churn is continuous, the model is easier to build, but lacks the flexibility to adapt to spikes or anomalies in churn. Instead, we use discrete churn curves because they offer the flexibility to use either discrete or continuous churn rate arrays. If the model were designed to use only continuous churn rates it would not be possible to switch to discrete churn rate arrays. However, continuous churn rate arrays can be easily fit into discrete churn rate arrays.
7.1. Acquisition Rate Array
The Acquisition Rate Array is thus represented by an a1,132 array of values.
Table 2. Ramp & historical cohorts.
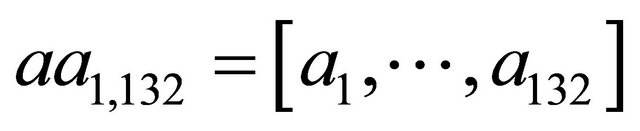
Each element in the array represents the estimated number of subscriptions to occur each month over the 11 year period. Each month is considered as a cohort of users that exhibit similar churn behavior over time. To demonstrate, consider the following example:
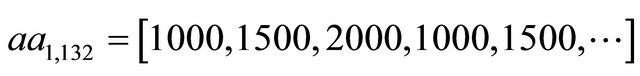
In this example, the company acquires 1000 users in the first month, 1500 in the second, 2000 in the third and so forth.
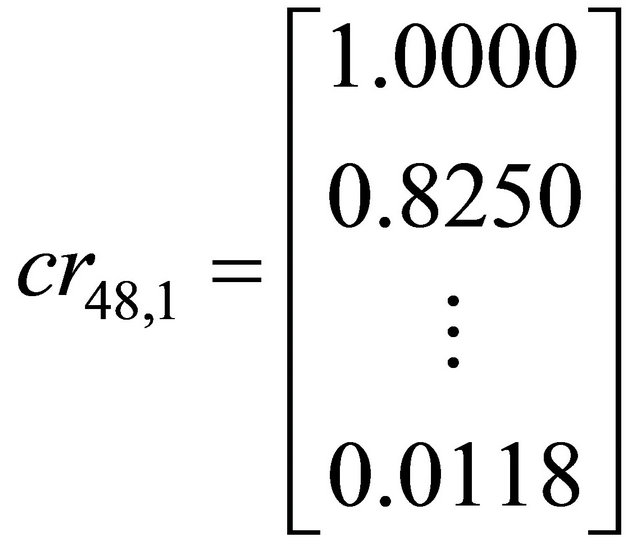
7.2. Churn Rate Array
The churn rate retention curves are represented by 132 individual churn matrices (with dimensions crn,1) containing the values that represent the expected number of subscribers still remaining after “n” months of a subscription.
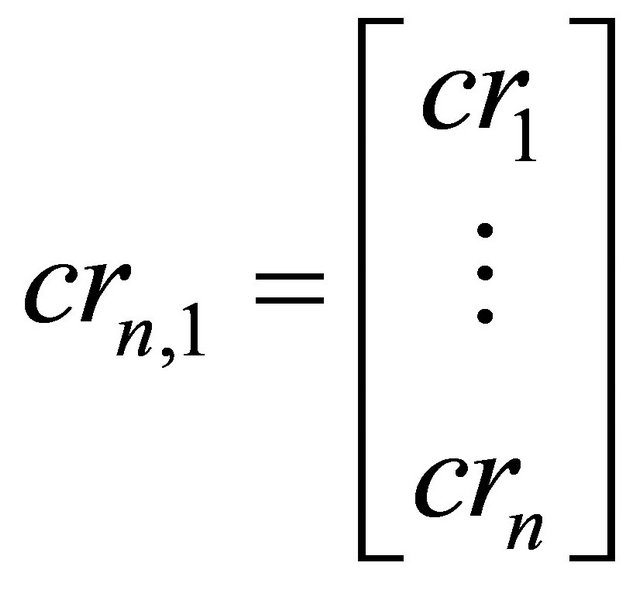
Position 1.1 in the churn rate matrix is the percentage of subscribers remaining at the end of the first month of that cohort subscription life. Position 2.1 in the churn rate matrix is the number of subscribers remaining at the end of the second month of that cohort’s subscription life, and so on.
For example, the churn rate curves shown in Section 3.2 would be represented as follows:
7.3. Diagonal Array
The diagonal array stores the number of subscribers remaining after a given number of months in a subscription.
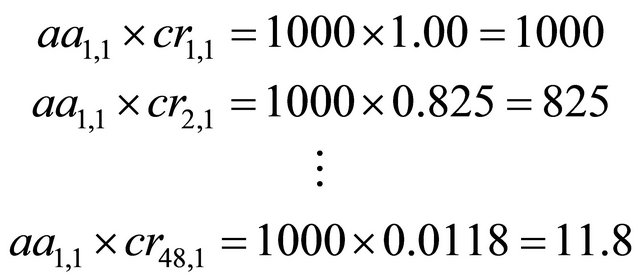
The above numbers are stored in a diagonal array shown below.
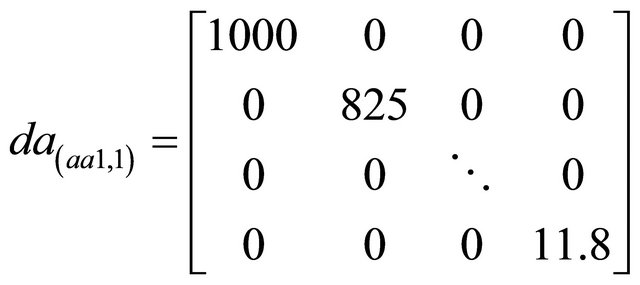
The process is repeated 132 times creating 132 diagonal arrays. These arrays each represent a single subscription cohort’s retention curve and thus the expected revenue and term length of each cohort.
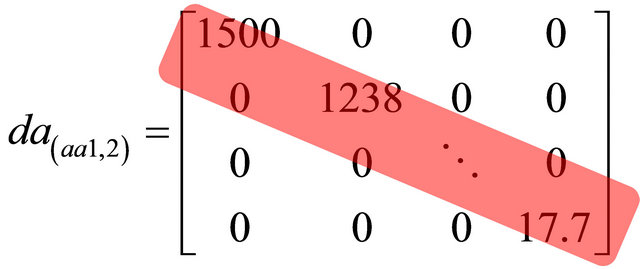
For aa1,2 the array would look as follows, and would be shifted one column to the right.
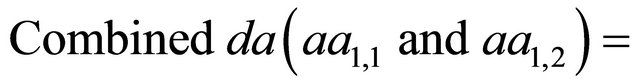
7.4. Combined Array
The diagonal arrays are combined to produce one large array. Each diagonal array’s position is based on the monthly cohort of subscribers that the array represents. The combined arrays should have 48 rows, and 132 columns, containing the exact expected number of subscribers for any given cohort, or any given month. The diagonals will provide the lifetime value for the cohort, and the columns will sum to the total predicted number of subscribers that will pay their subscription that month.

7.5. Seven Cohort Small Scale Model
Table 3 presents a seven-month analysis of expected customer acquisition and corresponding churn. Each of the cohorts has a corresponding churn rate array (as seen in the lower discrete churn rates arrays). As the cohort ages, it has a corresponding reduction in subscribers as a function of the churn rate and the acquisition rate—this is the shaded diagonal region.
The number of active subscribers can be determined by summing the column for the given monthly cohort.

*Blue-shaded column.
By summing the diagonal, we can determine the cumulative number of subscription months for an entire cohort of users.
*Red-shaded diagonal.
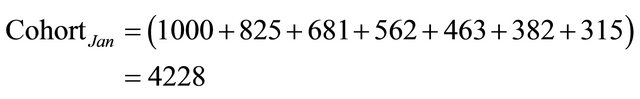
Table 3. Example cohort analysis.
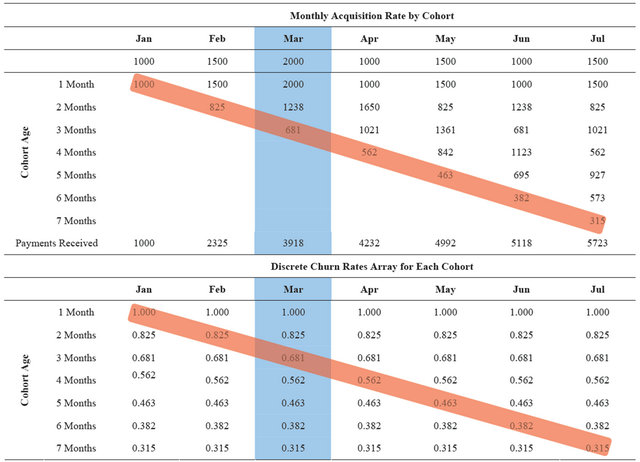
In seven months 1000 subscribers will result in 4228 subscription months, given the churn rate arrays expressed.
The maximum revenue from the January cohort is determined using the following method.
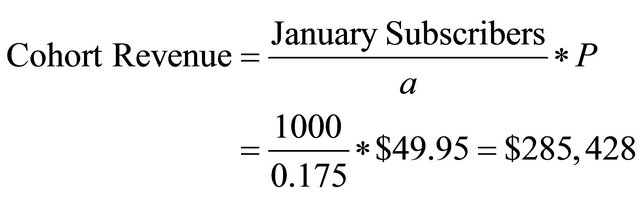
The maximum revenue that can be expected from a cohort of 1000 subscribers starting in January is $285,000. With an average churn rate of 17.5% the entire cohort will have churned out within 48 months.
7.6. Applying the Model
In order to apply this model to another SaaS business, two actions are important. First, past subscriptions will drive future payments. Thus, historically accurate data is needed to ensure accuracy in the model’s later predictions of payments, subscribers and MRR. Second, the beginning of SaaS subscription data must be aligned with the start of the model. The model is designed with a ramp to reflect and predict the startup phase of the business.
8. Limitations of the Model
When developing this analysis the goal was to build a rigorous base model that can be adapted to fit more advanced or complex needs. By focusing on the base model, we have limited the number of variables. The model can be adjusted to different SaaS businesses by: 1) duplicateing the retention curves and cohort arrays; and 2) increasing the retention curve arrays beyond 48 months.
As discussed earlier in the analysis, it is also possible to introduce some of the machine learning algorithms to develop churn and retention curves. This will reduce the reliance on historical data at the beginning of the model.
Since this analysis focuses on developing the base model for predicting SaaS payments and revenue, it has considered only one product model. This base case, of a single SaaS product, can be adapted to analysis of multiple products. To do so, one would replicate the analysis for a single product multiple times within a single model.
9. Conclusions
SaaS revenue can be readily modeled using historical behavior of subscribers. By combining the variables discussed in this analysis, it is possible to predict future subscribers and subscription payments and, thus, revenue.
Forecasting provides management with expected future outcomes that are based on the best understanding of the business and current environmental variables it faces. Accurate predictions are a function of accurate historical data, a sufficiently robust model and knowledge of the business and its fundamental drivers. Understanding the SaaS business model equips the management team with critical forecast knowledge and allows them to take action to focus the business to maximize the return on investment of capital.
The body of research on SaaS has set the stage for understanding SaaS pricing, subscriber churn and retention, and the risks and costs associated with deploying SaaS solutions. Both academic and industry perspectives also provide approaches to continue the exploration and expansion of the SaaS business model.
This paper defines and uses specific formulae to provide a foundation of analysis. Any executive could use that foundation to develop a predictive model showing the future level of subscribers, subscriptions and payments derived from historic churn and retention activity. Our analysis also provides an alternative to the simple view of churn as a single continuous rate. It does so by developing a flexible model that can be used with multiple discrete churn rates. Such flexibility in regard to the subscriber retention curve allows for highly accurate predictions of future subscription payments and subsequently revenue.
The use of a model allows executives to conduct riskfree tests of different scenarios, looking at the future effect of a contemporary decision. This model can act as a type of “SaaS radar” highlighting predicted increases or decreases in the subscriber base resulting from changes in churn or acquisition rates.
As the SaaS business model becomes more widely adopted, more firms will search for methods of enhanceing their reporting and forecasting capabilities. Measuring churn and retention is integral to the success of any SaaS business. This analysis provides the foundational definitions, formula and model structure to build a highly accurate forecasting model and in turn provides insights into future subscribers, subscriptions, payments and revenue.
REFERENCES
- D. Durkee, “Why Cloud Computing Will Never Be Free,” Communications of the ACM, Vol. 3, No. 5, 2010, pp. 62-69. doi:10.1145/1735223.1735242
- Gartner Research, “Gartner Says Worldwide Cloud Services Market to Surpass $10.9 Billion in 2012,” 2012. http://www.gartner.com/it/page.jsp?id=2163616
- Gartner Research, “Gartner Says Worldwide Softwareas-a-Service Revenue to Reach $14.5 Billion in 2012,” 2012. http://www.gartner.com/it/page.jsp?id=1963815.
- R. S. Randhawa and S. Kumar, “Usage Restriction and Subscription Services: Operational Benefits of Rational Users,” Manufacturing & Service Operations Management, Vol. 10, No. 3, 2008, pp. 429-447. doi:10.1287/msom.1070.0180
- J. Fitzgerald and J. Hynes, “Salesforce.Com Announces Third Quarter Fiscal Year 2005 Results,” 2012. http://www.sfdcstatic.com/assets/pdf/investors/EarningsPR_Q305.pdf
- D. Havlek, “Salesforce,” 2012. http://www.stdcstatic.com/assets/pdf/investors/Q412_Press_release_Final_financials.pdf
- A. Benlian and T. Hess, “Opportunities and Risks of Software-as-a-Service: Findings from a Survey,” Decision Support Systems, Vol. 52, No. 1, 2011, pp. 232-246. doi:10.1016/j.dss.2011.07.007
- Bessemer Venture Partners, “Bessemer’s Top 10 Laws of Cloud Computing and SaaS,” 2010. http://www.bvp.com/sites/default/files/bvps_10_laws_of_cloud_saas_winter_2010_release.pdf
- S. Noble, “Defining Churn Rate,” 2011. http://www.shopify.com/technology/4018382-defining-churn- rate-no-really-this-actually-requires-an-entire-blog-post
- T. Tzuo, “The Only Three SaaS Metrics That Matter,” 2012. http://www.slideshare.net/Zuora/zuora-always-on20123-saas-metrics-that-matter-12301579
- R. Doctors, R. Katz, J. Berstein and B. Schefers, “Is the Price Right? Strategies for New Introductions,” Journal of Business Strategy, Vol. 31, No. 3, 2010, pp. 29-37. doi:10.1108/02756661011036682
- J. Espadas, A. Molina, G. Jimenez, M. Molina, P. Ramirez and D. Concha, “A Tenant-Based Resource Allocation Model for Scaling Software-as-a-Service Applications over Cloud Computing Infrastructures,” Future Generation Computer Systems, Vol. 29, No. 1, 2012, pp. 273-286. doi:10.1016/j.future.2011.10.013
- K. Popp, “Software Industry Business Models,” IEEE Software, Vol. 28, No. 4, 2011, pp. 26-30. doi:10.1109/MS.2011.52
- J. Qi, L. Zhang, Y. Liu, L. Li, Y. Zhou, Y. Shen, L. Liang and H. Li, “ADTreesLogit Model for Customer Churn Prediction,” Annals of Operations Research, Vol. 168, No. 1, 2009, pp. 247-265. doi:10.1007/s10479-008-0400-8
- G. Nie, W. Rowe, L. Zhang, Y. Tian and Y. Shi, “Credit Card Churn Forecasting by Logistic Regression and Decision Trees,” Expert Systems with Applications, Vol. 38, No. 12, 2011, pp. 15273-15285. doi:10.1016/j.eswa.2011.06.028
- H. Lee, Y. Lee, H. Cho, K. Im and Y. S. Kim, “Mining Churning Behaviors and Developing Retention Strategies Based on a Partial Least Square (PLS) Model,” Decision Support Systems, Vol. 52, No. 1, 2011, pp. 207-216. doi:10.1016/j.dss.2011.07.005
- K. Coussement and D. Van den Poel, “Churn Prediction in Subscription Services: An Application,” Expert Systems with Applications, Vol. 34, No. 1, 2008, pp. 313-327. doi:10.1016/j.eswa.2006.09.038
- J. Ahna, S.-P. Han and Y.-S. Lee, “Customer Churn Analysis: Churn Determinants and Mediation,” Telecommunications Policy, Vol. 30, No. 10-11, 2006, pp. 552-568.
- G. Madden, S. Savage and G. Coble-Neal, “Subscriber Churn in the Australian ISP Market,” Information Economics and Policy, Vol. 11, No. 2, 1999, pp. 195-207. doi:10.1016/S0167-6245(99)00015-3
- J. York, “SaaS Metrics Guide to SaaS Financial Performance,” 2010. http://chaotic-flow.com/saas-metrics-guide-to-saas-financial-performance