Positioning
Vol.4 No.2(2013), Article ID:31503,9 pages DOI:10.4236/pos.2013.42014
Acquisition of Weak Signals in Multi-Constellation Frequency Domain Receivers
![]()
1Department of Electrical Engineering, École de Technologie Supérieure, Montreal, Canada; 2Department of Geomatics Sciences, Université Laval, Quebec, Canada.
Email: kaveh.mollaiyan.1@ens.etsmtl.ca
Copyright © 2013 Kaveh Mollaiyan et al. This is an open access article distributed under the Creative Commons Attribution License, which permits unrestricted use, distribution, and reproduction in any medium, provided the original work is properly cited.
Received January 16th, 2013; revised February 18th, 2013; accepted March 5th, 2013
Keywords: FFT Acquisition; Frequency Domain Receiver; Weak Signal; Multi-Constellation
ABSTRACT
New positioning applications’ availability requirements demand receivers with higher sensitivities and ability to process multiple GNSS signals. Possible applications include acquiring one signal per GNSS constellation in the same frequency band and combining them for increased sensitivity or predicting acquisition of other signals. Frequency domain processing can be used for this purpose, since it benefits from parallel processing capabilities of Fast Fourier Transform (FFT), which can be efficiently implemented in software receivers. On the other hand, long coherent integration times are mainly limited due to large FFT size in receivers using frequency domain techniques. A new method is proposed to address the problems in frequency domain receivers without compromising the resources and execution time. A pre-correlation accumulation (PCA) is proposed to partition the received samples into one-code-period blocks, and to sum them together. As a result, the noise is averaged out and the correlation results will gain more power, provided that the relative phase between the data segments is compensated for. In addition to simplicity, the proposed PCA method enables the use of one-size FFT for all integration times. A post-correlation peak combination is also proposed to remove the need for double buffering. The proposed methods are implemented in a configurable Simulink model, developed for acquiring recorded GNSS signals. For weak signal scenarios, a Spirent GPS simulator is used as a source. Acquisition results for GPS L1 C/A and GLONASS L1OF are shown and the performance of the proposed technique is discussed. The proposed techniques target GNSS receivers using frequency domain processing aiming at accommodating all the GNSS signals, while minimizing resource usage. They also apply to weak signal acquisition in frequency domain to answer the availability demand of today’s GNSS positioning applications.
1. Introduction
Using FFT as a new way to carry out the correlation was first introduced by Van Nee and Coenen [1]. Frequency domain receivers use FFT to search all Doppler bins or code delays simultaneously at each search step. In the most computationally efficient implementation, correlation is carried out by multiplying FFT of the incoming samples with complex conjugate of the FFT of the local code, and then performing Inverse FFT (IFFT) on the complex results to transform it back into time domain. Since multiplication in frequency domain replaces the conventional correlation in time domain, FFT correlation can be executed much faster than time domain correlation. The drawback of frequency domain acquisitions, however, is that large amounts of resources are required for transforming from one domain into another. The computational load of the FFT process is directly related to the size of the block of processed samples. The main contributor to the computational load of FFT-based approach is the complex multiplications, the number of which increases with the number of samples. This is especially problematic where the number of samples becomes larger. To capture all the modernized GNSS signals in a single frequency band, a multi-constellation GNSS receiver should sample the signal at a high sampling rate. This raises lots of issues in multi-constellation receivers as well as weak signal situations. The problems associated with FFT acquisition in these types of receivers are addressed herein. Solutions to the bottlenecks in FFT acquisition using long coherent integration times are also discussed and an acquisition scheme based on parallel code phase search is proposed for BPSK signals.
2. Literature Review
2.1. Down Conversion to Baseband in Multi-Constellation Receivers
In most receivers, the received GNSS signals, which are in radio frequency (RF) band, are down converted to a more easier to process intermediate frequency (IF) by the RF frontend. In software receivers, a second down conversion to baseband is performed to facilitate the use of less computation-hungry signal processing techniques. The analog signal has to be digitized prior to digital IF processing. An Analog-to-Digital Converter (ADC) is used for this task by sampling the analog signal at . The sampling frequency
  is chosen according to the bandwidth of the last IF stage in the RF frontend. For a multi-constellation receiver, the bandwidth of the last IF stage has to be large enough to accommodate all GNSS signals in all admitted frequency bands.
The maximum bandwidth in L1 frequency band is 30 MHz. The Nyquist rule demands a minimum sampling frequency of 60 MHz. With a sampling rate this high, even for one millisecond of data, FFT would have to be performed on 60,000 samples, which makes it impractical for implementation. Hence, the signal has to be down sampled lower computational complexity, execution time, and optimum use of resources. One of the widely used methods for down sampling is the averaging correlation, which has been first proposed by Starzyk and Zhu [2]. In this method, for a signal sampled at 5 MHz, each 4 or 5 consecutive samples are averaged into one chip to make 1023 samples per millisecond. Therefore, the signal is down converted from 5 MHz to 1.023 MHz, to make use of the smallest possible FFT blocks. The problem with this approach is that without any a priori information on the position of the chips, it is hard to determine which 4 or 5 samples has to be grouped together before averaging. Therefore, 5 sequences of averaged samples averaged at a different offset have to be tested. Testing 5 such sequences can be costly in terms of computation and resources, especially, with higher sampling rates. The overlap and average method has been presented in [3] as a solution to high sampling rates. The overlap and average method uses a linear algorithm to combine the correlation of the received samples with 3 copies of replica code shifted over the averaging interval. Better results have been obtained in the case of a relative shift between the received samples and the replica code. Thus, averaging can be used to reduce the FFT size for hardware implementation. However, the design should account for averaging loss due to the relevant shift between the received samples and the replica code.
2.2. Brief Description of Double Block Acquisition and Related Work
Double Block Zero Padding (DBZP) is a method more suitable for acquisition of weak signals. This method was first introduced in [4] and was also referred to as Circular Correlation by Partition and Zero Padding in [5]. This method performs long coherent integration with fewer operations and higher sensitivity than other FFT based techniques. In this method, for 1 ms of integration time, the received IF samples are first down-converted to baseband. The baseband samples are then partitioned into  blocks of
  samples, where
  is the number of Doppler bins. Assume Doppler bin separation is equal to
 , where
  is the coherent integration time. If the acquisition targets Doppler range of
 , the number of Doppler bins for 1 ms integration time is equal to
  /(1 KHz). Each two adjacent
  -point blocks are combined into a double sized block of
 ![]() points with
points with  overlapping samples between the resulting blocks. One millisecond of locally generated PRN code is also partitioned in the same way but padded with
  zeros instead to produce
  double-sized blocks. Each block of received samples is circularly correlated with the corresponding block of the local code. Only the first
  samples are kept and the resulting blocks are arranged into columns of a correlation matrix. This procedure is repeated
  times, each time with a circularly shifted code replica by double blocks. The results are appended together to form a
  correlation matrix, where
  is the number of samples in 1 ms of received data. Then, a
  -point FFT is performed on each column of the correlation matrix. For an integration time of
  ms, number of Doppler bins is multiplied by
 , and coherent integration is performed by the column-wise post-correlation FFT with the length of
 . Figure 1 shows a block diagram of DBZP acquisition algorithm for one combination of replica code double blocks. This procedure is repeated to generate the final
  correlation matrix.
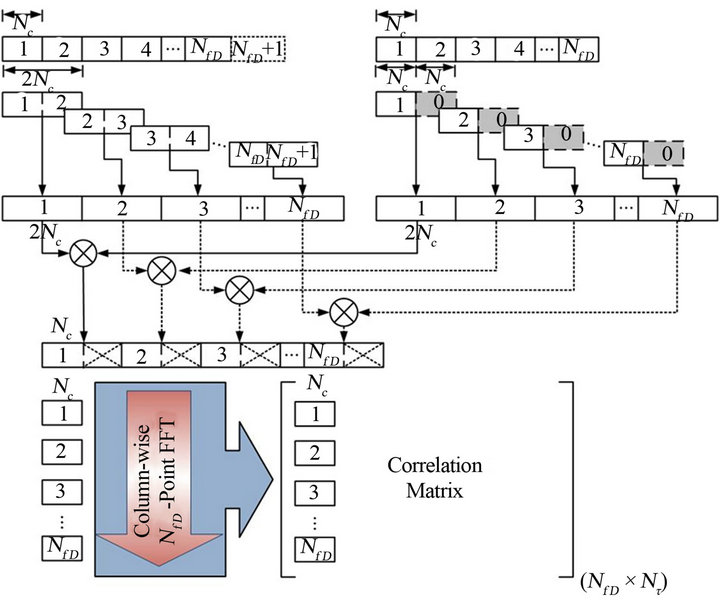
Figure 1. An acquisition step of the DBZP method.
Although the DBZP method proves to be powerful in terms of sensitivity and computational efficiency compared to conventional circular correlation methods, it is not practical for hardware implementation in FPGAbased receivers due to large resource requirements caused by the increasing FFT length in weak signal conditions. Ziedan and Garisson proposed a modified version of this method for long coherent integrations over multiple data bit intervals [6]. Other attempts have been made to improve the computational complexity of the proposed methods [7]. Although these methods can perform well in terms of sensitivity, their implementation in hardware is resource-intensive. Aside from the fact that the above methods are all implemented in software, they process signals at very low sampling rates such as 2.048 MHz, and cannot be used directly with high sampling rates. Also, if averaging correlation is used, they will lose their fidelity because the navigation message contained in data bits will be affected by the nature of averaging.
2.3. Pre-FFT Zero-Padding
Circular correlation can be performed efficiently with FFT by Parallel Code Phase Search (PCPS) method. Computationally, PCPS is the most efficient method to perform FFT acquisition, because it calculates correlation for all the code phases at the same time. Figure 2 shows the block diagram of the PCPS method. Since radix-2 FFT requires a power of two data length, which most sampling rates would not lead to, zero padding is inevitable. Both received data and code replica are sampled at the same rate, and the resulting sequences are zero padded to their next power of two.
However, the relative starting position of the code chips is unknown. Inserting zeros after the samples will corrupt the periodicity of the code and therefore will result in correlation loss. The amount of this correlation loss depends on the number and location of zeros in the down-converted data stream. Figure 3 shows the correlation peak loss in a tail zero padding, where zeros are simply appended to the tail of the data block, for different FFT sizes. The loss is proportional to number of zeros divided by the FFT length. It can be seen that the
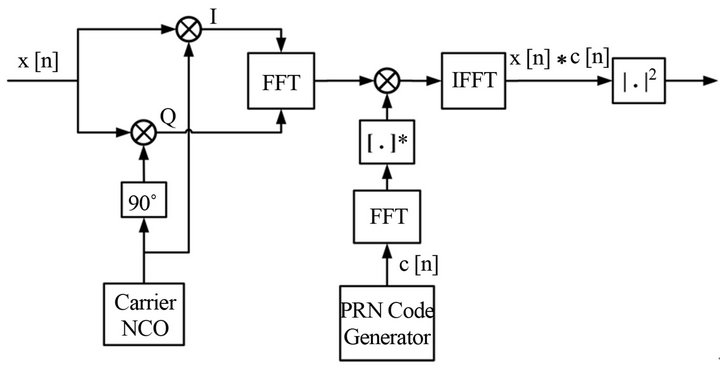
Figure 2. Block diagram of the PCPS method.
shorter the length of the sequences, the more critical becomes the zero padding loss. A tail zero padding of less than 100 samples for a 2048-point FFT results in less than 0.5 dB loss in the correlation peak.
Zero padding may result in partial correlation of the received signal with the code replica. One solution is to use extended data blocks to ensure that at least one full correlation can be obtained after correlation. This is especially useful for periodic codes. This can be done using the same architecture shown in DBZP except that multiplication is followed by an IFFT of the resulting blocks. Figure 4 depicts the partial correlation in the single and double block scenarios.
3. Methodology
3.1. Averaging Correlation as Decimation
Although averaging correlation can be used to down sample the signal to lower frequencies, some important
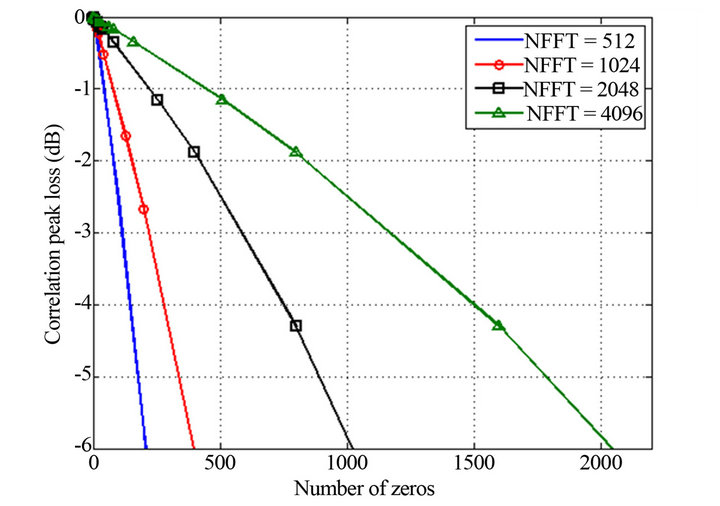
Figure 3. Correlation peak loss due to zero padding for different FFT sizes.
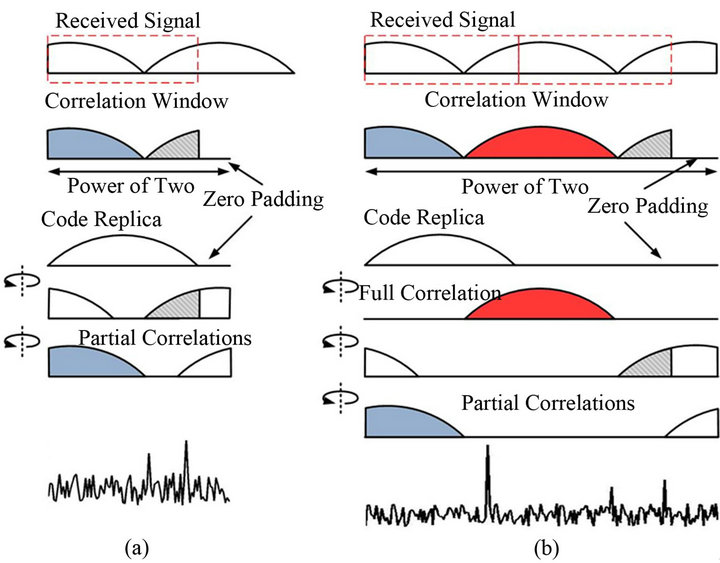
Figure 4. (a) Partial correlation in a single-block zero padding scheme (b) Partial and full correlations using DBZP algorithm.
factors have to be considered when using this method. There is a limit to the number of samples being averaged. This number should be appropriately chosen according to the FFT size and the code’s chipping rate, leading a minimum of one averaged sample per chip. Averaging is also associated with a correlation loss related to the beginning of the replica code sequence.
For the C/A code, the chipping rate is 1.023 MHz and there are 1023 chips in one 1 ms code period. Therefore, 1023 samples would be enough to produce all the chips in one period of the C/A code. Assume a GPS signal sampled at  MHz. One C/A code period of this signal contains 60,000 samples. This number has to be reduced to make this signal ready for practical FFT processing. If, for instance, each 12 samples of the above GPS signal are averaged into one sample, our GPS signal will be down sampled to 5 MHz. We refer to the number of samples to be averaged as the averaging window, which is equivalent of the decimation factor, and is noted by
 . The impulse response of the averaging system can be consequently derived
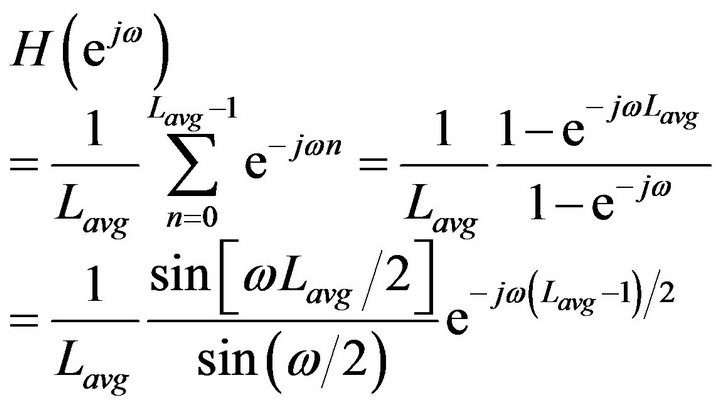 (1)
(1)
The first zero occurs at . In other words, the one-sided bandwidth of the averaging filter is
  (Hz). Depending on the bandwidth of the signal of interest, the averaging length can be selected to decimate the signal for more resource frugality and computationally efficient processing. According to the Nyquist theorem, a minimum 2 MHz sampling frequency is required to avoid aliasing for GPS L1-C/A. However, when a signal is down sampled, adjacent side lobes fold into the frequency band of interest and therefore, a pre-sampling (anti-aliasing) filtering is required to prevent it. The averaging technique does this task by removing the frequencies above
  Hz. Figure 5 depicts the GNSS spectrum during down conversion and averaging process in details.
The averaging filter bandwidth of 2 MHz is higher than that of the GPS L1-C/A. The idea is to reduce the bandwidth, by increasing , and still be able to accommodate the L1-C/A signal. Although, this results in the signal to be down sampled by
 , which causes the main lobes to alias into each other. It can be shown that even with aliasing, the signal can still be acquired, as long as a minimum resolution of one sample per chip is satisfied.
GLONASS L1OF signals have similar characteristic as GPS L1 C/A. The FDMA modulation scheme, as opposed to the CDMA modulation of GPS, makes a difference only in the down conversion stage of the receiver. The down conversion to baseband is accomplished by using each satellite’s offset frequency from the IF. Total bandwidth of GLONASS L1 C/A signals is approximately 8 MHz (14 × 0.562.5 + 0.511 MHz). The bandwidth of interest for each satellite channel is 1 MHz, even smaller than that of the GPS. The averaging length, therefore, used for GLONASS signals is chosen to be twice that of the GPS. Although, a larger bandwidth can also be used for GLONASS signals. Thus, the same scheme described above can be adapted for GLONASS L1OF.
The drawback of the averaging correlation method is that the data bits will be corrupted, if the data bit transitions are unknown. Thus, coherent integration time is limited to the duration of one data bit. However, if the data bit transitions are known, averaging can be aligned with data bit transitions with an averaging window length that is the closest to a divisor of data bit duration. This way, data bits are preserved in the decimated samples.
3.2. Post-FFT Signal Recovery
As discussed in Section 2, the DBZP method uses two code periods to ensure full correlation, and then discards the other block with partial correlation and the padded zeros from the correlation results after IFFT. The full correlation is guaranteed at the price of twice the buffer length. If the partial correlation peaks in the single block can be somehow combined, they will sum into a full
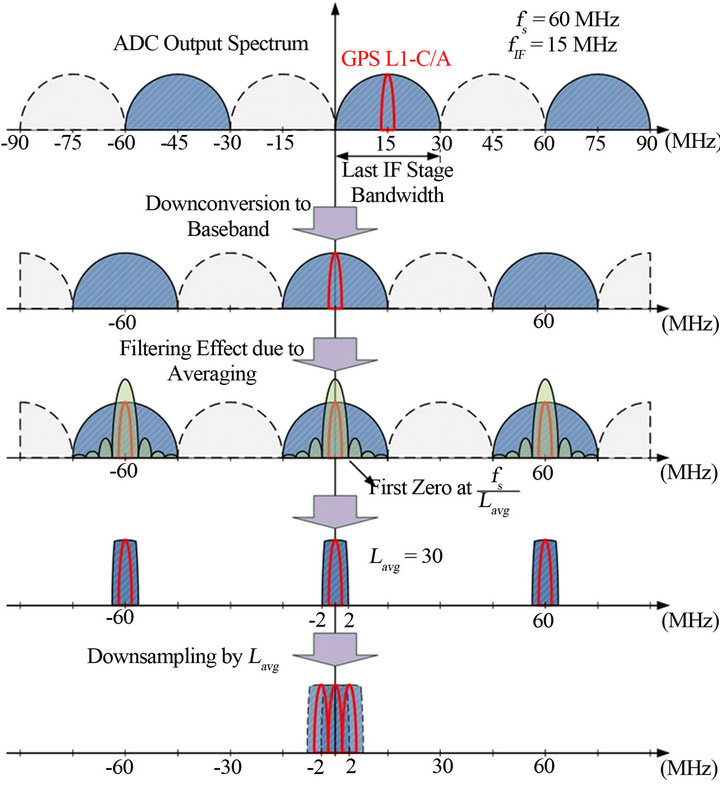
Figure 5. Down conversion of digitized signal to baseband and down sampling by averaging the samples.
correlation. This will result in the same level of reliability compared to the DBZP method while using half the length of the buffers.
Assume the length of the signal of interest is samples. To combine the acquisition’s partial peaks, the FFT length should be at least one block longer. Since FFT length must be a power of two, it can be modeled as
 , where
  is the number of zero-padded samples. The first
  points of the correlation results contain one of the partial peaks. The following
  samples are zeros because of the zero samples multiplied by the shifted replica at these lags. The last
  samples again produce partial correlation results. The second peak is also located at the same offset, from the last zero sample, as the first peak. This is because the replica wraps around the zeros and correlates with the rest of the samples. This is shown in Figure 6.
Therefore, to combine the peaks, the first  samples of the IFFT results are added to the second
  samples, at the same indices in each block, and the
  zeros are discarded. This leaves
  points with one full correlation peak. The blocks are combined right after IFFT and before squaring to preserve the true peak’s amplitude.
3.3. Proposed FFT Acquisition Architecture
The proposed FFT acquisition architecture is shown in Figure 7. The averaging is done by the window of size , providing a 1.2 MHz bandwidth. With this bandwidth, GPS and GLONASS signals can be acquired with the same channel architecture. The difference for GLONASS is that the satellite frequency offset must be considered in the carrier wipe-off stage. The incoming samples are buffered for only one code period or one block for one code period integration time.
For longer integration times,  samples or
  blocks are buffered. The pre-FFT coherent combining block performs pre-correlation accumulation (PCA) by partitioning the data samples into
  blocks of
  samples and multiplying each block with
 where k is the block index, so that samples with the same index in each block can be added together. The multiplication is required to preserve the coherency between consecutive blocks. Summation of
  blocks of phasecompensated samples produces a block of
  combined samples. The advantage of the proposed method of coherent combination is that the same FFT length is used for any duration of data. Zeros are padded to the end of the block to make the length of samples equal to the next power of two greater than
![]() . Zero padded samples are then FFT transformed and get multiplied with the complex conjugate of the FFT of the local code. The product then goes through the IFFT transform. A peak reconstruction module is placed right after the IFFT and before squaring, which sums the first and the last
. Zero padded samples are then FFT transformed and get multiplied with the complex conjugate of the FFT of the local code. The product then goes through the IFFT transform. A peak reconstruction module is placed right after the IFFT and before squaring, which sums the first and the last  samples and discards the zeros. The final correlation results are squared and processed thereafter by the peak detection algorithm.
4. Simulation of the Proposed Algorithm
4.1. Test Setup and Simulink Model
The proposed method was tested using recorded data
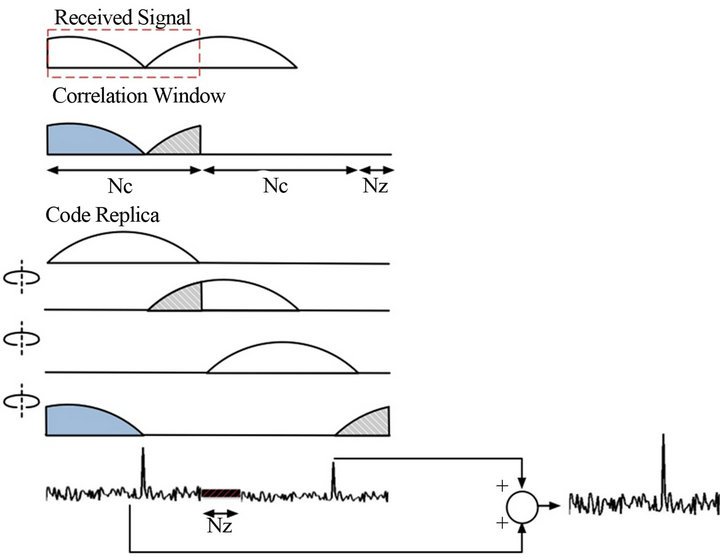
Figure 6. Proposed method to combine partial peaks.
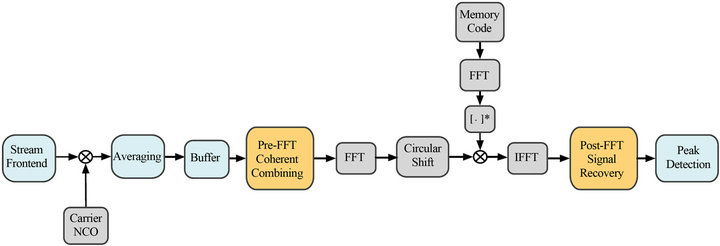
Figure 7. Proposed FFT acquisition with post-FFT signal recovery.
through an RF frontend designed to capture all GNSS signals in the L1 band with a maximal bandwidth of 24 MHz and sampling frequency of 60 MHz. This RF frontend is connected to a Lyrtech board consisting of an ADC and a Virtex 4 FPGA for baseband processing. Digitized output of the ADC can be logged into a binary file and post-processed by the proposed Simulink model. Figure 8 shows the data acquisition setup used for collecting and processing the GNSS raw data.
For live signal acquisition, a Novatel 702 antenna is connected to the RF frontend. To test weak signal acquisition, a Spirent GSS7700 GPS simulator is hooked up to the receiver for more control over satellite power levels and flexibility of the test scenarios.
To verify the functionality of the proposed approach, recorded live signals are streamed from Matlab to the Simulink model. The Simulink model consists of the data stream front-end, down-conversion, conditioning unit, and an acquisition channel. Figure 9 shows different modules of the Simulink model.
4.2. Live Signal Acquisition
To test the proposed acquisition algorithm with live signals, a set of GPS signals were recorded in open sky conditions. The tracking information of the receiver platform was captured at the time of data logging for comparison of the acquisition parameters. Status of the satellites and the result of acquisition using the Simulink model are given in Table 1.
The two-dimensional search grid for PRN#14 is shown in Figure 10. The coherent integration time used for the acquisition is only 1 ms. By using the proposed algo-
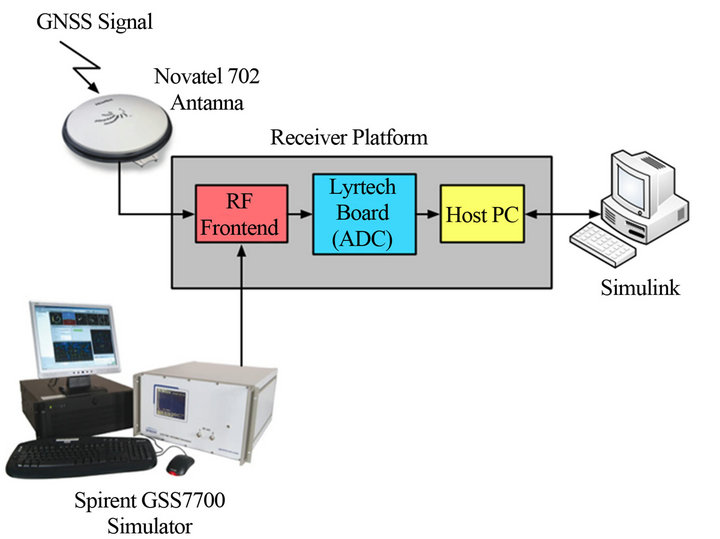
Figure 8. Data acquisition setup.
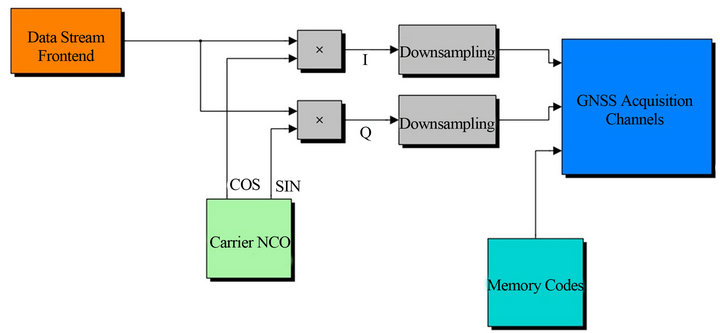
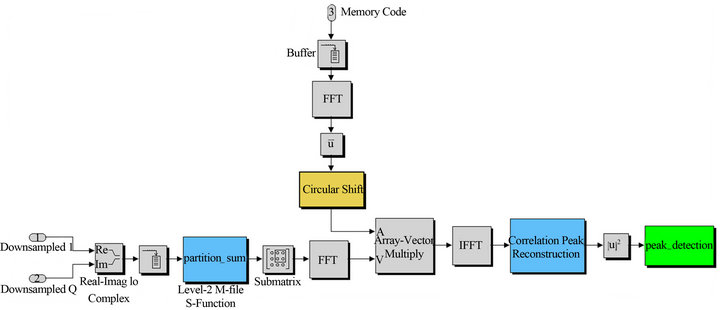
Figure 9. Simulink model: (top) Stream front-end and down-conversion (bottom) acquisition channel.
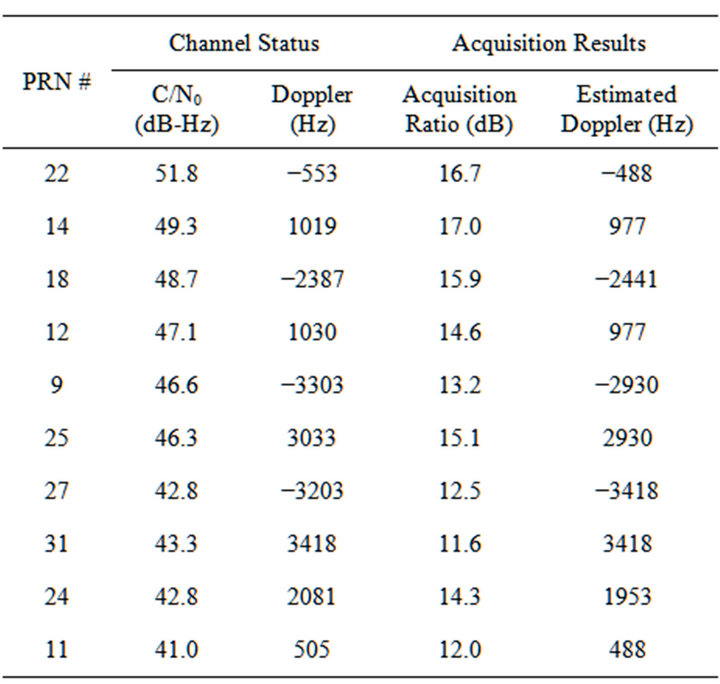
Table 1. Channel status and the acquisition results for recorded live GPS L1 C/A signals.
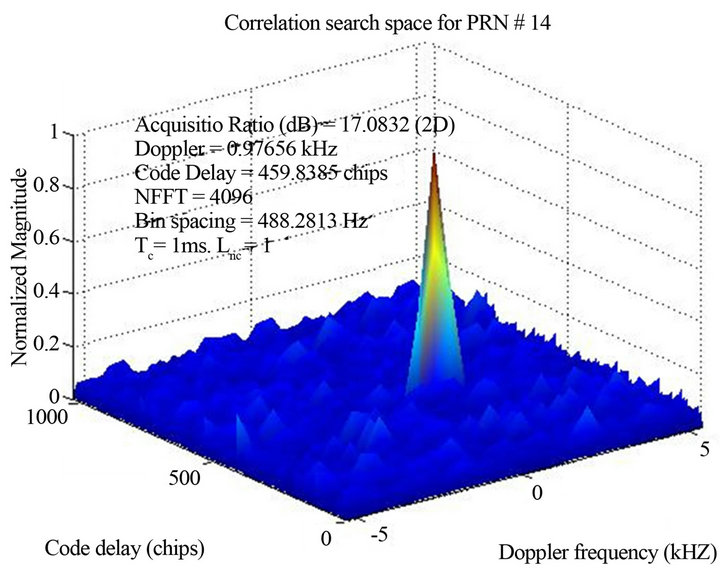
Figure 10. Recorded live GPS L1-C/A acquisition search grid for PRN #14.
rithm, each block is composed of 1200 samples, and 4096-point FFTs are performed. The power of signals is expressed by a two-dimensional acquisition ratio, which is defined as the ratio of the peak to the variance of the noise floor. The acquisition ratio is equivalent to postcorrelation signal-to-noise ratio (SNR). The receiver frontend has a bandwidth of 24 MHz and noise figure of 3.17 dB. Using Frii’s formula the effective temperature of the receiver is equal to 452.47 K. For a signal power of −128 dBm with sampling rate of 60 MHz, Doppler bin resolution of 488 Hz, and one millisecond integration time, the post correlation SNR is expected to be 14.57 dB. To calculate peak power more accurately, the peak as well as adjacent high-magnitude bins are being removed for noise floor variance calculation. Also, noise floor is calculated for a two-dimensional grid to give a more accurate measure of SNR. The acquisition ratio clearly shows that the proposed method produces a peak, as strong as DBZP method.
GLONASS signals have also been recorded and used for acquisition. The same architecture as in Figure 7 is used, except for the length of the buffer, which is half the length of that used for GPS, and therefore, length of FFT is divided by two. The length of the averaging window is doubled  because the bandwidth of the GLONASS signals is 511 kHz. Acquisition search grid for RF channel #0 is shown in Figure 11. The acquisition results for the rest of the channels are given in Table 2.
4.3. Acquisition of Weak Signals Using a GPS Simulator
To test the acquisition of weak signals, a Spirent GSS 7700 GPS simulator is used. Signal power levels are first set to normal values and then gradually lowered to the point where the position, velocity, and time (PVT) solution is lost and satellites are about to lose lock.
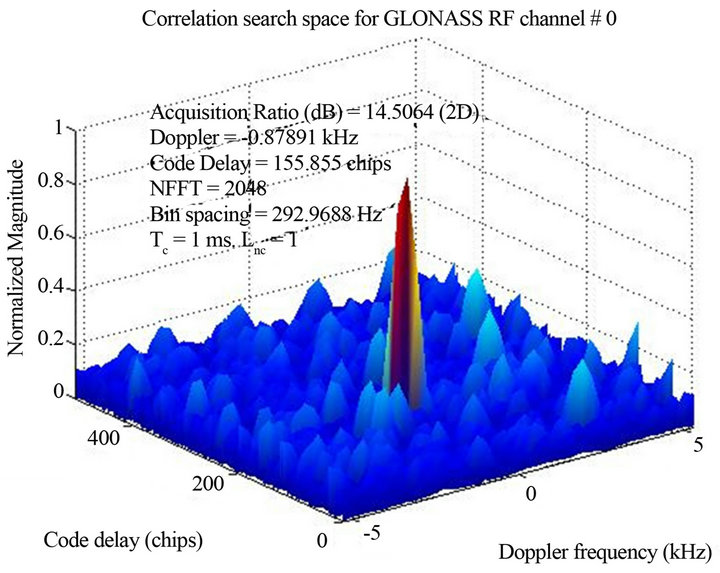
Figure 11. Recorded live GLONASS L1OF acquisition search grid for RF frequency slot #0.
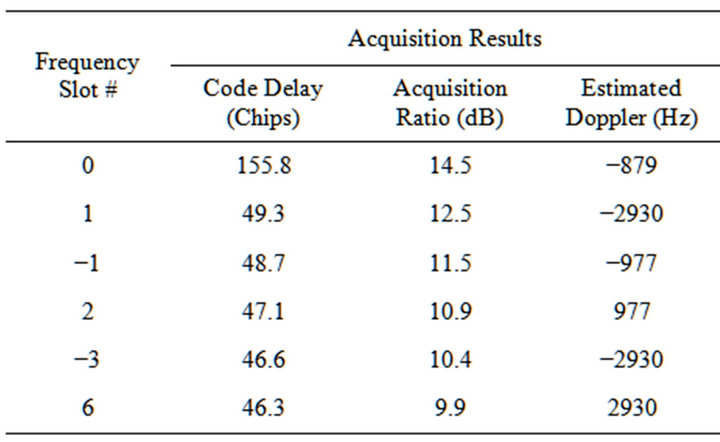
Table 2. Acquisition results using the proposed algorithm for recorded live GLONASS signals.
The reduction in power level is done for all the satellites simultaneously and uniformly. Figure 12 shows simulator signal power right before PVT loss. At this point, the output of the front-end is recorded in the same way as for the live signals. Figure 13 depicts status of satellites at the time of recording. The same architecture is used to acquire the recorded simulator signals. Acquisition is performed by increasing the coherent integration time, until a peak is found. Channels status and acquisition results are given in Table 3. Acquisition search grid for PRN #32 and PRN #9 are also shown in Figure 14.
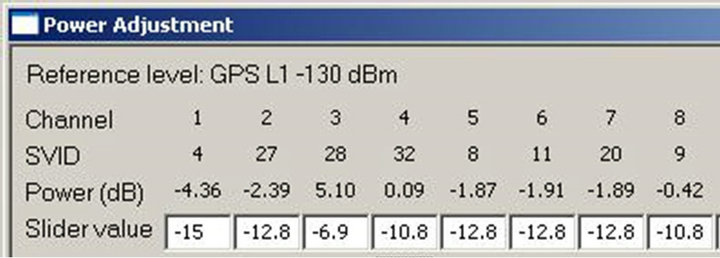
Figure 12. Simulator signal level right before PVT loss.
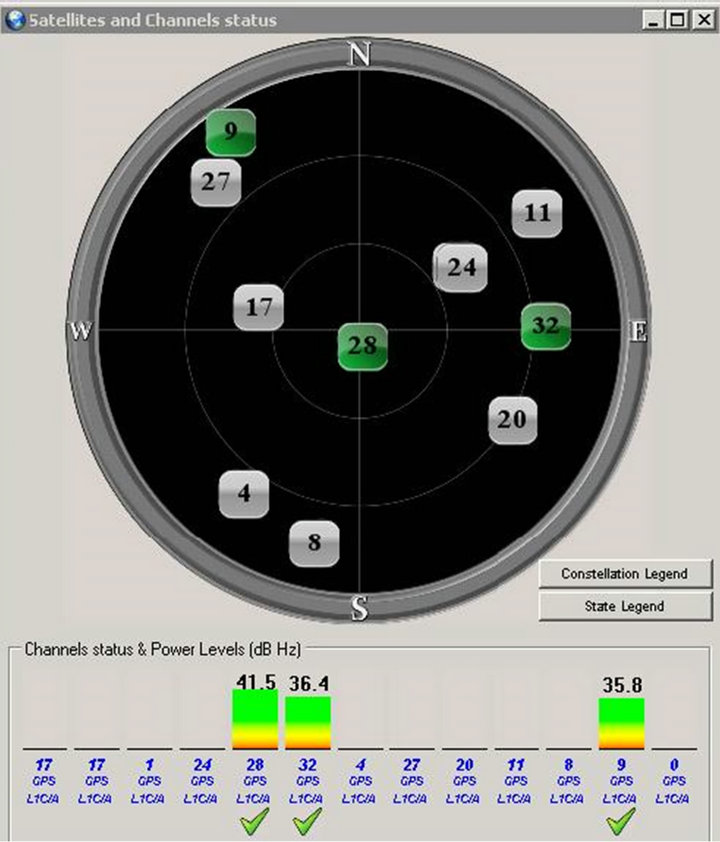
Figure 13. Sky plot at the time of recording.
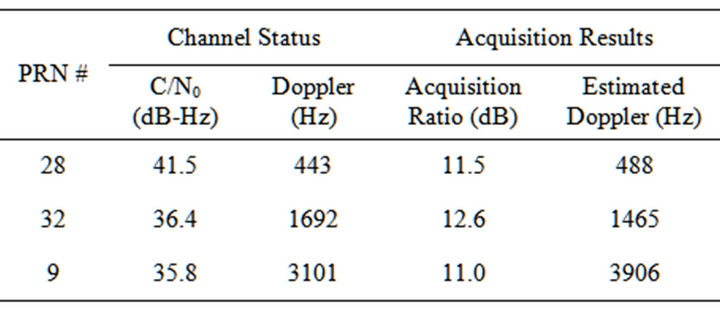
Table 3. Channel status and the acquisition results for recorded simulator GPS L1 C/A signals.
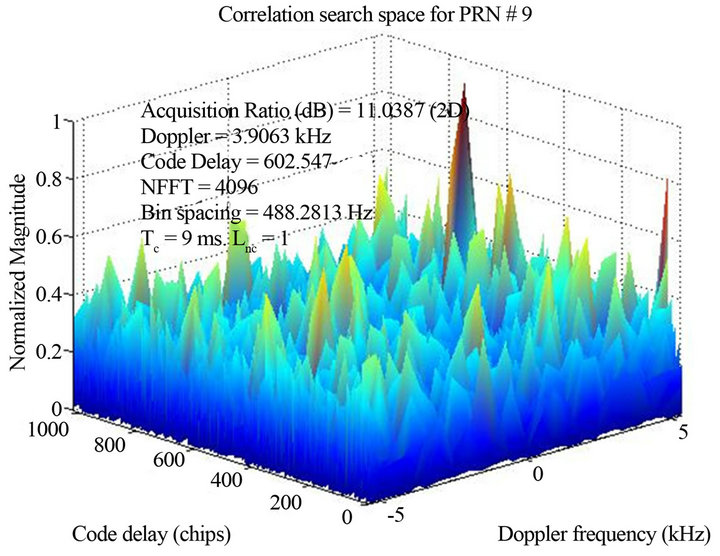
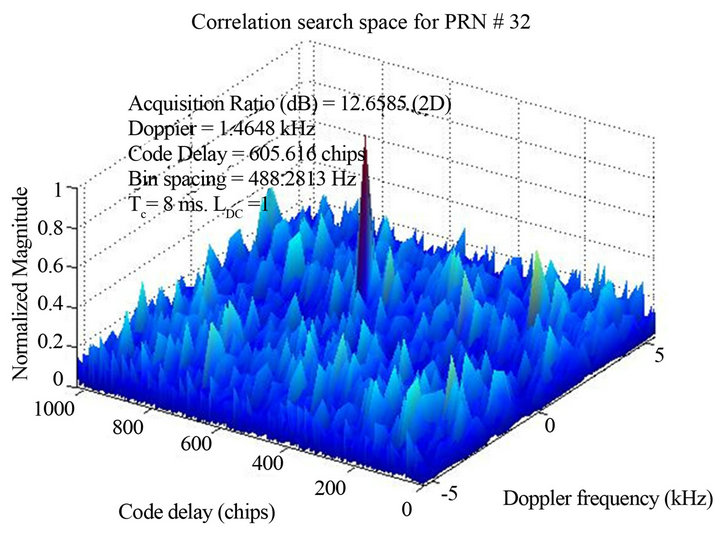
Figure 14. Recorded simulator GPS L1-C/A acquisition search grid for (top) PRN #28 and (bottom) PRN #32.
It can be seen that all the tracked satellites are successfully acquired using long coherent integration times. Estimated Doppler of the weakest signal, PRN #9, with the highest Doppler value, has more error than the other two satellites. The noise floor of the search space clearly shows the weakness of the signal.
5. Conclusion
Multi-constellation receivers allow for smart usage of available GNSS satellites through the globe. Challenges in the design of these receivers as well as the use of FFT acquisition them have been addressed. Two algorithms have been proposed as part of FFT acquisition architectture. The post-correlation peak combination algorithm uses half resource as much of the well-known DBZP while having the same performance. The PCA method enables the use of a single FFT length for longer coherent integration times, which makes it suitable for week signal acquisition. The proposed architecture uses only 4096-point FFTs for GPS L1-C/A and 2048-point for GLONASS L1OF. It has been shown that the proposed method is able to acquire GPS signals of 36 dB-Hz without any a-priori information. If data bit information is somehow provided, e.g. wireless link or cellular data assistance, the integration time can be further extended. Future work includes modification of the proposed technique for BOC modulated signals and longer codes.
6. Acknowledgements
This research project was funded by Fonds québécois de la recherche sur la nature et les technologies (FQRNT).
REFERENCES
- D. J. R. Van Nee and A. J. R. M. Coenen, “New Fast GPS Code-Acquisition Technique Using FFT,” Electronics Letters, Vol. 27, No. 2, 1991, pp. 158-160. doi:10.1049/el:19910102
- J. A. Starzyk and Z. Zhu, “Averaging Correlation for C/A Code Acquisition and Tracking in Frequency Domain,” Proceedings of the 44th IEEE Midwest Symposium on Circuits and Systems (MWSCAS 2001), Dayton, 14-17 August 2001, pp. 905-908. doi:10.1109/MWSCAS.2001.986334
- J. Pang, F. V. Graas, J. Starzyk and Z. Zhu, “Fast Direct GPS P-Code Acquisition,” GPS Solutions, Vol. 7, No. 3, 2003, pp. 168-175. doi:10.1007/s10291-003-0070-6
- D. Lin, J. Tsui and D. Howell, “Direct P (Y)-Code Acquisition Algorithm for Software GPS Receivers,” Proceedings of the 12th International Technical Meeting of the Satellite Division of The Institute of Navigation (ION GPS 1999), Nashville, 14-17 September 1999, pp. 363- 367.
- D. M. Lin and J. B. Y. Tsui, “Comparison of Acquisition Methods for Software GPS Receiver,” Proceedings of the 13th International Technical Meeting of the Satellite Division of the Institute of Navigation, Salt Lake City, 19-22 September 2000, pp. 2385-2390.
- N. I. Ziedan and J. L. Garrison, “Unaided Acquisition of Weak GPS Signals Using Circular Correlation or DoubleBlock Zero Padding,” Position Location and Navigation Symposium (PLANS 2004), Monterey, 26-29 April 2004, pp. 461-470.
- G. W. Heckler and J. L. Garrison, “Experimental Tests of Unaided Weak Signal Acquisition Methods Using a Software Receiver,” Proceedings of the 19th International Technical Meeting of the Satellite Division of the Institute of Navigation (ION GNSS 2006), Fort Worth, 26-29 September 2006, pp. 1309-1320.