Journal of Geographic Information System
Vol.10 No.01(2018), Article ID:81668,32 pages
10.4236/jgis.2018.101002
Disparity-Based Generation of Line-of-Sight DSM for Image-Elevation Co-Registration to Support Building Detection in Off-Nadir VHR Satellite Images
Alaeldin Suliman, Yun Zhang
Department of Geodesy and Geomatics Engineering, University of New Brunswick, Fredericton, Canada

Copyright © 2018 by authors and Scientific Research Publishing Inc.
This work is licensed under the Creative Commons Attribution International License (CC BY 4.0).
http://creativecommons.org/licenses/by/4.0/


Received: September 16, 2017; Accepted: January 7, 2018; Published: January 11, 2018
ABSTRACT
The integration of optical images and elevation data is of great importance for 3D-assisted mapping applications. Very high resolution (VHR) satellite images provide ideal geo-data for mapping building information. Since buildings are inherently elevated objects, these images need to be co-registered with their elevation data for reliable building detection results. However, accurate co-registration is extremely difficult for off-nadir VHR images acquired over dense urban areas. Therefore, this research proposes a Disparity-Based Elevation Co-Registration (DECR) method for generating a Line-of-Sight Digital Surface Model (LoS-DSM) to efficiently achieve image-elevation data co-reg- istration with pixel-level accuracy. Relative to the traditional photogrammetric approach, the RMSE value of the derived elevations is found to be less than 2 pixels. The applicability of the DECR method is demonstrated through elevation-based building detection (EBD) in a challenging dense urban area. The quality of the detection result is found to be more than 90%. Additionally, the detected objects were geo-referenced successfully to their correct ground locations to allow direct integration with other maps. In comparison to the original LoS-DSM development algorithm, the DECR algorithm is more efficient by reducing the calculation steps, preserving the co-registration accuracy, and minimizing the need for elevation normalization in dense urban areas.
Keywords:
Stereo VHR Satellite Images, Off-Nadir Images, Disparity Maps, Elevation Data, Co-Registration, Building Detection, Line-of-Sight DSM

1. Introduction
Since buildings are the prominent object class in urban areas, building information is crucial for city planning and management applications. The commonly used data for extracting this type of information are the very high resolution (VHR) satellite images. Since buildings are inherently elevated objects, the integration of optical images and elevation data is of great importance for building detection applications. Accordingly, image-elevation co-registration to support elevation-based building detection in VHR satellite images has become an active area of research in the remote sensing community.
VHR optical satellite images have been acquired since 1999 by several earth observation systems. These images are characterized by broad coverage, sub- meter ground resolution, relatively low cost, and rich information content that is necessary for mapping complex urban environments. Additionally, due to the agility of the currently available satellite sensors, VHR images are usually acquired off-nadir with across-track and/or along-track angles to provide fast and various acquisition modes including mainly the stereo mode.
Stereo images are among the highly demanded types of images. This is because they allow generating stereo-based information (elevations and disparity information) which facilitates identifying elevated features. For urban mapping applications, elevation information plays a fundamental role in elevation-based building detection in VHR images. This is because the information about building heights improves the detection results by allowing accurate detection and reliable distinguishing of the building-roofs from even spectrally and/or spatially similar objects in urban environments such as parking lots.
Digital elevation models (DEMs) are commonly used to store elevation information in different forms. These forms include digital terrain models (DTMs) describing the terrain elevations, digital surface models (DSMs) describing the visible surface elevations (both terrain and off-terrain elevations), and the normalized digital surface model (nDSM) describing the aboveground elevations. However, these DEM forms represent only the geometric information and lack the rich information content of the optical VHR images (specifically radiometric, texture, spectral, and contextual information). Therefore, when DEM data are generated, they need to be integrated with their relevant optical data to achieve a more complete dataset for 3D-assisted information extraction applications.
The photogrammetric-based generation of elevation data from stereo VHR images is achievable at a cheaper rate than other remote sensing sources including LiDAR (Light Detection and Ranging) technology. The generated stereo-based elevation data represent the height information of the tops of surfaces such as buildings and trees; hence, they result in DSMs. Currently, VHR satellite sensors can produce multi-view inline stereo (MIS) images for the same region using the off-nadir acquisition capability. These MIS-VHR satellite images provide comprehensive coverage, minimize the occlusions in the complex environments, and allow dense and accurate DSMs to be generated.
The integration of the optical and elevation datasets leads to higher quality surface information since these two data types have complementary properties. Therefore, co-registering these two datasets is a valid integration approach to make one data source that compensates for the weaknesses of both. However, several problems are introduced when such multi-data sources are integrated, for instance, the problematic misregistration of DSMs when they are co-regis- tered to off-nadir VHR images. This problem is due to the severe perspective and relief displacement effects caused by the off-nadir acquisition of the VHR satellite images when captured over dense urban areas [1] [2] .
Bearing in mind this problem of optical-elevation data co-registration, our study reviewed the relevant literature. The line-of-sight DSM (LoS-DSM) solution introduced by Suliman and Zhang [3] provides accurate optical-elevation co-registration even for the off-nadir VHR satellite images more efficiently than the other available techniques. In this research, the aim is to improve the efficiency of this solution further by minimizing the computation steps, keeping the pixel-level co-registration accuracy, and reducing the need for elevation data normalization in dense urban areas.
Stereo images allow generating two types of co-related surface information: surface disparity maps (SDMs) and surface elevation models (DSMs). While the SDMs represent the relative measurements in the image spaces of one stereo pair, DSMs represent the absolute derived elevations in the object space. Disparity maps are computationally cost-effective and perfectly co-registered to the reference image as per disparity definition. Hence, the use of such maps should satisfy both reducing the computational steps and keeping the pixel-level co-registration accuracy. Additionally, if the epipolar rectification (normalization) plane was horizontal in the object space, a direct co-relation between the ground elevations and their corresponding disparities in the object space can be developed. When this normalization is at the average terrain elevation of the imaged area, the terrain relief displacement in the projected images should be minimal and hence the corresponding derived elevation data will be co-regis- tered to the image data with pixel-level accuracy and of minimal terrain relief effects. Therefore, the achieved elevation data should represent a co-registered LoS-DSM ready to be used for elevation-based building detection in dense urban areas with reasonable terrain relief variation.
The proposed procedure, based on our recently developed study in [4] , leads to the Disparity-based Elevation Co-Registration (DECR) method for efficiently generating LoS-DSM that is co-registered accurately to a selected reference image. Preliminary works of the current paper were presented briefly in [5] and [6] . The ultimate goal of the current research is to demonstrate the applicability of the DECR-based improved solution through an elevation-based building detection in off-nadir VHR satellite images acquired over challenging urban areas. The goal includes also geo-referencing the mapped rooftops in an off-nadir image for direct integration of other existing maps in geographic information systems (GIS).
The remainder of this paper is organized as follows: Section 2 reviews the previous works related to image-elevation data integration and identifies the research problem; Section 3 describes the proposed DECR method; Section 4 describes the DECR method validation procedure; Section 5 demonstrates the applicability of the improved LoS-DSM solution using the DECR method in an elevation-based building detection; and Section 6 describes the data used and discusses the achieved experimental results. Finally, the conclusions are drawn in Section 7.
2. Previous Works
As can be seen in the relevant literature, image-to-image registration methods are used widely to address the problem of accurate optical-elevation data co- registration. These methods, by considering the elevation data as 2.5D maps, aim to determine the point-by-point correspondence between two images of a scene by implementing four fundamental steps: feature extraction, feature matching, transformation model estimation, and resampling [7] . Since image and elevation data have different characteristics and appearances, the main challenge of these methods is detecting common objects in the images being co-registered [8] . Accordingly, co-registration methods, as reviewed extensively by [9] , are categorized generally as either feature-based or intensity-based methods. While feature-based methods establish the registration between the two datasets via matching common features, intensity-based methods utilize intensity values within the datasets to find similarity. The resampling process in most registration methods is applied to the elevation data, instead of the image data, in order to avoid producing any radiometric distortions that may affect the subsequent processes.
On the one hand, the common features used in feature-based methods include point, line, or planar/area features [10] . Point features extracted by a corner point detector were used by [11] to register an optical image to its corresponding LiDAR data. Line features were used by [12] to co-register both image and elevation data. For extracting building roofs using LiDAR data and multispectral imagery, [13] extracted the roof planes from both optical and LiDAR data and then co-related their centroids. On the other hand, intensity-based registration methods evaluate statistical dependency between the image and elevation datasets in order to derive similarity measures. These methods avoid the complex processing of feature extraction and matching, and hence provide better results. Mutual information, as the most successful example, has been proven to be effective for the optical and elevation data registration as demonstrated in [14] .
All of the image-to-image registration methods involve expensive computations during the four fundamental steps listed earlier. Moreover, in dense urban areas, most of these registration methods encounter major difficulties when off-nadir VHR satellite images are employed due to the severe building leaning caused by the off-nadir perspective acquisition of these images. In contrast to elevation models that have orthographic projection, the building leaning in the perspective images creates building facades that represent objects not included in the orthographic elevation models. Hence, unless the geometry information of the image acquisition is incorporated in the co-registration process, this projection difference in the two datasets poses a standing problem.
True orthorectification can provide accurate optical-elevation co-registration by generating orthoimages corrected for relief displacements and perspective effects. Many studies have benefited from the direct co-registration between the orthoimages and their corresponding elevation data for information extraction (e.g., [15] and [16] ). The orthorectification procedures, unlike most image-to- image registration methods, bypass the steps of finding common features and estimating transformation model parameters, required in conventional registration methods, by utilizing the image acquisition information. A comprehensive study on the urban true orthorectification process is provided by [17] . In this process, elevation data are used and the sensor model information of the employed perspective images are incorporated to eliminate the effects of the off- nadir perspective image acquisition and hence perfectly align image to elevation data [18] .
However, true orthorectification requires digital building models which are not available for most places. Additionally, it requires sophisticated algorithms for occlusion detection and compensation to fill the occlusion gaps. Furthermore, radiometric enhancement techniques are needed to correct and balance the resampled brightness values and produce seamless mosaics of true orthoimages. Hence, true orthoimages are expensive, time consuming, and difficult to achieve.
It has been concluded that all of the reviewed methods are inefficient―in terms of implementation cost and result quality―when off-nadir images over dense urban environments are employed. In contrast, a line-of-sight DSM (LoS-DSM) solution has been introduced recently by [3] to address the problem of efficient image-elevation co-registration based on incorporating the sensor model information of the images used. Thus, in this study, we are reviewing the LoS-DSM solution to identify aspects for improvement since it is a simple, promising, and recent technique for the problem posed in our research.
The LoS-DSM solution was developed to achieve accurate co-registration and preserve the original image information. It was proposed to mitigate the limitations of the other currently available methods. The solution algorithm is straightforward, efficient, and effective even when off-nadir images over dense urban environments are employed. The solution effectiveness has been demonstrated through elevation-based building detection in urban off-nadir VHR imagery. Nevertheless, we argue that the algorithm efficiency can be improved in terms of two aspects: minimizing the required computation steps, and reducing the need for elevation normalization.
Regarding the computation steps, this algorithm incorporates the sensor model information of the VHR images in two major steps: triangulating the elevation data photogrammetrically (space intersection) and then re-projecting these elevations back to the image space (co-registration) to achieve accurate registration and original image data preservation. Hence, the algorithm has redundant calculation steps that would be efficient if they are bypassed and, at the same time, the pixel-level co-registration accuracy is maintained. These redundant steps include the space intersection, bundle adjustment, and 3D coordinates’ calculation as well as the back re-projection of the triangulated DSM elevations.
Additionally, since the elevation data are transferred to the original image space, the terrain relief distortions in the off-nadir images are not eliminated or minimized. Hence, a normalization process for the co-registered DSM elevations, to generate the nDSM, cannot be ignored for dense urban areas even of moderate terrain variation, which is usually the case based on the geometric road design standards in urban areas. This process requires two subsequent steps: extracting the DTM from DSM data and then subtracting the resulting DTM from its corresponding DSM ( ). The extraction and subtraction steps usually introduce elevation errors that negatively affect the results of the 3D-based mapping applications. In the case of employing off-nadir VHR images acquired over dense urban areas, these errors become extremely serious due to the prominent existence of the building lean [19] .
Although the LoS-DSM solution was demonstrated to be successful even for off-nadir images, the original algorithm still has room for further improvement. The identified areas of improvement lie in the steps of elevation generation, co-registration, and normalization. Hence, the aspects of the research problem include (1) efficient generation of elevation data from MIS-VHR satellite images, (2) direct optical-elevation data co-registration of pixel-level accuracy with one of the employed images, and (3) minimized terrain relief variation of the co- registered elevations to reduce the need for elevation normalization.
The photogrammetric approaches, as executed in the original LoS-DSM algorithm, involve computationally expensive steps such as space intersection and bundle adjustment since the image-space SDMs and object-space DSMs are typically not scale co-related. Hence, if a scale relationship is achieved between SDMs and DSMs, an efficient generation and accurate co-registration of LoS- DSM will be accomplished since the SDMs, as per definition, are co-registered exactly to the reference image selected. Moreover, if the SDMs are measured from epipolar stereo images co-registered based on terrain-level features as demonstrated in [19] , the mapped SDMs will have minimal terrain effects. As a result, the derived DSM elevations from these SDMs should have minimal terrain effects that can be ignored to bypass the typical steps of DSM normalization in elevation-based building detection in dense urban areas.
Thus, we propose in this research an improvement for the three identified aspects by deriving elevation data (DSM) from enriched disparity maps of minimized terrain disparities in the relevant object space based on a scale relationship. This allows direct elevation data generation and accurate co-registration even with off-nadir VHR images. The proposed method is explained in the following section.
3. Disparity-Based Elevation Co-Registration (DECR) Method
The DECR method aims to generate efficiently a LoS-DSM co-registered to the relevant epipolar image data with pixel-level accuracy. The concept is to achieve a dense disparity map in the object space that has a scale relationship to the corresponding elevations. Since the generated disparity maps fit exactly their reference images as per definition, converting the co-registered disparity values to their corresponding elevations will result in perfectly co-registered elevation data to the same reference images. Hence, elevation values are generated and co-reg- istered based on the proportionality with their corresponding disparity values.
The DECR method utilizes two projection planes in the object space for co- relating the corresponding disparities from different epipolar stereo pairs and then derives transferring scales to generate additional disparity data (supplementary data) that are then fused to enrich and enhance the selected reference disparity map. This co-relation is created by a plying the Double Projection Planes (DPP) technique which was introduced in our recent study [4] . The achieved co-relation based on the DPP technique can then be extended further, as in the current paper, to derive elevation values from their corresponding disparities. The DECR method, as flowcharted in Figure 1, comprises five steps including the DPP steps: projecting the MIS-VHR satellite image onto two planes in the object space, constructing the epipolar images in the object space, calculating the disparity transferring and conversion scales, generating an enriched SDM by fusing the disparity data transferred from different stereo domains, and deriving the co-registered elevation model (i.e., disparity-based LoS-DSM). Further details about each step, including the incorporated DPP steps, are provided in the following subsections.
It is worth mentioning that the sensor model information for the employed images is essential for developing the DECR method. For VHR satellite images, the rational function model (RFM) is the typical sensor model. It has two different sets of rational polynomial coefficients (RPCs) for two opposite transformation forms that establish the relationship between the object and image spaces. They are forward (ground-to-image) and backward/inverse (image-to-ground) transformation forms [20] . Although the two sets of the RPCs are different and not correlated, most of the satellite image vendors provide the end users with one set of RPCs, namely the forward RFM model. If the RPCs of the inverse model are not available, they should be computed first. Readers who need to compute the backward RPCs are encouraged to consult the detailed explanations and calculations documented in [21] and [22] .

Figure 1. The flowchart of the disparity-based elevation co-registration (DECR) method for generating disparity-based LoS-DSM from MVIS-VHR satellite images. The figure shows also the integration between DPP and DECR methods.
3.1. Projecting the Inline Stereo Satellite Images
For building a co-relation among the disparities and their corresponding object-space elevation data, the input images need to be re-projected to be virtually in the relevant object-space plane. Moreover, to analytically derive the transferring scales (disparity-to-disparity) and the conversion (disparity-to-elevation) scales, the offset information resulting from extending this projection to a different horizontal plane is necessary. Hence, the two-way RFM sensor model information of the input images is critical. While the forward RFM model is used first to project the images to the object space, the backward RFM model is used to calculate the offset information required for deriving the transformation formulas. Figure 2 illustrates the proposed two-plane re-projection process, as modified from [4] , in twomain phases.
The first phase can be executed in five steps: (1) finding the approximate ground coverage of the MIS-VHR satellite images, (2) constructing a 2D object-space grid with the ground pixel size of the images to generate a set of planner X, and Y coordinates, (3) specifying a normalization plane (at a constant elevation Z) parallel to the elevation datum, (4) calculating the image locations corresponding to the ground coordinates by using the forward form of RFM, and (5) resampling the brightness values of the MIS-VHR images to the 2D object-space grid constructed earlier. The constant elevation of the projection plane is selected to be horizontal at the average terrain elevation of the imaged area―denoted in this paper by Zavg―in order to minimize the terrain relief distortions and to approximately straighten the epipolar lines of the projected VHR images acquired by linear array sensors.
The second projection phase is to analytically derive the transferring and conversion scale formulas. For this purpose, the images are required to be re-projected onto a different object-space constant elevation―referred to as (Z0)―is selected. Unlike the previous projection steps, the resampling process is not needed in this re-projection. However, this second projection phase is necessary just to determine the offsets of the ground pixel location in both X, and Y directions as described in Figure 2. This figure indicates double projection process: the first one using the forward model is from the constructed 2D ground grid to the image space in order to resample the image brightness, and the second one using the backward model is from the calculated image location back to a collinear ground location at different elevation (Z0) to find the offset information. The offsets can be easily calculated as expressed in Equation (1) below:
(1)
where and are the calculated ground pixel offsets in both X and Y
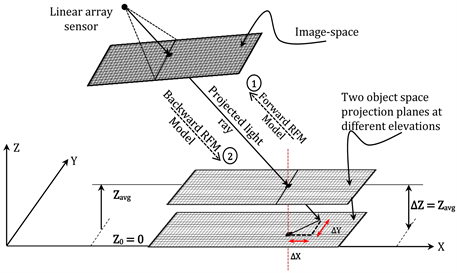
Figure 2. The proposed re-projection process at two object-space horizontal planes of different elevations. An image pixel is projected at two different elevations (Zavg and Z0) to generate two collinear 3D points for calculating its objects-space offsets.
directions respectively. and are the calculated ground pixel location at the elevations Zavg and Z0 respectively. The two 3D points are at different horizontal levels and collinear.
3.2. Constructing the Epipolar Images
Since the VHR satellite stereo images are re-projected into the object space at the average terrain level, two advantages should be achieved. First, the terrain-relief variation is minimized. This minimization makes the corresponding image points re-projected onto the object-space plane to have the minimum horizontal distances between each other. The consequence of that is the disparity values of the terrain-level features should be close to zero if the imaged area is of moderate relief variation. Second, the epipolar lines are approximated to be straight. This property results in that the corresponding points in the same object-space plane should lie on a straight line parallel to the epipolar direction. Therefore, to keep these two advantages, the re-projected VHR satellite images should be re-oriented to align the rows with the epipolar direction and in the same time to preserve the relative orientation and locations of the images for keeping the achieved terrain disparity minimization.
Therefore, to create the epipolar images and keep the mentioned properties, the planimetric coordinate axes of the object space (i.e., X, and Y axes) should be rotated by the angle of the epipolar direction in order to be parallel with the images’ row direction. This model of constructing and resampling epipolar images in the object space is explained in [23] .
The epipolar direction angle is also required to be applied to the offsets and calculated in the first step (using Equation (1)) for all ground pixels of each image. This can be achieved by applying Equation (2) in order to find the corresponding offset in the epipolar direction (i.e., ). Additionally, calculating the range of the perpendicular offsets ( ) allows further validation. For instance, if the range of the perpendicular offset ( ) was found to be within one pixel, this confirms the validity of the computed epipolar direction (q) and hence the calculated offsets ( ).
(2)
3.3. Calculating the Conversion Scales
By creating the epipolar images as described in the previous steps, the relative orientation and locations of the projected images should be preserved. This allows constructing an inter-proportional relationship between the co-related disparities and deriving the corresponding elevation above the selected projection plane. This relationship is determined based the offset information calculated from the two-plane projection process using Equation (1).
Before describing the inter-proportional disparity relationship, the disparity value should firstly be clarified. The disparity maps represent the co-relation of one epipolar stereo image (domain/reference image) with respect to another stereo mate (input image). Hence, the disparity value ( ) is simply the coordinate value of a pixel in the left epipolar image ( ) minus the coordinate value of the same pixel in the right epipolar image ( ). Following this definition, the resulting disparity map fits exactly the reference epipolar image with pixel-level co-registration.
To determine the constructed relationship, a descriptive sketch is developed. Figure 3 illustrates the relationship of the light rays projected onto the two horizontal object-space planes for the case of three MIS-VHR satellite images. These light rays are all represented in the epipolar plane―XZ along the same epipolar line (i.e., the same row of the projected images). The intersection point of these light rays is the actual point imaged in the object space. The photogrammetric triangulation approaches solve for this point (i.e., space intersection) to reconstruct the imaged object space. The intersections of the rays with the horizontal average level plane (Zavg) are the ground locations of the projected pixels. Hence, the distances between these projected pixels are the object-space disparities (D).
From the sketch shown in Figure 3, two scale-based formulas can be derived based on the basic triangle similarity rules: Domain-to-domain Disparity Formula (DDF) and Disparity-to-Elevation Formula (DEF). While DDF is derived
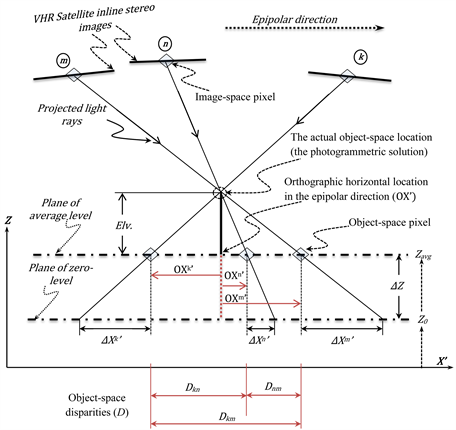
Figure 3. A sketch in the epipolar plane describing the relationships among the ground disparities and with their corresponding elevation above the selected projection plane.
originally in [4] , DEF is extended the current study for the DECR method These two derived formulas are expressed in Equation (3) and Equation (4) respectively. These two formulas are based on scaling the disparities measured in the object space.
(3)
where is the object-space disparity value between the image (m) and image (n) which is predicted or transferred from other object-space disparity values of other stereo domains such as or ; ,and are the computed offsets in the epipolar direction of the same point from the images (m, n, and k) respectively.
(4)
where is the disparity-based derived elevation value above the selected projection plane; is the difference between the selected two parallel object-space planes (in our case Z0 = 0, then ). Thus, the absolute elevation value from the zero level equals to the calculated value in addition to the elevation of the first projection plane (i.e., ).
Furthermore, based on Figure 3, the shift distances of the projected ground pixels to the correct orthographic locations in the epipolar direction ( ) can be found in the same manner. This shift is calculated using the Correct Distance Formula (CDF) for each ground pixel as expressed in Equation (5). The correct orthographic location in the constructed epipolar geometry ( ) can be then found as shown in the same equation.
(5)
where is the distance between the ground pixel ( ) of the epipolar image (k) to its correct orthographic location ( ) in the epipolar direction. Similar to that as indicated in Figure 3, the distances for the projected image (m) and (n) are and respectively.
3.4. Measuring the Enriched Disparity Map
Once the reference image is selected, an efficient stereo matching technique should be implemented to measure and generate the disparity maps. There are several alternatives of matching algorithms that can be executed for creating disparity maps. A critical review of the state-of-the-art matching algorithms for dense disparity map generation was provided in [24] . It is concluded in this review that the most suitable matching algorithm for urban areas is the semi- global matching (SGM) technique as introduced in [25] because it is robust, accurate, and insensitive to the illumination and reflection changes. Consequently, our study adopts this algorithm for the generation of the surface disparity information (SDMs).
Different combinations of stereo pairs can be used to generate different SDMs. Each pair will have different cases of occlusion gaps and mismatches that need to be filled and corrected. Thus, it is recommended to select the reference image to be of minimal occlusions in comparison to the other stereo mates. When the domain/reference image is selected between two images, most of the hidden areas are disclosed in these stereo mates. The matching of the reference image against the other image stereo mates allows additional disparity data (also referred to as supplementary data) to be generated that allow filling the gaps and detecting the outliers. However, based on the offsets calculated in the previous step (i.e., ), the supplementary data must be converted using the DDF as in Equation (3) to be consistent and applicable for enhancing the reference disparity maps.
Fusing the generated supplementary data with the reference disparity map allows filling the gaps and hence enriching the selected reference disparity map. Several fusion techniques for depth and disparity maps have been proposed. The 3D-median filter fusion technique described by [26] is adopted, with some restrictions, in this study for its simple concept, efficiency, and accuracy. It is an extension to the concept of the 2D-median filter where the third dimension represents the number of the supplementary disparity maps generated. In this fusion process, a consistency check is needed to be executed to exclude the outliers (mismatches). These outliers have discrepancies more than a pixel in relation to the corresponding values in the reference disparity map.
Of course, after enhancing the disparity maps by the available supplementary data, it is expected to find small areas that are still without information. Nevertheless, these areas should be minimized after the gap filling process. If there are no further images to generate extra data, interpolation technique can be executed to fill any remaining holes. However, in this time, interpolation can be executed with minimal risk since the gaps and mismatches are remarkably reduced.
3.5. Generating the Co-Registered Elevations
Once the disparity map is generated and enhanced using the supplementary disparity data, the resulting SDM is co-registered accurately to the selected reference image. Since the DEF scale has been calculated as in Equation (4) for the reference image, the enhanced SDM can be converted into elevation data that are already fit exactly the reference image as per the disparity definition stated earlier. Therefore, this will result in a LoS-DSM that is generated based on disparity data and co-registered with pixel-level accuracy to the relevant selected reference optical image from the MIS-VHR satellite images. The achieved LoS- DSM based on our algorithm should be equivalent to the original algorithm with some additional advantages. For evaluation purposes, the validation of the developed method is detailed in the following subsection.
4. DECR Method Validation
The proposed validation procedure for the DECR method includes three validation steps. These steps are (1) confirming the epipolarity and validating the disparity proportionality among the employed VHR images, (2) validating quantitatively the disparity-based derived elevations, and (3) inspecting qualitatively of the co-registered LoS-DSM. Further details are provided in the following subsections.
4.1. Epipolarity and Inter-Proportionality Confirmation
The confirmation of the epipolarity of multiple epipolar images can be carried out qualitatively by arranging these images horizontally and checking whether the same image point in all of the constructed epipolar images can be connected by a straight horizontal line or not.
Quantitatively, the epipolarity condition is validated by applying an automatic matching technique to find a set of accurate point matches and calculate the differences in the y-disparity (y-parallax) for all point pairs. For this check, the Scale Invariant Feature Transform (SIFT) matching technique introduced by [27] is selected due to its accuracy and reliability.
The validation of the computed epipolar angle and the offsets in the epipolar direction ( ) is indicated by the range of the offsets ( ) perpendicular to the epipolar direction. This range should be within one pixel.
However, to validate the disparity inter-proportionality among the constructed epipolar images, the same image point and its corresponding ones should lie on the same straight line if the images are arranged vertically by distances proportional to the calculated shifts in the epipolar direction. Figure 4 illustrates this arrangement (but in horizontal manner) that satisfies Equation (6) which represents the validation line slope.

Figure 4. The inter-proportionality validation for the object-space disparity values from different stereo domains.
(6)
where the Lno is the distance between the corresponding epipolar lines in the epipolar image (n) and image (o); Dno is the object-space disparity for the same point between the epipolar image (n) and image (o); likewise for Lnm and Dnm respectively. This ratio can be determined from the calculated offset information in the epipolar direction (i.e., ) for each image. With this ratio known, the intermediate distances (Δij) between the consecutive images (Δimage1, image2) can be determined based on basic triangle similarity rules after selecting the reference image and the reference stereo-pair domain. All of these symbols are illustrated in Figure 4.
4.2. Calculated Elevations’ Validation
After constructing the epipolar images of scale-related disparities to their corresponding elevation and deriving the DEF scale value, elevation values can be calculated from the measured disparities for all matched pixels in the reference image. These elevation values should be equivalent to those derived photogrammetrically. Hence, as an external reference to evaluate the proposed disparity-based elevation calculation, the DSM for the imaged area needs to be generated by the traditional photogrammetric approach which is already geo-refer- enced. However, a direct comparison for the derived elevations cannot be straightforwardly made. This is due to the projection difference between the two sets of elevation data. While the photogrammetric DSM has an orthographic and geo-referenced projection, the developed disparity-based LoS-DSM has a perspective projection (line-of-sight) that is not geo-referenced.
Therefore, for this elevation validation, a set of well-distributed points in the generated LoS-DSM needs to be selected and corrected for their orthographic locations to be compared against those derived photogrammetrically. As a simplified technique, a set of points that represents the centers of flat rooftops of buildings in the generated LoS-DSM can be selected and matched manually to their corresponding ones in the photogrammetrically-derived DSM. Hence the corresponding elevations can be compared against each other. This technique is recommended to bypass the need to co-register the points in the perspective LoS-DSM with their corresponding ones in the orthographic DSM.
Once the corresponding elevations from the two elevation models are co-reg- istered, the elevation differences can be calculated and hence statistical quality measures can be computed such as the root-mean-square-error (RMSE) and the standard deviation (Std.) of the resulting discrepancies.
4.3. Co-Registered LoS-DSM Validation
After generating the enhanced SDM (by fusing the supplementary disparity maps) and deriving the LoS-DSM co-registered to the optical reference image, the homogeneity of the values related to the same object can be identified visually through a 3D rendered representation of the generated LoS-DSM and validated qualitatively. This inspection allows creating isometric views of the optical data that are helpful in evaluating the quality of the elevation data generation and co-registration. The quality measures of the elevation values in the previous step represent the quantitative assessment of the derived disparity-based LoS- DSM.
Once the integrated geometric and optical data are validated, a complete set of data ideal for 3D-assisted information extraction applications are achieved. This set of data is required to be incorporated in a mapping application for a dense urban area to demonstrate its applicability. The following section describes the proposed procedure for this application.
5. Applicability Demonstration
Co-registering optical and elevation data leads to an ideal dataset for 3D-assited information extraction applications. In this section, elevation-based building detection (EBD) in VHR satellite imagery is selected to be implemented for demonstrating the applicability of the disparity-based LoS-DSM elevations co-registered through the DECR-based improved solution. In contrast to the process demonstrated in [3] , executing the EBD application in our study is meant to validate the terrain-relief minimization by representing approximately the off-terrain objects only. Furthermore, the process includes geo-referencing the finished building-roof objects. The proposed EBD and geo-referencing process are described in the following subsection.
5.1. Elevation-Based Building Detection (EBD) and Geo-Referencing
The elevation-based building detection method described in [3] is selected and adapted for our study to demonstrate the applicability of the co-registered disparity-based LoS-DSM. The steps of the procedure start by pan-sharpening the reference image for better classification and segmentation results. Then, the developed DECR method is executed. Once the optical-elevation data co-registra- tion is achieved, the optical data are segmented and the vegetation objects are suppressed. After that, building objects can be detected easily using an elevation threshold value. After enhancing the result, finally, the detected building objects are geo-referenced to their correct geo-locations. All of these steps are flowcharted in Figure 5.
5.1.1. Input Image Pan-Sharpening
VHR images have one panchromatic band and at least four multispectral bands (Red, Green, Blue, and Near-Infrared). The ground resolutions of the multispectral bands are usually one-fourth of that of the panchromatic band. Therefore, to combine these bands and take the advantages of both types, an image fusion technique needs to be executed. The UNB pan-sharpening technique introduced by [28] is highly recommended. We propose executing this fusion technique just

Figure 5. The proposed elevation-based building detection (EBD) and geo-referencing procedure.
for the image selected for applying building detection.
5.1.2. Disparity-Based LoS-DSM Generation
For achieving co-registered elevation data to the reference VHR optical image, the LoS-DSM needs to be generated. Therefore, the steps of the DECR method are required to be executed to generate a disparity-based LoS-DSM and achieve a complete integrated dataset by co-registering image and elevation data.
5.1.3. Image Segmentation
To reduce the image complexity and divide it into small objects based on a homogeneity measure of the colour information, an image segmentation technique should be executed. As concluded in [29] , multi-resolution segmentation introduced in [30] is one of the most appropriate techniques for segmenting VHR images of urban areas. Thus, this technique is adopted in our study for the segmentation step.
5.1.4. Building Detection and Results Enhancement
To detect building objects, a thresholding operation for the achieved normalized elevations needs to be applied. However, since the elevations are going to have a crucial detection role, other elevated features, such as trees, must be removed to avoid confusion with the building objects. Fortunately, vegetation indices can be used effectively to detect and suppress vegetation. The normalized deference vegetation index (NDVI), as described in [31] , is one of the most accurate and popular vegetation indices. In our study, this index is selected to suppress the scene vegetation. After suppressing the vegetation, the building objects can be detected directly by a applying an elevation threshold. The best thresholding value can be selected empirically.
Since the off-nadir VHR images have severe building lean, an occlusion detection technique should be executed to detect the hidden areas which usually represent the building sides (façades) and create gaps and outliers. The most common techniques of detecting the occluded areas are reviewed in [32] . We recommend the use of the Left-Right checking technique due to its efficiency and simplicity. Masking out the detected occlusion areas should highlight the building rooftops and hence enhance the result significantly.
Normally, the detection result requires some finishing. Therefore, post-proc- essing procedures need to be applied for the resulting roof objects. These procedures are usually based on morphological operations. We recommend developing a rule set of such operations interactively and effectively using the Cognition Network Language (CNL) available with the eCognition software package. To assess the result accuracy, the conventional evaluation measures described in Section 5.2.1 are used to evaluate the building detection accuracy.
5.1.5. Building Objects’ Geo-Referencing
After detecting the building objects and enhancing their shapes, these objects should be geo-referenced to their correct orthographic locations. This allows easy input and integration with other existing GIS layers. Therefore, these objects need to be moved and registered to their correct geo-locations.
To determine the correct geo-referencing location, two steps are required: (1) moving these objects to the orthographic location in the epipolar direction as expressed in the CDF formula, and (2) rotating these objects to the reverse of the epipolar rotation direction (i.e., −θ) applied in the epipolar construction phase. To perform the first step, the building objects are abstracted by representative points (RPs) that lie within their corresponding object’s boundary. To guarantee that this RP is located inside the corresponding object’s shape, this point is selected to represent the centre of the greatest circle that fits inside the object boundary. The algorithm for calculating this RP point location is introduced by [33] . When these two easy steps are executed, the resulting building map should be geo-referenced to the correct orthographic geo-location. The validation test of the geo-referencing result is described in Section 5.2.2.
5.2. Mapping Accuracy Evaluation
This section describes the accuracy assessment and evaluation for both the detection and geo-referencing results. Once the building-roof objects are detected, the accuracy is assessed based on reference data using the traditional measures of the detection performance. Then, after geo-referencing the mapped roofs, the achieved result is evaluated.
5.2.1. EDB Accuracy Assessment
As implemented in [3] , the detection accuracy is assessed by comparing the mapped buildings’ roofs against a reference dataset after implementing the developed EBD procedure. Completeness, Correctness, and Overall Quality are three widely used measures to assess the detection performance. These assessment measures are a modified version of those introduced by [34] . Completeness is the percentage of the entities in the reference data that are correctly detected. Correctness indicates how well the detected entities match the reference data. The Overall Quality of the results provides a compound performance metric that balances completeness and correctness [35] . The formulas of these measures are as follows:
(7)
(8)
(9)
True positive (TP) is the number of correctly identified building roof segments. The false negative (FN) is the number of building roof segments in the reference dataset that are not detected or wrongly labelled as not roofs. The false positive (FP) represents the number of building roof segments that are detected but do not correspond to the reference dataset. The definition for these measured entities is used in this study to represent the total areas (in pixels) that are related to the building roof class.
5.2.2. EDB Geo-Referencing Evaluation
In many cases, the accurate reference maps for the building footprints are not available for the study area. Therefore, for validation purposes, we propose the generation of an orthophoto by using the traditional differential orthorectification technique. This technique requires the elevation data to be available in advance. Hence, the geo-referenced DSM should be derived photogrammetrically for the study area before executing the orthorectification process. The generated orthophoto will be used as an external reference data source to validate and assess the quality of the geo-referenced building roof objects. This validation is proposed to visually inspect geo-referenced building roofs individually (object by object) in order to count the correctly geo-referenced objects (≥90% overlap with the correct rooftop). This is because the traditional orthorectification process does not work perfectly in dense urban areas. Although true orthorectification overcomes the limitation of the traditional orthorectification process, the generation of a true orthophoto is expensive, time consuming, and difficult to achieve [3] .
6. Data, Results, and Discussion
The results of the developed DECR method and its demonstrated applicability in EBD application are presented and discussed in this section. The section organization is based on the sequence of the proposed validation procedures described in Section 4 and Section 5.2 for the DECR and the EBD methods respectively. The test data used in the experimentation are described in the following subsection.
6.1. Dataset and Study Area
The optical data used in this research are a subset of five stereo VHR images acquired by the WorldView-2 linear sensor with push-broom scanning mode. These MVIS images are available along with their sensor model information. Each of the five MIS-VHR satellite images has eight spectral bands of 1000 × 1000 pixels and a panchromatic band of 4000 × 4000 pixels with 2 m and 0.5 m resolutions, respectively.
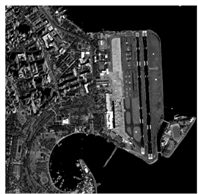
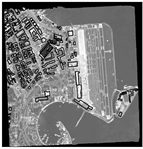
The VHR data were acquired in 2010 over a dense urban area of Rio de Janeiro, Brazil. The imaged area is of a modern city and has many buildings with different shapes and sizes. Most of the buildings are high-rise elevations where building lean and façades are prominent. Figure 6 shows the selected reference stereo pair (i.e., the reference image and its stereo mate).
6.2. Results of DECR Method
6.2.1. Epipolarity and Inter-Proportionality Result
Based on the developed DECR method, the available VHR images of the test data are re-projected onto two horizontal planes at the average-terrain elevation (i.e., Zavg = 10 m) and the zero elevation (i.e., Z0 = 0 m). To simplify the calculations, the resampling of the re-projected images was made to be equivalent to 1 m2 per pixel. After that, the offset information in the X and Y direction of the object-space coordinate system was calculated for each MIS-VHR image, as shown in Table 1.
 (a)
(a)  (b)
(b)
Figure 6. The reference stereo pair of the MVIS-VHR satellite images. (a) The reference image (I-2); (b) the stereo mate (I-3).

Table 1. The calculated shift information required for the DECR methoda.
a. Thevalues are in meter (ground pixel size = 1 m).
To confirm the epipolarity condition of the epipolar rectified images, the SIFT matching technique was executed to generate a set of 35 matching points of good distribution. Then the differences in the matching location were calculated between the point pairs to assess the quality of the epipolarity condition. The RMSE value of these differences was found to be 0.29 pixels with a Std. value of 0.23 pixels. These values validate the approximation of the epipolar curves and indicate the success of the epipolar rectification process for the employed MVIS-VHR satellite images.
Table 1 shows the minimum, maximum, and the average shift values in the X and Y directions respectively. It can be noted that the variation of the values is very small (<1dm) due, mostly, to the small size of the test area. In this case the average values can be used as a generalized value for the whole test area―to simplify the calculations―instead of using the individual values of each ground pixel which is required to overcome any factors that prevents the disparity inter- proportionality including the shifts and drifts in the trajectory of satellite sensors.
To align the rows of the images with the epipolar direction, the rotation angle of the epipolar direction was determined by connecting a distinct elevated point to its corresponding matching points and then determining the epipolar angle relative to the ground X-axis as described in [36] . Thus, for this dataset, the rotation to the epipolar direction was found to be 76.4231 degrees.
To construct the epipolar images and keep their inter-relationships, the projected images were rotated using the calculated epipolar angle. Additionally, the calculated offset data were rotated based on the same angle to find the offsets in the epipolar direction and its perpendicular (i.e., ΔX', ΔY'). The offset values in this direction were all found to be less than 1 pixel (or 1 meter) with a maximum range of about 0.75 pixels. This indicates quantitatively the validation of the computed epipolar angle, the calculated offsets in the epipolar direction, and the approximated epipolar lines of the constructed epipolar images. This validation is demonstrated visually in Figure 7. The same point and its corresponding points lie on the same horizontal line in all epipolar images.
To validate the inter-proportionality of the disparity values among all of the epipolar images, the validation test described in Figure 4 was implemented. Figure 8 is constructed based on Equation (5). The figure proves the validity of the disparity proportionality among all epipolar images. Two straight lines of two different points indicate the success of the constructed disparity proportionality. This validation confirms the proportionality of the disparity values with their corresponding elevations.
6.2.2. Calculated Elevations Results
Since the scale-relationship of the disparity values was achieved and validated, supplementary surface disparity data (SDMs) were generated and fused using the 3D-median filter as described in Section 3.4. These supplementary disparity data were used to fill disparity gaps of the reference disparity map. By fusing the generated SDMs with the reference one, the SDM of the selected reference pair (i.e., Ep-2 & Ep-3) was enriched and enhanced. Figure 9 shows different SDMs extracted from different epipolar stereo pairs which are fused together to generate a more accurate and enriched SDM. The SDM achieved has an identical representation of its corresponding LoS-DSM.
As stated previously, the offset variation is almost negligible due to the small size of the test area. Thus, to simplify the calculations, the average offset of each image in the epipolar direction was used to calculate the DEF formula―as in Equation (4)―instead of the offset value for each individual pixel which must be considered in the case of full scenes and hilly areas.
Based on Equation (4), the scale value calculated for the selected reference stereo pair (I2-I3) is found to be −1.912. Hence, the elevation data corresponding to the enriched SDM of the reference stereo domain were directly generated for the selected reference stereo pair (I2-I3). Since these elevations are measured from the projection plane (Zavg), the height above the datum of that projection plane (ΔZ = 10 m) is added to have the elevation referenced to the datum. Hence,
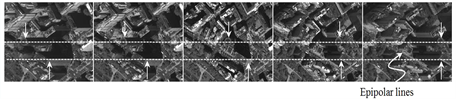
Figure 7. Epipolarity validation. Any point and its corresponding ones lie on the same horizontal line in all epipolar images.

Figure 8. Disparity inter-proportionality validation among all epipolar images.

Figure 9. The fused and enhanced SDM generated from different epipolar stereo pairs based on the scale transformation formula derived in the DPP method. Unlike the rest of the pairs, the pair Ep-2& Ep-1 has negative values because the stereo mate is before the reference image in the sequence of acquisition
the disparity-based derived elevations are computed as Elv. = 10 − 1.912 × DI2,I3. The resulting elevation data represent the disparity-based LoS-DSM co-regis- tered to the reference image with pixel-level accuracy as per the disparity definition.
For the evaluation of the disparity-based elevation calculation, a set of tie points that represent the centres of different flat building-rooftops were matched manually in order to correctly triangulate their 3D ground coordinates. The resulting ground elevations were then compared against their corresponding values generated based on the DECR method. The photogrammetric elevations were calculated using industry leading commercial photogrammetric software (PCI Geomatica, ver. 2015).
Based on a manual selection of the building roof elevations in the scene, the RMSE and Std. were calculated and found to be 1.54 m (1.5 pixels) with a Std. value of 1.06m (1 pixel). The RMSE value is reasonable because it is less than the pixel-level threshold value, used to identify the inconsistency and outliers among the corresponding supplementary disparity values, generated from different epipolar stereo pairs, before fusing them. Moreover, this threshold is almost double the Std. value. Hence, this indicates the highly acceptable precision of the achieved RMSE value. Therefore, the developed disparity-based approach is able to produce elevation data comparable in accuracy to that derived rigorously based on the traditional photogrammetric approaches using industry leading commercial software.
6.2.3. Co-Registered LoS-DSM Result
Based on the DECR method, the resulting LoS-DSM co-registered to the selected reference image needs to be validated to identify the elevation inconsistency through visual inspection. Figure 10 shows an isometric view of the generated LoS-DSM and the rendered representation of the co-registered reference image. While Figure 10(a) shows clearly the elevation consistency for each building roof, Figure 10(b) confirms the predefined co-registration accuracy with the reference optical data. The realistic 3D representation of the dense urban area is attributed to the successful disparity-based image-elevation data co-registration achieved using the developed DECR method.
 (a)
(a)  (b)
(b)
Figure 10. The reference stereo pair of the MVIS-VHR satellite images. (a) The reference image (I-2); (b) the stereo mate (I-3).
6.3. Results of DECR Method
To demonstrate the applicability of the developed DECR method, an elevation-based building detection application was implemented to map the building-roof objects based on the accuracy of the elevation derivation, terrain elevation minimization, and the pixel-level co-registration with the reference optical image.
The building detection is mainly based on the elevation information. Because trees produce false detection results, a mask was generated based on the NDVI value to exclude all of the vegetation objects. The threshold value of this index was selected empirically and was equal to 0.3. It is worth mentioning that this NDVI-based vegetation removal may affect negatively the detection result in the cases of roof gardens or buildings with high NDVI values. These two cases pose a limitation to this vegetation removal technique. However, these cases rarely appear in most urban areas.
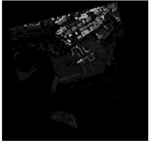
Since the reference image was selected to be off-nadir over a challenging and dense urban area, the buildings’ façades are prominent. To exclude these confusing building objects, the Left-Right occlusion detection technique was executed to identify the hidden areas which mainly represent in our case the building façades. Figure 11 illustrates an example of the performance of this technique (Figure 11(c)). The whole façade bitmap generated for the selected epipolar stereo images (Ep-2 & Ep-3) is provided in Figure 11(d). This mask is used to enhance the building detection results by removing the building sides and highlighting the building rooftop objects only.
The intermediate detection results are provided in Figure 12. The co-regis- tered optical and elevation datasets are shown in Figure 12(a) and Figure 12(b) respectively. Figure 12(c) demonstrates the detected off-terrain objects based on a thresholding operation. The threshold value was very close to the selected terrain average elevation (Zavg) because the elevations were referenced to the datum. This indicates the success of the terrain variation minimization described in the developed DECR method. The detection result of Figure 12(c) includes the tree objects which are filtered out in Figure 12(d) based on an NDVI bitmap
 (a)
(a) 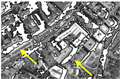 (b)
(b) 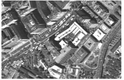 (c)
(c)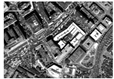 (d)
(d)
Figure 11. The generation of the occlusion map for the reference stereo images (I-2 & I-3). (a) A subset from the epipolar reference image (Ep-2); (b) a subset from the epipolar stereo image (Ep-3); (c) the detected occlusions in the reference image; (d) the generated occlusion map for the epipolar reference image (Ep2).
 (a)
(a)
 (b)
(b)
 (c)
(c)
 (d)
(d)
 (e)
(e)
 (f)
(f)
Figure 12. The intermediate building detection results. (a) Epipolar off-nadir VHR reference image (Ep-2); (b) disparity-based co-registered LoS-DSM using DECR method; (c) detected off-terrain objects based on a thresholding operation of a value close to Zavg; (d) resulting objects after suppressing vegetation objects based on an NDVI bitmap; (e) resulting objects after removing the building façades. (f) The manually generated reference data for comparison.
produced based on the empirically selected threshold value. This result is enhanced further by applying the Left-Right-based occlusion map of Figure 11(d) generated to exclude the building façades. Some post-processing steps were applied to enhance the detection result. These steps include merging adjacent objects and removing isolated ones of small areas since they usually represent noise. The final enhanced detection result is shown in Figure 12(e). The reference data used for evaluating the detection results are provided in Figure 12(f). These data were generated manually. The quantitative evaluation of the final detection result relative to the reference data is provided in Table 2.
Based on the performance measure provided in Table 2, the detection was highly successful. This high quality detection is due to the incorporation of the elevation information. This information is a critical detection component for the
Table 2. Performance evaluation of the building detection result.
buildings since they are inherently elevated objects.
The high correctness value of 95% is attributed mainly to the high accuracy of the derived elevation data (based on a fused supplementary disparity maps) used for the detection and the accurate co-registration of these elevation data with the reference image. This performance indicates the success of the developed DECR method. Furthermore, the quality of the elevation data generation and co-regis- tration is reflected also in the high completeness of 96%. However, the role of incorporating the façades bitmap based on the Left-Right checking technique reduced the false detection tremendously, which resulted in a higher completeness measure value.
As a combined indicator of both the correctness and completeness performance measures, the overall-quality (OQ) measure confirms the high quality of the building detection results. This quality can be seen by comparing visually the reference data in Figure 12(f) to the final detection results in Figure 12(e). A building detection result in off-nadir VHR imagery of 92% overall quality over a challenging dense urban area is indeed a significant success that demonstrates the applicability of the developed DECR method in an EBD application.
6.4. Results EBD Map Geo-Referencing
After mapping the building-roof objects and evaluating the detection performance, the resulting building objects must be geo-referenced to their correct ground locations in order to be ready for incorporation in GIS systems and integration with other GIS layers. The geo-referencing process described in Section 5.1.5 was implemented to remove the perspective effects of the off-nadir VHR image and then apply the geo-referencing. The correct geo-location in the epipolar direction was calculated based on Equation (5) using the derived elevations, referenced from the projection plane (Zavg), at the RP point of each building object. For the selected reference image, the values used for ΔZ is10m and for ΔX’ is −6.7352 m.
The achieved geo-referencing result was evaluated as described in Section 5.2.2 based on an orthoimage. Therefore, a dense geo-referenced DSM was derived photogrammetrically based on the traditional approach and then used to create an orthoimage for the study area. This orthoimage was used as an external reference to assess the accuracy of the building map geo-referencing process.
Figure 13(a) illustrates the detection result in the epipolar image domain overlaid on the epipolar reference image (I-2). Figure 13(b) shows the geo-ref- erencing result overlaid on the generated orthoimage. Figure 13(c) shows the enhanced building detection results geo-referenced to the correct object-space locations and prepared as a GIS layer.
 (a)
(a)
 (b)
(b)
 (c)
(c)
Figure 13. The result of the building detection in both the epipolar image domain and the geo-referenced ground domain. (a) The detected building objects in the epipolar reference image domain; (b) geo-referenced building objects overlaid on the generated orthoimage; (c) the resulting GIS layer.
After a qualitative assessment of the generated orthoimage, it is found that 98% of the building roofs were geo-referenced correctly. This confirms and validates further the derived elevation data based on the generated disparity information. In contrast, 2% (3 out of 165 objects) of the geo-referenced building objects were found lying on the incorrect geo-location. The reason for that is the incorrect elevation used to calculate this geo-location in the epipolar direction. This elevation was extracted at the RP point of the building object as described earlier. For non-flat building roofs, the location of the RP selected in our study may not be at the elevation value that leads to the correct geo-reference location. These cases are very few and they can be easily identified and corrected manually.
Figure 14 illustrates four cases of the achieved geo-referencing results. On the one hand, the upper row of this figure shows the detection result in the epipolar image domain (Ep-2) along with the correct geo-location of the detected building object in the epipolar direction. The shift of the detected objects to the correct location in the epipolar domain is equal to the distance between the RP point of the detected building (represented by a triangle in Figure 14) and correct building object location (represented by a square in Figure 14) as indicated in the same figure.
On the other hand, the lower row of Figure 14 shows the geo-referencing result overlaid on the generated orthoimage. Based on the visual assessment, the geo-referencing result is highly successful. For Figure 14(d2), despite the misalignment between the building roof in the orthoimage and the corresponding geo-referenced object, the location of the geo-referenced roof object is correct. This is because the lean of the high-rise building (more than 135 m above the local ground) was not completely eliminated from the orthoimage. Hence, the source of this misalignment is in the reference data, not the geo-referenced objects. Figure 14 indicates the success of the proposed geo-referencing process. The final geo-referencing result was processed to be directly integrated into a GIS system. At this stage, the cycle of the information extraction and mapping is

Figure 14. A few examples of the geo-referenced roof objects for visual assessment. The upper row shows the detected roof objects along with its RP location. The same row shows the calculated correct location of the object to be moved to it along with its new RP point.
completed for the application of building detection in off-nadir VHR images.
7. Conclusions
In this study, the problem of optical-elevation data co-registration is addressed. The introduced solution is based on generating disparity-based elevation data co-registered with one of the employed VHR images. The co-registration is achieved with pixel-level accuracy using an improved approach for developing a LoS-DSM from an enriched disparity map. This map is generated from different MIS-VHR satellite images by fusing supplementary disparity data derived from different stereo-pair combinations as described in our recently introduced DPP method. Then, the LoS-DSM elevations are derived efficiently based on the DEF (Disparity-to-ElevationFormula) of the DECR method developed in this study.
The developed DECR method, which is an extension of DPP method, is based on establishing a scale-based relationship between the disparity and elevation data in the object space. The core concept of DECR is to re-project the MIS- VHR images onto an object-space horizontal plane at the average terrain elevation of the imaged area. This re-projection is mainly to build linear proportionality among the relevant object-space disparities and with their corresponding elevations. This property allows generating supplementary disparity data to be used for filling the disparity gaps of the reference SDM. Additionally, the property allows the direct derivation of object-space elevations from the enriched (gap-free) SDM. These derived disparity-based elevations represent the LoS-DSM co-registered to the reference optical image selected. As an extension of the DPP method, the DECR method includes analytical derivation of two formulas: (1) Disparity-to-Elevation Formula (DEF) that provides the elevation values and (2) the Correct Distance Formula (CDF) that provides the shift to the correct geo-referenced location of the object-space pixels in the epipolar direction.
The developed DECR method was successfully validated in terms of the epipolarity condition of the projected images, the disparity proportionality among the projected images, the elevation accuracy derived based on the generated disparity data, and the elevation co-registration accuracy to one of the employed optical images.
For applicability demonstration purposes, an EBD procedure was developed and implemented to detect building roofs using the achieved disparity-based LoS-DSM. The detection result for the off-terrain objects was achieved by a threshold value close to zero above the selected average terrain level. This represents an advantage over the original LoS-DSM algorithm. When the detection was evaluated, the result was found to be very successful based on the traditional performance measures (Completeness, Correctness, and Overall Quality). This indicates an effective minimization of the terrain-relief variation which reduces the need for an elevation normalization algorithm in dense urban areas of moderate terrain variation.
The overall quality measure was found to be 92%, proving the successful accuracy of both disparity-based elevation data calculation and the optical-eleva- tion data co-registration. While the 95% correct detection is attributed to the high quality of the elevation data generation (based on enriched and enhanced disparity maps) and incorporation, the 96% complete detection resulted from the refined detection accuracy based on the occlusion and façades bitmap generated using the Left-Right checking technique.
In addition to the high detection quality achieved, the generated building-roof objects were geo-referenced to their correct object-space location to allow direct integration with existing GIS layers. The geo-referencing process is based on moving the detected building roofs to the correct ortho-location in the epipolar domain of the reference image. The calculated locations were validated using an orthoimage generated for the study area using a commercial photogrammetric software package (PCI Geomatica). The evaluation result was almost 100% based on the visual assessment of the geo-referenced roof objects of which ≥90% overlap with the correct ground location of the corresponding building roofs in the orthoimage. This significantly successful geo-referencing result of the generated building roof map demonstrates the accuracy of the derived disparity-based elevation data. Furthermore, it allows a direct integration with the existing layers of the GIS systems.
The identified limitation in the developed DECR method is its applicability to only the MVIS-VHR images acquired by push-broom linear sensors. Moreover, the terrain variation minimization by re-projection onto the average terrain level may not be sufficient in hilly and mountainous areas. For the developed EBD procedure, the identified limitation is the vegetation detection and removal based on NDVI-based threshold. This vegetation index may produce some errors in the cases of roof gardens and buildings with high NDVI values.
Therefore, future work should address these limitations and extend the DECR technique to be applicable in a tile-based approach in order to work even on hilly and large areas.
Acknowledgements
This research is funded in part by the Libyan Ministry of Higher Education and Research (LMHER) and the Canadian Research Chair (CRC) program. The optical data used in this research are provided by Digital Globe for the IEEE-IGARSS 2011’s Data Fusion Contest. They also greatly appreciate thevaluable comments from the anonymous reviewers and theeditor for improving this paper.
Cite this paper
Suliman, A. and Zhang, Y. (2018) Disparity-Based Generation of Line-of-Sight DSM for Image-Ele- vation Co-Registration to Support Building Detection in Off-Nadir VHR Satellite Images. Journal of Geographic Information System, 10, 25-56. https://doi.org/10.4236/jgis.2018.101002
References
- 1. Salehi, B., Zhang, Y., Zhong, M. and Dey, V. (2012) A Review of the Effectiveness of Spatial Information Used in Urban Land Cover Classification of VHR Imagery. International Journal of Geoinformatics, 8, 35-51.
- 2. Salehi, B., Zhang, Y. and Zhong, M. (2011) Object-Based Land Cover Classification of Urban Areas Using VHR Imagery and Photogrammetrically-Derived DSM. Proceedings of the ASPRS Annual Conference, Milwaukee, 1-5 May 2011.
- 3. Suliman, A. and Zhang, Y. (2015) Development of Line-of-Sight Digital Surface Model for Co-registering Off-nadir VHR Satellite Imagery with Elevation Data. IEEE Journal of Selected Topics in Applied Earth Observations and Remote Sensing, 8, 1913-1923. https://doi.org/10.1109/JSTARS.2015.2407365
- 4. Suliman, A. and Zhang, Y. (2017) Double Projection Planes Method For Generating Enriched Disparity Maps From Multi-View Stereo Satellite Images. Photogrammetric Engineering and Remote Sensing, 83, 749-760.
- 5. Suliman, A., Zhang, Y. and Al-Tahir, R. (2016) Extracting Accurate Building Information from Off-Nadir VHR Images. Proceedings of the Ninth International Conference on Geographic Information Science (GIScience), Montreal, Canada, 27-30 September 2016. https://doi.org/10.21433/B3115640633B
- 6. Suliman, A. and Zhang, Y. (2017) Developing an Efficient Approach for Image-Elevation Co-Registration. The Biennial International Joint Urban Remote Sensing Event (JURSE), Dubai, 6-8 March 2017, 1-4.
- 7. Goshtasby, A. (2012) Image Registration: Principles, Tools and Methods. Springer-Verlag Ltd., London. https://doi.org/10.1007/978-1-4471-2458-0
- 8. Mishra, R. and Zhang, Y. (2012) A Review of Optical Imagery and Airborne LiDAR Data Registration Methods. The Open Remote Sensing Journal, 5, 54-63. https://doi.org/10.2174/1875413901205010054
- 9. Zitová, B. and Flusser, J. (2003) Image Registration Methods: A Survey. Image and Vision Computing, 21, 977-1000. https://doi.org/10.1016/S0262-8856(03)00137-9
- 10. Xiong, Z, and Zhang, Y. (2010) A Critical Review of Image Registration Methods. International Journal of Image and Data Fusion, 1, 137-158. https://doi.org/10.1080/19479831003802790
- 11. Wong, A. and Orchard, J. (2008) Efficient FFT-Accelerated Approach to Invariant Optical-LIDAR Registration. IEEE Transactions on Geoscience and Remote Sensing, 46, No. 3917-3925. https://doi.org/10.1109/TGRS.2008.2001685
- 12. Avbelj, J., Iwaszczuk, D., Müller, R., Reinartz, P. and Stilla, U. (2015) Coregistration Refinement of Hyperspectral Images and DSM: An Object-Based Approach Using Spectral Information. ISPRS Journal of Photogrammetry and Remote Sensing, 100, 23-34. https://doi.org/10.1016/j.isprsjprs.2014.05.010
- 13. Kwak, T.-S., Kim, Y.-I., Yu, K.-Y. and Lee, B-K. (2006) Registration of Aerial Imagery and Aerial Lidar Data Using Centroids of Plane Roof Surfaces as Control Information. KSCE journal of Civil Engineering, 10, 365-370. https://doi.org/10.1007/BF02830090
- 14. Parmehr, E.G., Fraser, C.S., Zhang, C. and Leach, J. (2014) Automatic Registration of Optical Imagery with 3D LIDAR Data Using Statistical Similarity. ISPRS Journal of Photogrammetry and Remote Sensing, 88, 28-40. https://doi.org/10.1016/j.isprsjprs.2013.11.015
- 15. Awrangjeb, M., Zhang, C. and Fraser, C.S. (2013) Automatic Extraction of Building Roofs Using LIDAR Data and Multispectral Imagery. ISPRS Journal of Photogrammetry and Remote Sensing, 83, 1-18. https://doi.org/10.1016/j.isprsjprs.2013.05.006
- 16. Awrangjeb, M., Ravanbakhsh, M. and Fraser, C.S. (2010) Automatic Detection of Residential Buildings Using LIDAR Data and Multispectral Imagery. ISPRS Journal of Photogrammetry and Remote Sensing, 65, 457-467. https://doi.org/10.1016/j.isprsjprs.2010.06.001
- 17. Guoqing, Z., Weirong, C., Kelmelis, J.A. and Zhang, D. (2005) A Comprehensive Study on Urban True Orthorectification. IEEE Transactions on Geoscience and Remote Sensing, 43, 2138-2147. https://doi.org/10.1109/TGRS.2005.848417
- 18. Habib, A., Kim, E. and Kim, C. (2007) New Methodologies for True Orthophoto Generation. Photogrammetric Engineering and Remote Sensing, 73, 25-36. https://doi.org/10.14358/PERS.73.1.25
- 19. Suliman, A., Zhang, Y. and Al-Tahir, R. (2016) Registration-Based Mapping of Aboveground Disparities (RMAD) for Building Detection in Off-Nadir VHR Stereo Satellite Imagery. Photogrammetric Engineering and Remote Sensing, 82, 535-546. https://doi.org/10.14358/PERS.82.7.535
- 20. Tao, C.V. and Hu, Y. (2002) 3D Reconstruction Methods Based on the Rational Function Model. Photogrammetric Engineering and Remote Sensing, 68, 705-714.
- 21. Grodecki, J., Dial, G. and Lutes, J. (2004) Mathematical Model for 3D Feature Extraction from Multiple Satellite Images Described by RPCs. Proceedings of the ASPRS Annual Conference, Colorado, 23-28 May 2004.
- 22. Tao, C.V. and Hu, Y. (2001) A Comprehensive Study of The Rational Function Model for Photogrammetric Processing. Photogrammetric Engineering and Remote Sensing, 67, 1347-1358.
- 23. Wang, M., Hu, F. and Li, J. (2011) Epipolar Resampling of Linear Pushbroom Satellite Imagery by a New Epipolarity Model. ISPRS Journal of Photogrammetry and Remote Sensing, 66, 347-355. https://doi.org/10.1016/j.isprsjprs.2011.01.002
- 24. Alobeid, A., Jacobsen, K. and Heipke, C. (2010) Comparison of Matching Algorithms for DSM Generation in Urban Areas from Ikonos Imagery. Photogrammetric Engineering and Remote Sensing, 76, 1041-1050. https://doi.org/10.14358/PERS.76.9.1041
- 25. Hirschmüller, H. (2008) Stereo Processing by Semiglobal Matching and Mutual Information. IEEE Transactions on Pattern Analysis and Machine Intelligence, 30, 328-341. https://doi.org/10.1109/TPAMI.2007.1166
- 26. Zhang, J., Cao, Y., Zheng, Z., Chen, C. and Wang, Z. (2014) A New Closed Loop Method of Super-Resolution for Multi-View Images. Machine Vision and Applications, 25, 1685-1695. https://doi.org/10.1007/s00138-013-0536-7
- 27. Lowe, D.G. (2004) Distinctive Image Features from Scale-Invariant Keypoints. International Journal of Computer Vision, 60, 91-110. https://doi.org/10.1023/B:VISI.0000029664.99615.94
- 28. Zhang, Y. (2004) Understanding Image Fusion. Photogrammetric Engineering and Remote Sensing, 70, 657-661.
- 29. Dey, V. (2013) Image Segmentation Techniques for Urban Land Cover Segmentation of VHR Imagery: Recent Developments and Future Prospects. International Journal of Geoinformatics, 9, 15-35.
- 30. Baatz, M. and Schape, A. (2000) Multiresolution Segmentation: An Optimization Approach for High Quality Multi-Scale Image Segmentation. Angewandte Geographische Informationsverarbeitung, XII, 12-23.
- 31. Teillet, P. (1992) An Algorithm for The Radiometric and Atmospheric Correction of AVHRR Data in the Solar Reflective Channels. Remote Sensing of Environment, 41, 185-195. https://doi.org/10.1016/0034-4257(92)90077-W
- 32. Egnal, G. and Wildes, R.P. (2002) Detecting Binocular Half-Occlusions: Empirical Comparisons of Five Approaches. IEEE Transactions on Pattern Analysis and Machine Intelligence, 24, 1127-1133. https://doi.org/10.1109/TPAMI.2002.1023808
- 33. Garcia-Castellanos, D. and Lombardo, U. (2007) Poles of Inaccessibility: A Calculation Algorithm for the Remotest Places on Earth. Scottish Geographical Journal, 123, 227-233. https://doi.org/10.1080/14702540801897809
- 34. Story, M. and Congalton, R. (1986) Accuracy Assessment—A User’s Perspective. Photogrammetric Engineering and Remote Sensing, 52, 397-399.
- 35. Rutzinger, M., Rottensteiner, F. and Pfeifer, N. (2009) A Comparison of Evaluation Techniques for Building Extraction From Airborne Laser Scanning. IEEE Journal of Selected Topics in Applied Earth Observations and Remote Sensing, 2, 11-20. https://doi.org/10.1109/JSTARS.2009.2012488
- 36. Suliman, A., Zhang, Y. and Al-Tahir, R. (2016) Enhanced Disparity Maps from Multi-View Satellite Images. IEEE Geoscience and Remote Sensing Symposium (IGARSS), Beijing, 10-15 July 2016, 2356-2359. https://doi.org/10.1109/IGARSS.2016.7729608