Journal of Geographic Information System
Vol.09 No.05(2017), Article ID:78952,11 pages
10.4236/jgis.2017.95033
3D Spatial Information Intended for SDI: A Literature Review, Problem and Evaluation
Mehrdad Jafari Salim
GIS & SDI Department, National Cartographic Center, Tehran, Iran

Copyright © 2017 by author and Scientific Research Publishing Inc.
This work is licensed under the Creative Commons Attribution International License (CC BY 4.0).
http://creativecommons.org/licenses/by/4.0/


Received: July 5, 2017; Accepted: September 4, 2017; Published: September 7, 2017
ABSTRACT
In this paper, first we are going to discuss briefly the importance of 3D information, and its application because of the Increasing demand for detailed information about real world objects and phenomena including altimetry and planimetry data (X, Y, Z), then we will explain in short the available methods for 3D measurement. It’s important to note that the Information collection by itself cannot define and sufficiently provide all the necessary actions to be taken in order to get them accessible and useful for users. The data management and establishment of a proper and reliable DBMS and finally a GIS system at the same time are vital crucial in the course of 3D application that will be discussed throughout the paper. The existing drawbacks and elements needed to be considered for the cartographic presentation are the key issues in three-dimensional world visualization. The elaboration on the 3D information and its knowledge transfer to the users in a SDI framework as well as the requirement recognition of beneficiary organizations will be the next step in this paper and the most probable problems will be studied in this stage. At the final stage, we’ll come up with conclusion, warnings and recommendation.
Keywords:
3D, Geographic Information System, Spatial Data Infrastructure, Digital Elevation Model, Visualization

1. Introduction
Increasing demand for detailed information about real world objects and phenomena including altimetry and planimetry data (X, Y, Z), along with attributed information has made tremendous changes in all related Geomatics disciplines and activities. Attributed data consisting of semantic and numerical information must be collected, processed, stored, and presented with reference to the characteristics of that specific phenomenon, and the applicant disciplines specification, besides there must be considerations in designation of SDI (Spatial Data Infrastructure) containing three-dimensional data, because it not only serves as positional information of an object but also as numerical attribute defining the shape and physical form of that phenomenon [1] .
1.1. 3D Information in GIS and SDI
One of the main conceptual characteristics and reasons for a GIS system is to provide possibility to attach and keep information about spatial feature as well as tools for analytical process and creating environment for value-added knowledge regarding the world around us. The details of this information can be numeric, semantic along with positional information. Although the positional information in a traditional cartography in hardcopy form was mainly planimetric data along with spot height or contour line, but in adigital environment the 3rd dimension can be the inseparable part of positional information.
The use of 3 dimensional data and its merit in any types of spatial analysis enables better and comprehensive result for most of the decision making support in geo-spatial related projects. So the use of 3D data and its application is growing increasingly among various disciplines and business. In-fact accurate and effective location based services are getting dependent upon the existence of 3 dimensional data and the availability of the tools for its analysis and visualization. Provided the accurate coordination of any phenomena which is consisted of 3D data, the better resemblances and link of virtual world information and real world can be achievable and it can include all the events and transactions in all possible disciplines [2] . The efficient decision making support system should support functionality and performances related to the spatial information.
The provision of the spatial information is time consuming, cost effective and most labor intensive job which inherits its adjective from Data Collection phase in any types of mapping projects. Apart from this phase, the availability of tools that evolve around the real or virtual world data, is advancing throughout software development and existence of appropriate application-oriented software. This tool must provide the analysis as well as visualization capabilities. The two above-mentioned subjects, meaning data and application can create an environment for 3D GIS and consequently the spatially enabled society under the terms of Spatial Data Infra-Structure.
By the Definition GIS is all about a system of software and hardware to: capture, store, manipulate, analyze, and present data [3] . Of course, if there exist a framework consisted of People, Data, Network, Standards and protocols to allow various data provider share their own data in a secure manner (copyright protected) for the goals of GIS analysis, then SDI (Spatial Data Infar-structure) is created.
Practically speaking, development of a 3D spatial analysis environment is one of the major issues in Geomatics. At the beginning CAD software (AutoCAD, Micro-station) used to store Positional data in different methods and concepts and attributed data by DBMS software (Oracle, SQL server) and GIS analysis used to utilize both for its analysis and presentation. But by the development of powerful hardware, these two software products integrated into a set of integrated components.
With reference to the complexity of; 3D positional data, a variety of attributed information and finally wide spectrum of expected analytical tools, as well as outspread extensity of key role player (data provider and data users) the required systems being able to handle this multi-lateral objective may face deficiencies and inconsistencies. So the Geomatics community has a very difficult situation to comprehensively response to the current expectations raised in a daily base management requirement tools.
1.2. Literature Review
Li Deren et al. in 1997, by the analysis of data structures in 3D GIS, developed three dimensional run length encoding method and completed the theory and algorithms of the tetrahedral network (TEN). In this investigation, a hybrid data structure based on Octree and TEN is presented in their study and the concept of 3D GIS is introduced [4] .
Siyka ZLATANOVA et al. in 2002 studied several 3d software, that works on Oracle and Microstation. These commercial software support 3d analysis and visualization functions. The important outcomes of this study were about 3d GIS problems including 3d structuring and topology on that era [5] .
Goodchild et al. in 2004 investigated spatial-temporal approaches to interpret and process human response and perception patterns to 3D information and geo visualization techniques. These algorithms are used to study gender/ethnic variety in spatial temporal activity model by diary data set in metropolitan area of the Portland (Oregon) [6] .
3d road modeling software for waste gathering and transportation were investigated by Tavares et al. in 2008. In that Model one more degree of freedom is added to the system and in addition, optimize the fuel consumption by considering the effect of road slope and load of transportation means [7] .
An outline of 3D GIS analysis capability for 3d city modeling was presented by Moser et al. in 2010. In this study with reference to the real cases, sets of 3D analysis algorithms were specified and categorized into groups [8] .
Atila et al. investigated and implemented 3D revelation and navigation methods and explanations for indoor spaces in a 3D GIS system in 2013. Initially a graphic user interface was created for 3D visualization of Corporation Complex in Putrajaya based on City GML data, stored spatial data in a Geo-Database. Moreover, networks analysis were implemented by considering various scenarios [9] .
Sami Khemiri et al. in 2013 developed an accurate natural surface model. They developed a type variety of Digital Elevation Models (DEM) for the Foussana rift in Central Tunisia and utilized their model in geological, and hydro-geological study. This model was paired with hydrochemistry study and finally new maps were created using spatial analysis and interpolation techniques [10] .
Xiaoming et al. in 2015 makes a dynamic 3d information solution to implement monitoring and analysis spatial temporal distribution of passenger flow by different vehicle and service abilities of multi-dimensional Viewpoints [11] .
An outdoor AR system is built upon 3D GIS by Huang et al. and named Augmented Reality Geographical Information System (ARGIS) in 2016. Since ArcGIS commercial software has the ability to develop accurate registration in an outdoor environment without using traditional vision tracking method, therefore users can create subjectively and manipulate the system. So they proposed their method for conducting experiment on the campus of Peking University, Beijing, China to test the proposed registration mechanism [12] .
Kelijn et al. in 2017 presented the 3D Spatial Data Infrastructure that allows archaeologists and historical architecture researchers to analyze various complex sites, in order to create 3D SDI and control user level access, and they used free and open source software [13] .
This paper elaborates the current situation in 2D GIS, and explores the existing concerns about 3D information and 3D GIS development with the current experiences in National Cartographic Center of Iran. It will concentrate on available sources of data and data collection process, taking 2D GIS to 3D GIS, cartographic aspects and visualization, and finally, necessities, drawbacks and important consideration for SDI designation. The current investigation and literature does not cover all exiting drawbacks and problems dealing with 3D information required by National Spatial Data Infra-Structure.
2. Data Collection for GIS Application
Data collection for any types of GIS application, conceptually is considered as either “direct” (Drawing, EDM) or “indirect” (Use of photography, photogrammetry, laser scanning). Direct methods are guided according to operator’s selection of information while indirect methods are done without pre-selection but as post-capture selection [14] . The right acquisition method for the right cost at the right time is a Key to success in Geomatics. To use a right data collection method, it is essential to understand, available methods’ performance, final product requirement, the necessary accuracy and the available resources. There is a relationship between final output scale, favorite subject, and the optimal method. If the final scale is large (e.g. The favorite feature is small) and its number is limited, It can be done by direct methods, using GPS, Tachymetry1, EDM2, Total station …, or hand measuring, but for large area, unlimited and complicated feature, the indirect method like Laser scanning, Photogrammetry, Remote Sensing are suggested. Using the appropriate method, (one or another and sometimes integrated or hyper method) can reduce cost and time and increase the quality and consistency of final product. Sometimes there exist 2D GIS and at the same time DEM3 or DSM4. In this case that is the most likely; every existing feature in the database must find its corresponding height from the Height information data file. This scenario seems very easy task but in reality requires a complex method. It’s because, the existing old 2D GIS (i.e. 2D GIS consisted of Combination of Positional database and attributed database) must be converted to 3D enabled environment then finding an automatic or semi-automatic procedure to combine it with height information file. Figure 1 shows 3D building model superimposed on satellite imagery by Google Earth [15] .
Cartographic and Visualization Aspects of 3D Information
Map as an abstract of real world features storage media, according to the pre-defined data model and resolution ha0s been used by human being since its creation. Up until the invention of computer and digital science the cartographically drawn features on the paper were the only possible way to represent an image of the real world. Although the 2D geometric bases of a paper makes problem for cartographer with altimetric information to present, but artistic capabilities has come to help this problematic fundamental situation. Contour lines, Spot height, Hand drawn Hill shaded relief, and perspective figures has enriched maps with 3rd dimensions presentation as 2.5D map. It must be noted that the space limits within a hardcopy map would also reduce the freedom of cartographer in representation of real world [16] .
The advances of the computer hardware and software specially in graphic design provided various capabilities in embedding and enabling 3d information on
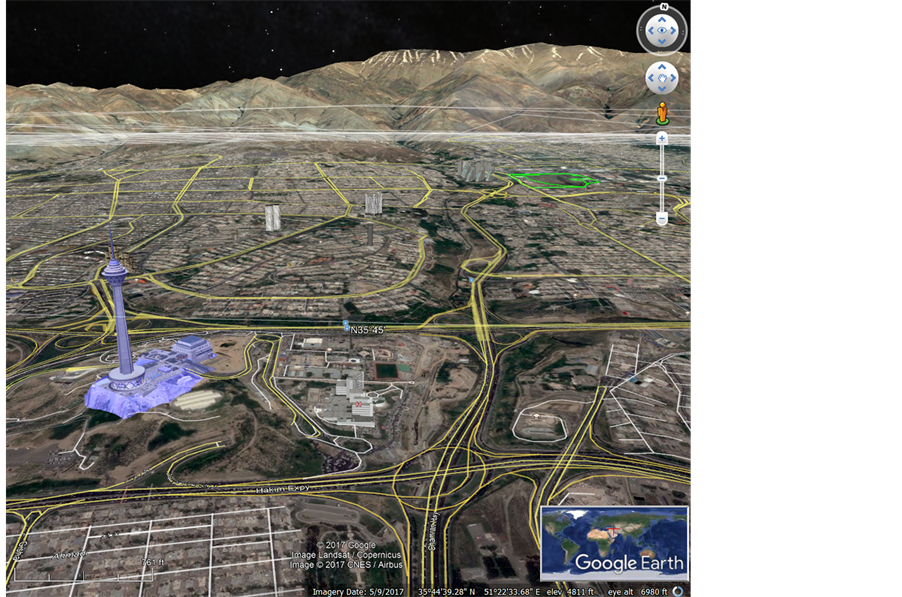
Figure 1. 3D building model superimposed on satellite imagery by Google Earth.
human eyes perception. One of the first method for relief representation on maps apart from contour lines and spot heights is “Shaded Relief” or in a thematic way combined with the land cover, it could be presented as Hill-shade Hypsometric Map [16] . This colorful type of relief map can show different aspects of the area, by the use of natural or false color Satellite image, or any existing hypsometric information such as cultivation types, temperature, geology, population and etc.
Considering the daily base growth of the need and demand for establishment of Spatial Data Infrastructure, as well as rich content and easily perceptible 3d presentation of real world, development of appropriate tools for visualization of multi disciplinary data in a service oriented framework in an enabled data sharing environment can be one of the favorite goals of the Geomatics community.
In fact, the decision making support system in any disciplines that use spatial information can be more effective and practical if SDI frame work solves the time consuming and cost effective data collection procedure as well as complexity of 3D analysis tools. By the development of the applications that can create and utilize WMS (Web Map Service), WFS (Web Feature Service), or W3DS (Web 3D Service) the data storage can be no longer a problem in various projects because, the topographic nature made objects with slow dynamic characteristic can be commonly utilized in various projects [17] .
In the next paragraphs, the existing trends as well as software will be elaborated
Figure 2 shows flood visualization in the web.
3. SDI5 and 3D Information
5Spatial Data Infrastructure.
Establishment of a framework for Geo-spatial information enhanced by 3rd dimension in a Spatial Data Infrastructure requires a comprehensive plan and clear step by step approach considering the characteristics of the data itself and the data provider’s necessity as well as the corresponding needs of the potential users.
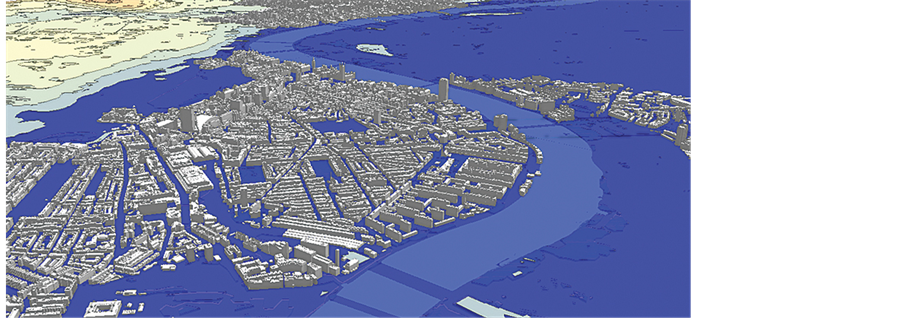
Figure 2. London flood mapping analysis and visualization in CityEngine [18] .
This job would consequently expands the circle of data users in various fields of expertise and disciplines as well as absorb more and more data producer to participate in SDI as a public or private sector company. By the growth of the data provider (multi disciplines, various utilities, and field of expertise), and data itself (such as 3rd dimension, comprehensive semantic and numeric data,...), data users would increase and this trend would lead us to a spatially enabled society. The more the society get involved into an SDI the more needs for legislation, standardization, data consistency check, and security for exchanging data and sharing information become more important and difficult as ever.
Meaning that the more rich and overwhelming SDI becomes, its control and management gets more cumbersome.
The behavior control of the society involved in SDI with various and rich components has become a challenge in its management [19] . The first step in dealing with SDI is to define an inclusive models of governance to formulate and then implement a very large number of stakeholder from all existing levels of government as well as private corporation and academic disciplines. The next step is to promote the tendency toward data sharing and utilizing the other existing data in various field among all different organizations. The third important action to be made is to develop appropriate tools and application to enable proper platform to access and utilize by provision of related services. These services include browsing, selecting, combining, visualizing and delivery of data and result in tip of the fingers of decision makers. As a major challenge in establishment of spatially enabled society, training the community of data users to spatially thinking and turning into the conscious users would be as next important step.
So as the final stage there must be a certain number of the new capacity building to be created to reach a fully operational NSDI covering all the stakeholders in a spatially enabled society, although the quality control, monitoring system plus satisfaction survey over the progress and advancement of the final result in an SDI is crucial.
4. 3D Modeling and Analysis Using Available Open Source Software
With reference to the above-mentioned subjects, one of the main components in SDI implementation would be the definition of standards on spatial data exchange. The Open Geospatial Consortium (OGC) is an international industry consortium of over 523 companies, government agencies and universities participating in a consensus process to develop publicly available interface standards [20] . OGC as one of the official spatial standard sources has defined Web 3D Service for the application of 3D information in SDI.
Web3Ds service is used to present city models, geometry of buildings, green spaces, road components structure and all the features with 3rd dimensions. This service has the capabilities to work with moving objects in different scales, enabling users to share their spatial information.
Open source software as pieces of a program developed by groups of users that are either not content with the capabilities of commercial software or those who have no access to commercial program due to financial issues or political ban (embargo) has grown recently and emerged into the utilized tools among the Geomatics community [21] .
Open-source software is very often developed in a public, collaborative manner. Programmers who have access to a computer program’s source code can improve that program by adding features to it or fixing parts that do not always work correctly. Open source software licenses promote collaboration and sharing because they allow others to make modifications to source code and incorporate that code into their own projects.
While commercial vendors usually offer products for all of software categories, open Source Software projects often concentrate on a single category, e.g. desktop GIS or WebMap server [21] .
There are well-known benefits of open source software, such as cost savings, vendor independence, and open standards. However, there are also a number of barriers, such as knowledge barriers, legacy integration, forking, sunk costs, and technology immaturity [22] .
・  ” Geo Server “as an open source software developed for making spatial services according to OGC standards. W3DS service is one of its capabilities for 3D applications and the following platforms have the abilities to make use of this service in WEB environment.
There are some JavaScript libraries for 3d Web GIS that can receive services from open source service provider, as follows:
・  “Cesium” is an open-source JavaScript library for representation and visualization of three-dimensional services of city and topographic maps as well as dynamic and moving object in globe. This software’s main features include, hi quality in terms of precision, natural looking and visualization features as well as hi performance, ease of use and advanced user interface. Its open source content supports real time dynamic and static objects with ease of use and its user community provide solution and answers to probable questions. Figure 3 demonstrates the user interface of cesium creating 3d visualization [23] ;
・  “GIScene.js” “extends the capabilities of the 3D JavaScript library three.js by adding GIS concepts like Layers, Controls, Coordinates, Projections and more [24] .
In addition, below-mentioned list shows some of the available software, that support 3D application in GIS:
・  “Quantom GIS” (QGIS) as the main competitor of ESRI products (ArcMap) with thousands of plug-ins developed by individuals [25] ;
・  “Grass” as the initially developed software by US military and then was released into the Geomatics program developer with a very hi-performance
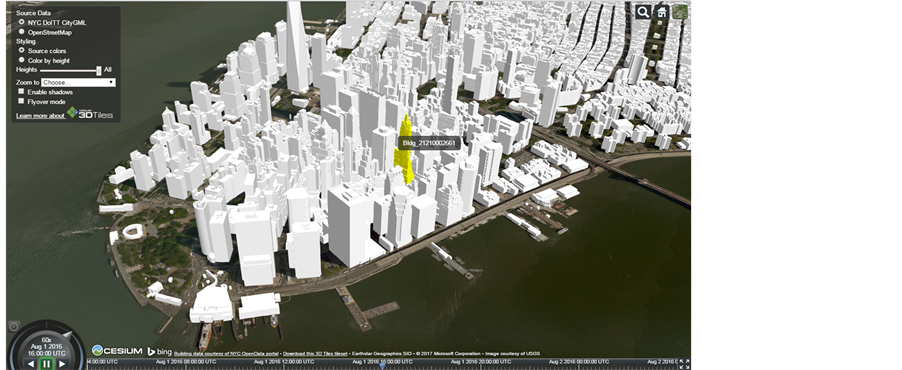
Figure 3. Interface of cesium creating 3d visualization.
available tools but rather weak GUI [26] ;
・  “SAGA GIS” program with modular structure comparable with QGIS and hi capabilities for GIS analysis and easy to use tools for 3d terrain model [27] ;
・  “gvSIG” program that can handle DEM, easy and fast which is available freely by NASA [28] ;
5. Conclusions
Provision and analyzing the geometric characteristics of topographic objects in a GIS project and in a Spatial Data Infra-Structure is a vital important step in creating a favorite environment and tools to absorb managers and technician to make use of spatial information. The nature of this analysis and appropriate tools, during the implementation progress and defining the “optimal” data, would surely affect data acquisition methods, data base management systems, data processing and presentation. This situation becomes more complicated when a new dimension as Z value is added and the cartographers are supposed to present the height information as well. In addition to above-mentioned complexities caused by an excess of information imposed by 3rd dimension; the legislations, standards, increasing stakeholders, data exchanges volume, and etc are the new concerns in implementation of SDI. In fact, all the existing issues need to be re-evaluated again and the quality control, monitoring system, plus satisfaction survey over the progress and advancement of the final result in an SDI is crucial.
It’s worth noticing the fact that Open Source software can play a very important role in the implementation and utilization of three-dimensional information of GIS and SDI including data analysis and processing as well as data visualization and presentation.
Cite this paper
Jafari Salim, M. (2017) 3D Spatial Information Intended for SDI: A Literature Review, Problem and Evaluation. Journal of Geographic Information System, 9, 535-545. https://doi.org/10.4236/jgis.2017.95033
References
- 1. Aronoff, S. (1989) Geographic Information Systems: A Management Perspective. Geocarto International, 4, 58. https://doi.org/10.1080/10106048909354237
- 2. Sonnen, D. and Morris, H. (2000) Location in CRM: Likining Virtual Information to the Real World. IDc White Paper, 12. http://www.idc.com
- 3. Raper, J.F. and Maguire, D.J. (1992) Design Models and Functionality in GIS. Computers & Geosciences, 18, 387-394. https://doi.org/10.1016/0098-3004(92)90067-2
- 4. Li, D.R. and Li, Q.Q. (1997) Study on a Hybrid Data Structure in 3D GIS. Acta Geodaeticaet Cartographica Sinica, 26, 128-133.
- 5. Zlatanova, S., Rahman, A.A. and Pilouk, M. (2002) Trends in 3D GIS Development. Journal of Geospatial Engineering, 4, 71-80.
- 6. Kwan, M.-P. and Lee, J. (2004) Geovisualization of Human Activity Patterns Using 3D GIS: A Time-Geographic Approach. Spatially Integrated Social Science, 27.
- 7. Tavares, G., et al. (2009) Optimisation of MSW Collection Routes for Minimum Fuel Consumption Using 3D GIS Modelling. Waste Management, 29, 1176-1185.https://doi.org/10.1016/j.wasman.2008.07.013
- 8. Moser, J., Albrecht, F. and Kosar, B. (2010) Beyond Visualisation-3D GIS Analyses for Virtual City Models. International Archives of the Photogrammetry, Remote Sensing and Spatial Information Sciences, 38, W15.
- 9. Atila, U., Karas, I.R. and Rahman, A.A. (2013) A 3D-GIS Implementation for Realizing 3D Network Analysis and Routing Simulation for Evacuation Purpose. Progress and New Trends in 3D Geoinformation Sciences. Springer Berlin Heidelberg, 249-260.https://doi.org/10.1007/978-3-642-29793-9_14
- 10. Khemiri, S., et al. (2013) DEM-Based GIS Algorithms and 3D Geospatial Mapping for Creation of Hydrogeological Models Data in Foussana Basin (Central Tunisia). Journal of Water Resource and Protection, 5, 801.https://doi.org/10.4236/jwarp.2013.58081
- 11. Li, X., et al. (2015) Traffic Management and Forecasting System Based on 3D GIS. 15th IEEE/ACM International Symposium on Cluster, Cloud and Grid Computing, Shenzhen, 4-7 May 2015, 991-998.https://doi.org/10.1109/CCGrid.2015.62
- 12. Huang, W., Sun, M. and Li, S. (2016) A 3D GIS-Based Interactive Registration Mechanism for Outdoor Augmented Reality System. Expert Systems with Applications, 55, 48-58.
- 13. DeKleijn, M., de Hond, R. and Martinez-Rubi, O. (2016) A 3D Spatial Data Infrastructure for Mapping the via Appia. Digital Applications in Archaeology and Cultural Heritage, 3, 23-32.
- 14. Blake, B., et al. (2003) Metric Survey for Heritage Documentation; Introduction. RicorDIM Initiative.
- 15. https://www.google.com/earth/desktop/
- 16. Bilgi, S. and Ipbuker, C. (2011) Optimization of Geographic Data Using Entropy. Istanbul Technical University, Istanbul, Presented in International Cartography Association Conference, Paris.
- 17. Schmidt, M.A.R. and Delazari, L.S. (2011) User Testing with Tools for 3D Visual Navigation. Instituto Federal do Triangulo Mineiro, Uberlandia-Mg, Brazil, Universidade Federal do Paraná, Curitiba.
- 18. http://www.esri.com/esri-news/arcnews/summer14articles/taking-london-by-3d
- 19. Masser, I., Rajabifard, A. and Williamson, I.P. (2007) Spatially Enabling Governments through SDI Implementation. International Journal of GIS, 22, 5-20.
- 20. http://www.opengeospatial.org/ogc
- 21. Jafari Salim, M. (2014) The Analysis of Open Source Software and Data for Establishment of GIS Services throughout the Network in a Mapping Organization at National or International Level. PhD Thesis, Politecnico di Torino.
- 22. Nagy, D., Yassin, A.M. and Bhattacherjee, A. (2010) Organizational Adoption of Open Source Software: Barriers and Remedies. Communications of the ACM, 53, 148-151. https://doi.org/10.1145/1666420.1666457
- 23. https://cesiumjs.org/
- 24. http://giscience.github.io/GIScene.js/
- 25. http://www.qgis.org/en/site/
- 26. https://grass.osgeo.org/
- 27. http://www.saga-gis.org/en/index.html
- 28. http://www.gvsig.com/
NOTES
1An old field surveying method using Theodolite equipment.
2Electronic Distance measurement system.
3Digital Elevation Model.
4Digital Surface Model.