Journal of Geographic Information System
Vol.6 No.3(2014), Article
ID:46557,24
pages
DOI:10.4236/jgis.2014.63019
Designing an Online Geospatial System for Forest Resource Management
Peter G. Oduor1, Michael Armstrong2, Larry Kotchman3, Michael Kangas4, Buddhika Maddurapperuma5, Kelsey Forward6, Pubudu Wijeyaratne7, Xiana Santos8, Akiko Nakamura9, Krystal Leidholm10
1Department of Geosciences, North Dakota State University, Fargo, USA
2IT Systems Vulnerability, Sanford Health Fargo, Fargo, USA
3North Dakota Forest Service, Bottineau, USA
4North Dakota Forest Service, North Dakota State University, Fargo, USA
5Environmental & Conservation Science Program, North Dakota State University, Fargo, USA
6Wenck Associates North Dakota, Fargo, USA
7Department of Computer Science, North Dakota State University, Fargo, USA
8Department of Forestry, Mississippi State University, Starkville, USA
9East View Geospatial, Minneapolis, USA
10California Department of Fish & Game, Washburn, USA
Email: Peter.Oduor@ndsu.edu, Mike.Armstrong@sanfordhealth.org, Larry.Kotchman@ndsu.edu,
Michael.Kangas@ndsu.edu, b.madurapperuma@my.ndsu.edu, kforward@wenck.com,
pubudu.wijeyaratne@ndsu.edu, xsantos@CFR.MsState.edu, Akiko.Nakamura@eastview.com,
kleidholm@hotmail.com
Copyright © 2014 by authors and Scientific Research Publishing Inc.
This work is licensed under the Creative Commons Attribution International License (CC BY).
http://creativecommons.org/licenses/by/4.0/
![]()
![]()

Received 11 April 2014; revised 10 May 2014; accepted 20 May 2014
ABSTRACT
Geographic and Geospatial information systems (GISs) have especially benefited from increased development of their inherent capabilities and improved deployment. These systems offer a wide range of services, for example, user-friendly forms that interact with the geospatial components for locational information and geographic extents. An online distributed platform was designed for forest resource management with map elements residing on a GIS platform. This system is accessible on non-authenticated browsers optimized for desktops; whereas the online resource management forms are also accessible on mobile platforms. The system was primarily designed to aid foresters in implementing resource management plans or track threats to forest resource. Baseline data from the system can be easily visualized and mapped. Other data from the systemcan provide input for stochastic analyses especially with respect to forest resource management.
Keywords:ArcGIS Server, Wildland Fire, Forest Stewardship, North Dakota

1. Introduction
Decision Support Systems (DSSs) are fundamental in addressing complexity of making coherent, integrated, and interdependent resource management decisions. This is due to their inherent nature of ability to cohesively formulate those parameters or pertinent information that otherwise cannot be processed effectively by human heuristic processes. Decisions formulated from DSSs must be defensible by stakeholders (e.g. [1] ), factor in multi-scalability and temporal issues, factor in other relevant considerations, aid in resolving potential conflicts amongst other factors. Interactive computer-based systems have been adopted to help decision makers utilize data and models to solve unstructured problems or decision support systems [2] [3] . DSSs have evolved to encompass multi-component systems that include various combinations of simulation modeling, optimization techniques, heuristics and artificial intelligence techniques, geographic information systems (GIS), associated databases for calibration and execution, and user interface components [4] . Each of these six components may to some degree individually satisfy Sprague and Carlson’s [3] generic DSS definition.
An Adaptive Decision support systems (ADSS) may be interpreted to include any system that is capable of self-teaching, which is accomplished by integrating unsupervised inductive learning methods (e.g. [5] -[7] ). ADSSs reduce effectively the need for implementing complex spatial analytical capabilities on an ArcGIS server platform by generating the best result to a problem by refining an initial solution. This can be done by essentially incorporating the results of the spatial analyses as a layer with identifiable features. Adaptability of such a system may arise from GUI designs (dialog subsystem) with pertinent factors accounted for (e.g. [8] -[11] ), degree of interactivity of data (database subsystem), auxiliary information (knowledge subsystem), spatial analyses (problem processing subsystem), statistically derived data (model base subsystem) and lastly expert analyses (decision-based subsystem).
The primary aim of this study was to integrate an out-of-the-box ArcGIS Server system with hallmarks characteristic of an ADSS essentially to: 1) provide a secure gateway for the North Dakota SAP derived data layers for resource management by depicting lands rich in natural resources, vulnerable to threat or both. 2) Serve as a city, county, state and federal reporting mechanism for NDFS and affiliated partners' forestry management accomplishments; a resource locale identifier; a tracking and monitoring geospatial interface; and a public resource to monitor or track threats or vulnerabilities including invasive species, catastrophic wildfire, and climate change effects on forestry and forest conversion. 3) Provide baseline data on the forest resources of North Dakota to model potential forest resource threats and offer management opportunities identified through the state forest resource assessment and/or vulnerabilities identified using the State and Private Forestry Redesign national assessment tool. 4) Determine and identify tracts that were not included in the original spatial analysis project. 5) Provide a concise central repository and inventory of forestry programs identifiable by searchable attributes such as city, county or associated wild land-urban interface. The specific objective was to design a widely distributed online portal for forest resource management.
2. Overview of North Dakota
North Dakota was formerly the northern portion of Dakota Territory, located in the Midwestern region of the United States, became a US state in 1889. It borders Minnesota to the east, South Dakota to the south, Montana to the west and Canadian provinces of Manitoba and Saskatchewan to the north. It spans a latitudinal range of 45.93˚ - 49˚ and extends westwards from 96.55˚ to 104.05˚ longitude. Its areal coverage makes it the 19th most extensive US state and comprises of 53 counties (Figure 1). North Dakota state capitol is located in Bismarck on the banks of the Missouri River just downstream from Lake Sakakawea. Lake Sakakawea, a large man-made lake, is behind Garrison Dam. The largest city is Fargo on the banks of the Red River. North Dakota was considered part of the Great American Desert. A precipitation gradient exists from east to west. The eastern regions generally receive more precipitation. The area in the past was resplendent with devastating prairie fires making
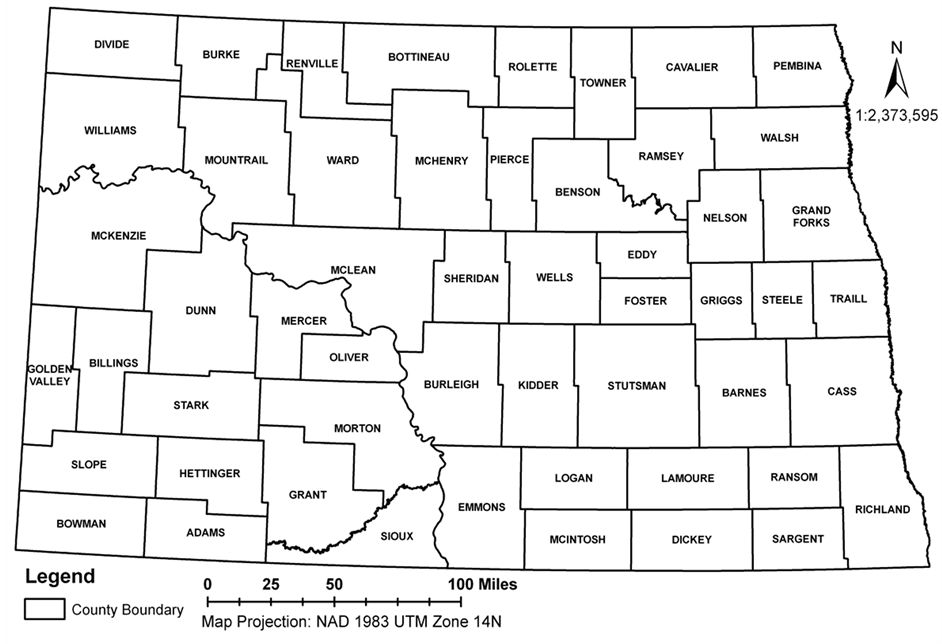
Figure 1. An overview map of North Dakota, USA.
establishment of arboreal ecosystems extremely difficult. The western half of the state consists of the hilly Great Plains, and the northern part of the Badlands to the west of the Missouri River [12] [13] . The state’s high point, White Butte at 3506 feet (1069 m), and Theodore Roosevelt National Park [12] [13] are located in the Badlands. North Dakota is abundant in fossil fuels, for example, natural gas, crude oil, lignite coal predominantly in the western part of the state. Fossil fuels form primary economic activities in the western part of the state whereas the eastern part of the state has a thriving agricultural sector industry. Natural trees in North Dakota include riparian forests around perennial streams, around Killdeer and Turtle Mountains, and in significant plantings, for example, managed forests and in other areas such as shelterbelts. North Dakota forests are comprised of four major types: elm-ash-cottonwood, aspen, oak and ponderosa pine [12] . The North Dakota Forest Service (NDFS) was established in 1906 to practice sound land stewardship to enhance and preserve forests, grassland, and wetland ecosystems found within the state boundaries [12] . By 1954, the total acreage for protection plantings was 89,000 acres (360,170,221.59 m2), earning North Dakota the distinction of having more protection plantings than any other state in the United States. To date, the natural woodlands of North Dakota covered about 824,000 acres of forested land that includes shelterbelts.
3. Methodology
3.1. Phase I: System Structure
The system design entails three user levels accessible to: 1) local users and administrators, 2) registered foresters, and 3) rural fire departments, researchers and the general public (Figure 2). Administrators are able to view log files, update databases, update the geospatial database elements, register new users and perform system maintenance tasks. The design schema has two main databases accessible to 1) foresters (private database), and 2) public (public database) with pertinent security and protection mechanisms instituted. The public database is accessible through non-authenticated browsers (Figure 3).
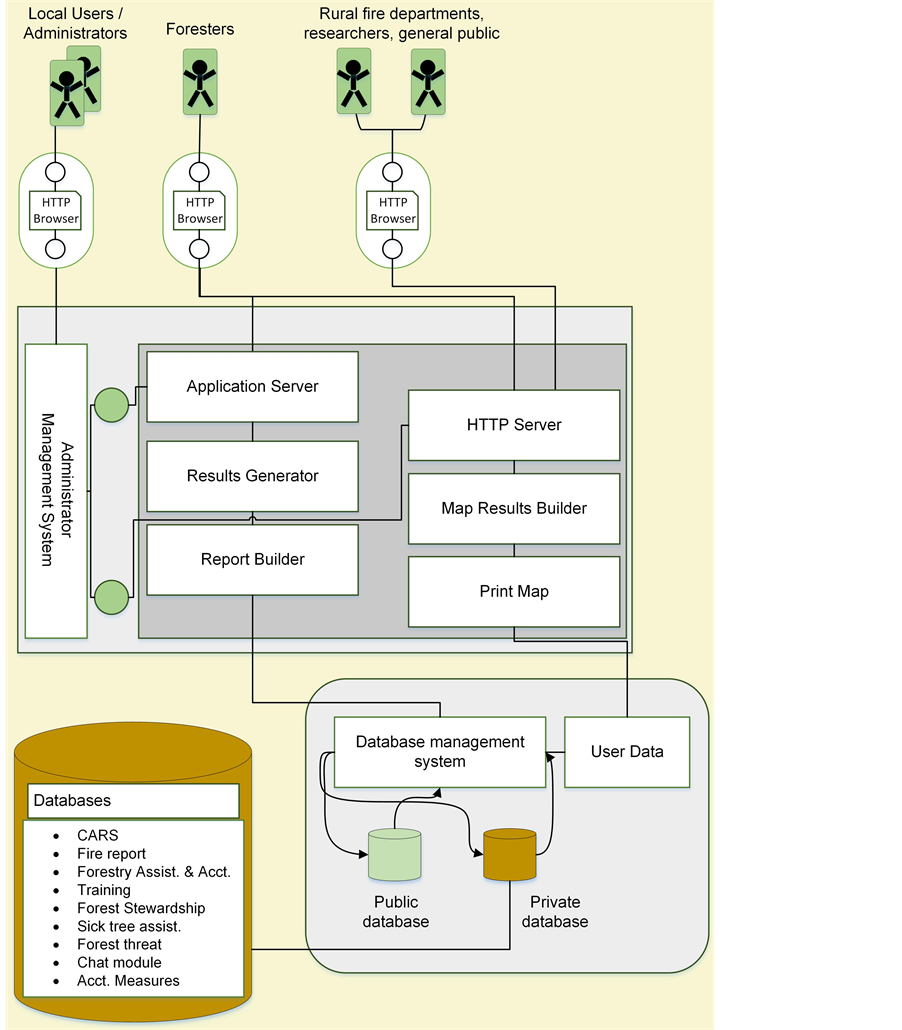
Figure 2. North Dakota Forest Service Decision Support System (NDFSDSS) system configuration.
3.2. Phase II: Management System
Several databases were linked to web forms to capture resource management data. The forms were designed to, capture user information, represent underlying features integral to the database, for example, associated FIPS codes, store the dialog or knowledge base, and provide on demand pertinent information from multiple sources for forestry resource management. For example, for Forest Stewardship plan, a dynamic interaction between the user and the system enables amongst other alternatives, ability to determine if a proposed plan would be in a prioritized area. We also implemented minimum data storage and applied security measures in retrieval of non-sensitive data. Most of the forms designed are available to the general public, while the databases can only

Figure 3. Opening page of NDFSDSS (http://ndfsdss.dakotacollege.edu/).
be accessed by the North Dakota Forest Service personnel.
Types of forms and databases designed include: 1) Community Accomplishments Reporting System For Urban And Community Forestry Program (form), 2) North Dakota Rural Fire Department Wild land Fire Report (form and database). 3) Redesign-Innovation in State and Private Forestry form, 4) Technical Forestry Assistance and Accountability Measures Report for Information and Education (form and database), 5) Training Program/Presentation Template (form and database). The following forms require login: 1) Accountability Measures Report (form and database). 2) Forest Stewardship Program and Rural Forestry Assistance (form). 3) Sick Tree Assistance Form (form and database). 4) Forest Resource Management Plan (template). 5) Report a Forest Threat (template and database). 6) Talk to a Forester (chat).
3.3. Community Accomplishments Reporting
The CARS (Community Accomplishments Reporting System for Urban & Community Forestry Program) allows for measured outcomes on: 1) Percent of population living in communities managing programs to plant, protect and maintain their urban and community trees and forests. 2) Percent of population living in communities developing programs and/or activities to plant, protect and maintain their urban and community trees and forests. The designed form allows for multi-year tracking of these percentages to gauge community participation and success of community based programs for various stakeholders. The form accepts all generic CARS related Microsoft Excel® comma delimited files. Various outputs can also be tracked for each fiscal year. These include: 1) Number of people living in communities provided educational, technical and/or financial assistance. 2) Number of people living in communities that are developing programs/activities for their urban and community trees and forests. 3) Number of people living in communities managing their urban and community trees and forests. 4) Number of communities with active urban & community tree and forest management plans developed from professionally-based resource assessments/inventories. 5) Number of communities that employ or retain through written agreement the services of professional forestry staff who have at least one of these credentials: a) degree in forestry or related field and b) ISA certified arborist or equivalent professional certification. 6) Number of communities that have adopted and can present documentation of local/statewide ordinances or policies that focus on planting, protecting, and maintaining their urban and community trees and forests. 7) Number of communities with local advocacy/advisory organizations, such as, active tree boards, commissions, or non-profit organizations that are formalized or chartered to advise and/or advocate for the planting, protection, and maintenance of urban and community trees and forests. 8) Number of hours of volunteer service logged. (An agency-wide consistent methodology to be developed to track volunteer hours). 9) State offered community grant program in current fiscal year. 10) Number of communities receiving financial assistance awarded during the Federal FY 2010 through a state managed community grant program. 11) Amount of Federal (USFS) funding to States. From the database critical needs may be addressed especially for: a) communities that have the potential to develop management programs for their trees and forests with assistance from UCF technical, financial and/or educational program services, and b) communities that currently are not managing, or developing programs to manage, their urban and community trees and forests. Finally, an estimate of federal (USFS) dollar cost or expenditure per capita in community assisted can be tracked.
3.4. Fire Report
This form was designed to collate forest fire information for wildland fire occurrences within North Dakota. Pertinent data collected include: 1) Fire discovery and containment dates, 2) fire size (acreage), 3) locational information (latitude and longitude and land ownership, 4) cause of fire, 5) vegetation burned, and 6) structures lost or threatened. This information will be critical in modeling fire disturbance and spread, for example, by defining a non-parametric separation index (SI) to potentially determine which cover types are prone to fire disturbances. The cover types listed on the form include, grass, cropland, pine forest, hardwood forest, brush and any other category. North Dakota has a climatic gradient from the drier West to well-watered Eastern parts. The SI can be calculated from [14] :
 , (1)
, (1)
where ![]() is separation index between cover types i and j
is separation index between cover types i and j ,
, ![]() is the overlap area between cover types i and j,
is the overlap area between cover types i and j,  or
or ![]() is area for cover type i or j, and Min represents the minimum function (smaller number between
is area for cover type i or j, and Min represents the minimum function (smaller number between  and
and![]() ). Data from the GIS application and fire data can also be used to model spatio-temporal variability in fire return intervals using Stambaugh and Guyette method [15] . Fire return intervals can be estimated from empirically determining a Mean Fire Interval (MFI) from [15] :
). Data from the GIS application and fire data can also be used to model spatio-temporal variability in fire return intervals using Stambaugh and Guyette method [15] . Fire return intervals can be estimated from empirically determining a Mean Fire Interval (MFI) from [15] :
![]() , (2)
, (2)
where TRI denotes the topographic roughness index, POP signifies the natural log of human population density, and RD is river distance. Flame height can be modeled from the following equation [16] :
 , (3)
, (3)
where ![]() is wind speed at a given height (m/s),
is wind speed at a given height (m/s), ![]() is flame height (m) in the absence of wind, and
is flame height (m) in the absence of wind, and  is gravity (m/s2). The tangent of the flame tilt angle is proportional to
 .
.
3.5. Forestry Assistance and Accountability
North Dakota Forest Service through its outreach programs extends educational components through several programs. These include, Natural Resource Conservation Education, Envirothon, Arbor Day, and Smokey Bear Poster Contests. The extension of this program is facilitated through numerous avenues including the Teacher Learning Centers across the state, Project Learning Tree workshops, and via other K-12 outreach programs. Some of these programs are funded under the auspices of the North Dakota Environmental Education Strategic State Plan. Organizers of these events can now report through the Forestry Assistance & Accountability form. This form is also dynamically-linked to the Accountability Measures form (Figure 4). This information can
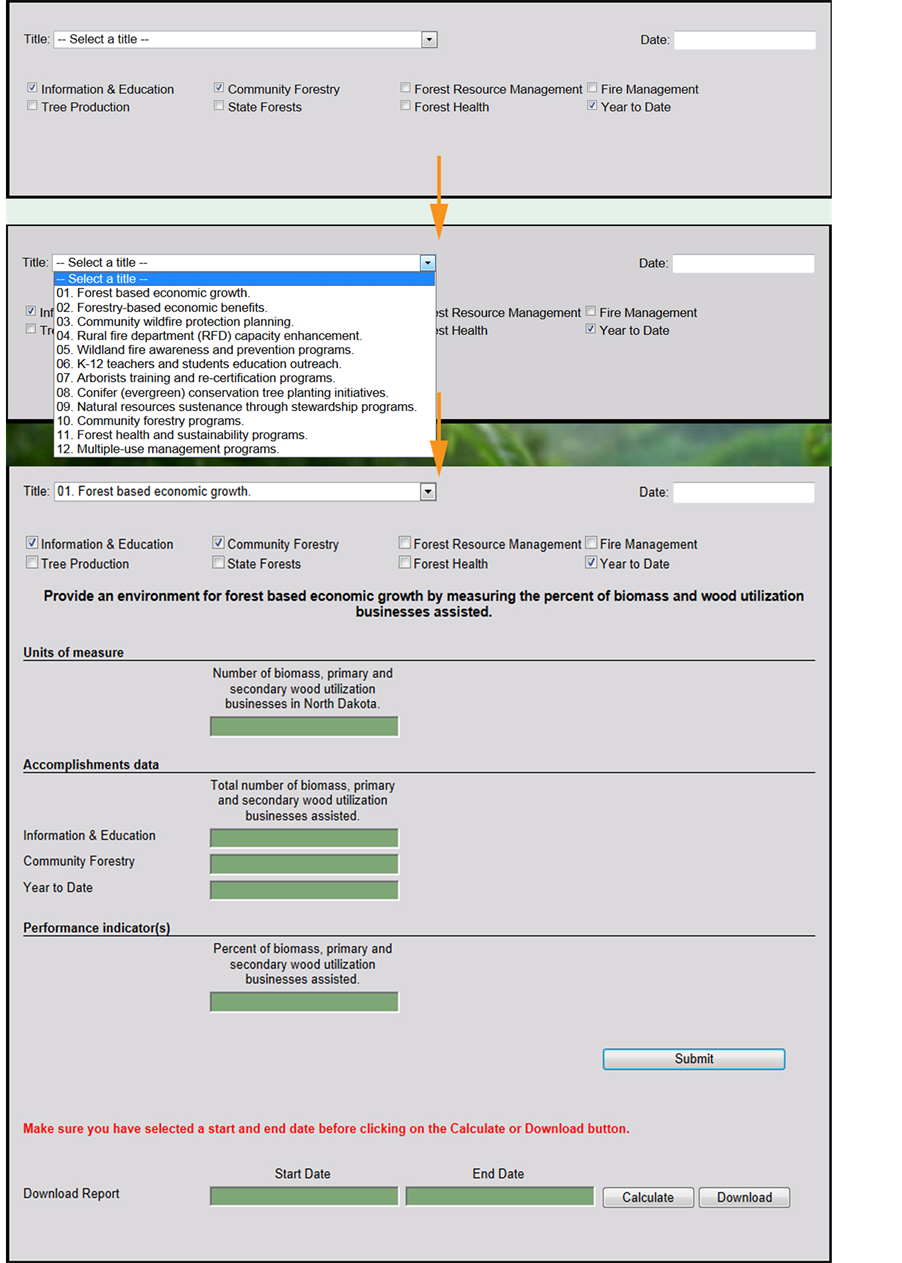
Figure 4. Multi-component Accountability Measures Report form designed to integrate several levels of data in a master RDBMS.
be used to track educational programs across the state.
3.6. Training
The training form populates a database with available training programs and cooperating agencies. Listed training includes 1) Fire department training, 2) Insect and disease training, 3) Landowner education and training, and any other agency-based training program. Cooperating agencies that may be involved include North Dakota Department of Agriculture (NDDA), ND Game & Fish, NDSU Extension, Animal and Plant Health Inspection Service (APHIS), Tribal Organizations amongst other potential agencies.
3.7. Forest Stewardship Program
Original guidelines were meant to delineate potential stewardship tracts within states; provide tools necessary for the North Dakota Forest Service to effectively and efficiently address critical forest resource issues at state, regional, and community scales; and provide forest resource managers with unbiased means to address problems, opportunities and objectives associated with intermingled federal, city, state and private land ownership patterns within North Dakota. The form (Figure 5) designed for forest stewardship and rural forestry assistance help track number of landowners that participated in landowner assistance or education-based programs. The value for education-based programs comes from Section 3.6. The form also calculates the acreage for 1) new and/or revised Forest Stewardship Management plans, 2) new and/or revised Forest Stewardship Management Plans that are in prioritized areas. These areas include high priority areas, medium priority, and low priority areas (e.g.
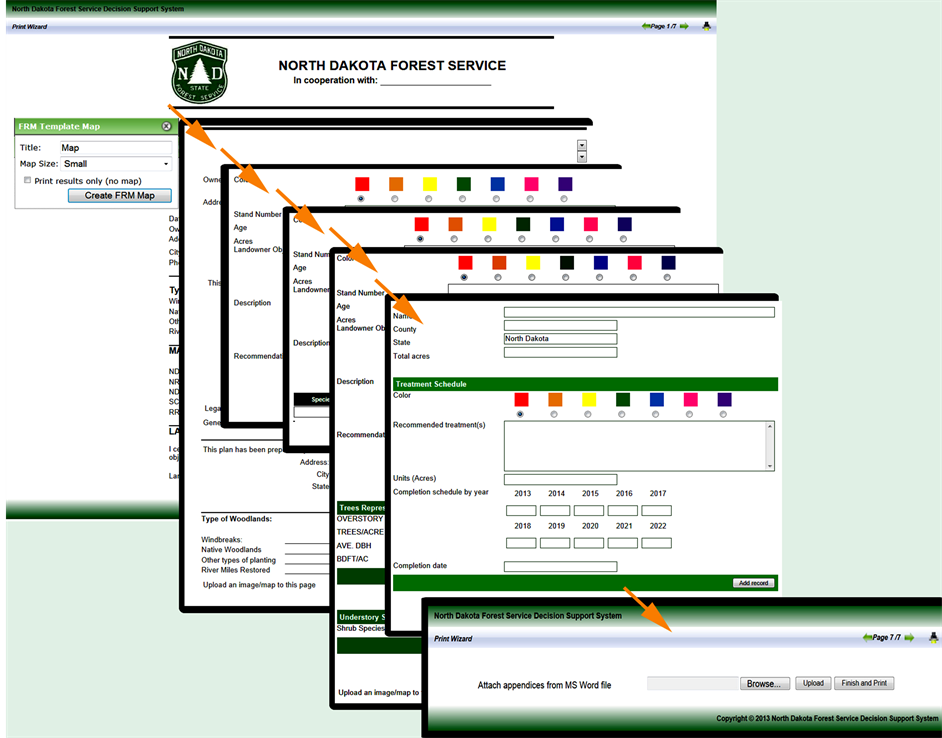
Figure 5. Forest resource management and stewardship template. The designed template provides map interactivity with locations, resource threats/potential and associated base maps.
[10] ). The number of plans for any fiscal year can be queried within the database. Other critical areas that can be easily queried include: a) Base Non-Industrial Private Forests (NIPF) acres in important forest resource areas, b) acres covered by current Forest Stewardship plans, c) acres in important forest resource areas covered by current Forest Stewardship plans, d) total number of acres in important forest resource areas being managed sustainably, as defined by a current Forest Stewardship Plan, e) acres currently under an Environmental Quality Incentives Program (EQIP) Management Plan.
Using Markovian random processes e.g. [13] we successfully utilized the Forest Stewardship Program data to model the transition potentials and areal changes for eastern North Dakota. Our basic paradigm was to define forest transition as a first-order Markov process ![]() with
with ![]() and
and  for
for![]() . If the conditional probability is not affected by earlier states then [13] [17] :
. If the conditional probability is not affected by earlier states then [13] [17] :
 , (4)
, (4)
with  as the transition density. A Markovian process can be adequately determined by two functions,
 and
and  such that for
  then [17] :
 , (5)
, (5)
which also holds true for all hierarchy of . The time-stationary Markov chain can be determined by the Markov transition matrix
  for
for  and
and  such that [13]
[18] :
 , (6)
, (6)
 and as such
  (7)
(7)
where ni (t − 1) is the total number of cells transiting from category iduring the tth transition period, nij(t) is the number of cells transiting from category i to j in the tth transition period (Wu et al., 2006). From Equation (6), if
![]() where
where ![]() for
for  and
and ![]() otherwise, then
otherwise, then ![]() is continuous at
is continuous at  and
and
 where I is the identity matrix, with
 ![]() and
and
 [13] [19] . Q is infinitesimal generator that represents the rates of change of the transitions. We can therefore surmise that the transition rate at time y,
![]() are solutions to,
are solutions to,
 , system of differential equations.
3.8. Sick Tree Assistance, Forest Threat, Chat
The sick tree assistance form was designed to aid private landowners provide base data for managing any tree that exhibited disease symptoms. An exhaustive listing is provided for common tree species within the state with a chance of inputting cultivars if known. The forest threat module was designed to provide a concise detail of potential threats in the following categories: 1) Invasive plants, 2) insects, 3) diseases, 4) climate, 5) loss of open space, 6) pollution, 7) wild land fires, 8) other invasive species, for example, non-native earthworks, 9) unmanaged recreation or any other unlisted threat. The form also provides for each listed threat an image and text description of each threat on computer mouse hover (Figure 6). A chat module was also created primarily for foresters from different geographic locales to be able to dialogue especially on pertinent issues. In this way the chat module effectively provides an extra platform for communication.
3.9. Accountability Measures
The accountability measures report is the most comprehensive management component designed. It coprises of twelve sections and seven areas of accomplishments data that could be used in any combination. The sections include: 1) Forest based economic growth. 2) Forestry-based economic benefits. 3) Community wildfire protection planning. 4) Rural fire department (RFD) capacity enhancement. 5) Wildland fire awareness and prevention programs. 6) K-12 teachers and students education outreach. 7) Arborists training and re-certification programs. 8) Conifer (evergreen) conservation tree planting initiatives. 9) Natural resources sustenance through stewardship programs. 10) Community forestry programs. 11) Forest health and sustainability programs. 12) Multiple-use management programs. The seven areas for accomplishments data include: 1) Information and education, 2) Community forestry, 3) Forest Resource Management, 4) Fire management, 5) Tree production, 6) State forests, and 7) Forest health. For each accomplishment data a performance indicator is automatically calculated based on underlying factors within the seven areas and standardized units of measure. A searchable by date database is also generated.
4. Result Analysis
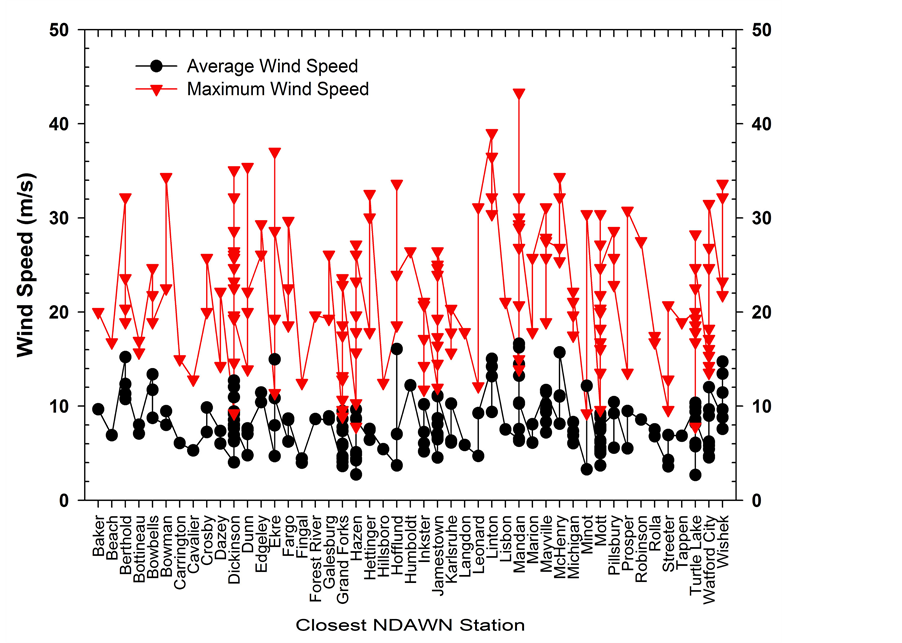
It is worthwhile to note that most wild land fire occurrences are on riparian or close to riparian forests (Figure 7). This indicates that even with relatively higher stand densities, decreased probability of torching and lower canopy heights amongst other factors they still had higher probability of torching than upland forests. Figure 8(a) shows average and maximum wind speeds for North Dakota Agricultural Weather Network (NDAWN) stations recorded on the same day that wild land fire was recorded. Thiessen polygons were generated using ArcGIS to determine which GPS locations of wild land fires corresponded to which NDAWN station. It is clear that maximum wind speeds were recorded where the burned areas were larger. At Bottineau the burned area exceeded 400 m2 although the wind speed was comparatively lower, this can be attributed to the type of less fire tolerant vegetation found in this area which is also resplendent with typical needle-leaves trees. From Equation (3), we modeled ![]() for
for ![]() = 0.2 m, 0.4 m, 0.6 m, 0.8 m, 1.0 m, 1.2 m, 1.4 m and 1.6 m. The rationale of choice for
= 0.2 m, 0.4 m, 0.6 m, 0.8 m, 1.0 m, 1.2 m, 1.4 m and 1.6 m. The rationale of choice for ![]() values was to cover a broad range of wildland vegetation, that is, prairie grasses that cover most of North Dakota, intermittent shrub heights and also to allow for an acceptable range of anthropogenically-induced wildland fire heights (figure 8(b)). From Figure 8(c), for the
values was to cover a broad range of wildland vegetation, that is, prairie grasses that cover most of North Dakota, intermittent shrub heights and also to allow for an acceptable range of anthropogenically-induced wildland fire heights (figure 8(b)). From Figure 8(c), for the ![]() values used, we found that
values used, we found that ![]() varies from 4% - 59% (
varies from 4% - 59% (![]() ). NDAWN stations that had higher ranges for
). NDAWN stations that had higher ranges for
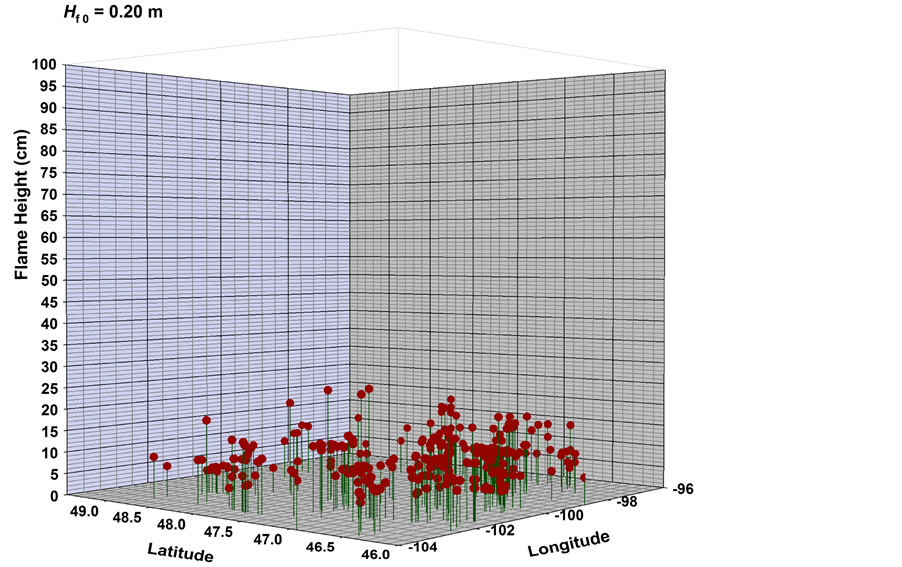
![]() included Hazen, Turtle Lake and Watford City, however, there burned areas were smaller in acreage. Figures 9(a)-(h) show variation of flame height in cm when wind is considered with respect to latitude and longitude. For the range of
included Hazen, Turtle Lake and Watford City, however, there burned areas were smaller in acreage. Figures 9(a)-(h) show variation of flame height in cm when wind is considered with respect to latitude and longitude. For the range of ![]() values used the observed trend is that flame heights with respect to wind are higher in a band trending NW - SE along the central grasslands region. From Figure 7, in 2012, most fire occurrences reported for this region were in Stutsman County. It is also worthwhile that there is no discernible uniform trend for flame heights for each location (trend would mimic same trend that can be generated from Figure 8(c)). All graphs were generated using SigmaPlot (Systat Software, San Jose, CA). Figures 10(a)-(h)
values used the observed trend is that flame heights with respect to wind are higher in a band trending NW - SE along the central grasslands region. From Figure 7, in 2012, most fire occurrences reported for this region were in Stutsman County. It is also worthwhile that there is no discernible uniform trend for flame heights for each location (trend would mimic same trend that can be generated from Figure 8(c)). All graphs were generated using SigmaPlot (Systat Software, San Jose, CA). Figures 10(a)-(h)
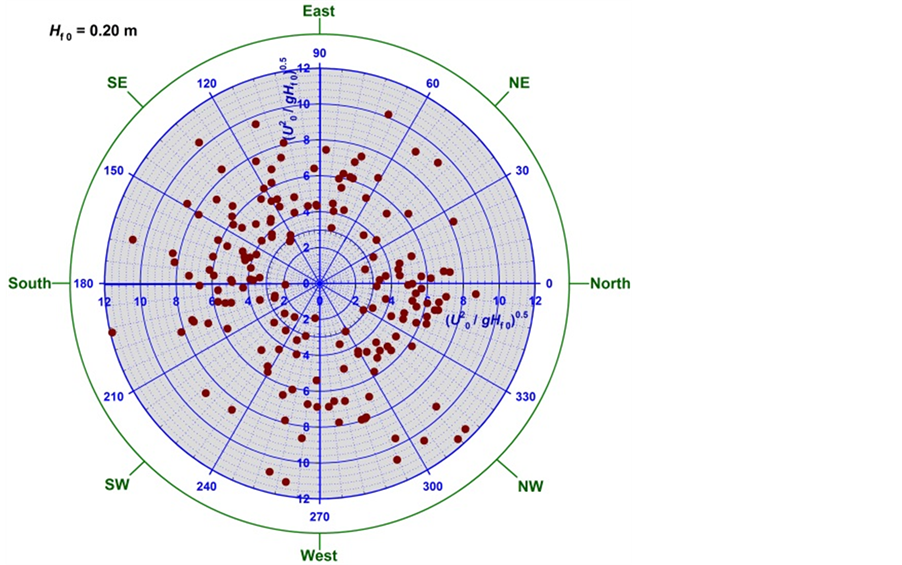
represent polar plots where the distance from the origin of the graph is given by  and the angle between the positive horizontal axis and the radius vector from the origin is represented by the wind direction as recorded by NDAWN stations. They represent an annual composite of wind direction roses with respect to recorded fire events. It can be clearly seen that for locations where the prevailing directions are westward there are correspondingly higher values of
  and as such larger tangential tilts and equally larger areas affected. At an annualized outlook of wind patterns and several locations it is equally harder to predict incoming and return flow directions. Nevertheless, we can adduce from Figures 10(a)-(h) that for
 ![]()
there is a prevailing NW trend for wind direction.
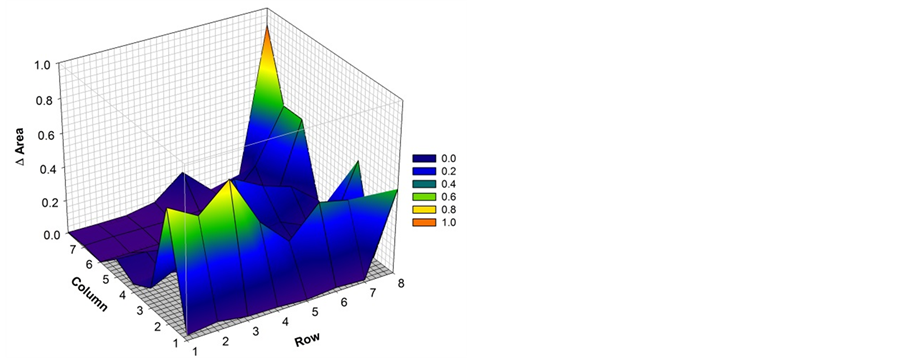
From Figures 11(a)-(h), the following categories of land use and land cover are enumerated: 1-Row crops,
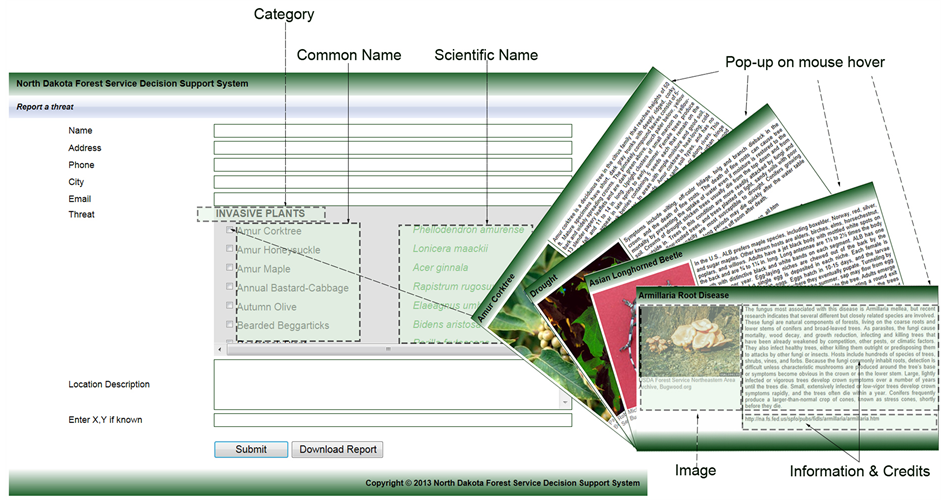
Figure 6. Report a forest threat form features forest threats in several categories, for example; (a) Invasive plants, (b) Insects, (c) Diseases, (d) Climate, (e) Loss of open space, (f) Pollution, (g) Wildland fires, (h) Other invasive species, (i) Unmanaged recreation and an “other” category.
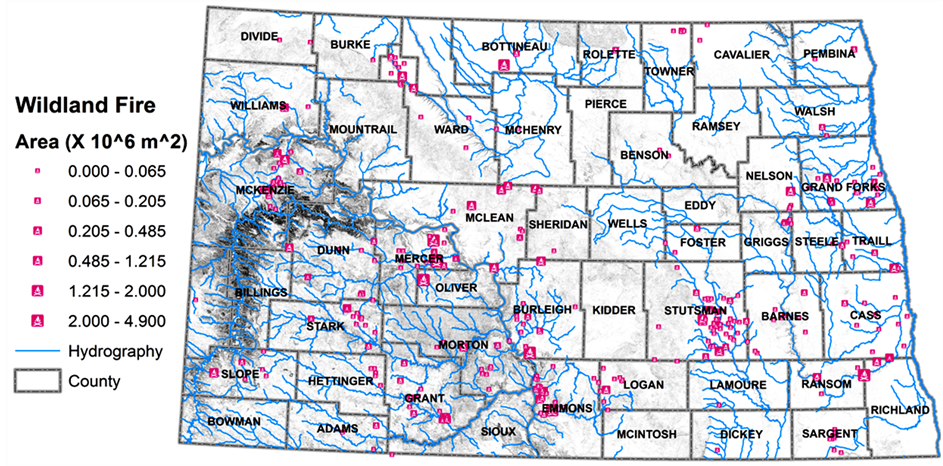
Figure 7. A map depicting 2012 wildland fire locations with graduated symbols depicting burned areas. The hydrography layer shows all perennial, intermittent and ephemeral streams.
2-Grains, hay, seeds, 3-Other crops,4-Idle cropland/fallow/Conservation Reserve Program (CRP), 5-Grass, pasture, non-agriculture, 6-Woodland, 7-Urban/developed, 8-Water. The highest change in area (Figures 11(a)-(c)) between 2000 and 2001 is the water category, as shown by the prominent peak. This peak change can be attributed to significant flooding in 2001.Other notable peaks include grains, hay, seeds and idle cropland/ fallow/CRP transiting to grass, pasture, non-agriculture category. This also may be due to more lands converting to CRP lands. The CRP is a land conservation program administered by the Farm Service Agency (FSA) where farmers enrolled in the program agree to remove environmentally sensitive land from agricultural production
 (a)
(a)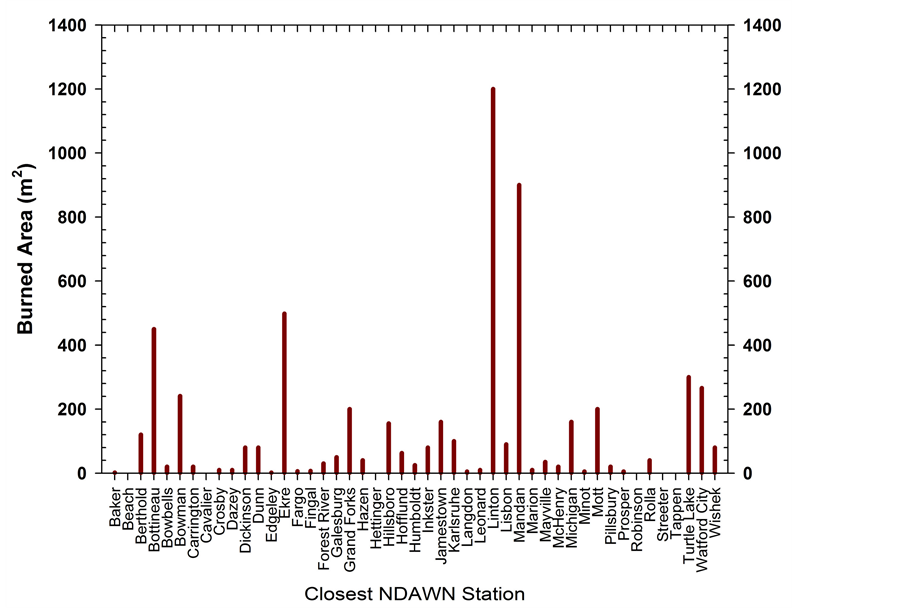 (b)
(b)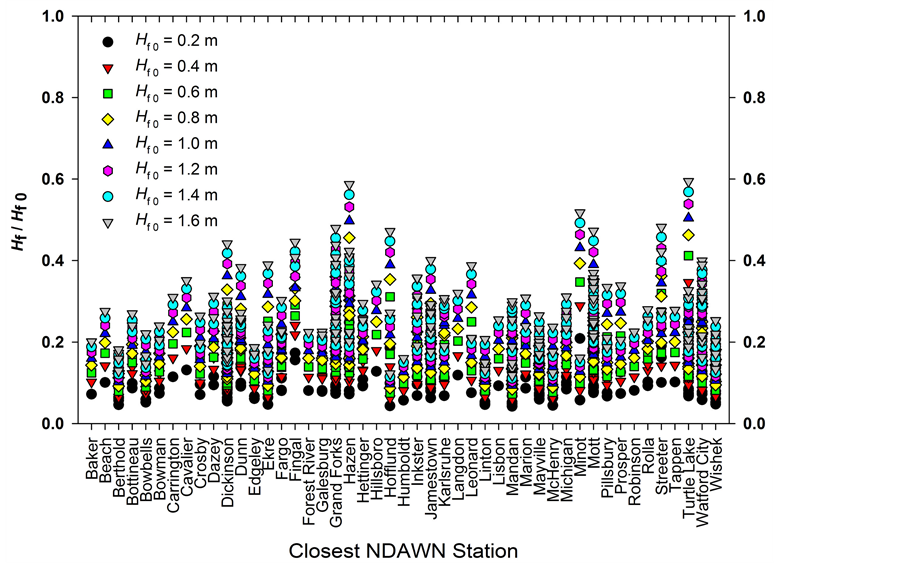 (c)
(c)
Figure 8. (a). Average and maximum wind speed data for days when wildland fire was recorded. (b) Burned area within each defined thiessen polygon corresponding to a North Dakota Agricultural Weather Network (NDAWN) station. (c). Ratio of flame height  to flame height in the absence of wind
  for each wildland fire location.
 (a)
(a)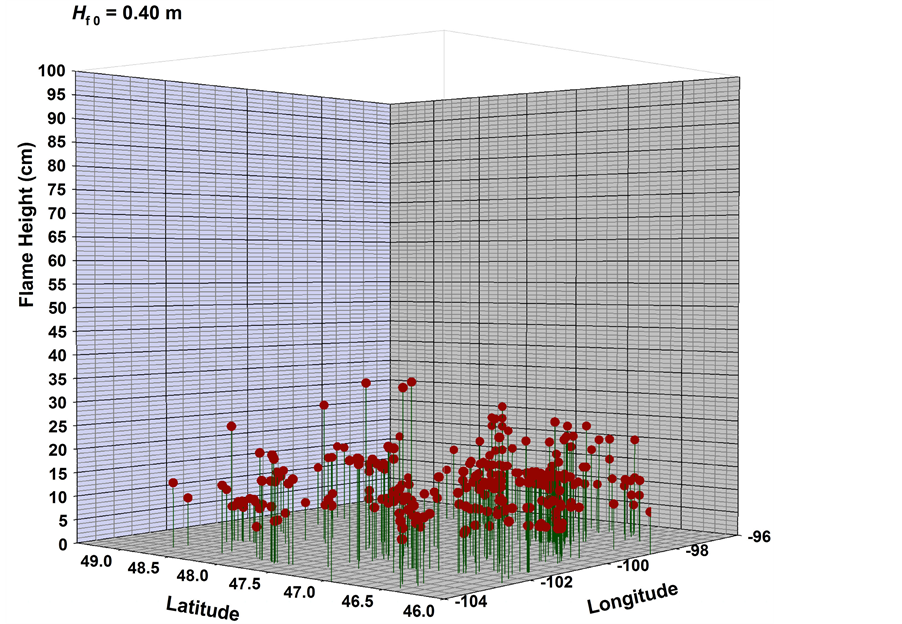 (b)
(b)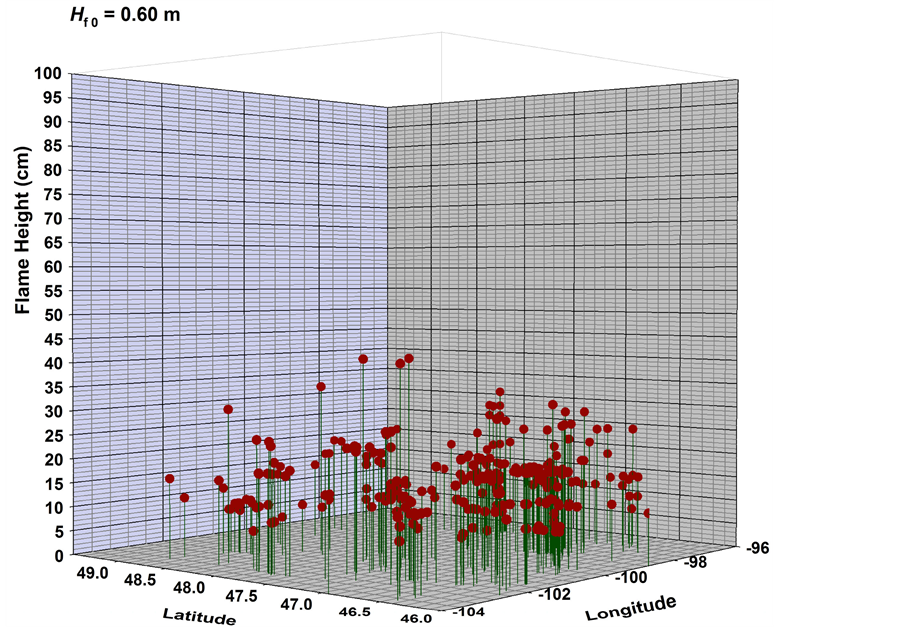 (c)
(c)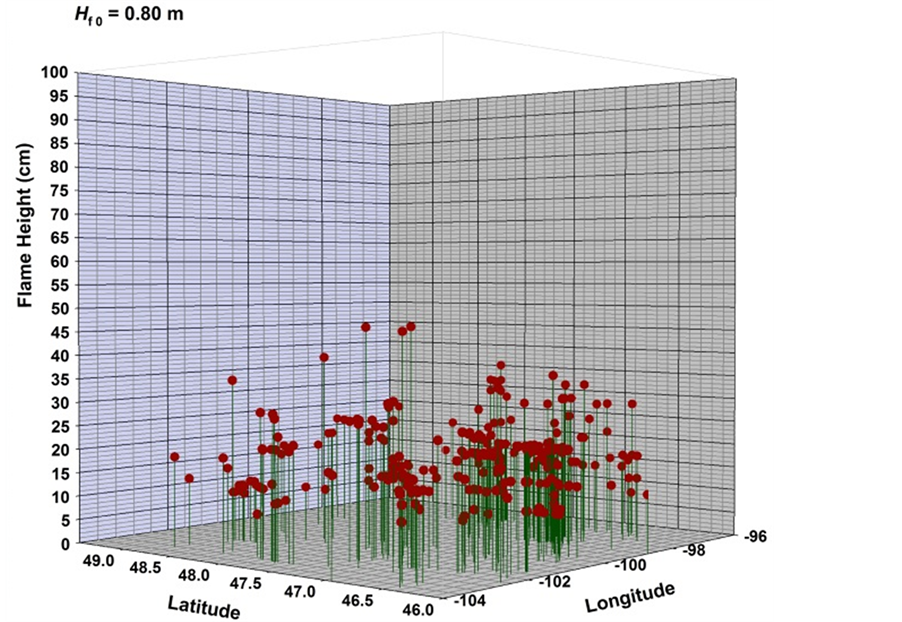 (d)
(d)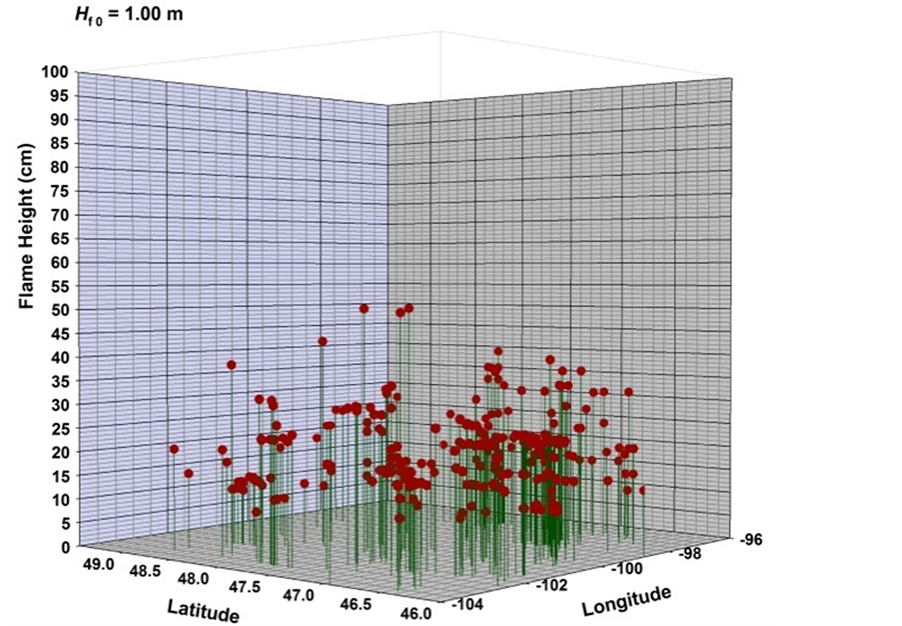 (e)
(e)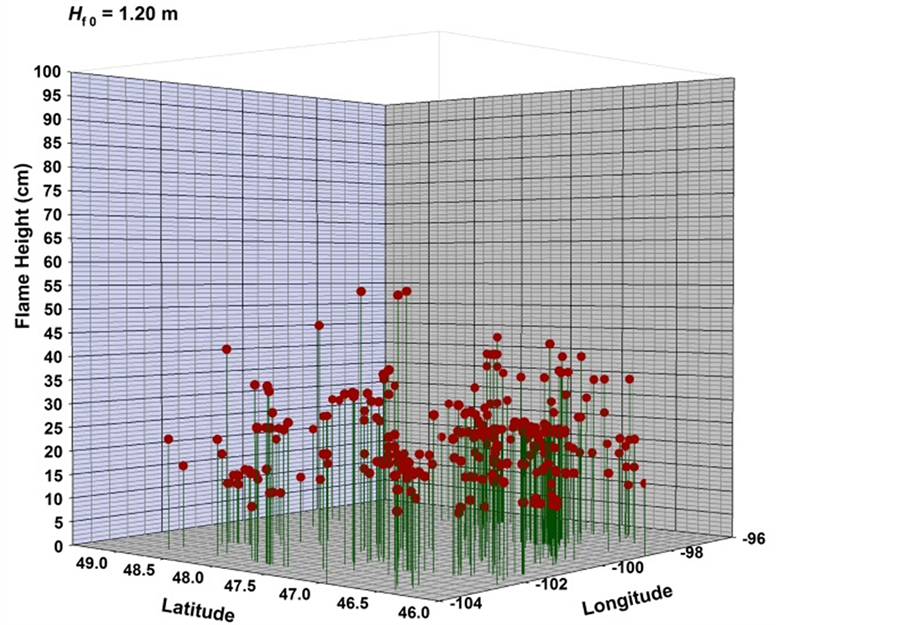 (f)
(f)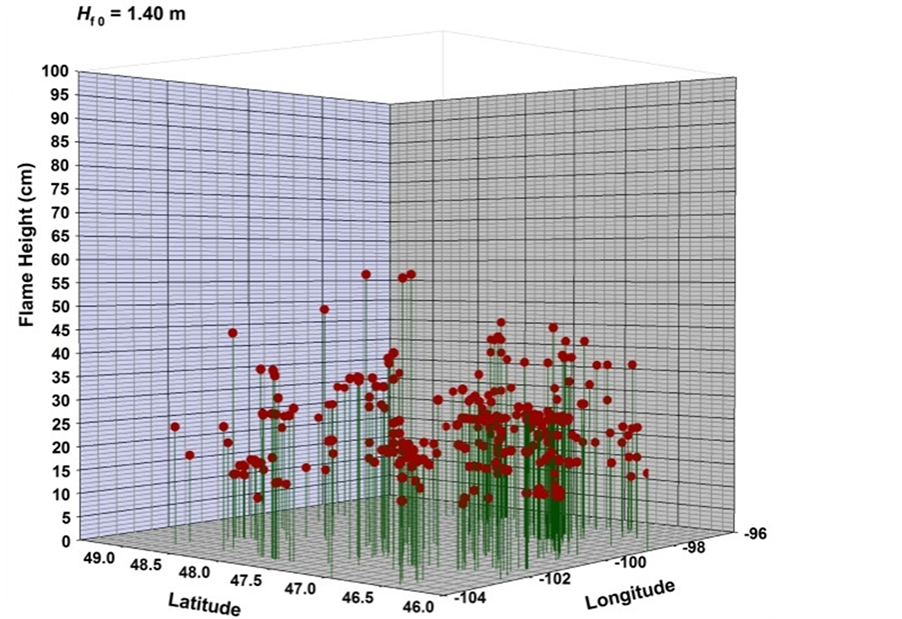 (g)
(g)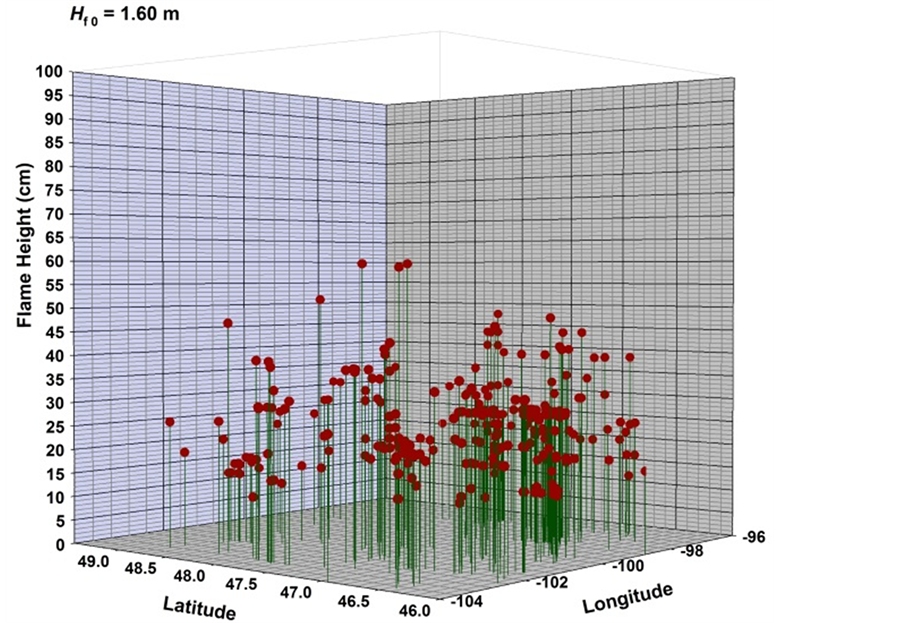 (h)
(h)
Figure 9. Graphs of flame heights for various values of .
.
 (a)
(a)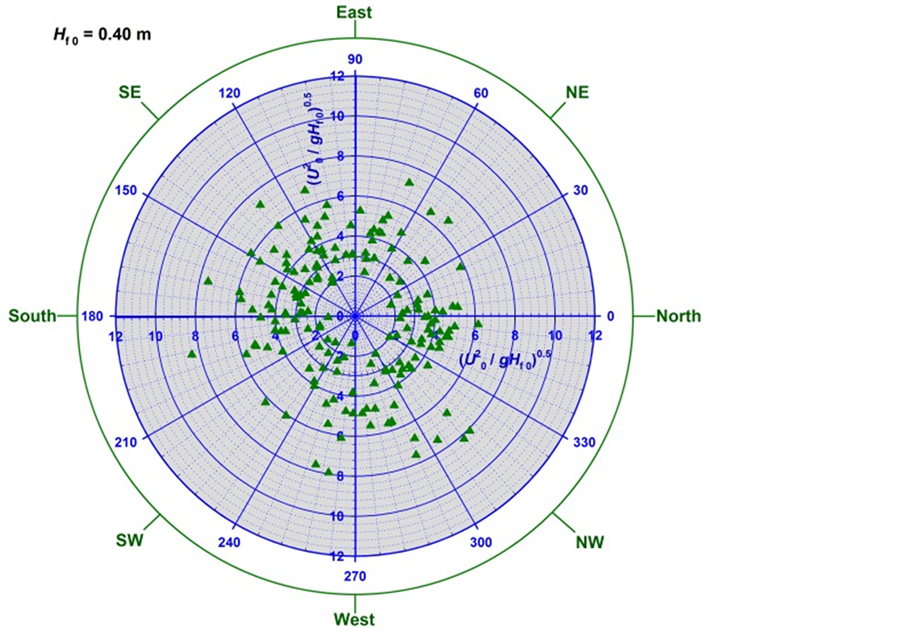 (b)
(b)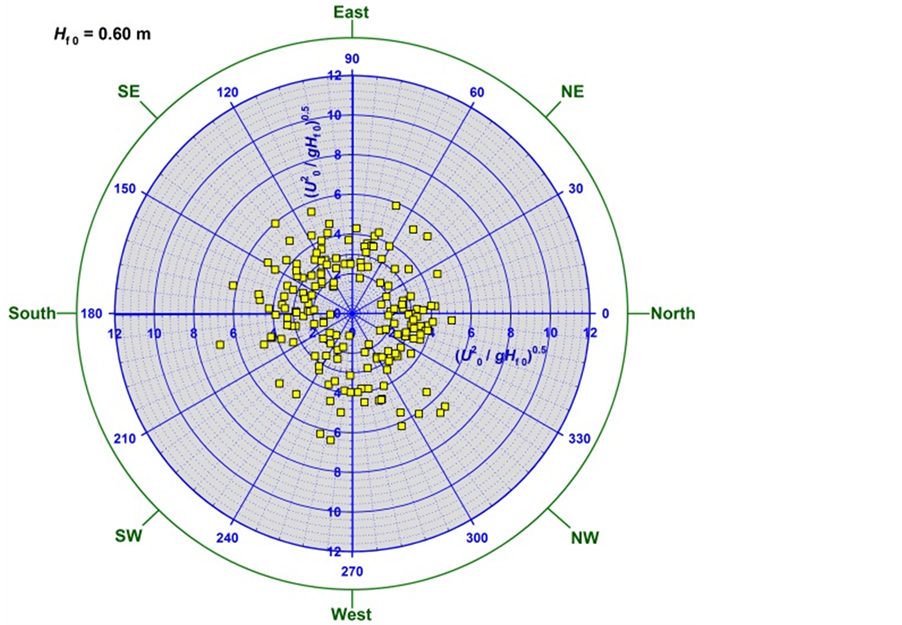 (c)
(c)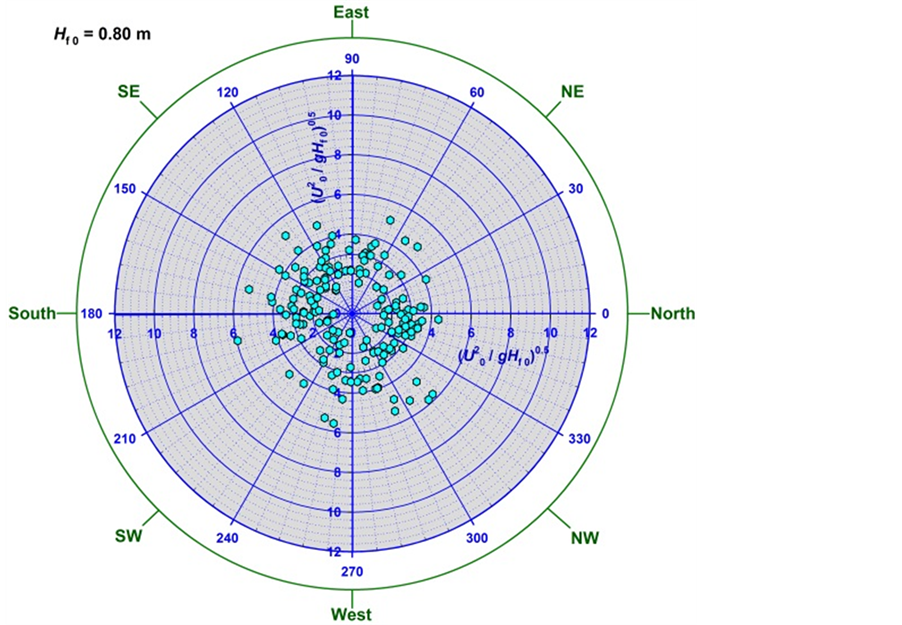 (d)
(d)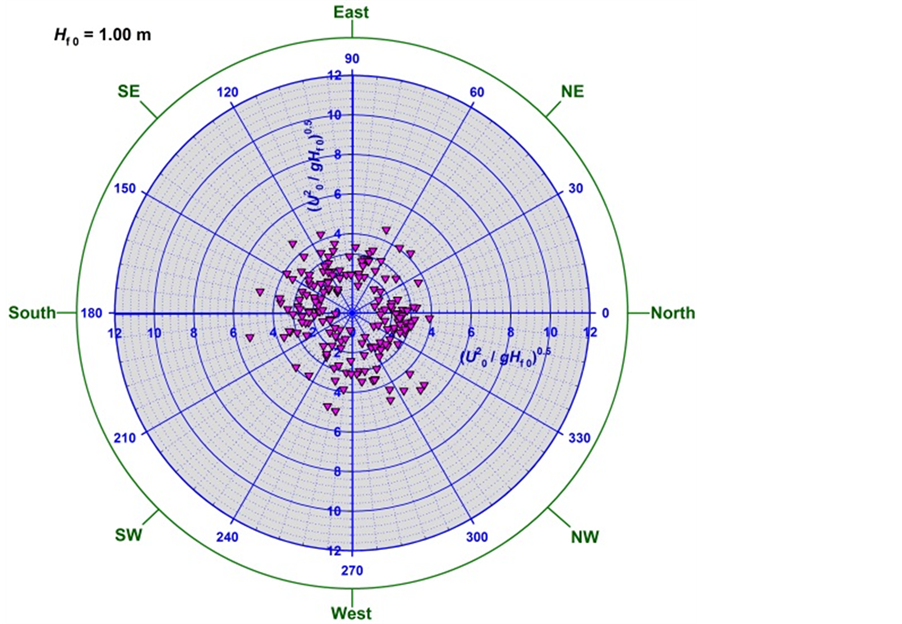 (e)
(e)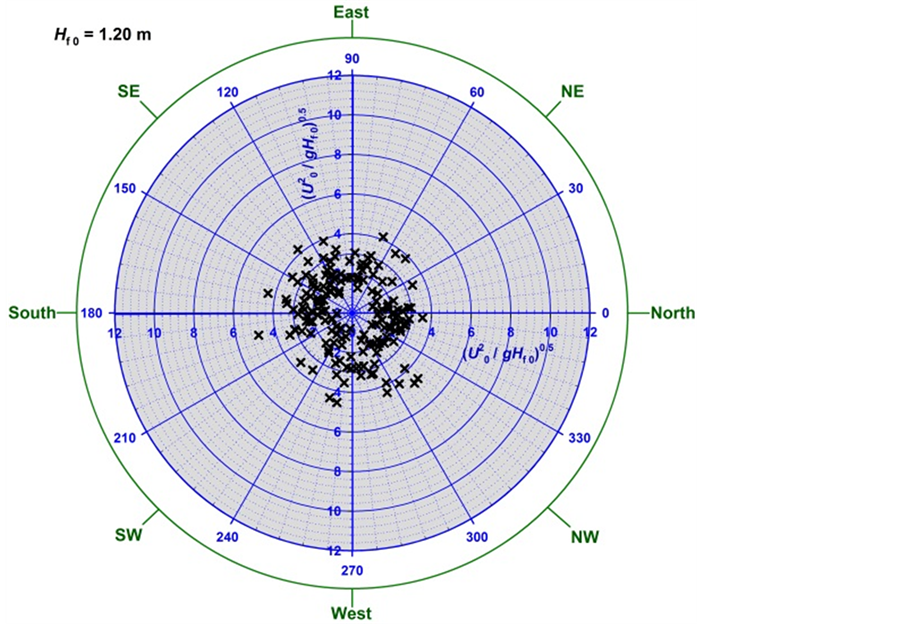 (f)
(f)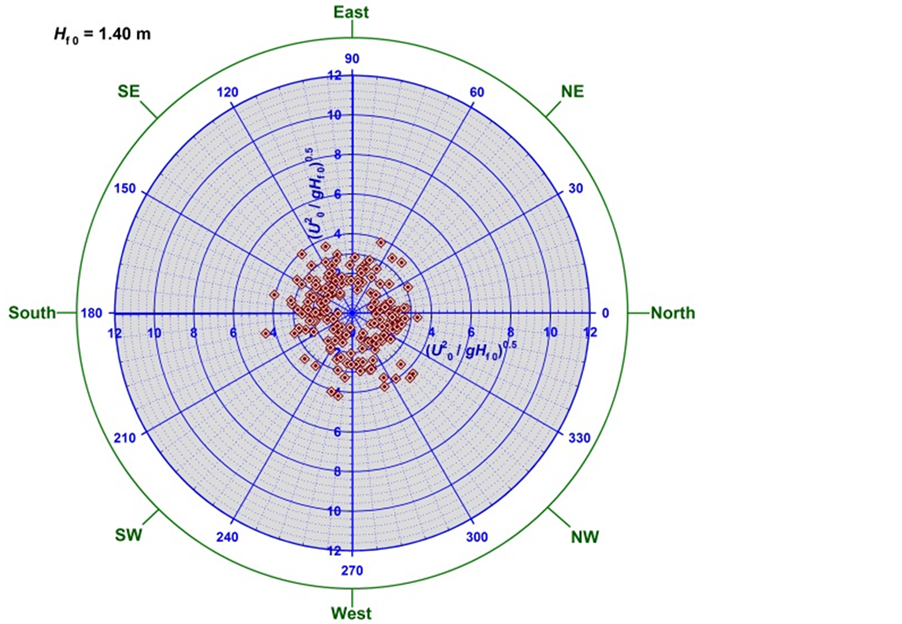 (g)
(g)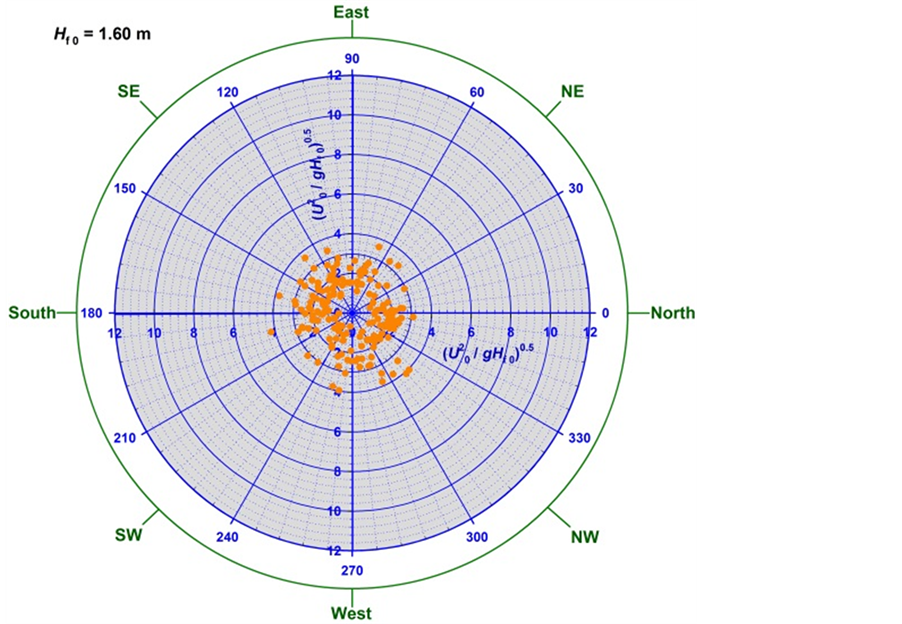 (h)
(h)
Figure 10. Polar plots depicting radial variation for  against prevailing wind direction on the angular axis for various
 ..
..
and plant species that will improve environmental health and quality. In the period, 2001-2002 areas that were under floodwaters can be seen transiting to other “absorbing” states, for example categories 2 to 7. Categories that exhibited significant changes between 1999-2001 include other crops, urban/developed areas, and woodland. Considering this subset of the state containing two of the major metropolitan areas, we can assess impacts of forest conversion. For example from the transition probabilities graphs (Figures 11(d)-(f)), woodland transition probabilities to urban/developed category are 0.0095 in 1999-2000, 0.0467 in 2000-2001 and 0.0411 for the full period 1999-2001. This trend is low probably due to most development on the eastern side of North Dakota is not significantly affecting predominant riparian forests that exist in this region. But again since this area is greatly affected by periodic flooding, for the time period 2000-2001, there were more instances of water category transiting to other states. Areas with grains, hay, seeds category almost displayed a uniform probability of staying unchanged over the three year period.
5. Conclusions
The goal of our research was to provide a systematic, quantitative and innovative tool that supports decision-makers in forestry management. The designed system can be used to access forest management program initiatives, especially where these programs are lacking. Furthermore, the system is an integral component in spatially displaying areas where the best forestry policies may achieve the best results. The ADSS was designed as an adaptive dynamic framework modularly constructed to optimize system capabilities and provide flexibility for future. The system provides for real-time assessment of information stemming forth from all affiliated entities. The system has a base stage deployed using ArcGIS Web services. Web applications and services utilizeconfigured authentication methods and a. NET security standard over HTTP with windows security systems recognition.
 (a)
(a) (b)
(b) (c)
(c) (d)
(d)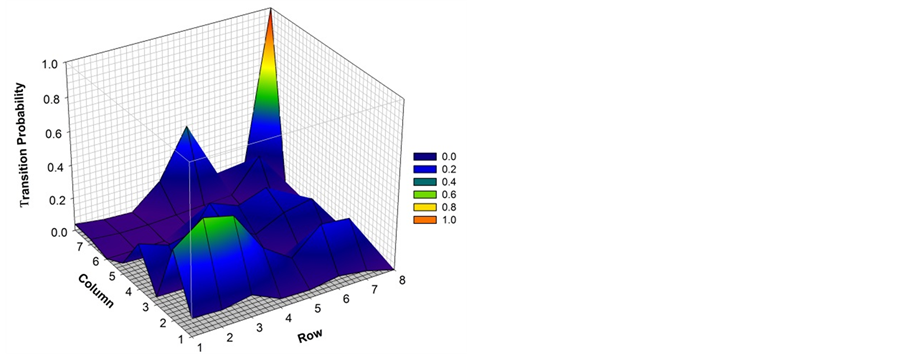 (e)
(e)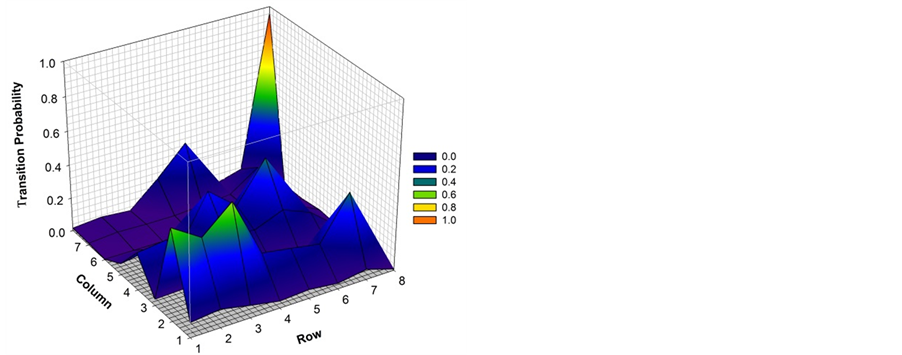 (f)
(f)
Figure 11. Percent area change for period (a) 1999-2000, (b) 2000-2001, (c) 2001-2002. Transition probabilities for period (d) 1999-2000, (e) 2000-2001, (f) 2001-2002.
From this ADSS a secure gateway for the delivery of North Dakota Spatial Analysis Project (SAP) derived data layers was designed. From this platform, resource information and key management variables can be retrieved, queried or catalogued over non-authenticated web browsers. The ADSS has arisen as a vital link of city, county, state and federal forestry reporting mechanism for NDFS and affiliated partners. For example, in the 2001 year alone, wild land fire reporting peaked at over 930 records marking a significant success. General public can utilize the system by querying multiple layers of records and as such decipher management accomplishments. Since the system also provides baseline data on other resources, for example, watersheds and geo-corrected hydrologic datasets, these can be utilized to secondarily address water quality issues or management opportunities identified through other resources.
Several resource management forms were incorporated into the ADSS, for example, the most intricate form designed was for tracking community accomplishments for urban and community forestry programs. Measurable outcomes include impact of forestry programs on local communities within each fiscal year, impact of professional advice offered to individuals or communities, and federal funding per capita amongst other deliverables. Other forms include wild land fire, innovation in State and Private Forestry, forestry assistance and accountability measures, forestry training programs, forest health, and an online chat. Integral to most of these forms are associated relative databases. The databases store retrievable pertinent information related to forestry resource management. Multi-faceted information can be retrieved from the system from current reports, filed reports or information that can be utilized in a myriad of possibilities.
Acknowledgments
The research reported in this paper was supported in part by US Department of Agriculture Forest Service award # 10-DG-11010000-011 and CFDA Cooperative Forestry Assistance # 10.664, North Dakota Forest Service, and by the North Dakota State University Department of Geosciences. The opinions expressed in this paper are solely those of the writers and are not necessarily consistent with the policies or opinions of the USDA, the USDA-Forest Service, North Dakota Forest Service, North Dakota State University, and/or CFDA.
References
- Easterbrook, S. (2003) Model Management and Inconsistency in Software Design. In: Sullivan, K., Ed., NSF Workshop on the Science of Design: Software and Software-Intensive Systems, NSF, Airlie Center, VA, 2.
- Chin, D.N. (1989) KNOME: Modelling What the User Knows in UC. In: Kobsa, A. and Wahlster, W., Eds., User Models in Dialog Systems, Berlin Springer-Verlag, 74-107. http://dx.doi.org/10.1007/978-3-642-83230-7_4
- Sprague, R.H. and Carlson, E.D. (1982) Building Effective Decision Support Systems. Prentice-Hall International Inc., London, 329pp.
- Stock, M.W. and Rauscher, H.M. (1996) Artificial Intelligence and Decision Support in Natural Resource Management. New Zealand Journal of Forestry Science, 26, 145-157.
- Chuang, T.T. and Yadav, S.B. (1998) The Development of an Adaptive Decision Support System. Decision Support Systems, 24, 73-87. http://dx.doi.org/10.1016/S0167-9236(98)00065-7
- Holsapple, C.W., Pakath, R., Jacob, V.S. and Zaveri, J.S. (1993) Learning by Problem Processors: Adaptive Decision Support Systems. Decision Support Systems, 10, 85-108.
http://dx.doi.org/10.1016/0167-9236(93)90032-X - Santos, B.L.D. and Holsapple, C.W. (1989) A Framework for Designing Adaptive DSS Interfaces. Decision Support Systems, 5, 1-11. http://dx.doi.org/10.1016/0167-9236(89)90024-9
- Klashner, R. and Sabet, S. (2007) A DSS Design Model for Complex Problems: Lessons from Mission Critical Infrastructure. Decision Support Systems, 43, 990-1013.
http://dx.doi.org/10.1016/j.dss.2005.05.027 - Krogsaeter, M., Oppermann, R. and Thomas, G.C. (1994) A User Interface Integrating Adaptability and Adaptively, In: Opper-mann R. (Ed.) Adaptive User Support: Ergonomic Design of Manually and Automatically Adaptable Software, Lawrence Erlbaum Associates Publishers, Hillsdale, NJ, 97-125.
- Norcio, A.Y. and Staley, J. (1989) Adaptive Human-Computer Interfaces: A Literature Survey and Perspective, IEEE Transactions on Systems. Man and Cybernetics, 19, 399-408.
http://dx.doi.org/10.1109/21.31042 - Tyler, S.W., Schlossberg, J.L., Gargan, R.A., Cook Jr., L.K. and Sullivan, J.W. (1991) An Intelligent Interface Architecture for Adaptive Interaction, In: Sullivan J.W., Tyler S.W. (Eds.) Intelligent User Interfaces, Addison-Wesley Publishing, Reading, MA, 85-109.
- Haugen, D.E., Kangas, M., Crocker, S.J., Perry, C.H., Woodall, C.W., Butler, B.J., Wilson, B.T. and Kaisershot, D.J. (2009) North Dakota’s Forests 2005. Resource Bulletin NRS-31. US Department of Agriculture, Forest Service, Northern Research Station, 82pp.
- Oduor, P.G., Kotchman, L., Nakamura, A., Jenkins, S. and Ale, G. (2012) Spatially Constrained Forest cover Dynamics Using Markovian Random Processes. Forest Policy and Economics, 20, 36-48. http://dx.doi.org/10.1016/j.forpol.2012.02.005
- Duncan, B.W., Shao, G. and Adrian, F.W. (2009) Delineating a Managed Fire Regime and Exploring Its Relationship to the Natural Fire Regime in East Central Florida, USA: A Remote Sensing and GIS Approach. Forest Ecology and Management, 258, 132-145.
http://dx.doi.org/10.1016/j.foreco.2009.03.053 - Stambaugh, M.C. and Guyette, R.P. (2008) Predicting Spatio-Temporal Variability in Fire Return Intervals Using a Topographic Roughness Index. Forest Ecology and Management, 254, 463-473. http://dx.doi.org/10.1016/j.foreco.2007.08.029
- Nmira, F., Consalvi, J.L., Boulet, P. and Porterie, B. (2010) Numerical Study of Wind Effects on the Characteristics of Flames from Non-Propagating Vegetation Fires. Fire Safety Journal, 45, 129-141. http://dx.doi.org/10.1016/j.firesaf.2009.12.004
- Kokkinos, E.A. and Maras, A.M. (1997) A First-Order Stationary Markov Class A Transition Density. Journal of Franklin Institute, 334, 525-537. http://dx.doi.org/10.1016/S0016-0032(96)00102-0
- Wu, Q., Li, H., Wang, R., Paulussen, J., He, Y., Wang, M., Wang, B. and Wang, Z. (2006) Monitoring and Predicting Land Use Change in Beijing Using Remote Sensing and GIS. Landscape and Urban Planning, 78, 322-333. http://dx.doi.org/10.1016/j.landurbplan.2005.10.002
- Yin, K.K., Yang, H., Daoutidis, P. and Yin, G.G. (2003) Simulation of Population Dynamics Using Continuous-Time Finite-State Markov Chains. Computers and Chemical Engineering, 27, 235-249. http://dx.doi.org/10.1016/S0098-1354(02)00179-5