Journal of Geographic Information System
Vol.6 No.1(2014), Article ID:42821,12 pages DOI:10.4236/jgis.2014.61002
Integration of Spatial Analysis for Tsunami Inundation and Impact Assessment
1Graduate School of Science and Engineering, Yamaguchi University, Ube, Japan
2Fisheries and Marine Science Faculty, Brawijaya University, Malang, Indonesia
Email: absambah@yahoo.com
Copyright © 2014 Abu Bakar Sambah, Fusanori Miura. This is an open access article distributed under the Creative Commons Attribution License, which permits unrestricted use, distribution, and reproduction in any medium, provided the original work is properly cited. In accordance of the Creative Commons Attribution License all Copyrights © 2014 are reserved for SCIRP and the owner of the intellectual property Abu Bakar Sambah, Fusanori Miura. All Copyright © 2014 are guarded by law and by SCIRP as a guardian.
Received December 25, 2013; revised January 25, 2014; accepted January 31, 2014
KEYWORDS
Spatial Analysis; GIS; AHP; Tsunami
ABSTRACT
Disaster mitigation and reconstruction plan due to tsunami can be implemented with various actions. An integration of spatial analysis through Geographical Information System (GIS) application and multi-criteria analysis through Analytical Hierarchy Process (AHP) is one of the methods for tsunami inundation and impact assessment. In this study, vulnerability, inundation and impact assessment due to tsunami hazard in Ofunato city, Iwate Prefecture, Japan was carried out. Appropriate input parameters were derived from Digital Elevation Model data, and satellite remote sensing and field data were analyzed through GIS. We applied the parameter of elevation and slope created from of Aster GDEM version 2, coastline distance created from vector map of the study area and vegetation density created from ALOS ANVIR-2 image. We applied AHP process for weighting the parameter through pair-wise comparison using five iterations of normalized matrix. Five classes of vulnerability were defined and analyzed for tsunami inundation mapping. We used weighted overlay through spatial analyst in GIS to create the final map of tsunami vulnerability. The assessment results indicate that 7.39 square kilometer of the study area was under the high vulnerability zone due to tsunami, and 8.13 square kilometer of building area was under the inundation area. Our result showed good agreement with the observed data and historical map. The result presented here can aid as preliminary information for the coastal zone management related to disaster mitigation and for the evacuation process and management strategy during disaster.
1. Introduction
Natural disaster including tsunami is the natural phenomena which is difficult to prevent. An initial assessment for vulnerability mapping due to disaster is one analysis that can be applied to reduce its impact. Tsunami vulnerability assessment is essential to disaster planning in the term of mitigation. It can provide preliminary information that important for tsunami disaster risk management plans. This includes pre-planning appropriate response activities in order to minimize the impact of disaster and all possibilities that will happen, and preparing and mitigating for the future events [1]. It can include mapping of evacuation routes and evacuation building, tsunami barriers construction, disaster risk management and regulation and disaster education for public.
In order to prepare those activities for effective implementation, the availability of reliable and accurate information concerning the spatial and temporal characteristics and impact of potentially damaging due to tsunami at different scales of magnitude is needed. Thus, a tsunami vulnerability analysis should be developed based on many parameters as possible to get a realistic description of vulnerability area in both spatial and temporal.
In addition to the hazard probability, exposure, and capacity measures, vulnerability is one of the parameters in determining disaster risk [2-4]. It can be defined as the degree to which a person, community or a system is likely to experience harm due to an exposure to an external stress. Vulnerability is described as a set of conditions and processes resulting from physical, social, economic and environmental factors that increase the susceptibility of a community to the impact of hazards [5,6].
The application of remote sensing and GIS made the possibilities in order to map the distribution of damage area due to disaster and to assess the vulnerability area. GIS through the spatial multi-criteria analysis helps in making a priority related to the decision making process using geo-reference data. In addition to the decision maker’s preferences related to a parameter evaluation, spatial multi-criteria analysis needs both information on criterion attributes and the geographical references [7,8]. Some previous work have applied GIS method for tsunami mapping and overlaid with official land-use map [9], and have analyzed tsunami risk using multi-scenario approach [10], and have analyzed the vulnerability using remote sensing data and integrated analysis using GIS to the physical built-up infrastructure, i.e. buildings, and identified the inundation area based on the contour and the highest recorded of tsunami event related to the building vulnerability and human vulnerability [1,11].
The aims of this study are to map the vulnerability area due to tsunami disaster and to assess its impact by mapping the possible inundation area due to tsunami by using GIS. The vulnerability was calculated based on elevation, slope, coastline distance and vegetation density. In terms of vegetation density, we tried to apply Soil Adjusted Vegetation Index (SAVI) instead of vegetation mapping using Normalized Difference Vegetation Index (NDVI). In addition, we also applied the Analytical Hierarchy Process for estimating weights of the parameters.
2. Materials and Methods
2.1. Data
The elevation data used in this study was obtained from The ASTER Global Digital Elevation Model (ASTER GDEM) version 2. The Advanced Space-borne Thermal Emission and Reflection Radiometer (ASTER) GDEM is a joint product developed and made available to the public by the Ministry of Economy, Trade, and Industry (METI) of Japan and the United States National Aeronautics and Space Administration (NASA). It is generated from data collected from a space-borne earth observing optical instrument, namely ASTER.
The ASTER GDEM covers the entire land surface of the Earth at high resolution. Version 2 of the ASTER GDEM is employing an advanced algorithm to improve global digital elevation resolution and elevation accuracy and reprocessing a total of 1.5 million scene data including additional 250,000 scenes acquired after the previous release. The data are posted on a 1 arc-second (approximately 30 m at the equator) grid [12].
We analyzed ALOS AVNIR-2 image for vegetation density mapping. Moreover, we used run up and inundation information of the 2011 Tohoku Earthquake which is recorded in the report book of detailed map of the impacts of the 2011 Japan tsunami in Miyagi Prefecture [13]. The step of analysis starts from data collection, surface analysis of DEM data, vector data processing, vegetation density mapping, AHP process and ends with raster overlay processing through GIS approach (Figure 1).
2.2. Study Area
The study area was Ofunato city in Iwate prefecture, Japan (Figure 2). This area is one of the areas affected by The 2011 Tohoku earthquake tsunami, which is the fourth huge earthquake that caused tsunami since 1900, besides the 1960 Chile Earthquake tsunami, the 1964 Alaska earthquake tsunami and the 2004 Sumatra earthquake tsunami [14].
The significant damage to city in previous event was in 1896, 1933 and 1960. In 2013, the city has an estimated population of 39,136. The total area is 323.28 square kilometer. Population residing in inundated area during the 2011 Tohoku Earthquake tsunami was 19,073. Ofunato faces the Pacific Ocean. Outside its bay, the warm and cold ocean currents meet. In this city, the prefectural government provides hazard mapping to the municipal government who then work with community groups to develop the evacuation maps and identify suitable places for refuge. In other hand there is limited illustration of evacuation routes on the maps [15].
2.3. Spatial Analysis
2.3.1. Elevation
Elevation data is one of the principal datasets required for the model to generate vulnerability and inundation of the tsunami. In order to derive a set of parameters that describe the physical vulnerability a digital elevation model was generated by elevation map using ASTER GDEM version 2 data. This data was downloaded from ASTER GDEM website (http://gdem.ersdac.jspacesystems.or.jp/).
We classified elevation into five classes of vulnerability based on the height of the surface. It describes that low elevation (in meter) of the surface will have high vulnerability to tsunami wave, as shown in Table 1. Vulnerability mapping based on elevation data describe that most of coastal area is in the slightly high class of vulnerability (Figure 3(a)).
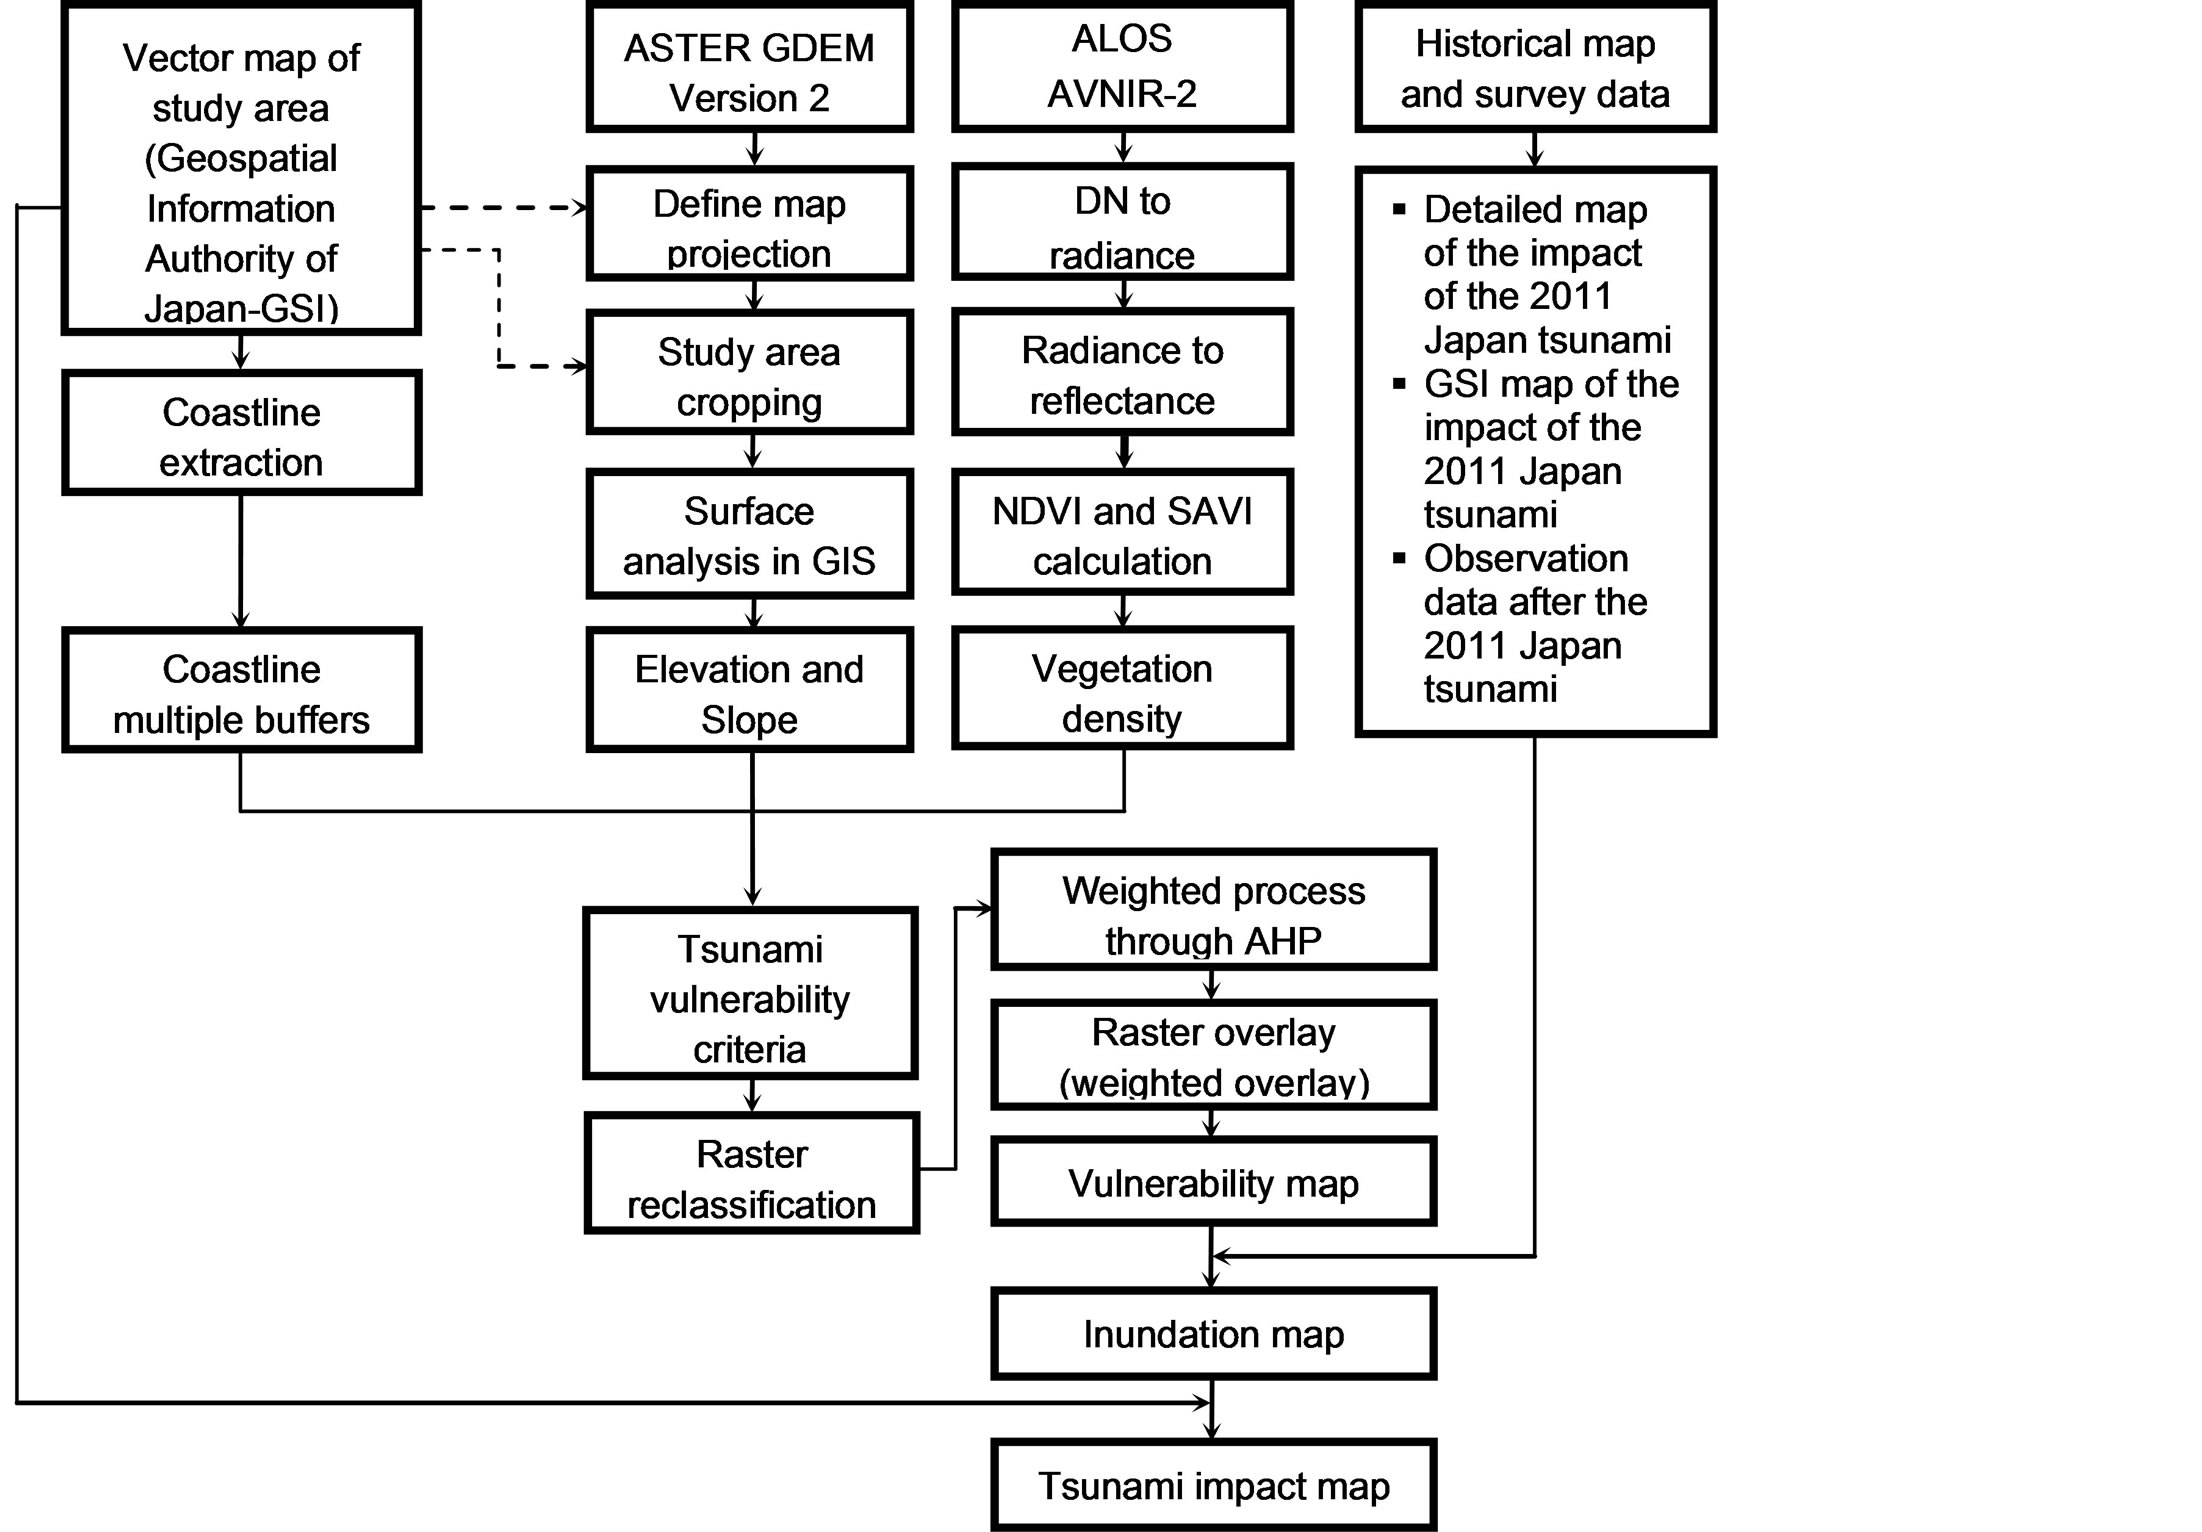
Figure 1. General framework of the study.

Figure 2. Map of study area.

Figure 3. Tsunami vulnerability map based on the parameter of (a) Elevation; (b) Slope; and (c) Coastline distance.

Table 1. Vulnerability class based on elevation [17], slope [18], and coastline distance.
2.3.2. Slope
Slope is the rate of maximum change in z-value from each cell of the image. We created slope map using the third-order finite difference method proposed by [16]. Slope percentages range from 0 to near infinity. A flat surface is 0 percent, and as the surface becomes more vertical, the slope percent becomes increasingly larger. Slope map was created from ASTER GDEM version 2. We classified slope map into five classes according to the value of tsunami vulnerability as described in Table 1. We applied slope classification based on tsunami vulnerability class through reclassify process to generate the vulnerability map (Figure 3(b)). High vulnerability areas based on slope was identified in the urban area close to the river in the southeast part of Ofunato.
2.3.3. Coastline Distance
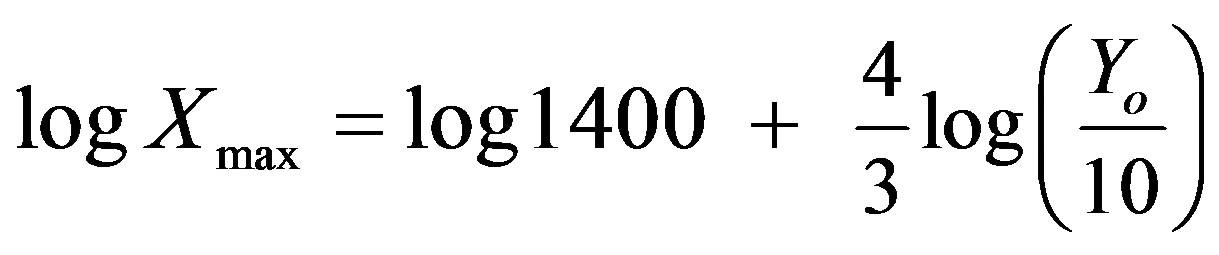
The calculation of the distance from coastline to the land using multi-buffering was done to divide area into five classes of vulnerability. The buffering distance was set based on the possibility range of the tsunami to reach the land. The distance is depend on the historical report of the maximum run up in the area of study, and is expressed by Equation (1) [9,19]:
 (1)
(1)
Xmax represents the maximum reach of the tsunami over land, and Yo is the tsunami height at the coast. Maximum run-up of Ofunato area based on The 2011 Earthquake Tsunami Joint Survey Group was 30.1 meter and minimum run up was 5.32. By using the algorithm above, we generated five range of coastline distance that vulnerable to the tsunami as shown in Table 1. We applied coastline distance in vector map of Ofunato through GIS processing to generate vulnerability map based on coastline distance (Figure 3(c)).
2.4. ALOS AVNIR-2 Image Processing
We tried to use SAVI for vegetation density mapping. The digital numbers of ALOS AVNIR-2 were converted to reflectance values before generating the synthetic NDVI and SAVI image [20,21]. The steps to create vegetation density map as follows.
2.4.1. Reflectance Calculation
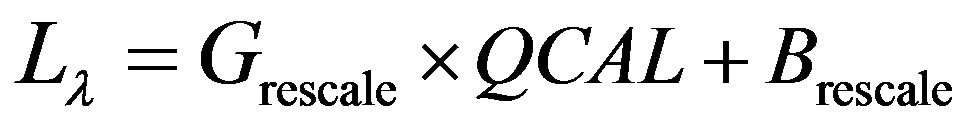
Radiance convertion from digital number values is needed before generating reflectance. Calculation of radiance is the fundamental step in relating image data from multiple sensors and platforms into a common radiometric scale [22]. The general equation for DN to radiance conversion as in Equation (2) [23]
 (2)
(2)
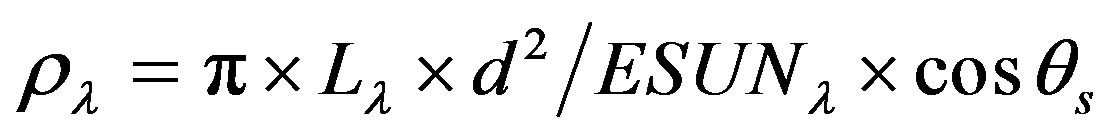
Ll is spectral Radiance at the sensor’s aperture (W/m2/sr/μm), Grescale is rescaled gain, QCAL is Digital Number (DN), and Brescale is rescaled bias. Moreover, Equation (3) was used to convert radiance to reflectance [24]:
 (3)
(3)
ρl is unitless planetary reflectance, Ll is spectral radiance at the sensor’s aperture, d2 is earth-sun distance in astronomical units from nautical handbook, ESUNl is mean solar Exoatmospheric irradiances, and qs is solar zenith angle in degrees.
2.4.2. NDVI Calculation
The principle behind NDVI is that channel 1 is in the red-light region of the electromagnetic spectrum where chlorophyll causes considerable absorption of incoming sunlight, whereas channel 2 is in the near-infrared region of the spectrum where a plant’s spongy mesophyll leaf structure creates considerable reflectance. Consequently, dense vegetation shows up very strongly in the imagery where red spectrum reflectance is low and in contrast high near infrared reflectance [25-27].
NDVI is a measure of the difference in reflectance between these wavelength ranges that takes values between −1 and 1, with values 0.5 indicating dense vegetation and values < 0 indicating no vegetation including water. NDVI was estimated using Equation (4) [28]
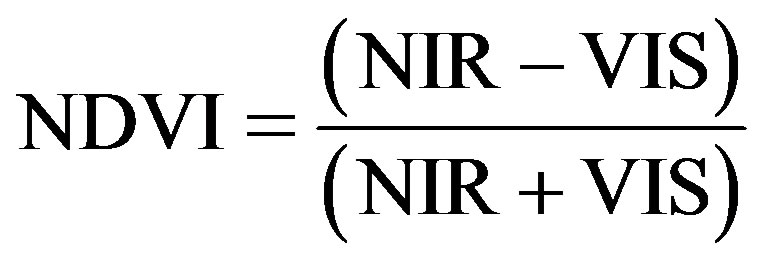 (4)
(4)
NIR is Near Infra-Red band, and VIS is visible band of red band. ALOS AVNIR-2 band 3 is red and band 4 is NIR.
2.4.3. SAVI Calculation
SAVI is one of the algorithms developed to generate vegetation index by eliminating soil factor [29]. Although SAVI model is not significant in the intra-class analysis, in the similar spectral space, this model presents a reasonable performance in the characterization of forested and non-forested areas [21]. Atmospheric influences lower the NDVI of vegetated areas whereas dark or wet soil backgrounds increase the NDVI for given vegetation canopy [30]. SAVI was developed to minimize soil brightness, including shadow, influences found in the NDVI by accounting for first-order soil-vegetation spectral interactions as in Equation (5) [31].
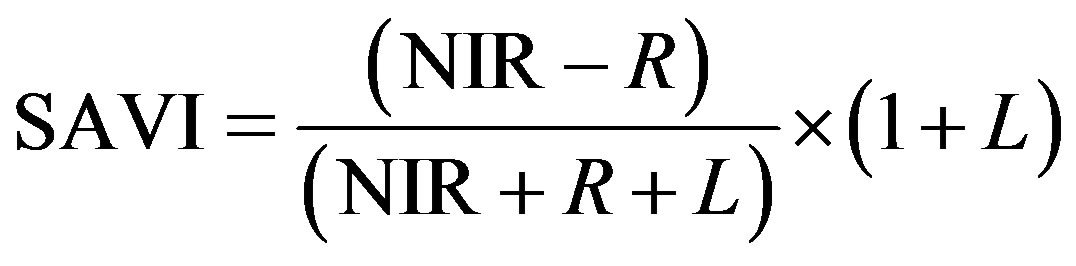 (5)
(5)
NIR is Near Infra-Red band, R is red band, and L is soil calibration factor, in which L equal to 0.5 [32]. A correction factor (L) was used to minimize the secondary backscattering effect of canopy transmitted-soil background reflected radiation. L value of 1 was optimal in semiarid environments. SAVI map is shown in Figure 4(a).
SAVI map was used to map the vegetation coverage. The image was used to identify the density of vegetation and to map vulnerability area of tsunami. We assumed that this area is more vulnerable to tsunami attack than another area. Vegetation density of SAVI describes the minimum value was −0.22, while the maximum was 0.38. We reclassify SAVI value to generate the vegetation density map in five classes (low, slightly low, medium, slightly high and high density) as shown in Figure 4(b), which then will be classified based on tsunami vulnerability. We assumed that low density of vegetation has a high vulnerability to tsunami. The result of this classification as shown in Figure 4(c). The lowest value of vegetation index found in the coastal area of Ofunato where indicated as building, bare soil, rocky land and water body.
3. Results
3.1. AHP Processing
All parameters were in grid cells which are then classified into five classes of vulnerability. For the vulnerability classes we used integer numbers of 1, 2, 3, 4, and 5 that represent low, slightly low, medium, slightly high and high vulnerability. We then overlay the entire parameter of tsunami vulnerability by using weighting and scoring system. Scoring is intended to assess the limiting factor on each parameter, while weighting is based on the dominant influence of these parameters in determining the class of tsunami vulnerability.
We applied AHP in assigning weights to each of the parameters. By applying pair-wise comparisons, AHP helps in creating a scaled set of preferences and describing the importance of each parameter relative to other parameter [33-35]. AHP allows the investigators in assessing the vulnerability related to the natural hazard. A number of 1 until 9 as shown in Table 2 is used in
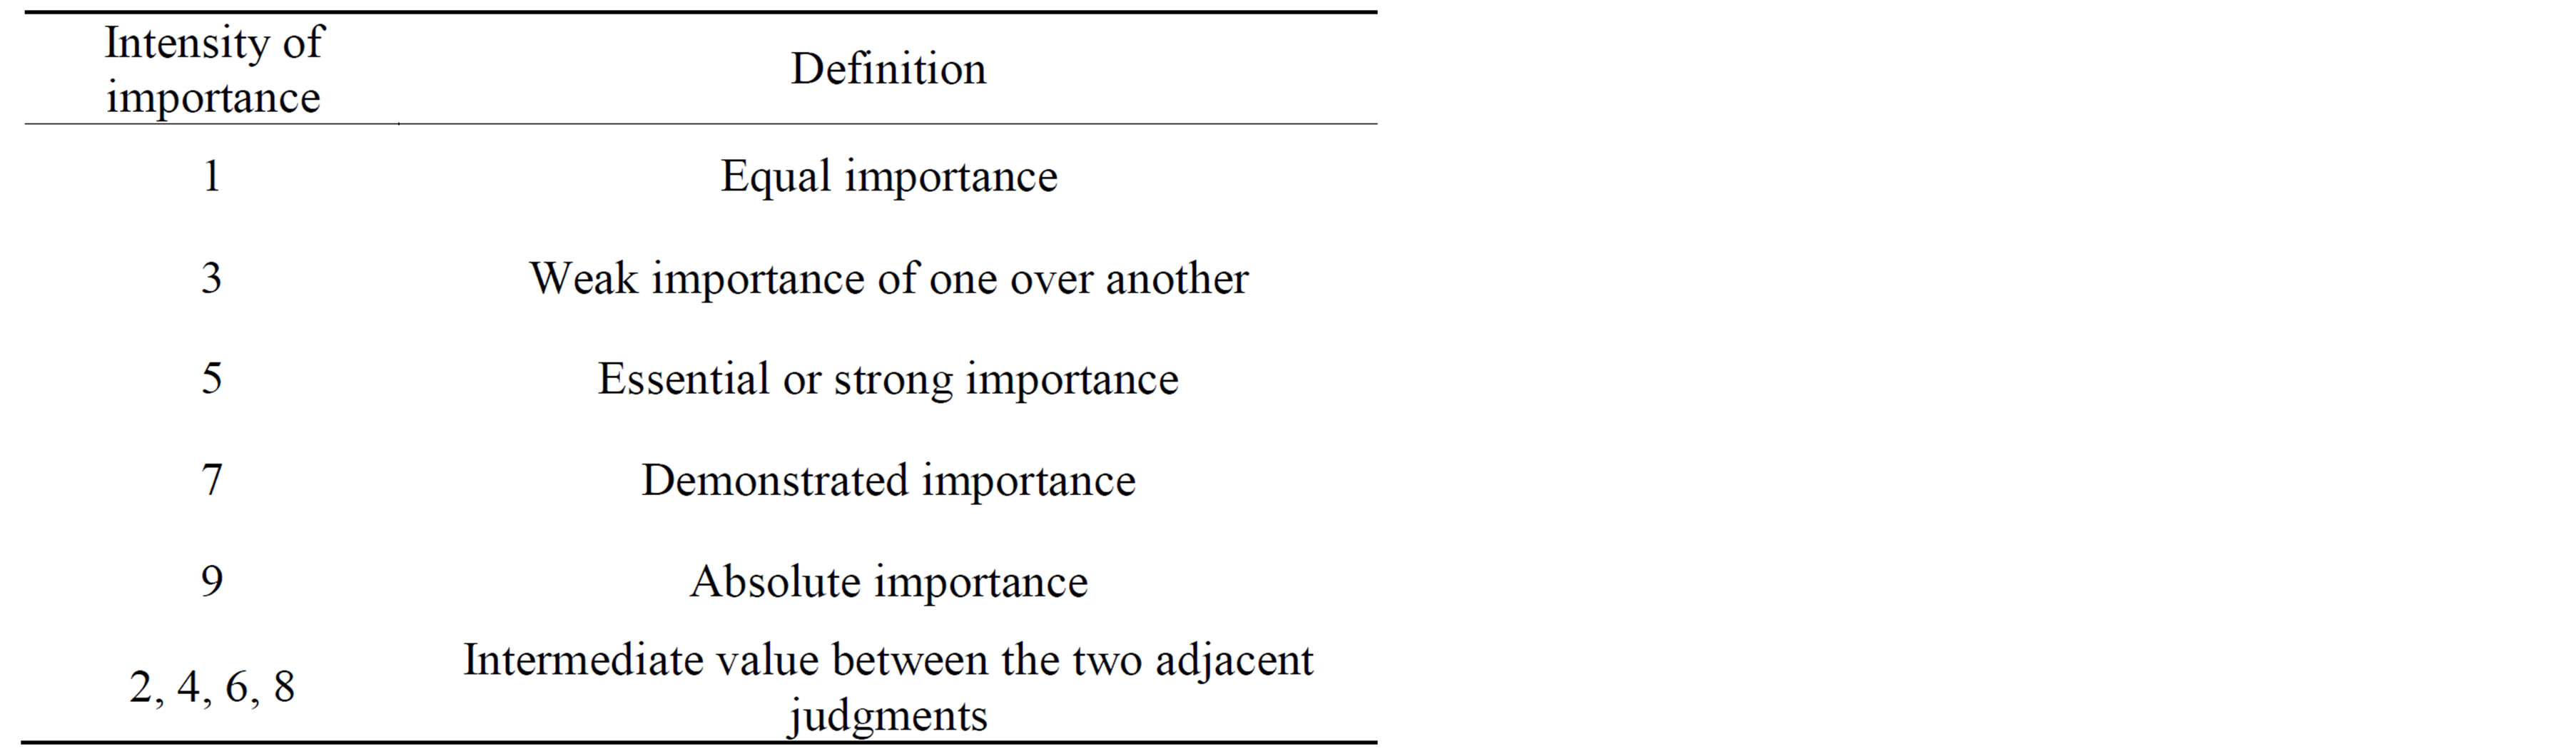
Table 2. Nine-point comparison scale by Saaty [37].
comparison scale to create pair-wise comparison matrix. This number is depends on the relative importance of each parameter. The relative weights of each parameter will be produced through pair-wise comparison as shown in Figure 5.
The calculation of consistency level is needed prior to the spatial analysis. Consistency Ratio (CR) is a procedure for determining the index of consistency. It indicates the probability that the matrix judgments were randomly generated [33]. AHP tolerates inconsistency through the calculation of consistency ratio. Acceptable consistency ratio is less than or equal to 10 percent [36]. CR is the ratio between the consistency index (CI) and random consistency index (RI) and can be expressed using Equation (6).
 (6)
(6)
lmax represents the largest eigenvalue, and N the size of comparison matrix. In this study N = 4. lmax is calculated from the sum of all parameter which is then multiplied by its eigenvector. RI is based on the random consistency index (RI = 0.09 for four parameters).
Normalized matrix as shown in Figure 5 was calculated from the pair-wise comparison in five iterations, and it shows that CI was 0.057, while CR was 6.4%. The pair-wise comparison describes that elevation is the most important factors followed by slope, coastline distance, and vegetation density.
3.2. Spatial Analysis for Vulnerability Mapping
After creating the parameter maps, we applied weighted overlay through spatial analyst in GIS. The weighted overlay tool applied to solve multi criteria problems. It is a method for applying a common scale of values to diverse input parameters which have different importance for creating an integrated analysis. The general step of this process as shown in Figure 6(a).
A number of 1 (low vulnerability) to 5 (high vulnerability) was used to represent vulnerability classes. Then we calculated the statistics of vulnerability map. The
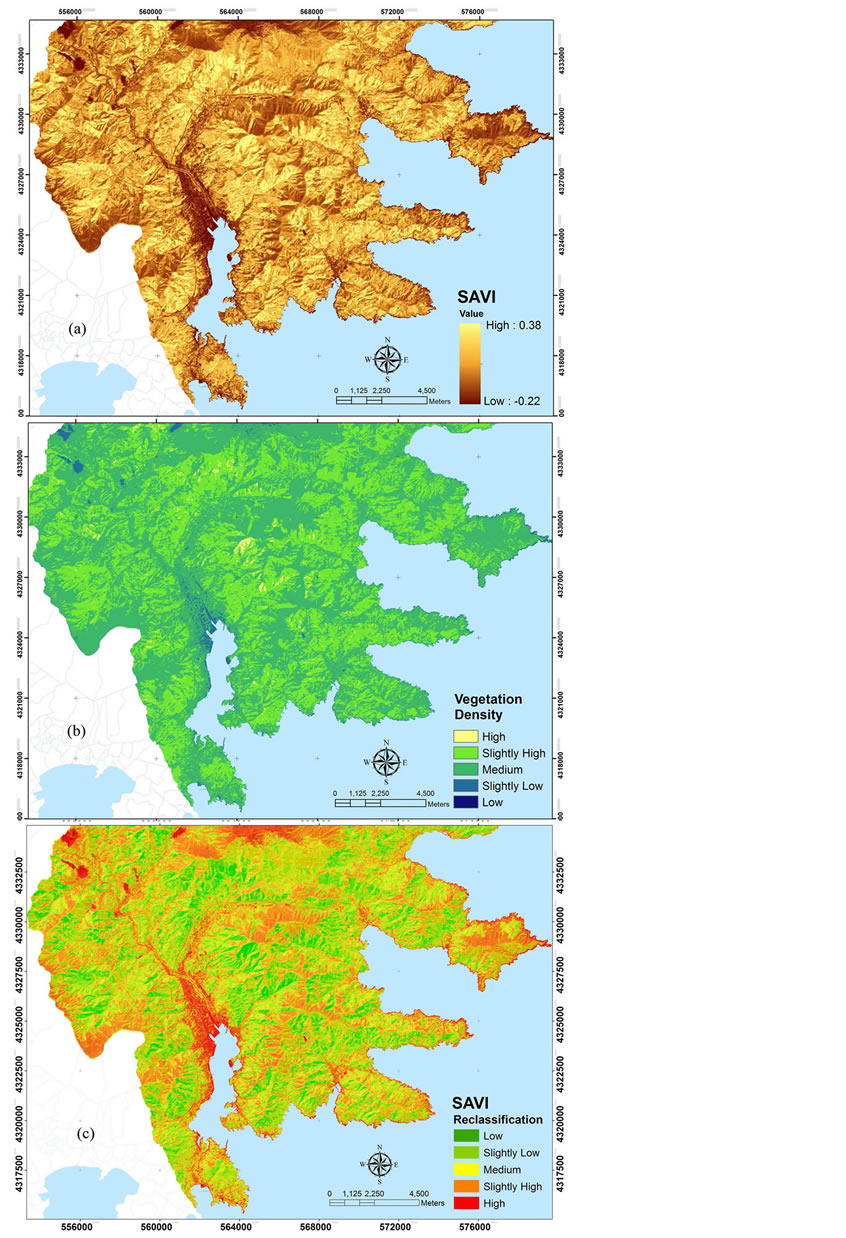
Figure 4. (a) SAVI map; (b) Vegetation density; and (c) Vulnerability map based on vegetation density.
vulnerability classes as shown in Table 3 was created using the subtraction of maximum and minimum value and divided by number of class. Subsequently tsunami vulnerability in five classes is mapped (Figure 6(b)).
3.3. Tsunami Inundation and Impact Assessment
We compared our result to the survey data from Joint Survey Group of the 2011 Tohoku Earthquake, the existing map of tsunami inundation area due to the 2011 Tohoku Earthquake published by Geographical Survey Institute (GSI) Japan (Figure 7), and detailed map of the impacts of the 2011 Japan tsunami, vol. 1: Aomori, Iwate and Miyagi Prefecture [13].
The comparison describes that most of inundation area was occurred in the area of high and slightly high vulnerability with an area of 1.10 square kilometer and 6.29 square kilometer. Based on these areas we estimate that total area of the possibility of inundation is 7.39 square kilometer (Figure 8(a)), while the inundation area due to due to 2011 Tohoku earthquake based on GSI report is 8 square kilometer. Maximum run-up of Ofunato area based on The 2011 Earthquake Tsunami Joint Survey Group was 30.1 meter and found in the area of Shirahama Sanrikucho Ryori. Minimum run up was 5.32 meter at the area of Sakaricho. This area is identified as the high vulnerability area. We estimated that inundation area will cover 8.13 square kilometer of building area along coastal area of Ofunato (Table 4 and Figure 8(b)).
Inundation area as shown in Figure 8(a) describe that the farthest area of inundation could reach until 3.5 kilometer from coastline. In this area, the elevation was 12

Figure 5. Pair-wise comparison and normalized matrix.
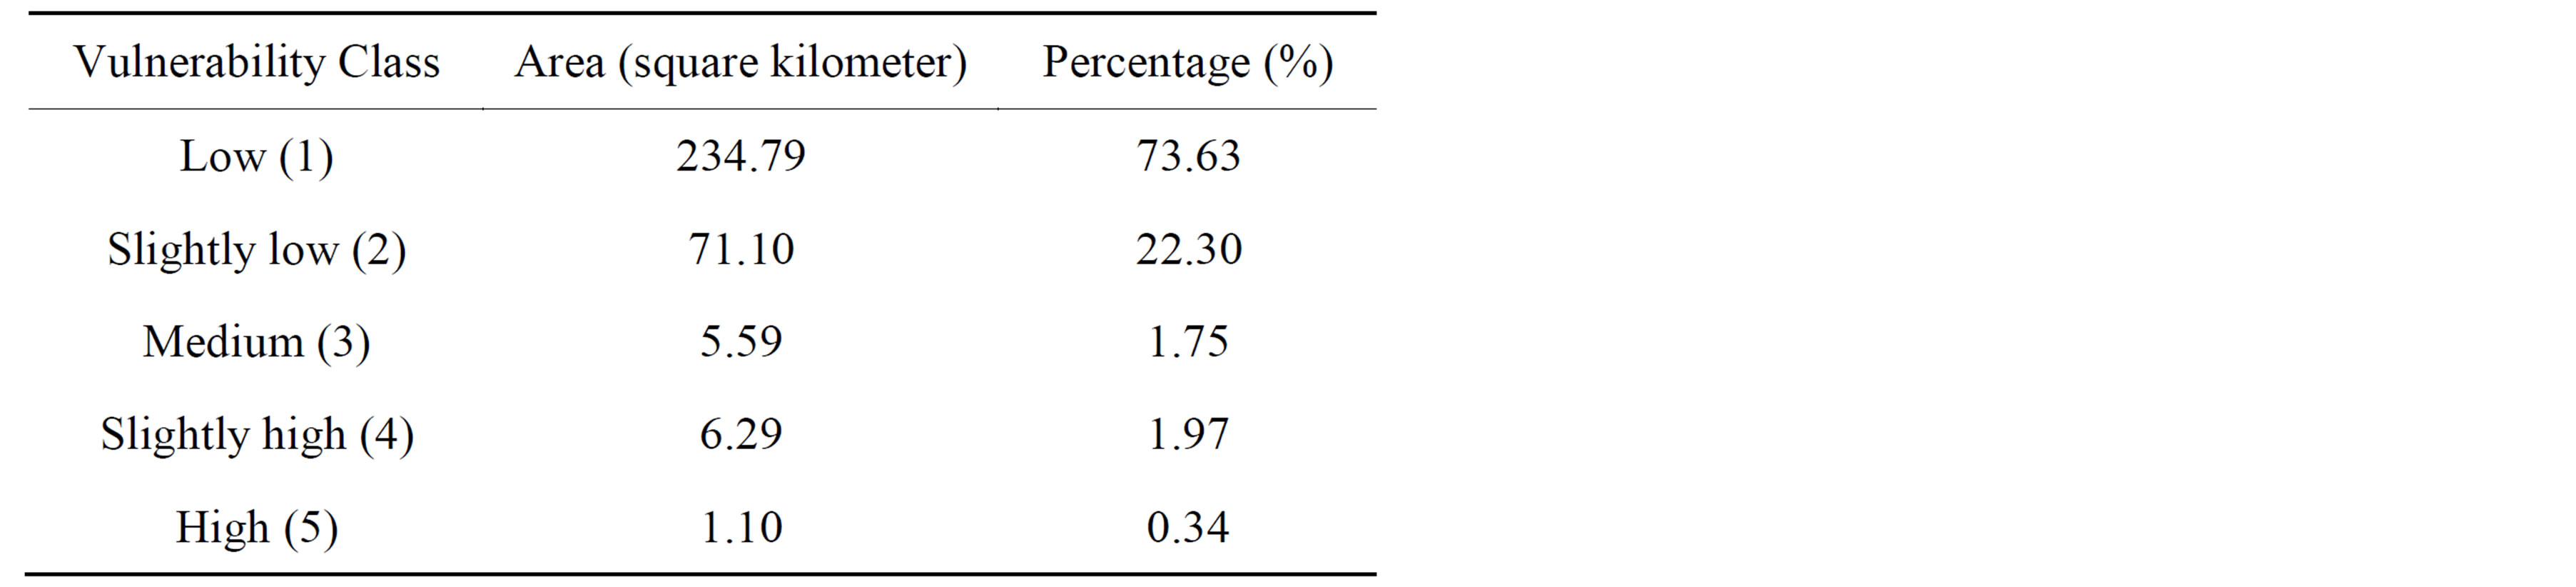
Table 3. Vulnerability classes.

Table 4. Vulverability class of building area.
meter, while reflectance value was 0.13, and SAVI was 0.05. Elevation map created from ASTER GDEM version 2 describes that the highest elevation in the inundation area is 20.5 meter.
4. Discussion
Vulnerability is related to the capacity to reduce the impact of disaster and mitigation plan. It describes the potential area to be damaged by natural disasters. Class of vulnerability could be based on a physical parameter, such as elevation, slope, coastline distance, land cover and coastal shape. Moreover, inundation can be defined as the result of a tsunami traveling a long distance inland and is a horizontal measurement of the path of the tsunami. The analysis of satellite image, elevation data, and survey data followed by multi-criteria analysis through AHP and raster overlay in GIS processing can be used as the basic information for vulnerability mapping, inundation mapping, and impact assessment due to tsunami disaster.
The use of AHP method helps in the analysis of spatial multi-criteria where all of the parameters used in this study were calculated based on its weight factor to create vulnerability map. This study is a first attempt to assess tsunami vulnerability by using the parameter of SAVI besides elevation, slope and coastline distance, and apply AHP methods combining with raster overlay through GIS processing in Ofunato area, Japan. According to the result of this study, a simple method for inundation prediction can be a valuable step for carrying out a prelimnary tsunami vulnerability mapping and impact assessment when the high resolution of DEM data and detailed topographic data is not available.
Elevation is the parameter that has the highest weight and 2.31% of the area that identified as slightly high and high class of tsunami vulnerability found in the coastal area which has a lower elevation. Most of the area is highly developed areas with low vegetation density. Tsunami vulnerability map and inundation map generated in this study can be used for determining a priority for risk prevention, mitigation, and land-use planning to reduce the tsunami risk. Particularly, in the slightly high and high vulnerability area that can be identified as possible inundation area describe that 11.85% of building area has potential consequences of a tsunami impact.
In this research, five classes of vulnerability were used.

Figure 6. (a) Spatial analysis step; (b) Tsunami vulnerability map of Ofunato area.
Vulnerability map describes that 73.63% of the area is low vulnerability, 22.30% is slightly low vulnerability, 1.75% is medium, 1.97% is slightly high vulnerability, and 0.34% is high vulnerability. The high vulnerability areas were mostly found in the coastal area with the sloping coast type. Inundation areas were predicted in areas that identified as high vulnerability and slightly high vulnerability area. In addition, we assumed that vegetation may play an important role as tsunami barriers to reduce the impact of the tsunami destruction. Based on the vegetation density that created from SAVI value in the study area, we found that 52.09% of the inundation area was in slightly low class of vegetation density and 34.05% of the inundation area was in medium class of
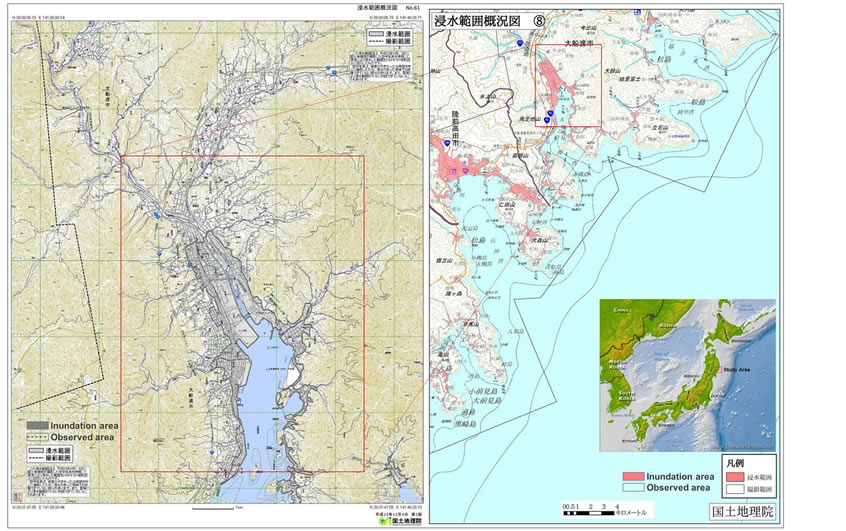
Figure 7. Inundation map of Ofunato during the 2011 Japan Tsunami, published by GSI [38] (modified).
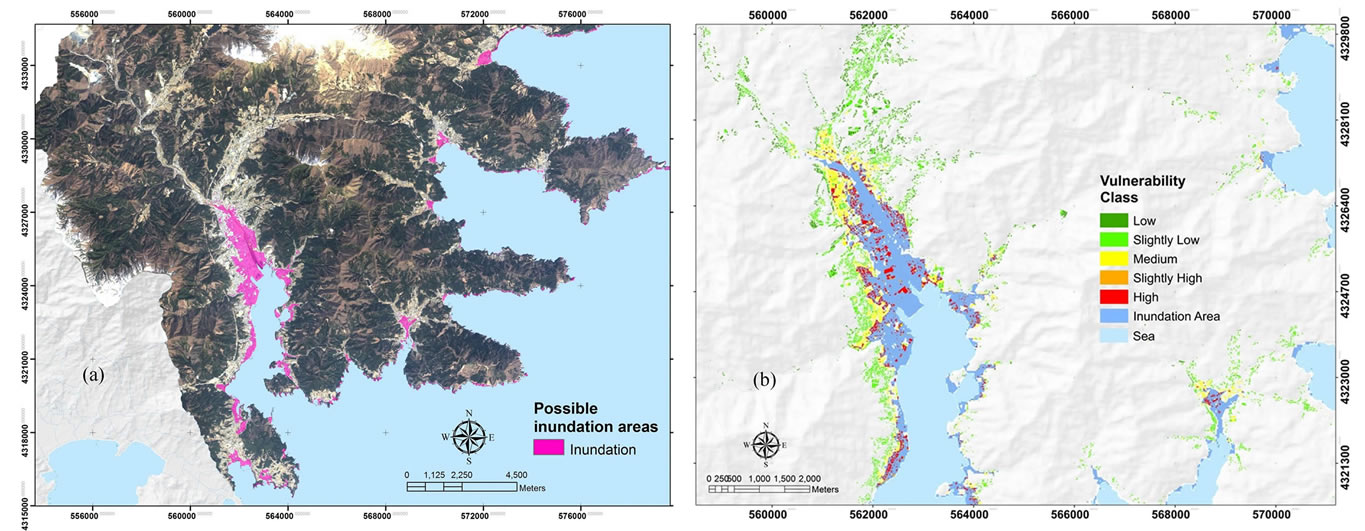
Figure 8. (a) Map of possible inundation area in ofunato; (b) Tsunami vulnerability class of building area in Ofunato.
vegetation density.
5. Conclusions
GIS application followed by satellite image processing and AHP approach is useful for tsunami vulnerability mapping and impact assessment. It can be used for the evacuation and reconstruction plan due to tsunami disaster. GIS indicate the vulnerability area due to tsunami and describe the possibility area that could be affected by tsunami wave. In this study we applied four parameters in order to create a tsunami vulnerability map and to predict the possibility of inundation area in the area of Ofunato. The vulnerability map showed that most of the coastal areas are vulnerable to tsunami. Most of buildings area and bare land along coastal area was in the high vulnerability of tsunami. The inundation pattern as the result of this study shown similar compared to inundation area of the 2011 Tohoku Earthquake in the area of Ofunato. ASTER GDEM version 2 is useful for tsunami vulnerability mapping for the area where the high resolution of DEM data is not available. Building and residence area in potentially affected areas should be provided with basic information on tsunami risk because awareness and preparedness are the most important factors to reduce potential losses due to a tsunami impact.
For the application in mitigation plan, we recommend to the user to be aware of the assumptions made, as well as the limitations within this study. Better mapping of tsunami vulnerability can be done by adding other appropriate parameters. The parameters of coastal type, relative direction of tsunami, and coastal bathymetry can be used. Moreover, the use of other DEM data, vulnerability mapping in other location and overlaying the vulnerability map with the current land use map will be a future works.
Acknowledgements
Aster GDEM version 2 is a product of METI and NASA. The authors would like to thank the Japan Aerospace Exploration Agency (JAXA) for the ALOS images and GSI for providing the base map of the study area. Authors are thankful to the 2011 Tohoku Earthquake Tsunami Joint Survey for the survey data in the study area. We also thank to Indonesia Directorate General for Higher Education for the scholarship and Yamaguchi University Japan for research support.
REFERENCES
- M. Papathoma and D. Dominey-Howes, “Tsunami Vulnerability Assessment and Its Implications for Coastal Hazard Analysis and Disaster Management Planning, Gulf of Corinth, Greece,” Natural Hazards and Earth System Sciences, Vol. 3, No. 6, 2003, pp. 733-747. http://dx.doi.org/10.5194/nhess-3-733-2003
- United Nations Disaster Relief Coordinator (UNDRO), “Mitigation Natural Disasters: Phenomena, Effects and Options, a Manual for Policy Makers and Planners,” United Nations Publication, New York, 1991.
- M. Pelling, “The Vulnerability of Cities: Natural Disasters and Social Resilience,” Earthscan Publications, London, 2003.
- C. Bollin, C. Cardenas, H. Hahn and K. S. Vatsa, “Natural Disaster Network; Disaster Risk Management by Communities and Local Governments,” Inter-American Development Bank, Washington DC, 2003. http://www.iadb.org/sds/doc/GTZ%2DStudyFinal.pdf
- P. Schmidt-Thome (Editor), “Natural and Technological Hazards and Risks Affecting the Spatial Development of European Regions,” Special Paper 42, Geological Survey of Finland, 2006.
- R. S. Mahendra, P. C. Mohanty, H. Bisoyi, K. T. Srinivasa and S. Nayak, “Assessment and Management of Coastal Multi-Hazard Vulnerability along the Cuddaloree Villupuram, East Coast of India Using Geospatial Techniques,” Ocean & Coastal Management, Vol. 54, No. 4, 2011, pp. 302-311. http://dx.doi.org/10.1016/j.ocecoaman.2010.12.008
- S. J. Carver, “Integrating Multi-Criteria Evaluation with Geographical Information Systems,” International Journal of Geo-Information System, Vol. 5, No. 3, 1991, pp. 321-339.
- P. Jankowski, “Integrating Geographical Information Systems and Multiple Criteria Decision Making Methods,” International Journal of Geo-Information System, Vol. 9, No. 3,1995, pp. 251-273.
- T. P. T. Sinaga, N. Adhi, Y.-W. Lee and S. Yongcheol, “GIS Mapping of Tsunami Vulnerability; Case Study of the Jembrana Regency in Bali, Indonesia,” KSCE Journal of Civil Engineering, Vol. 15, No. 3, 2011, pp. 537-543. http://dx.doi.org/10.1007/s12205-011-0741-8
- G. Strunz, J. Post, K. Zosseder, S. Wegscheider, M. Muck, T. Riedlinger, H. Mehl, S. Dech, J. Birkmann, N. Gebert, H. Harjono, H. Z. Anwar, Sumaryono, R. M. Khomarudin and A. Muhari, “Tsunami Risk Assessment in Indonesia,” Natural Hazards and Earth System Sciences, Vol. 11, No. 1, 2011, pp. 67-82. http://dx.doi.org/10.5194/nhess-11-67-2011
- M. Papathoma, D. Dominey-Howes, Y. Zong and D. Smith, “Assessing Tsunami Vulnerability, an Example from Herakleio, Crete,” Natural Hazards and Earth System Sciences, Vol. 3, No. 5, 2003, pp. 377-389. http://dx.doi.org/10.5194/nhess-3-377-2003
- T. Tachikawa, M. Kaku, A. Iwasaki, D. Gesch, M. Oimoen, Z. Zhang, J. Danielson, T. Krieger, B. Curtis, J. Haase, M. Abrams, R. Crippen and C. Carabajal, “ASTER Global Digital Elevation Model Version 2—Summary of Validation Results,” The NASA Land Processes Distributed Active Archive Center and the Joint Japan-US ASTER Science Team, 2011. https://lpdaacaster.cr.usgs.gov/GDEM/Summary_GDEM2_validation_report_final.pdf
- H. Tsuyoshi and A. Iwamatsu, “Detailed Map of the Impacts of the 2011 Japan Tsunami. Vol. 1: Aomori, Iwate and Miyagi Prefecture,” Kokon-shoin Publishers Ltd., Tokyo, 2012.
- N. Mori and T. Takahashi, “Nationwide Post Event Survey and Analysis of the 2011 Tohoku Earthquake Tsunami,” Coastal Engineering Journal, Vol. 54, No. 1, 2012, pp. 1-32. http://dx.doi.org/10.1142/S0578563412500015
- S. Fraser, I. Matsuo, G. S. Leonard and H. Murakami, “Tsunami Evacuation: Lessons from the Great East Japan Earthquake and Tsunami of March 11th 2011,” GNS Science Report 2012/17, Institute of Geological and Nuclear Sciences Limited, Avalon, 2012.
- B. K. P. Horn, “Hill Shading and the Reflectance Map,” Proceedings of IEEE, Vol. 69, No. 1, 1981, pp. 14-47. http://dx.doi.org/10.1109/PROC.1981.11918
- K. Iida, “Magnitude, Energy and Generation Mechanisms of Tsunamis and a Catalogue of Earthquakes Associated with Tsunamis,” Proceeding of Tsunami Meeting at the 10th Pacific Science Congress, Honolulu, July 1963, pp. 7-18.
- R. A. Van Zuidam, “Guide to Geomorphologic-Aerial Photographic Interpretation and Mapping,” International Institute for Geo-Information Science and Earth Observation, Enschede, 1983.
- C. L. Bretschneider and P. G. Wybro, “Tsunami Inundation Prediction,” Proceedings of the 15th ASCE Conference on Coastal Engineering, Honolulu, 11-17 July 1976, pp. 1006-1024.
- A. R. Huete, “A Soil-Adjusted Vegetation Index (SAVI),” Remote Sensing of Environment, Vol. 25, No. 3, 1988, pp. 295-309. http://dx.doi.org/10.1016/0034-4257(88)90106-X
- L. S. Araujo, J. R. dos Santos and Y. E. Shimabukuro, “Relationship Between SAVI and Biomass Data of Forest and Savanna Contact Zone and the Brazilian Amazonia,” International Archives of Photogrammetry and Remote Sensing, Vol. 33, 2000, pp. 77-81.
- G. Chander and B. Markham, “Revised Landsat-5 TM Radiometric Calibration Procedures and Post Calibration Dynamic Ranges,” IEEE Transactions on Geoscience and Remote Sensing, Vol. 41, No. 11, 2003, pp. 2674-2677. http://dx.doi.org/10.1109/TGRS.2003.818464
- M. Bouvet, G. Chander, P. Goryl and R. Santer, “Preliminary Radiometric Calibration Assessment of ALOS AVNIR-2,” Geoscience and Remote Sensing Symposium, IGARSS, Barcelona, 2007, pp. 2673-2676.
- National Aeronautics and Space Administration, “Data Users Handbook-Data Products, Chapter 11,” 2011. http://landsathandbook.gsfc.nasa.gov/pdfs/Landsat7_Handbook.pdf
- C. J. Tucker, “Red and Photographic Infrared Linear Combinations for Monitoring Vegetation,” Remote Sensing of Environment, Vol. 8, No. 2, 1979, pp. 127-150. http://dx.doi.org/10.1016/0034-4257(79)90013-0
- R. D. Jackson, P. N. Slater and P. J. Pinter, “Discrimination of Growth and Water Stress in Wheat by Various Vegetation Indices Through Clear and Turbid Atmospheres,” Remote Sensing of Environment, Vol. 13, No. 3, 1983, pp. 187-208. http://dx.doi.org/10.1016/0034-4257(83)90039-1
- C. J. Tucker, W. W. Newcomb, S. O. Los and S. D. Prince, “Mean and Inter-Year Variation of Growing-Season Normalized Difference Vegetation Index for the Sahel 1981-1989,” International Journal of Remote Sensing, Vol. 12, No. 6, 1991, pp. 1133-1135. http://dx.doi.org/10.1080/01431169108929717
- M. C. Hansen, R. S. Defries, J. R. G. Townshend and R. Sohlberg, “Global Land Cover Classification at 1 km Spatial Resolution Using a Classification Tree Approach,” International Journal of Remote Sensing, Vol. 21, No. 6-7, 2000, pp. 1331-1364. http://dx.doi.org/10.1080/014311600210209
- P. Gong, R. Pu, G. S. Biging and M. R. Larrieu, “Estimation of Forest Leaf Area Index Using Vegetation Indices Derived from Hyperion Hyperspectral Data,” IEEE Transactions on Geoscience and Remote Sensing, Vol. 41, No. 6, 2003, pp. 1355-1362. http://dx.doi.org/10.1109/TGRS.2003.812910
- A. R. Huete, G. Hua, J. Qi, A. Chehbouni and W. J. D. Van Leeuwen, “Normalization of Multidirectional Red and NIR Reflectances with the SAVI,” Remote Sensing of Environment, Vol. 41, No. 2-3, 1992, pp. 143-154. http://dx.doi.org/10.1016/0034-4257(92)90074-T
- A. R. Huete, “A Soil-Adjusted Vegetation Index (SAVI),” Remote Sensing of Environment, Vol. 25, No. 3, 1988, pp. 295-309. http://dx.doi.org/10.1016/0034-4257(88)90106-X
- J. R. Jensen, “Remote Sensing of the Environmental: An Earth Resources Perspective,” Prentice Hall, Upper Saddle River, 2000.
- T. L. Saaty, “A Scaling Method for Priorities in Hierarchical Structures,” Journal of Mathematical Psychology, Vol. 15, No. 3, 1977, pp. 234-281. http://dx.doi.org/10.1016/0022-2496(77)90033-5
- T. L. Saaty, “The Analytic Hierarchy Process, Planning, Priority Setting, Resource Allocation,” McGraw-Hill, New York, 1980.
- T. L. Saaty, “Decision Making with the AHP; Why Is the Principle Eigenvector Necessary,” European Journal of Operational Research, Vol. 145, No. 1, 2003, pp. 85-91. http://dx.doi.org/10.1016/S0377-2217(02)00227-8
- E. H. Forman and M. A. Selly, “Decision by Objectives,” World Scientific Publishing Company, 2001.
- T. L. Saaty, “Decision Making for Leaders: The Analytical Hierarchy Process for Decisions in a Complex World,” The Analytical Hierarchy Process Series, RWS Publication, 1996.
- Geospatial Information Authority of Japan (GSI), “Tsunami Inundation and Land Use Area of the 2011 Japan Earthquake,” Geospatial Information Authority of Japan (GSI Japan), 2011.