Journal of Geographic Information System
Vol.5 No.2(2013), Article ID:29776,6 pages DOI:10.4236/jgis.2013.52012
Extraction of Urban Vegetation in Highly Dense Urban Environment with Application to Measure Inhabitants’ Satisfaction of Urban Green Space
Institute of Geography, Department of Earth Science, Graduate School of Science, Tohoku University, Sendai, Japan
Email: fatwa@s.tohoku.ac.jp
Copyright © 2013 Fatwa Ramdani. This is an open access article distributed under the Creative Commons Attribution License, which permits unrestricted use, distribution, and reproduction in any medium, provided the original work is properly cited.
Received November 12, 2012; revised December 5, 2012; accepted January 5, 2013
Keywords: Urban Vegetation; Remote Sensing; Vegetation Extraction; Indonesia
ABSTRACT
Urban environment has functioned not only for ecological reason but also for socioeconomic function, due to this reason extraction of urban vegetation in highly dense urban environment becomes more important to understand the inhabitants’ satisfaction of urban green space. With a medium resolution of satellite imagery, the precision is very low. We used high resolution of WorldView-2 satellite to raise the accuracy. We chose Depok City in West Java as a case study area, analyse four multispectral bands, and apply TCT algorithm for getting vegetation density. The relationship between vegetation density and inhabitants’ satisfaction was calculated by Geo-statistical technique based on administrative boundary. We extracted three types of urban vegetation density: good, mid and low. The final result shows that the inhabitants are mostly satisfied with good density of urban vegetation in the city forest inside Campus University of Indonesia.
1. Introduction
Vegetation is of particular interest as it presents a versatile resource for effectively managing and moderating a variety of problems associated with urbanization. The spatial distribution and abundance of urban vegetation, for example, is recognized as a key factor influencing numerous biophysical processes of the urban environment, including air and water quality, temperature, moisture, and precipitation regimes [1-3].
During the last ten years, Depok City has been growing fast as a satellite city in south of Jakarta. The growing of the city is also followed by the socioeconomic development, urban green space becomes more important for urban environment and urban ecosystem. Trees can reduce pollutant from transportation mod and can decline the effect of urban heat island. In order to tackle the increasing of flood event and bad air condition in the high density urban environment it is necessary to monitor the actual condition of urban vegetation distribution and evaluate it, to measure the quality of life in the highly dense urban environment.
In addition, vegetated areas such as gardens, parksand forests have been related to positive social outcomes including reductions in crime [4], health benefits [5], and advanced childhood development [6]. Given the associations between vegetated land cover and the biophysical and social processes of urban systems there exists an ongoing demand for effective urban vegetation mapping and classification techniques.
High resolution of satellite imagery such as WorldView-2 provides us much better information in every single pixel with 0.5 cm resolution and 6.5 m accuracy specification. The imagery can highly define the urban vegetation in highly dense urban environment, and it has been accurate for monitoring the green space distribution. Favela and Torres [7] developed image-understanding techniques characterized by artificial intelligence, and other researchers had developed diagnostic expert systems [8,9].
In order to observe the inhabitants’ satisfaction, many studies designed by researchers such as ask people, and interview face-to-face about their opinions [10,11]. However there are no studies that have been conducted on urban growth and the correlation between urban vegetation and urban inhabitants’ satisfaction level in Depok City.
The objectives of this study are: 1) to provide an effective method of extraction of urban vegetation in highly dense urban environment; 2) to show the spatial distribution of urban green space using WorldView-2 imagery; and 3) to calculate the relationship between the spatial distribution of urban vegetation and inhabitants’ satisfaction.
2. Methods
2.1. Study Area
Depok City is geographically located at 6˚19'00" - 6˚28'00" south latitude and 106˚43'00" - 106˚55'30" east longitude. Depok City directly is adjacent to the greater Jakarta area. Depok City as the youngest province in West Java has an area of about 20,029 ha [12].
Depok City Land Resources is under pressure with rapid developments in inner city. Based on data analysis from the Spatial Planning Policy Revision of Depok City (2000-2010) in the land use of urban space, residential areas in 2005 reached 891,509 ha (44.31%) of the total land use of Depok City [12].
In year 2005 urban green space was 10,106.14 ha (50.23%) of the area of Depok City, or decreased 0.93% from the year 2000. Increasing in built-up area caused decline in the natural condition of Depok City, mainly due to pressure from the land use for residential development that reached more than 44.31% of the total area of the city. Built-up area in 2005 reached 10,013.86 ha (49.77%) of the total area of Depok City, it was an increase of 3.59% from year 2000 [12].
The population of Depok City in 2005 reached 1,374,522 people, consist of 696,329 males (50.66%) and 678,193 females (49.34%), with an area of only 200.29 km2, the population density in Depok City is 6863 people/km2. Population density was classified as “dense”, especially if associated with uneven population distribution [13].
Within 5 years (2000-2005) population of Depok City increased by 447,993 inhabitants. In 1999 the population was still under 1 million and by 2005 had reached 1,374,522 people, making progress on average 4.23% per year. The increase was due to high rates of migration each year [13].
High migration into Depok City as a result of rapid urban development can be seen from the increasing development of residential areas. Depok City immigration numbers in the year 2004, showed a fluctuating pattern, where the immigration of 11,899 people and the emigration is 4503 people, or the average number of arrivals per year reaching 7396 migrants. Based on these developments, estimated number of people who come to the Depok City will increase in the future, as more and more operational activities and commercial services are growing rapidly [13].
2.2. Data
WorldView-2 is a commercial satellite operated by Digital Globe, Inc. This sensor provides two different captures at the same time of observation, a multispectral image and panchromatic image. The multispectral image provides lower resolution (2 m) of every single bands image, which includes coastal, yellow, red-edge, and near infra-red-2. But the panchromatic image provides higher resolution (50 cm) of one band image. The multispectral data has eight bands, which are coastal (400 - 450 mm), blue (450 - 510 mm), green (510 - 580 mm), yellow (585 - 625 mm), red (630 - 690 mm), red-edge (705 - 745 mm), near infra-red-1 (770 - 895 mm), and near infra-red-2 (860 - 1040 mm). The panchromatic image is black and white (monochrome) with spectral characteristics 450 - 800 mm.
From the image of the study area (Figure 1), it can be seen that the urban green vegetation is concentrated in the city forest (Campus of University of Indonesia). The geographical distribution of urban vegetation is various, from side-street trees, trees in the parks, bushes along rivers, to trees inside residential area.
Field surveys were conducted for the period between March 5 and April 23, 2012. It was conducted faceto-face interview with university member, residential member, workers, and commuters. They were asked about their satisfaction on urban environmental condition.
The general framework of the study is separated into two steps (Figure 2): The first one is imagery processing. At this step, the satellite image was classified in order to extract urban vegetation in highly dense urban environment for monitor the spatial distribution of urban green space. The second step, we measured the relationship between inhabitants’ satisfaction and spatial distribution

Figure 1. WorldView-2 image of the study area, shown in false color.
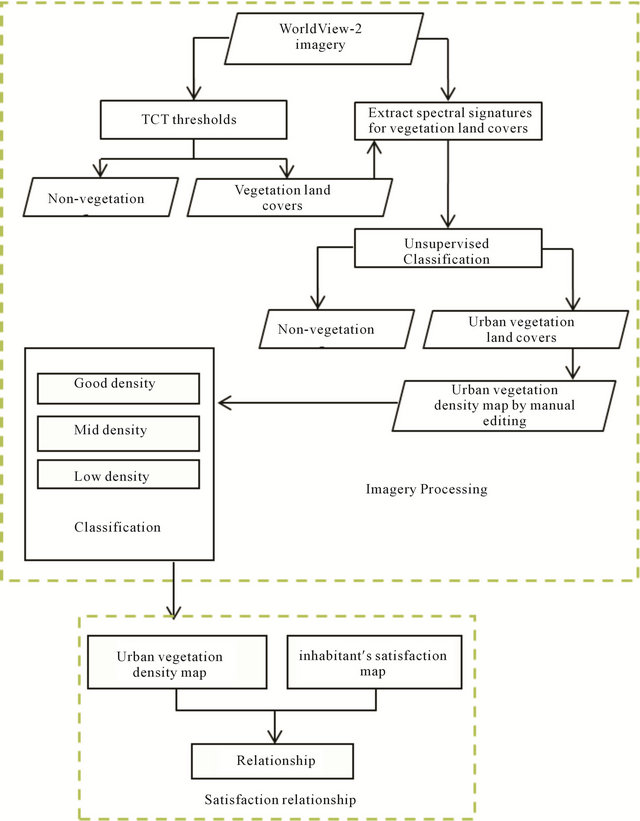
Figure 2. Framework
of urban green space. We applied Tasselled Cap Transformation—TCT algorithm to get vegetation density and the spatial distribution of urban green space. TCT (Tasselled Cap Transformation) is a mathematic formula to calculate brightness level, greenness level, and wetness level from digital number in every band (band1 to band4) of WorldView-2 imagery. TCT was introduced first time by Kauth and Thomas [14] used Landsat MSS. Furthermore, TCT was completed by Crist and Cicone [15] used Landsat TM. In this study we used TCT coefficient from Yrabrough and Easson [16].
The algorithms are shown below;
Wetness level:
band1*(0.319) + band2*(0.542) + band3*(0.490) + band4*(0.604)
Greenness level:
band1*(−0.121) + band2*(−0.331) + band3*(−0.517) + band4*(0.780)
Brightness level:
band1*(0.652) + band2*(0.375) + band3*(−0.639) + band4*(−0.163)
Note: band1 for blue, band2 for green, band3 for red, band4 for near infra-red.
From the TCT image result, we employed isodata unsupervised classification method using greenness image, to extract only the urban vegetation. Greenness image used due to greenness level describe the density of vegetation, higher greenness level is correlated with higher vegetation density [17]. To measure the accuracy level of classification result, 100 points selected randomly from classification result. Points then superimposed and visually assessment was done. The extensive field work survey was also conducted to verify points using global positioning system (GPS). Then we generated confusion matrices to calculate Kappa coefficients (k) and to derive overall accuracy.
3. Analysis
According to isodata unsupervised interpretation, we have extracted three classes of the urban green space from the WorldView-2 image using tree classification method:
- Good density (TCT-greenness greater than 0.8)- Mid density (TCT-greenness greater than 0.3 but less than 0.79), and
- Low density (TCT-greenness greater than 0.1 but less than 0.29).
These three types can be derived from distinguished their shape, texture, color, size and associations, for example good density is city forest area, which is part of the urban green space in the Campus of University of Indonesia. Mid density of urban vegetation are local guava, banana, and papayas plantation. While low density of urban vegetation situated in street-side and residential trees, situated along the main road.
To highlight the vegetation inside highly dense urban environment, we show the vegetation in red color (false color), we employed an RGB combination using band near infra-red-1, red, and yellow. This combination makes us easier to interpret the urban vegetation and extract it using isodata unsupervised method classification.
To obtain these three different classes, we employed open source software for satellite imagery processing, ILWIS 3.7.1. This open source software allows us to apply the isodata unsupervised method, to calculate the means per band for each class of training pixels as defined in the sample set. The sample was the training phase, where classes of pixels with similar spectral values are defined. Classify is the decision phase, where each output pixel is assigned a class name if the spectral values of that pixel are similar enough to a training class. Relevant information on the classes for which training pixels have been selected in the sample set, can be viewed in the sample statistics. In general, to each output pixel, the class will be assigned of which the spectral values are most similar to (or “nearest”) to the spectral values of an input pixel.
The first result of urban vegetation classes is in pixel format, for easier analysis we convert pixel format to vector format. We calculate the urban vegetation density (%) compared the total land area (ha) of every sub district divide by urban vegetation area (ha) and multiply by 100. We only used good density of urban vegetation in calculation, mid and low density of urban vegetation is excluded due to insufficient appearance in the field work activity. These types of vegetation are only small trees or bushes and grass in small part.
We verified the relationship between vegetation density and inhabitants’ satisfaction by Geo-statistical technique based on an administrative boundary shown in the map (Figure 3). In this study, inhabitants’ satisfaction information collected from field surveys was ranked from 1 to 3 levels opinions based on questionnaire results. Rank 1, 2 and 3 indicated low, mid, and high satisfaction, respectively. From Figure 3, we can understand that the high density of urban vegetation situated in the northern side of the study area, which is city forest inside University of Indonesia.
High satisfaction level also acquired in the two sub districts located on the northern side of Depok City, associated with high density of urban green space. Mid satisfaction level of urban vegetation acquired in Tanah Baru sub district, in this area there are many local guava, banana, and papayas plantation, local inhabitant feels comfortable and satisfied with the appearances of these plantation, however development of many residential clusters at present become a real threat to these plantations. Low satisfaction level of urban vegetation level acquired in the two sub district of the south side of the study area, in this area vegetation only appear in a small part in street-side and along the residential road network.
4. Result
We extracted the urban vegetation and non-vegetation area using the spectral information provided by the multispectral image using isodata unsupervised classification method. From the confusion matrix analysis we produce high accuracy with 96.0429% overall accuracy and Kappa coefficient is 0.9042 (Table 1).
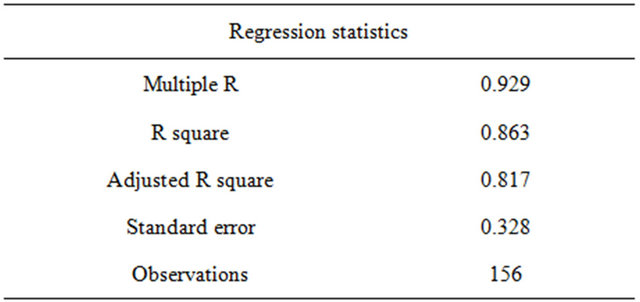
Table 2 showed the R2 coefficient representing the correlation between the spatial distribution of urban vegetation density and inhabitants’ satisfaction. Results show that the value of R2 coefficient was near unity, indicating that vegetation density and inhabitants’ satisfaction are well correlated. Thus, it can be concluded that the inhabitants are mostly satisfied with high density of urban vegetation in the city forest inside Campus of University of Indonesia.
However, due to the availability of the data, the urban vegetation density image does not cover all five subdistrict in the study area. The WorldView-2 image only covers 67% of all study areas. The image size is 4 km × 2.7 km equal to 1080 ha, and total area of the five sub-
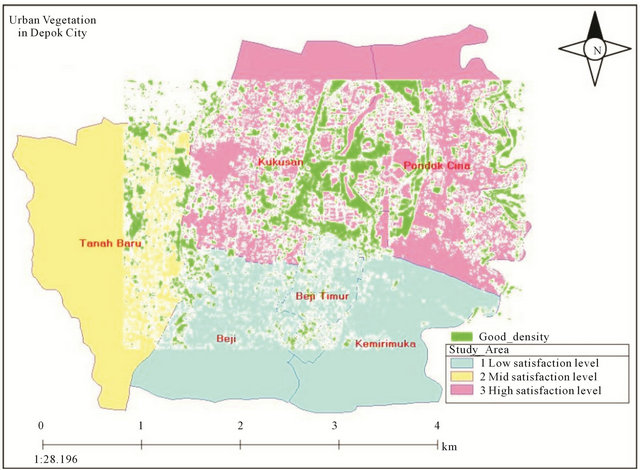
Figure 3. Spatial distribution of urban vegetation density superimposed by inhabitants’ satisfaction level.
Table 1. Confusion matrix result.
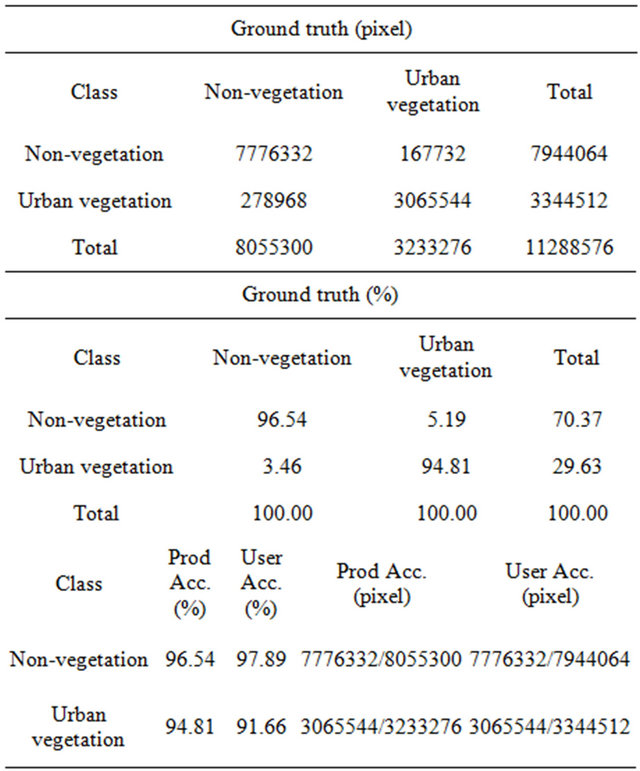
Table 2. Regression results.
districts is 1621 ha.
5. Conclusions
This study shows that WorldView-2 imagery could be used for monitoring the urban vegetation extraction in the highly dense urban environment, and to understand the inhabitants’ satisfaction of spatial distribution of urban green space density.
High resolution imagery data and GIS technique are very useful for the extraction of information like urban vegetation which is an important attribute for assessing the urban environment. Technique presented in this study produces high accuracy with R2 = 0.86.
Furthermore, to increase the quality of life in dense population in a growing city such as Depok City could be measured from the point of view of high resolution satellite imagery.
REFERENCES
- R. Avissar, “Potential Effects of Vegetation on the Urban Thermal Environment,” Atmospheric Environment, Vol. 30, No. 3, 1996, pp. 437-448. doi:10.1016/1352-2310(95)00013-5
- C. S. B. Grimmond, C. Souch and M. D. Hubble, “The Influence of Tree Cover on Summertime Energy Balance Fluxes, San Gabriel Valley, Los Angeles,” Climate Research, Vol. 6, 1996, pp. 45-57. doi:10.3354/cr006045
- D. J. Nowak and J. F. Dwyer, “The Urban Forest Effects (UFORE) Model: Quantifying Urban Forest Structure and Functions,” In: M. Hansen and T. Burk, Eds., Proceedings: Integrated Tools for Natural Resources Inventories in the 21st Century. IUFRO Conference, US Department of Agriculture, Forest Service, North Central Research Station, St. Paul, pp. 714-720.
- F. E. Kuo and W. C. Sullivan, “Environment and Crime in the Inner City,” Environment and Behavior, Vol. 33, No. 3, 2001, pp. 343-365.
- S. E. Coen and N. A. Ross, “Exploring the Material Basis for Health: Characteristics of Parks in Montreal Neighbourhoods with Contrasting Health Outcomes,” Health and Place, Vol. 12, No. 4, 2006, pp. 361-371. doi:10.1016/j.healthplace.2005.02.001
- A. F. Taylor, A. Wiley, F. E. Kuo and W. C. Sullivan, “Green Spaces as Places to Grow,” Environment and Behavior, Vol. 30, No. 1, 1998, pp. 3-28. doi:10.1177/0013916598301001
- J. Favela and J. Torres, “A Two-Step Approach to Satellite Image Classification Using Fuzzy Neural Networks and the ID3 Learning Algorithm,” Expert Systems with Applications, Vol. 14, No. 1-2, 1998, pp. 211-218. doi:10.1016/S0957-4174(97)00071-7
- R. Gamanya, P. De Maeyer and M. De Dapper, “An Automated Satellite Image Classification Design Using Object-Oriented Segmentation Algorithms: A Move towards Standardization,” Expert Systems with Applications, Vol. 32, No. 2, 2007, pp. 616-624. doi:10.1016/j.eswa.2006.01.055
- X. Huang, J. R. Jensen and H. E. Mackey, “Machine Learning Approach to Automated Construction of Knowledge Bases for Expert Systems for Remote Sensing Image Analysis with GIS Data,” Expert Systems with Applications, Vol. 11, No. 4, 1996, pp. 8-9.
- E. Lange, S. Hehl-Lange and M. J. Brewer, “Scenarios Visualization for the Assessment of Perceived Green Space Qualities at the Urban-Rural Fringe,” Journal of Environmental Management, Vol. 89, No. 3, 2008, pp. 245-256. doi:10.1016/j.jenvman.2007.01.061
- T. T. H. Pham and D.-C. He, “How Do People Perceive the City’s Green Space? A View from Satellite Imagery (in Hanoi, Vietnam),” Proceedings of the IEEE International Geoscience & Remote Sensing Symposium, Boston, 6-11 July 2008, pp. 1228-1231.
- Government of Depok City, 2001. http://www.depok.go.id/profil-kota/geografi
- Government of Depok City, 2011. http://www.depok.go.id/profil-kota/demografi
- R. J. Kauth and G. S. Thomas, “The Tasseled Cap—A Graphic Description of the Spectral-Temporal Development of Agricultural Crops as Seen by LANDSAT,” Proceedings of the Symposium on Machine Processing of Remotely Sensed Data, University of West Lafayette, Indiana, 1976.
- E. P. Crist and R.C. Ciccone, “Application of the Tasseled Cap Concept to Simulate Thematic Mapper Data,” Photogrammetric Engineering and Remote Sensing, Vol. 50, 1984, pp. 343-352.
- L. D. Yarbrough and G. Easson, “Quickbird 2 Tasseled Cap Transform Coefficients: A Comparison of Derivation Method,” Pecora 16 “Global Priorities of Land Remote Sensing”, South Dacota, 2005.
- F. Ramdani, “Sub-Urban Growth Impact in the Wet-Land Environment. Case Study: Rawa Danau Nature Re-Serve,” Proceedings of the 10th International Geoconference SGEM, Varna, 2010.