Journal of Geographic Information System
Vol. 4 No. 6 (2012) , Article ID: 26317 , 9 pages DOI:10.4236/jgis.2012.46054
Traffic Fluxes and Urban Congestion: A Simple Approach with the Attractors’ Method
1Department of Civil Engineering and Computer Science (DISP), University of Rome “Tor Vergata”, Rome, Italy
2Department of Geology, University of Rome “Sapienza”, Rome, Italy
3Council of Presidency, Italian Geophysical Association (AGI), Rome, Italy
4Earth Observation Science Strategy, Coordination and Planning Office, Directorate of Earth Observation, European Space Agency (ESA), Frascati, Italy
Email: *loret@disp.uniroma2.it, gaiagullotta@gmail.com, maufea@gmail.com, Francesco.sarti@esa.int
Received June 2, 2012; revised July 5, 2012; accepted August 7, 2012
Keywords: GIS; Traffic; Land Use; Attractors
ABSTRACT
Situations of heavy and congested traffic in urban areas have been analysed by using a statistical approach based on both the identification of specific locations that attract drivers in a multipoint-to-multipoint traffic structure and their classification (attractor’s value) as a function of the number of people visiting them by car in different time ranges. By using a Kernel Density Estimation (KDE) function, attractors’ distribution density values have been estimated and then integrated with nodal and critical traffic points and traffic density in a “congestion” map. Finally, cross-comparing congestion values with the location of buildings, the road network and the Corine Land Use/Land Cover environmental classification, a “Quality of Life” map has been generated. The authors use this term because the congestion of traffic flows, with all the problems that it entails (such as long travel time, air and acoustic pollution, and so on) is a good indicator of the quality of life, especially in small towns. Results show that this type of “off-line” analysis would allow administrators to identify, quickly and at low cost, areas where citizens’ quality of life is most affected by traffic noise and jumps and, hence, to focus costly ground measurements and interventions primarily there.
1. Introduction
The observation of vehicle traffic around and in a big and modern urban area is instrumental in describing a very complex situation that often turns into chaos, where data from ground measurements vary quite widely in direction, quantity and time in a non-linear and scarcely predictable way. In order to study the problem, often a measurement campaign is organized along road axes through flux counters positioned in strategic locations for long periods times. This methodology implies not only the positioning of instruments (hence, their unavailability elsewhere) but also high expenditures for data analysis; therefore, this action is implemented only for the most important roads, ignoring traffic areas that, by contrast, have a higher synergetic impact on the overall road network. Moreover, the analysis of collected data is often summarised in flux simulation models through sophisticated mathematical concepts, such as “cellular automata” that refer to studies by Von Neumann and S. Ulm [1] or to kinematic waves with the LWR model [2,3]. Other authors are trying to study the traffic system from the point of view of “Origin” and “Destination”: then, these fluxes require an “Origin” and a “Destination” into the urban areas, reducing the modelisation to just a time-space-speed fluidodynamic analysis, which can be surely applied to fluxes of daily commuters. However, when considering a typical urban sprawl environment where origins and destinations are very many, studying fluxes becomes complicated and both the destination choice probability for each vehicle and the vehicle percentage from one origin to each destination are determined through historical series derived from an original OD matrix. The choice of destination of each vehicle is normally done by using the Monte Carlo method [4].
In addition, this type of methodology requires an important effort in energy for studying, time and money that are not always available: for this reason knowing in advance where to place the tools and to focus the study could lead to significant savings. In this case, a situation of very high urban fragmentation occurred in the metropolitan area of Rome (Italy), for which this work was meant to help in solving the problem of estimating and knowing the traffic flux phenomenon through an indirect and very cheap approach by using the geographical information system technology.
2. Study Area
The volcanic area of the so-called Alban Hills has been considered. Located South-East of Rome (Italy) (Figure 1), this area of around 60 Km² includes the urban suburbs of Rome and the two adjacent municipalities of Frascati and Grottaferrata (Figure 2).
Between the big city and the two municipalities there is an intense flux of local and intercity traffic inside a complex road network that is based on two main axes: the Tuscolana and the Anagnina roads. The entire area between Rome and the surrounding municipalities is densely built and nowadays urbanely connected without interruption [5]. Upon demand from the interested municipalities, some years ago studies were performed on traffic fluxes, but were carried out without direct data measurements, or else with measurements made only for main roads; those studies did not take into account the heavy local traffic that hinders the flowing of the crossing traffic.
3. Data
This work has been carried out at ESRIN, the establishment of the European Space Agency (ESA) in Italy, located in Frascati, near Rome, by using ERDAS/IMAG-

Figure 1. The Alban Hills volcano near Rome (Italy), with the municipalities of Grottaferrata and Frascati (red square); Image ALOS AV.2 July 2007, ms (multispectral) + pan (panchromatic) RGB 3, 4, 2.
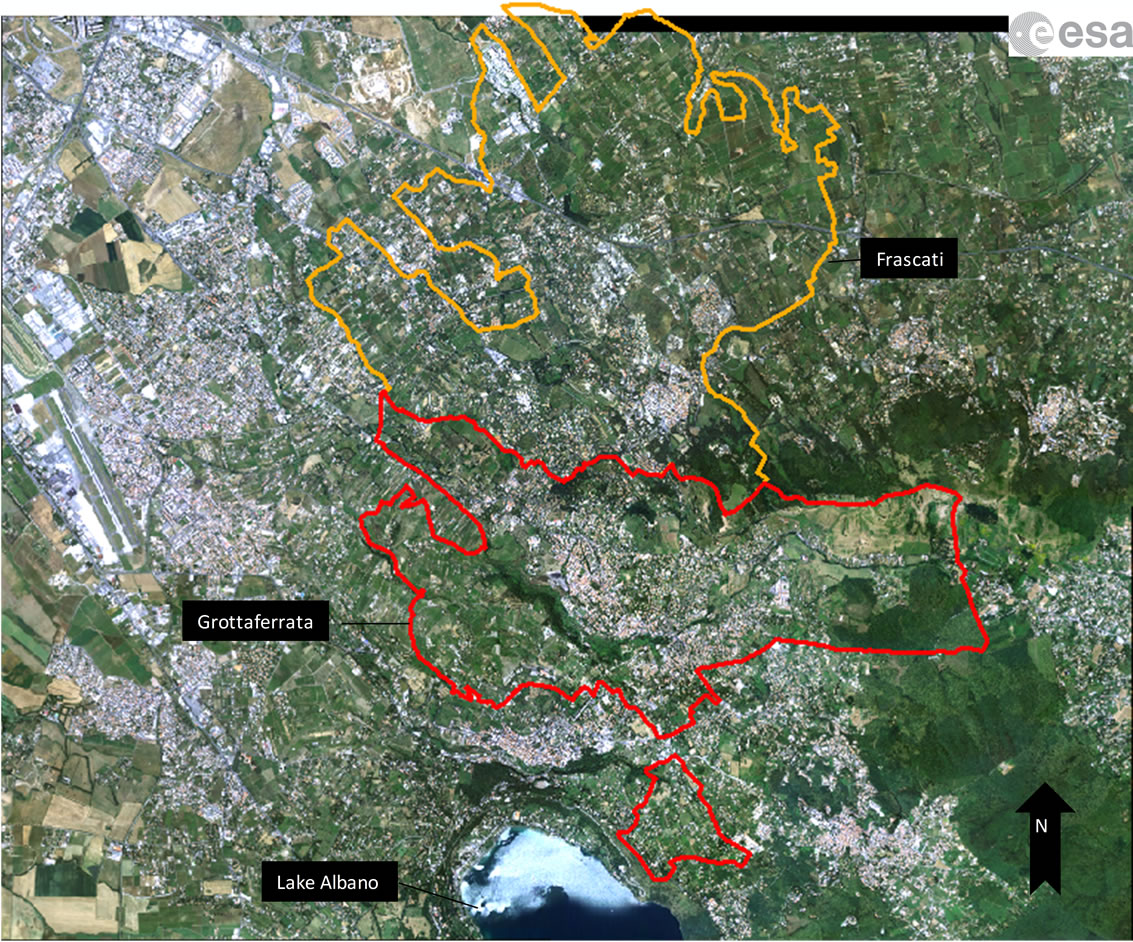
Figure 2. Municipalities of Frascati (orange contour) and of Grottaferrata (red contour); Orthophoto, August 2008, MS (multispectral), resolution 0.50 m.
INE 9.1 and GIS ArcInfo 9.2 data processing software in order to perform the analysis of satellite images, orthophotos (Table 1) and cartographic maps. Cartography is based on a mosaic of 21 sections of the 1990 Regional Technical Map (CTR-Carta Tecnica Regionale). Both images and maps are projected in the UTM geographic system, 1924 international ellipsoid, 1950 European datum.
Information drawn from satellite images, orthophotos and maps has allowed the generation of a series of vectorial images, such as:
● Land use and cover (at 1:10.000 scale);
● Map of Environmental Quality (at 1:10.000 scale);
● Buildings in the two municipalities;
● Municipal and inter-municipal road network.
In the land use and land cover classification, territorial homogeneous units have been considered according to the Corine Land Cover 2000 legend, with the V level for natural areas and with a minimal cartographic unit of 500 m2 for urban and semi-natural areas and of 300 m2 for natural ones [6]. This feature class has been reorganized in eight classes of environmental quality, with values from 1 to 8 (Table 2), on which the calculation of the Index Landscape Conservation (ILC) is based.
ILC is an index of landscape ecology, which expresses the conservation status. Its value varies from 0 (=areas with highest level of anthropic presence) to 1 (=areas with highest level of natural conditions):
 (1)
(1)
where:
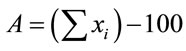 ; with x = cumulative percentage area occupied by the i-th category and i = number of classes of environmental quality;
Amax is the highest value that A can reach. In this case, there are eight classes and Amax = 700.
Finally, data concerning the attractors were obtained from ISTAT publications, documents of the Chamber of Commerce of the Province of Rome, telephone White Pages books and Google information via Internet.
4. Methodology Applied and the Results Obtained Step by Step
The problem of missing measured data has been resolved by designing a geographic information system (GIS) based on an indirect methodology centred on traffic “attractors” through density measurements and traffic congestion and quality of life indicators.
An “attractor” is intended to be any point of a complex network that draws traffic fluxes: malls, schools, offices, shops, and so on; that is to say, points in a territory that attract a certain number of people with vehicles (estimated with a scale [weight] from 1 to 10) in specific periods of the day, calculated in total amount of hours.
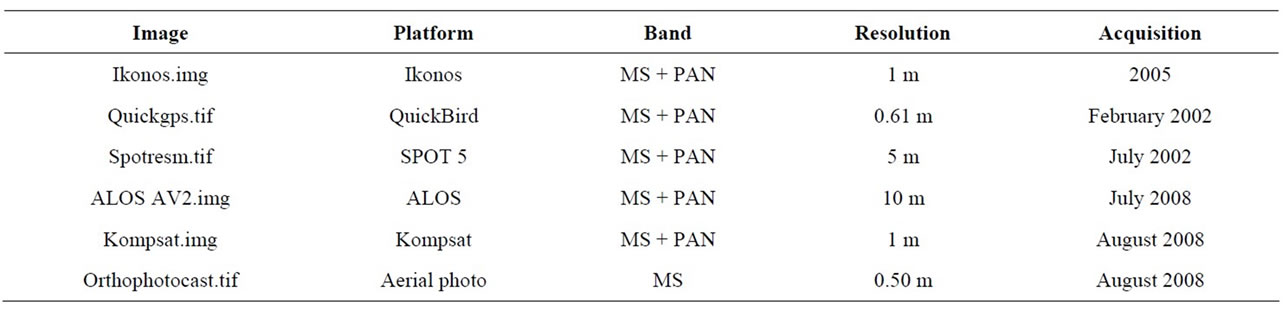
Table 1. Satellite images and aerial photo used in this study.
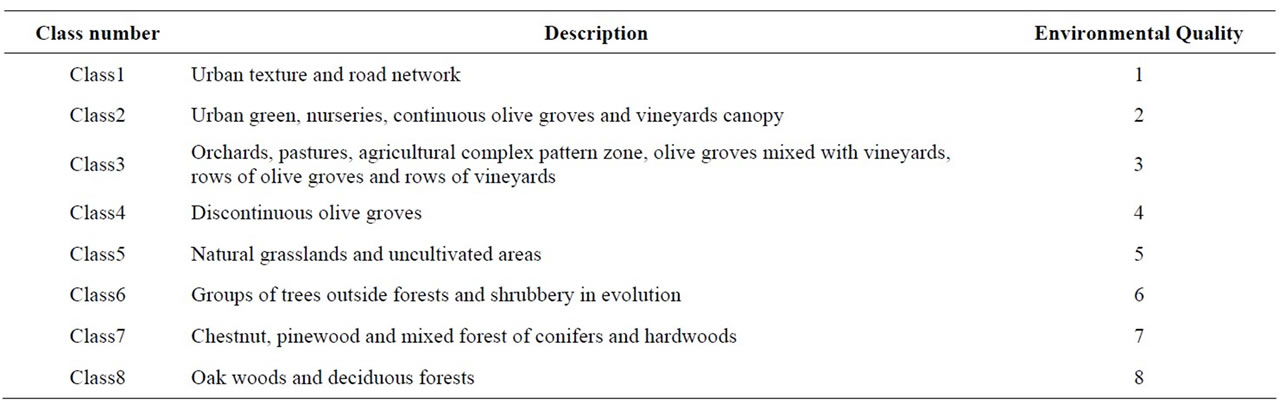
Table 2. The eight classes of environmental quality used in this study.
In the study area 259, attractor points have been identified by making use of authors’ personal knowledge of the area and of ISTAT publications, Google maps and, more generally, with the help of commercial internet databases.
Calculations have been made over 24 hours, but with an analysis over a total or a sum of hourly fluxes on the basis of the observation of the attractor type. For example, in Italy a high school with 1000 students causes a non trivial traffic problem, with repercussions in a big area. These schools can “attract” teachers, parents and students, but only at certain hours: the first part of the morning and at the end of lessons, with repercussions on the traffic during a total period of up to 3 hours; hence, these “3 hours” have been assigned the maximum weight of 10 (traffic congestion).
Therefore, the value V of an attractor has been calculated considering the product of its weight (heavy or congested traffic) multiplied by the total of associated hours of these specific traffic conditions, as follows:
 (2)
(2)
where P is the weight related to the traffic conditions, hence to the number of people involved, and T the associated total traffic period in hours.
In the case of the school mentioned above, the value of this attractor is 5.4, that is to say the square root of the product of 3 hours for the maximum value of 10.
It has been possible, then, to make use of the Kernel Density Estimation (KDE) function, which provides the estimate of a punctual phenomenon by generating a surface from a cloud of points distributed in a region of space. This function weights the values selected within a sphere of influence as a function of their distance from the point where the intensity is estimated [7].
The density or intensity of the attractors’ distribution in the point s can be defined with the following equation:
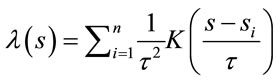 (3)
(3)
where λ(s) represents the estimate of the distribution of points measured in the point s, si is the i-th event (value), k the Kernel function and τ the threshold that permits to obtain more or less rounded surfaces.
The function KDE applied to the attribute “Value” has provided the result visualized in Figure 3.
Then, the resulting grid file has been vectoralized, considering its 10 density classes. From Figure 4, it’s possible to see that the distribution of KDE depicts the main road linking the towns of Marino (south-west of Grottaferrata), Grottaferrata and Frascati (Figure 4).
Besides the attraction points (attractors), traffic nodes have been considered, that is to say all those nodal points like simple crossings, crossings with lights (example “Crossroad α”) or roundabouts (example Squarciarelli),
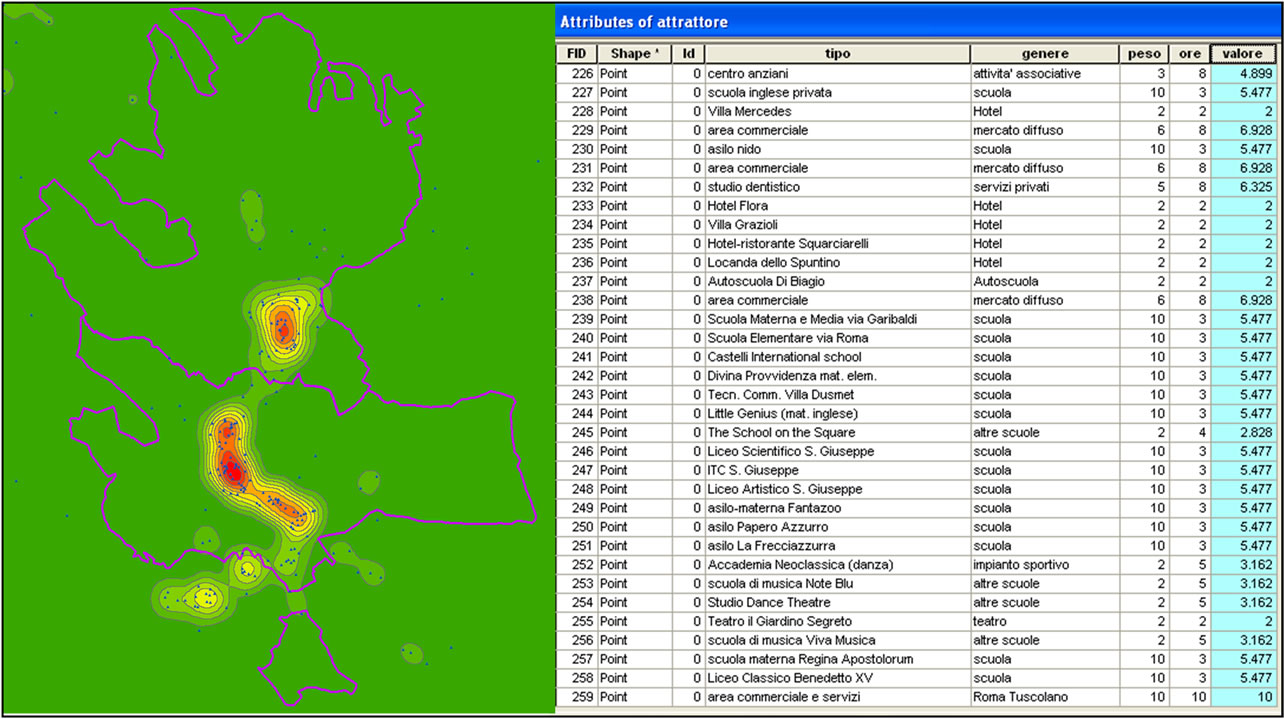
Figure 3. Left: Attractors (blue dots) and the distribution of the Kernel Density (red = max density and green = min density) for the municipalities of Frascati (in the upper part of the figure) and Grottaferrata (in the lower part). Right: Table of attributes, in which for each attractor are indicated: type, kind, weight, time in hours and Kernel density value.
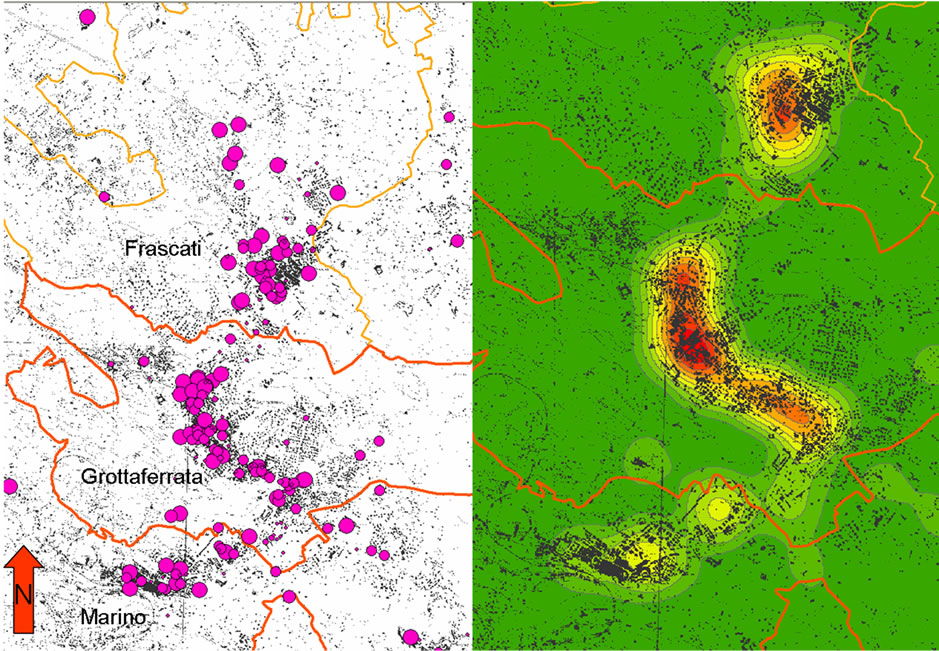
Figure 4. Left: Attractors (fuchsia dots) identified in the study area. The size of attractors depends on their value. Right: the relative Kernel Density values. Both the images are drawn on the CTR.
where the vehicle flux is slowed down according to values of a field “class” from 1 to 10, where value was determined for the highest slowdown in all directions. Thus, 28 nodal points have been introduced in the study. Values of these points have been interpolated by applying the IDW geostatistical function and creating another grid surface, which has been then vectorialized. IDW is a technique of interpolating a surface using an inverse distance weighted. The inverse distance weighted method is based on the weighted average of the scatter points with the weight assigned to each scatter point that diminishes as the distance from the interpolation point increases.
Traffic density (ValKDE) and the slowing down effect due to nodes (ValNODE) have been added together in order to create a new value field call “congestion” (C), for which:
 (4)
(4)
The term “congestion” is meant to describe the increase of traffic generated by the density of the attractors and the slowdown effect due to the nodes. The result is a map, more complex than the one resulting from Kernel Density analysis, but that better reflects the reality of the study area: in fact, there are significant values of congestion outside the continuous urban fabrics and their surrounding areas (Figure 5).
At this point, using the GIS intersection functions, cross-comparisons have been made among congestion values and:
1) Road network;
2) Land cover and land use;
3) Buildings in the area.
Thereby obtaining a map of the most congested roads and of the buildings most exposed to vehicular traffic pollution and noise, classifying them in a colour code from green (min) to red (max).
1) The comparison of the CTR (generated in the 1990’s) with the most recent satellite imagery shows that the primary road network has remained relatively unchanged, whilst the area has been affected by a strong urban growth according to the pattern of urban sprawl (Figure 6).
2) Through a cross-comparison (intersection) of congestion values (C) with values of the eight classes of area environmental quality, defined by land use and land cover (Gullotta 2010), a shapefile has been generated, in which areas with different levels of anthropic inconvenience have been identified, that is to say urban zones at different Quality of Life (QL). The indicator QL combines state of conservation of the landscape with the values of congestion of traffic flows, as follows:
 (5)
(5)
where ILCG represents the state of landscape conservation in the municipality of Grottaferrata and ILCF represents the state of landscape conservation in the municipality of Frascati. These areas, too, have been classified with a colour code from green to red (Figure 7). Therefore, the calculation of the QL parameter offers an additional level of information. In fact, the highest values of congestion substantially correspond to areas with low values of environmental quality; however, areas with
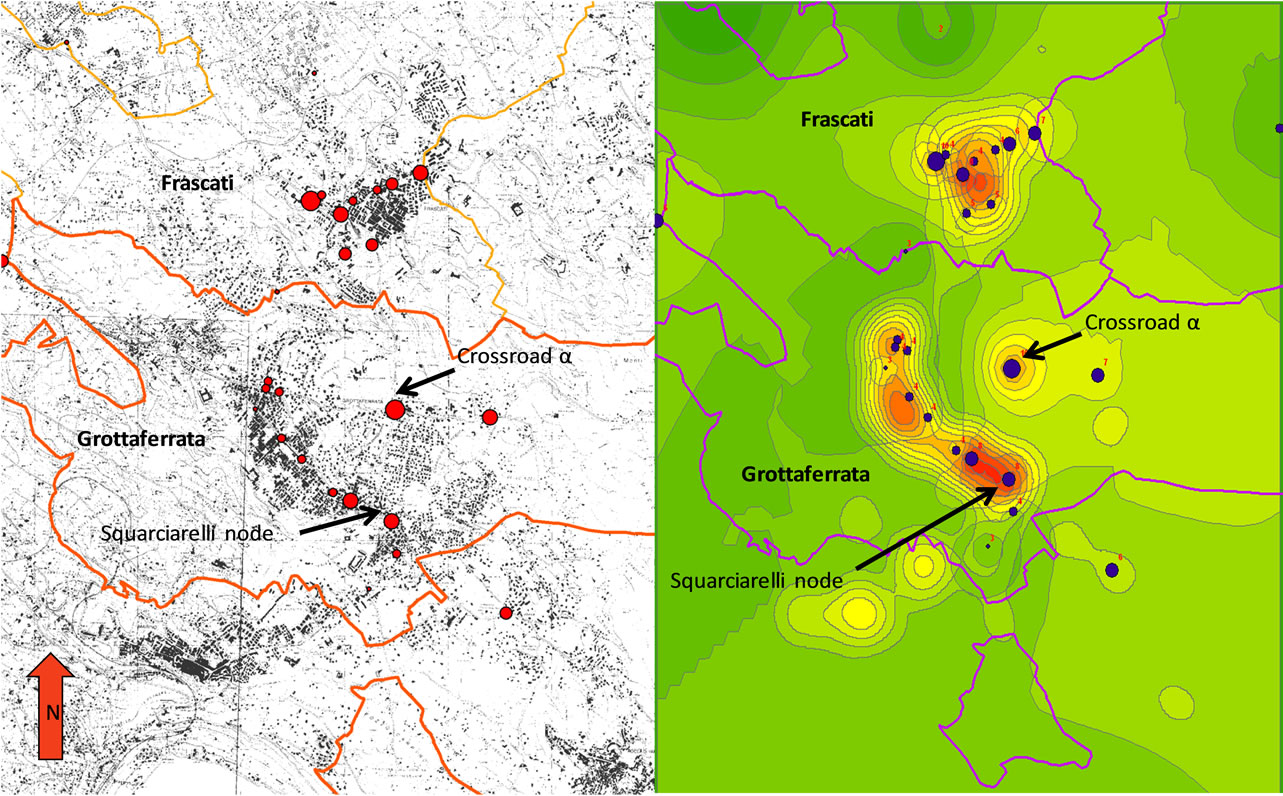
Figure 5. Left: nodes (red dots) identified in the study area on the CTR. The graphical size of the attractors depends on their KDE value. Right: the “congestion” values.
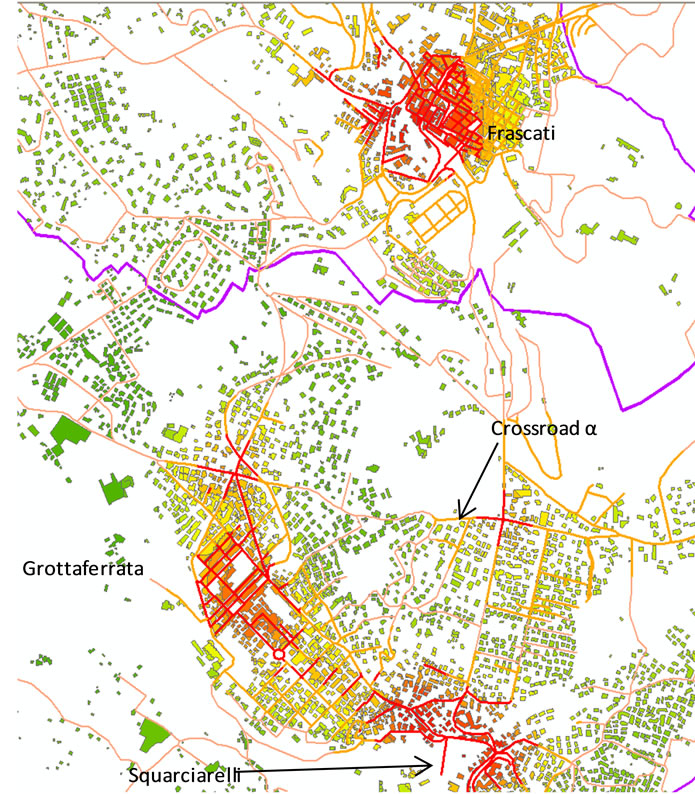
Figure 6. Classification of roads as a function of traffic congestion (red: max; green: min).
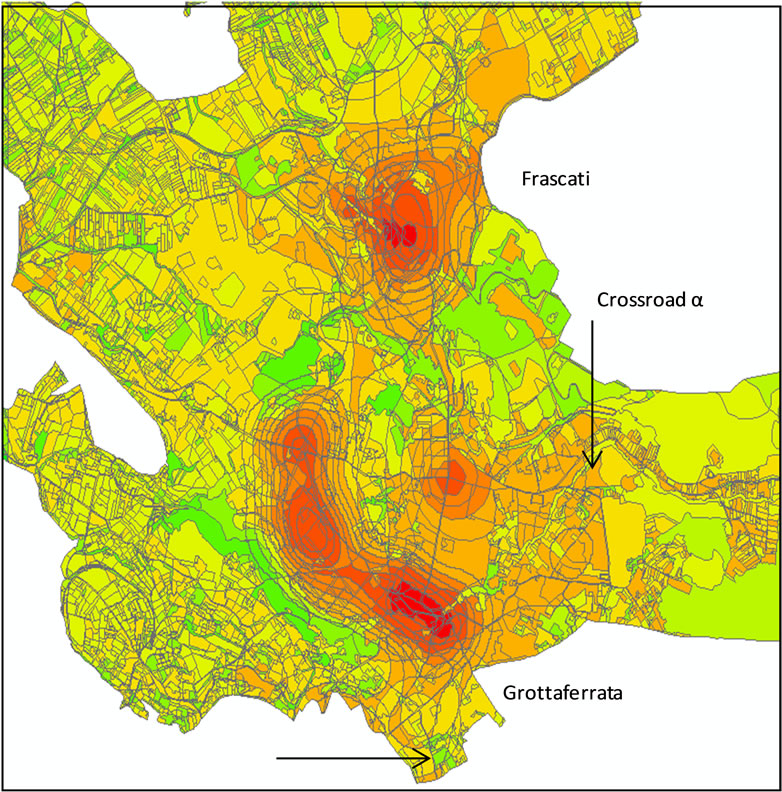
Figure 7. Cross-comparison between land use/land cover and traffic congestion coverage; zoning based on human disturbance due to the traffic flows (red: max; green: min).
higher environmental quality but located around areas with high values of traffic congestion will certainly be impacted by this phenomenon more than areas with the same environmental quality but which are far away from the red traffic congested areas.
The same analyses were carried out considering only the buildings of the two common objects of study. The buildings were classified according to the values of congestion through a colour code from red to green (red = max congestion; green = min congestion). In Figure 8 are clearly visible in red buildings that undergo major disturbances due to traffic congestion, in terms of high travel times, air pollution and noise.
The analysis of the congestion values indicates that areas with most traffic are those along the way MarinoGrottaferrata-Frascati with a nodal point in Squarciarelli, and the “Crossroad α”, which is, however, located off the above mentioned Grottaferrata-Frascati link.
At this point, a good indication of where to place measuring tools for a more complex and detailed analysis has been found.
5. Conclusions
The indirect method adopted in this study exploits the potential of Geographic Information Systems, which allow to obtain, for a given area, a range of information at different levels. Calculated data is very close to the real situation. Results of this study reveal a situation quite common in small towns in the Lazio region. These are municipalities that have endured over the last twenty years a major building expansion, often even illegal and without a good municipal plan.
In most cases, as in the case of Frascati and Grottaferrata (Figure 9), the main roads have remained the same as fifty years ago, while the urban texture has increased fivefold, and the road network converges in the same nodal points with an increase of both traffic and congestion. Obviously, the indirect method used in this study does not provide data as accurate as those obtained with the classical direct measurements of traffic flow, and it is not intended to replace it. On the contrary, it is supposed to be useful for getting a general idea of the traffic flows in a given area by identifying the critical issues at low cost.
In actual fact, this is enough to enable administrators to plan interventions and allocate resources minimising the risk of wasting them in unnecessary or low priority actions.
Finally, studies like this one may be preliminary to planning or optimizing a possible campaign of direct measurements. The results obtained are very important, not only in terms of knowledge of the congestion patterns,
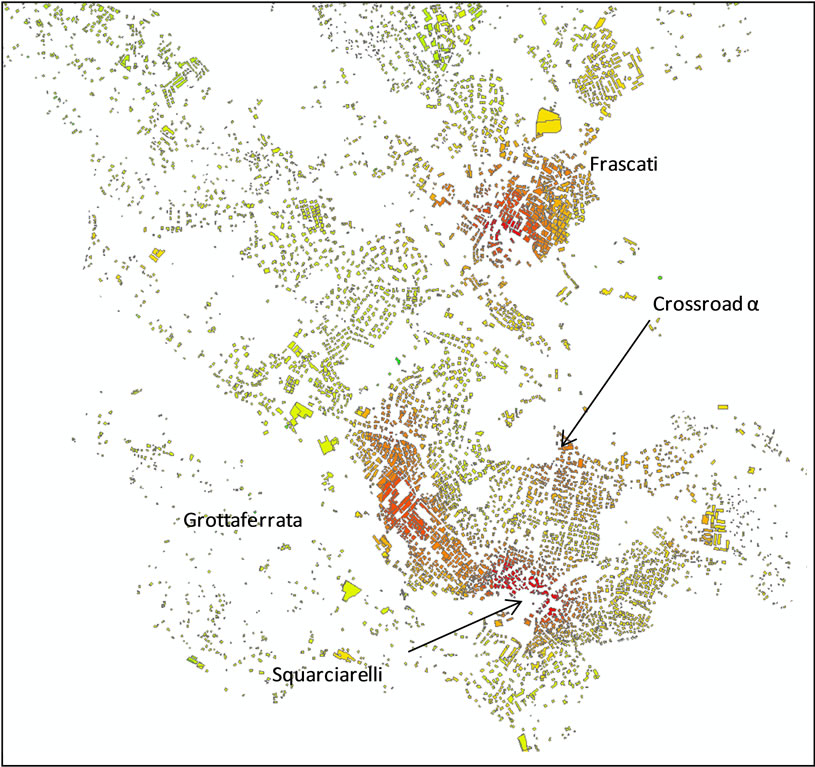
Figure 8. Classification of buildings in the municipalities of Frascati and Grottaferrata according to the values of the “Quality of Life” indicator (red: bad quality; green: good quality).
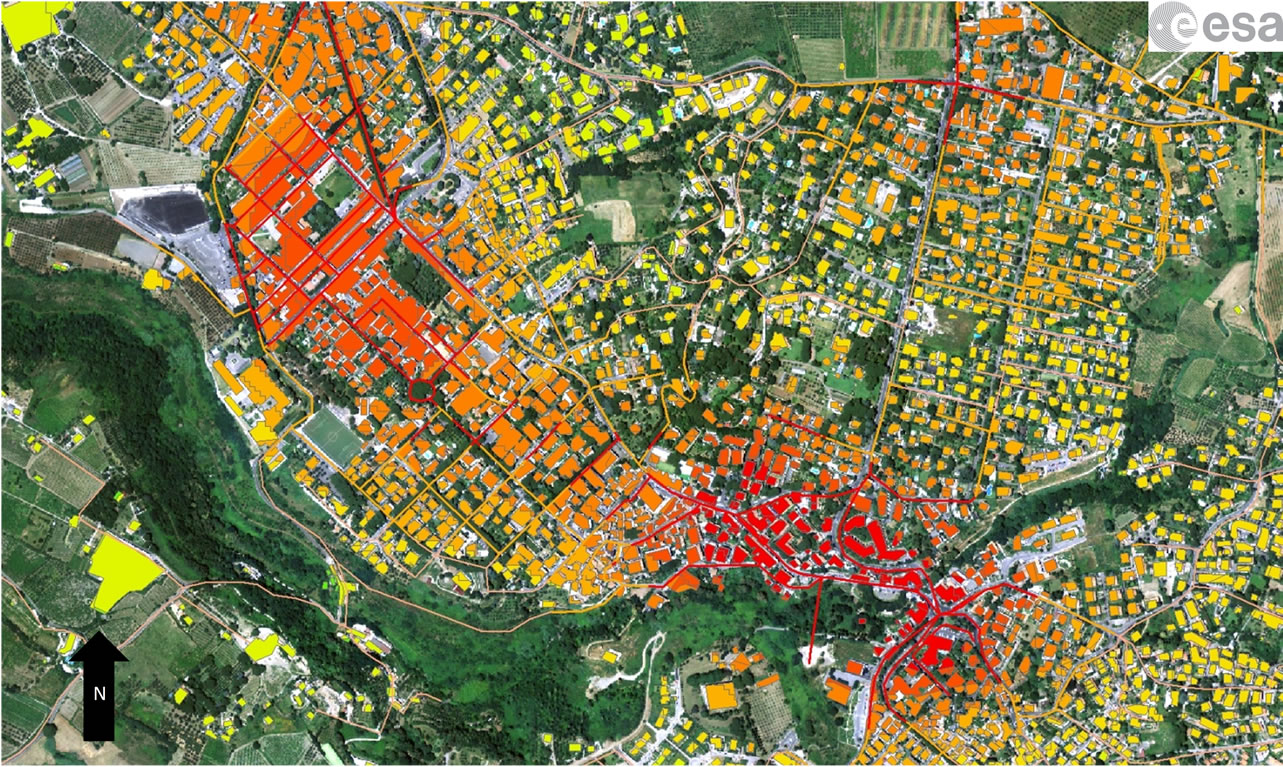
Figure 9. Classification of buildings and streets in the Grottaferrata municipality (Squarciarelli area) according to the values of the “Quality of Life” indicator and street congestion (red: bad quality-high congestion; green: good quality-lower congestion).
but also in terms of urban re-qualification and, thus, of planning for a better quality of life for the citizens. An operational GIS of this type should be a key tool for local governance for any administration!
6. Acknowledgements
Authors hereby express their gratitude to ESA/ESRIN (Frascati, Italy) and the EOP-SA Dept. for their availability and collaboration and in particular Dr. Chris Stewart for your helpful comments and constructive suggestions.
REFERENCES
- S. Maerivoet and B. De Moor, “Cellular Automata Models of Road Traffic,” Physics Reports, Vol. 419, No. 1, 2005, pp. 1-64. doi:10.1016/j.physrep.2005.08.005
- M. J. Lighthill and G. B. Whitham, “On Kinematic Waves: II. A Theory of Traffic on Long Crowded Roads,” Proceedings of the Royal Society A, Vol. 299, No. 1178, 1955, pp. 317-345.
- P. I. Richards, “Shock Waves on the Highway,” Operations Research, Vol. 4, No. 1, 1956, pp. 42-51.
- C. Kemper, “Dynamic Traffic Flow Model—A New Approach with Static Data,” Proceedings of the 5th European Congress and Exhibition on Intelligent Transport Systems (ITS), Hannover, 1-3 June 2005, pp. 1-13.
- E. Loret, “Estimation of Increasing Urbanization Trend in the Frascati DOC Wine Area: A Geostatistical Analysis Approach,” Geoinformation Ph.D. Thesis, DISP, University of Rome “Tor Vergata”, Rome, 2010. http://hdl.handle.net/2108/1431
- G. Gullotta, “An Application of Landscape Analysis Techniques to the Northern Sector of the Latium Volcano,” Degree Thesis, Sapienza University of Rome, Rome, 2010.
- A. Gatrell, T. Bailey, P. Diggle and B. Rowlingson, “Spatial Point Pattern Analysis and Its Application in Geographical Epidemiology,” Transactions of the Institute of British Geographers, Vol. 21, No. 1, 1996, pp. 256-274. doi:10.2307/622936
NOTES
*Corresponding author.