Journal of Geographic Information System
Vol. 4 No. 4 (2012) , Article ID: 22148 , 14 pages DOI:10.4236/jgis.2012.44035
An Interpretation of the Recent Evolution of the City of Barcelona through the Traffic Maps
Institut d’Estudis Territorials, Barcelona, Spain
Email: kerstin.burckhart@ietcat.org, jordi.martin@ietcat.org
Received March 9, 2012; revised April 7, 2012; accepted May 9, 2012
Keywords: Barcelona; Traffic Maps; Annual Average Daily Traffic (AADT); Mobility; Congestion
ABSTRACT
Annual Average Daily Traffic (AADT) maps show, in a comprehensive way for expert as well as non-experts, the evolution of the relatively recent past (1965) until the most current image (2005). They help to analyse Barcelona’s city street network and retrace traffic congestion. The changes in the traffic patterns are due to random actions, resulting from individual liberties and voluntary planning, serving the general interest.
1. Introduction
Within Spain, the city council of Barcelona was one of the pioneers in collecting data on average daily traffic intensity of the road traffic and processing these data. It started the records in 1965 and effectuated the counting almost yearly, except for some years for which data are missing for various reasons [1]. Through the application of Geographic Information Systems (GIS), the data can be presented in a comparative way, allowing the creation of Annual Average Daily Traffic (AADT) maps.
The visualization of statistical data in form of maps following a determinate time sequence is considered an important element, in order to enhance spatial analysis by stakeholders, politicians and other decision makers in the urban planning sector.
The city of Barcelona presents a special scenario during the analysed time period, i.e. from the year 1965 to the year 2005. Beside the fact of general motorization after the recovering of dictatorship (1970’s and 80’s), the hosting of the Olympic games in 1992 provided a dynamics in the town planning, which is reflected in the GIS application. An analysis of the maps elaborated for the present research help to identify the configuration of its mobility barriers and to determine changes in the city’s traffic flows.
2. Objective and Methodology
Annual Average Daily Traffic maps are seen as appropriate means to reflect traffic flows within a determinate area. The objective of the present paper is to depict the relation between specific traffic enhancement measures and the city’s traffic flow changes. The territory, subject of the analysis, is the municipality of Barcelona, which has a size of 100.39 square kilometres.
The methodology applied is based on a comparative temporal analysis. Despite the existence of annual data, the creation of annual maps is considered to be excessive for analysis and does not allow a clear vision of the changes in time. For this reason—and as applied in other territorial areas—intervals of five years or so has been chosen. In this way, all maps figuring in the present research cover the same area, but at different moment of time. Anyway, historical data sets were not collected in exactly years (1974 instead of 1975, 1978 instead of 1980, or 1986 instead of 1985). Similar methods have been used at European scale, such as the “2000 Combined E-Road Census and Inventory” [2], which presents a combined census of motor traffic and inventory of standards and parameters on the main international traffic arteries in member countries of the United Nations Economic Commission for Europe.
Regarding the area, analysed in the present paper, it is referred to the municipality of Barcelona. In the time period from 1965 to 2005, the demography of the city was not constant, but noted changes in time. After a significant growth in population between 1940 (1 million inhabitants) to 1960 (1.5 millions inhabitants), the increase slowed down, but continued until reaching a peak of 1.7 million inhabitants in the 1980’s. Up from this moment, the population diminished gradually, reaching a low in the year 2000 of 1.5 million inhabitants. Towards the year 2005 the population recovers and passed 1.6 millions inhabitants [3].
With reference to the spatial localization of the analysis, a general map (figure 1) is displayed to facilitate the understanding of the AADT maps and its analysis. The street network of Barcelona has to be understood up from its topographical and territorial planning point of view. The main characteristic of the city is in the first place its localization between the sea and the mountain range (Collserola mountain with an elevation of 530 metres) which makes up two natural barriers. At the same time several minor hills are located within the city. The city is limited to the west and to the east by two rivers the Llobregat river and the Besòs river. In the second place, the rectangular street grid is another worth-mentioning characteristic of the city. This grid arose from the Cerdà plan in the late 1850’s [4]. This plan dotted the city with wide and strait streets, very uncommon in cities at that time, i.e. more than 50 years before the invention of the car.
The map details the chess board grid created by the Cerdà plan with the main axis parallel to the sea: Gran Via street and Aragó street, 3 diagonal avenues: Paral·lel, Meridiana and Diagonal avenues and streets connecting the interior of the city direction mountain—sea: Numància, Entença, Urgell, Aribau, Balmes, Passeig de Gràcia and Via Laietana. Two levels of ring roads exist: the inner ring road, segmented into Brasil, Carles III and Ronda del Mig, and the outer ring road with its coastal part (Ronda Litoral) and its upper part (Ronda de Dalt). In order to eliminate topographic barriers, the tunnel of Rovira (within Barcelona) and the tunnel of Vallvidrera (between Barcelona and the suburbs) were created. The cities main axis are connected to the regional (C-31 road) and national (AP-7 and AP-2 motorways) road network.
3. Barcelona, 1965: Economic Growth and Increase of the Pressure on the Road Network
In 1965 the first map (figure 2) of average daily road
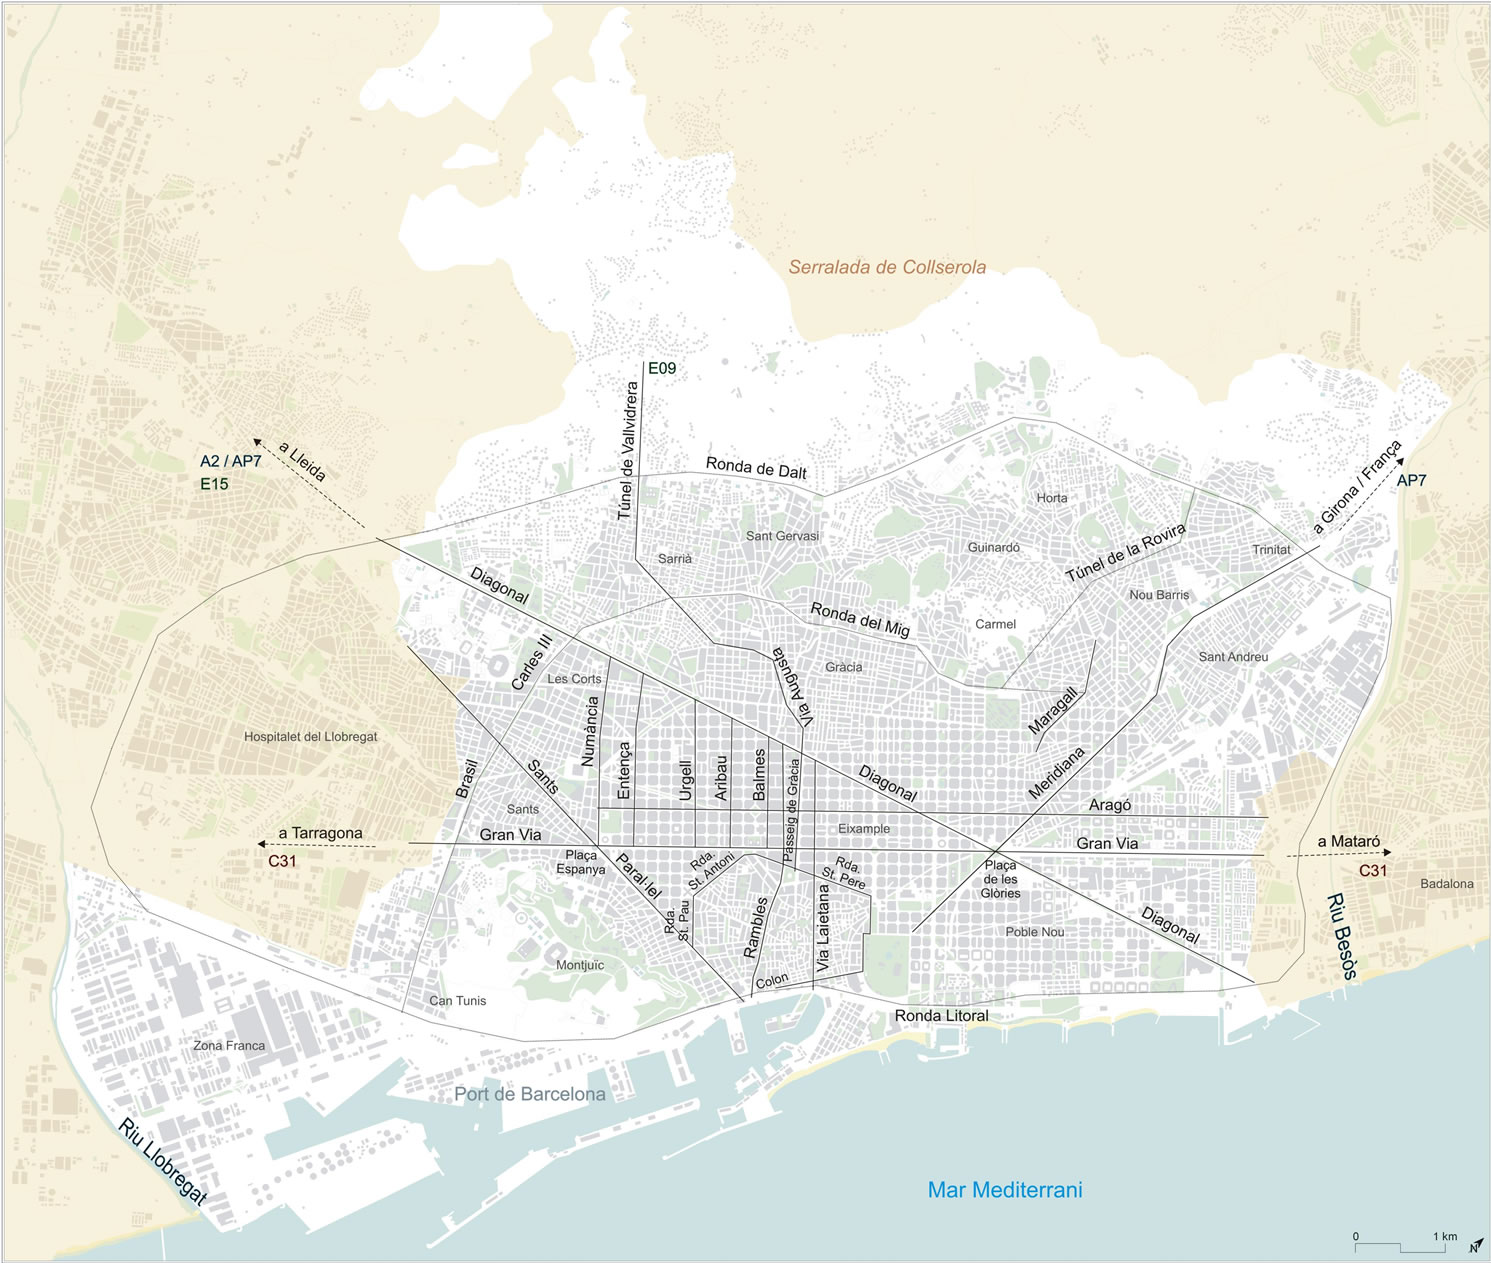
Figure 1. Map of Barcelona with main street and quarter names.
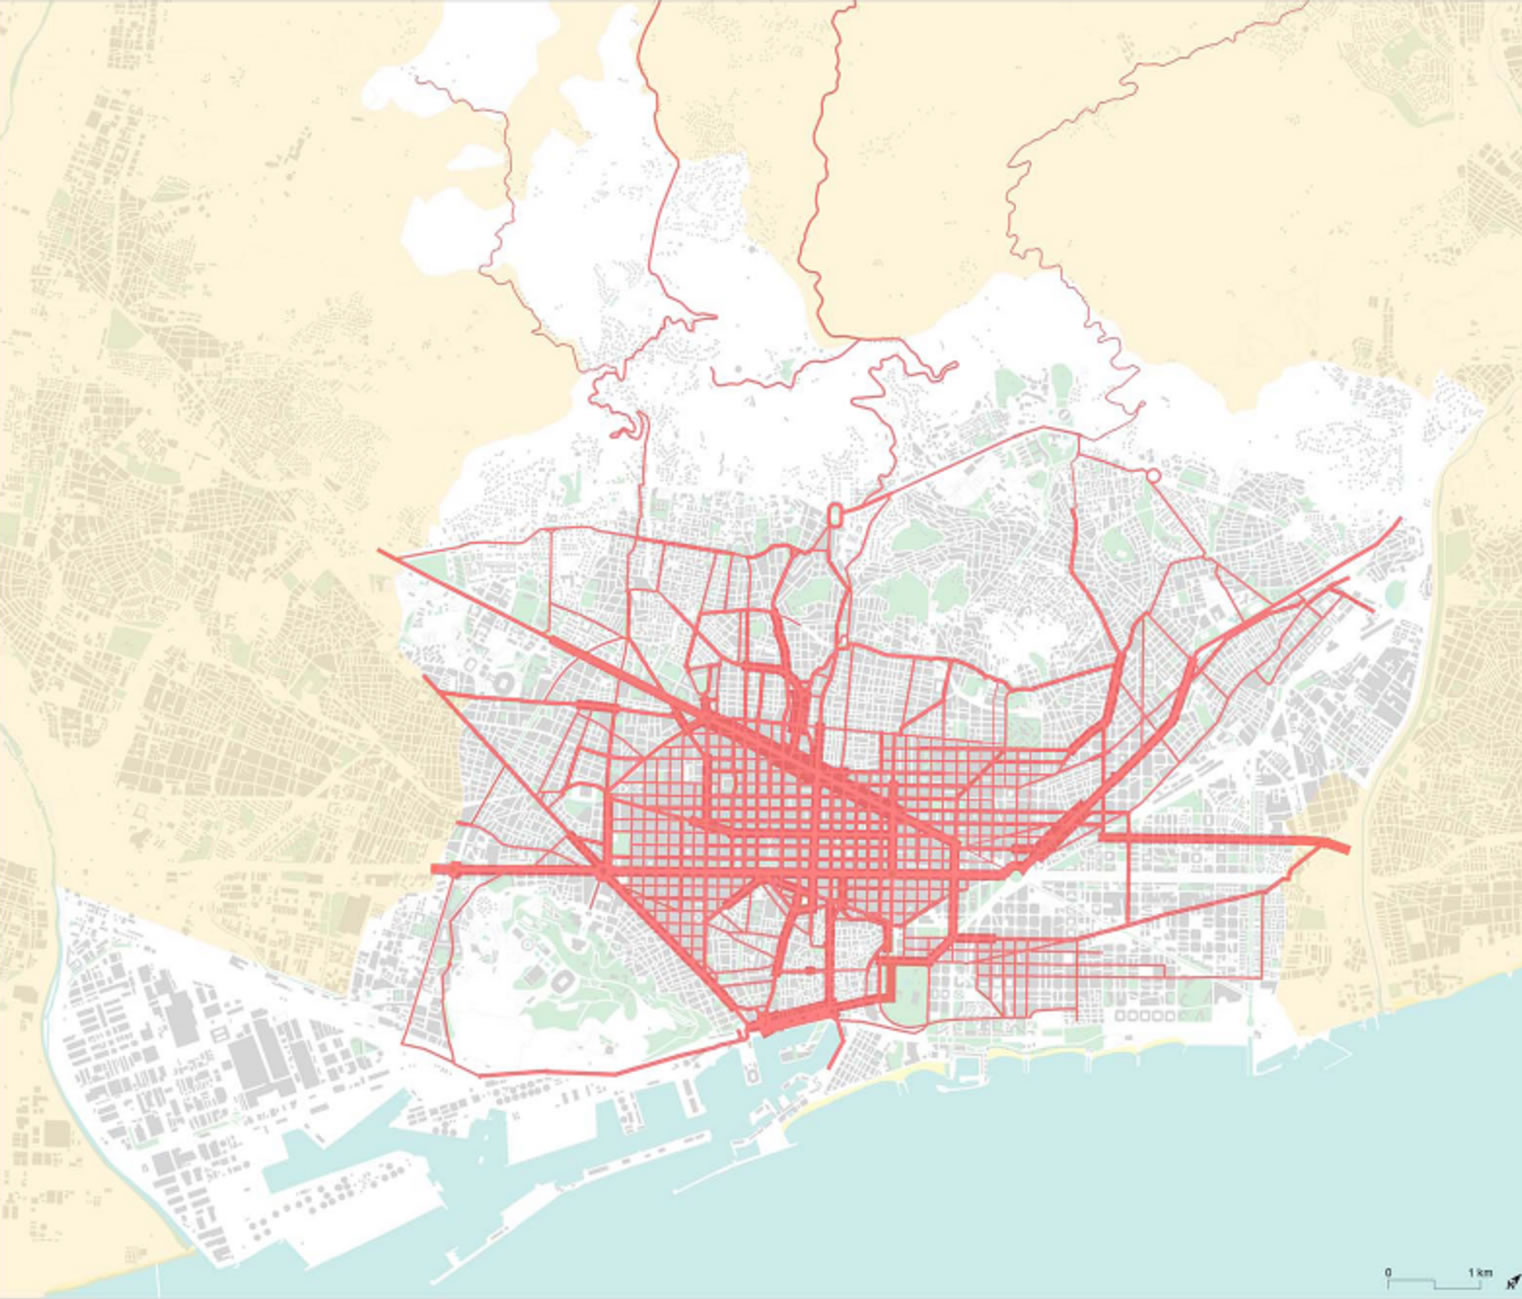

Figure 2. ADDT map of Barcelona (year 1965).
traffic densities of Barcelona was elaborated. In the 1960’s, often called in a negative way the period of “development” (Spanish “desarrollismo”), a significant demographic growth was observed at the mains cities, basically due to immigration. This pressure on the city of Barcelona allowed putting on proof the suitability of the Masterplan of Cerdà, initiated a century ago, to organize the road traffic. The significant immigration was coinciding with the important growth of the economy and the motorization rate, resulting in a considerable growth of traffic flows in all city quarters.
The Masterplan of the Eixample (Barcelona city extension quarter), created by Cerdà in 1859 depicts a reticular urban street network. In this sense, Cerdà was a pioneer of his time and of the massive motorization, by planning wide streets allowing that movements on foot or with carriages could be realized comfortably. The reticular network facilitates a homogenization of the traffic densities: no axis of the network is predominant and therefore, the traffic is distributed in an egalitarian way, except for the “transcendental axis” (“vies transcendentals” as Cerdà called them) to connect with the “universal network” [4].
It is easy to observe two fundamental elements in the street network of Barcelona in the map of 1965: three main axes and the reticular pattern of the network. The Diagonal Avenue, Meridiana Avenue and Gran Via de les Corts Catalans have a similar traffic flow distribution, as both streets cross Barcelona and connect the city with the surrounding area. For this reason, they are the most used axis for intra-urban and interurban trips. At this stage, the stretch of the Gran Via de les Corts Catalanes is not yet open behind Glòria Square, and in 1965 it does not have the importance, it would reached later on.
On the other hand, the streets of Creu Coberta, Parallel, Aragó, Muntaner and Balmes will absorb an increasing traffic due to their special conditions, which will be specified later on, although they show a very high traffic volume already at this stage.
A local phenomenon, worth mentioning, is the high occupation of the Passeig Colom, due to the intense traffic generated by the harbour of Barcelona. The vehicles with origin or destination to the harbour in the lower part of the city have two basic access routes: Via Laietana and Rambla streets. The later one will convert into a preferential space for pedestrians, while Via Laietana street will gradually get more used by the motorized traffic.
The second characteristic is the effect on the traffic flow distribution. In 1965, the network, in form of a regular pattern in the Eixample quarter, absorbs the majority of the urban traffic, with few axes that reach beyond it. The fact that nearly all streets have similar characteristics (number of lanes, introduction of one-way streets and elimination of the corners at the blocs, which doubles the space at the crossings) results in traffic flows which distribute themselves within the whole network.
The most relevant informative value of the average daily traffic intensity map is the detection of missing infrastructures: the majority of the quarters around the Eixample have only narrow streets, no capacity to organize the growing motorized mobility and areas “in white”, which allow identifying impenetrable “walls” (barriers) and quarters which are clearly badly connected. This confirmation, easy to observe thanks to the traffic maps, helps to plan and program the future road system and to make a follow-up of it.
4. Barcelona, 1970: The Beginning of the Opening of the City
On the map of 1970 (figure 3), once more a significant traffic flow density can be observed on the axes, which cross Barcelona and which connect the city with the exterior: Diagonal Avenue, Meridiana Avenue and Gran Via de les Corts Catalans street. At the same time, it can be noted that the chess board grid planned by Cerdà supports very well the traffic of great part of the interior of the city and moreover, absorbs the flows of throughtraffic of the national road N-II (national road which connects Madrid with France passing La Jonquera).
Some streets register short stretches with high intensities: Via Laietana street between Ronda de Sant Pere and Passeig Colom, for the ealier mentioned reasons; the Passeig Colom, as it is the only natural access to the harbour of Barcelona; Via Augusta, as preferential connection with the higher part of Barcelona (quarters of Gràcia, Sant Gervasi, Sarrià, etc.) at the northern part of Diagonal Avenue; and some other stretches (Passeig Maragall, connection with the quarters of Horta, Carmel, Trinitat, etc.).
The intense demand on some of these exclusively urban streets (they have no immediate access/exit to/from the city) should be due to the fact that they gather the traffic flow from many affluent streets: for example, Via Laietana receives the majority of the traffic flows coming from Passeig Colom, the Barceloneta quarter and the harbour of Barcelona.
In this sense, two preferential streets are highlighted (due to the number of lanes as well as for their continuity in the direction sea—mountain): Muntaner and Balmes streets. The vehicles which circulate in an intra-urban trip of a certain length search for the few wide and long streets which take them quickly in direction sea-mountain or in direction Llobregat river—Besòs river.
At the high intensity stretches an interesting coincidence is revealed. They are singular areas, seen from the point of view of intersection: here different streets converge and, moreover, this confluence produces a zone that does not respond to the morphology of the squared network. This can be observed at the stretch where Gran Via de les Corts Catalanes street connects obliquely with the Ronda Universitat, at the same time as Balmes and Muntaner streets connect with it.
In the coastal area, the “provisional industrial belt”, formed by Passeig Colom, Icària Avenue and the parallel streets of Badajoz—Àvila and Llull—Pujades, absorb a lot of heavy traffic coming from the harbour of Barcelona and entering into Pere IV street, which during more than one century had to support the harbour traffic and a huge part of the through-traffic of the national roads towards France.
5. Barcelona, 1974: The Necessity of the Ring Roads (“Cinturons” and “Rondes”)
The essential piece of the new scenario (figure 4) is the opening of the Ronda del Mig (Middle ring road), a ring road, which gives permeability to the quarters which earlier were hardly penetrable (Can Tunis, Sants, Les Corts, Sant Gervasi, Gràcia, Guinardó…). The stretch of the Ronda del Mig ring road, formed by the Carles III Avenue registers, despite its recent opening, high traffic flow level. The new infrastructural offer absorbs a demand which did not exist before, provoked by extraordinary flows generated by immigration (between 1950 and 1970),
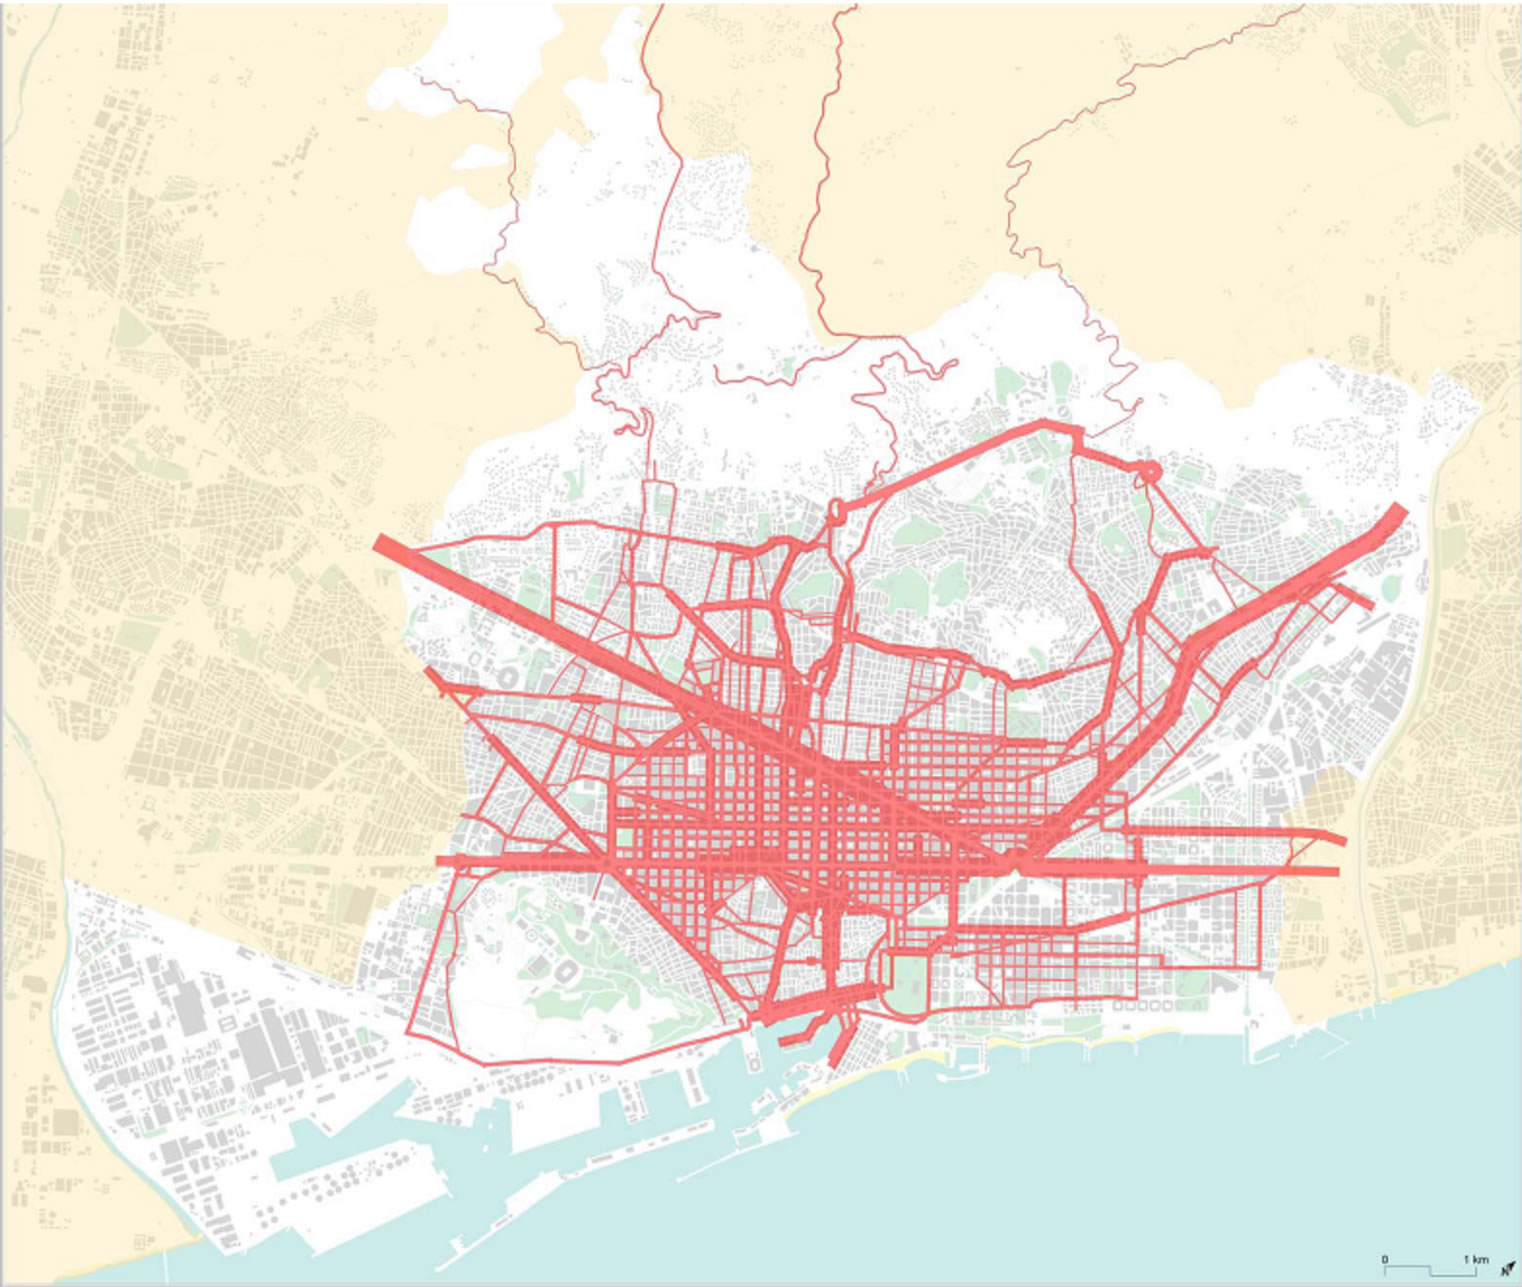

Figure 3. ADDT map of Barcelona (year 1970).
the increase of income and the growing motorization.
The opening of this ring road improves the quality of life of many citizens, because crossing the city becomes relatively comfortable and it presents a quite interesting option for the through-traffic (internal and external) which is no longer obliged to use the narrow streets of the labyrinth-like quarters nor overcharge the Eixample quarter.
But it can be also observed, that the new infrastructure does not discharge sufficiently the centre, as the capacity increase is inferior to the increase of the demand or because the Ronda del Mig ring road is used by new users. In any case, the streets of the Eixample quarter have for the first time an external collaboration.
On the one hand, a certain volume of traffic starts to be registered on the itinerary which later on would be the Ronda de Dalt ring road. The drivers search and find alternatives to cross the city without the necessity to pass through the centre. This tendency, together with the high occupation of the Passeig de Colom street, indicates the city’s future ring road system as an answer to the congestion in the city centre: the Ronda del Mig ring road and the alternative provisional itineraries of the coastal ring road and the upper ring road (Ronda Litoral and Ronda de Dalt).
On the other hand, a considerable increase of the number of vehicle, which circulate through Aragó and Gran Via de les Corts Catalanes streets, can be observed,
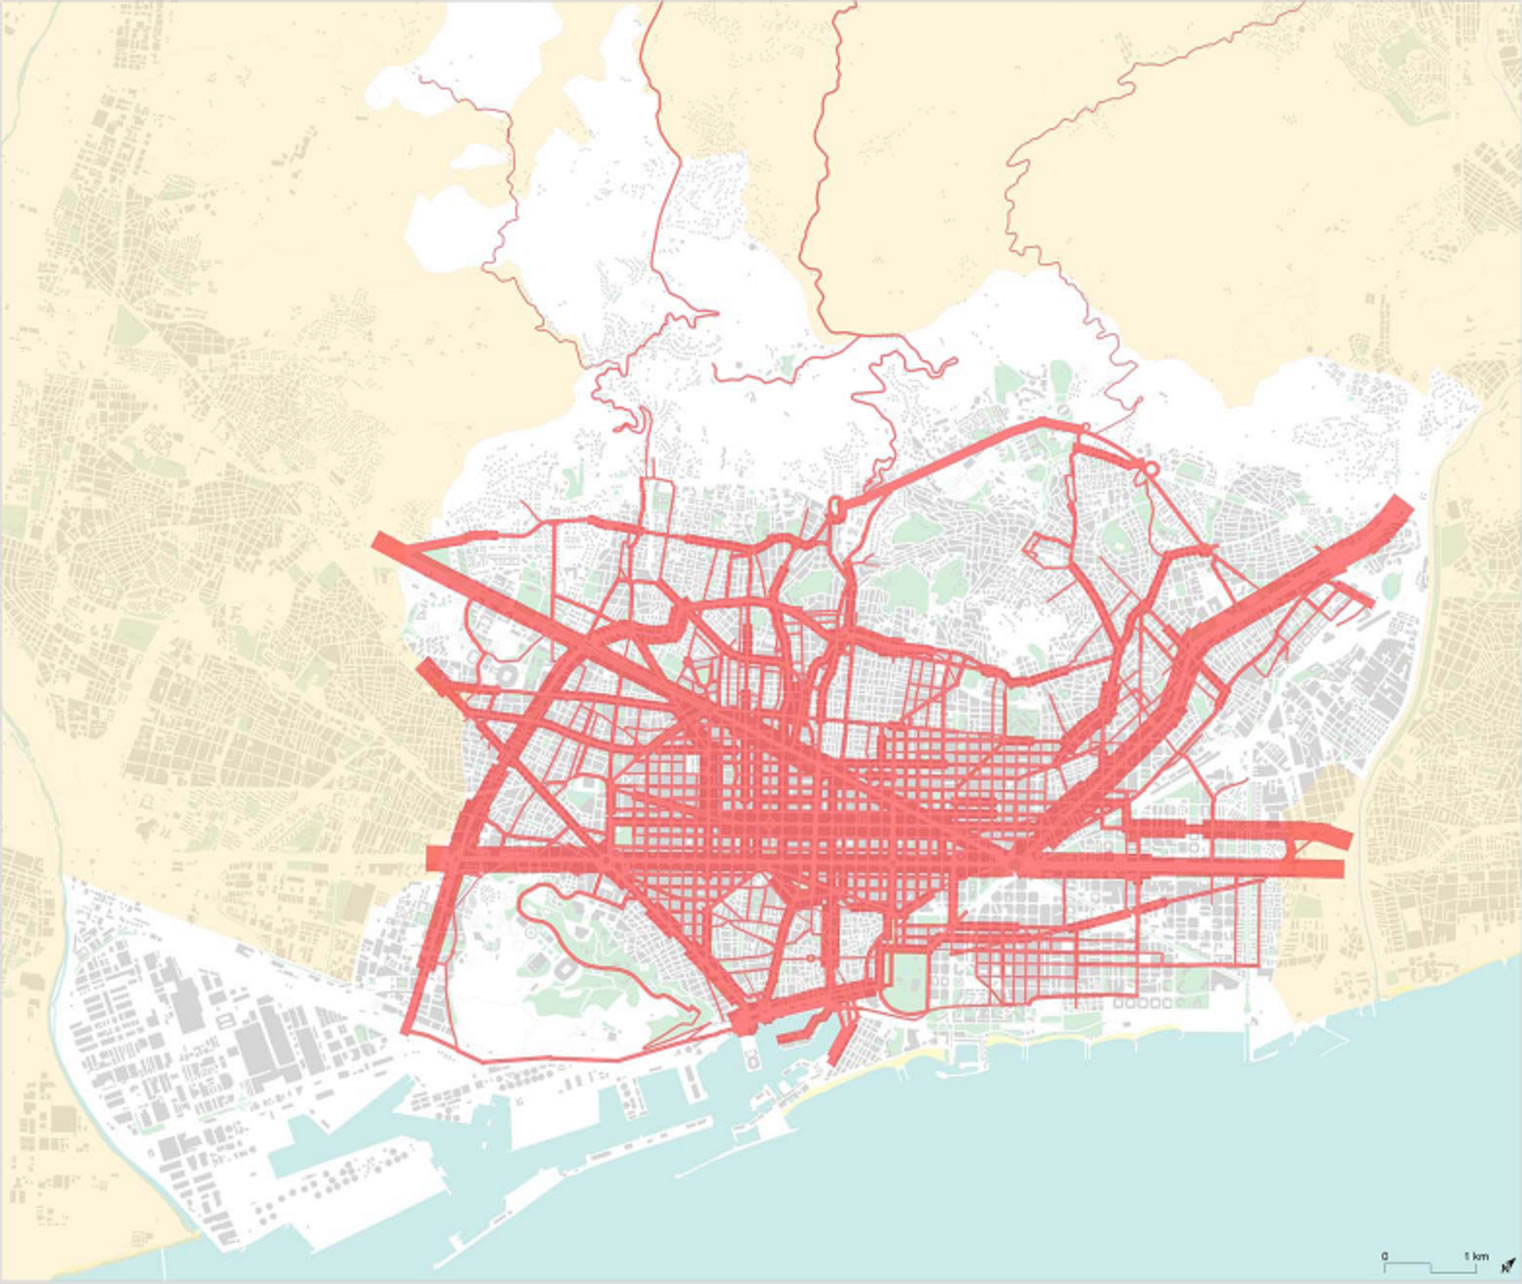

Figure 4. ADDT map of Barcelona (year 1974).
due to the fact that one-way circulation is established and a green wave traffic-light synchronization is introduced. The role of these two streets, and also of the Diagonal Avenue and the Meridiana Avenue, is to support in a spectacular way the arrival of the motorways which enter into Gran Via de les Corts Catalanes street (coming from the city of Mataró), the Meridiana Avenue (for the traffic flows coming partly from the cities of Sabadell and Terrassa and partly from Granollers and Girona) and the Diagonal Avenue (coming from the city of Molins de Rei).
6. Barcelona, 1978: The Metropolitanization of the Traffics
Until 1974 a relatively constant and progressive traffic increase on the city’s main streets is observed: Gran Via de les Corts Catalanes street, Meridiana street, Diagonal Avenue or Aragó street. But suddenly, some of the busiest streets note important decreases (figure 5).
In 1974 the part of the motorway between the cities of Martorell and Mollet, called the Third Ring, opened, with the aim to establish an itinerary outside Barcelona so that many traffic flows which do not have Barcelona as origin or destination no longer have to cross the city centre. It is a way of eliminating congestion in the centre and the entrance and exit roads (Meridiana Avenue, Diagonal Avenue, Gran Via de les Corts Catalanes street and Aragó street). Nevertheless, the new part of the motorway absorbs only part of the through-traffic. The rest

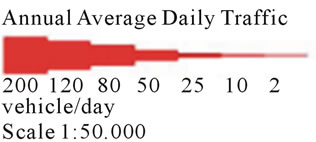
Figure 5. ADDT map of Barcelona (year 1978).
of the vehicles use the lateral lanes (B-30) or continue to use Meridiana avenue and Diagonal avenue.
On the map of 1978 three main elements show their effect on the traffic flows: the Ronda del Mig ring road (from the Passeig de la Zona Franca street to the Ronda del Guinardó ring road), the access motorways to the city and the transformation of some main streets in one-way streets: Aragó street (between Meridiana Avenue and Tarragona street), the central lane of Gran Via de les Corts Catalonaes (between Plaça Espanya square and Glòries square), Urgell street (between Ronda Sant Antoni ring road and Paris street) and the Sarrià Avenue.
The crossing of Plaça Francesc Macià square is a point which experiences the clearest reduction of permanent congestion. It is the first time that the pattern of the Cerdà plan has no longer to support a considerable part of the through-traffic thanks to the help of the new reticular supra-municipal network, formed initially by the costal motorway (from the city of Mataró to the Glòries square in Barcelona), the motorway Sabadell-Terrassa and the motorway between Granollers and Vilafranca del Penedès.
The metropolitan master plan of Barcelona (Pla General Metropolità de Barcelona) (1976) gives an official status—within the territory of the Municipal metropolitan entity of Barcelona (Entitat Municipal Metropolitana de Barcelona) with 27 municipalities of the “county of 1953”—to the basic pattern of the metropolitan area (164 municipalities and 7 counties), designed by the masterplan of the metropolitan area of Barcelona (Pla Director de l’Àrea Metropolitana de Barcleona), which is approved “by internal administrative effects” in 1968.
Ildefons Cerdà’s principal of the “continuity of movement” [5] started to be applied in Catalonia, within the metropolitan area, where in that moment already 70% of the Catalan population lived—and still nowadays lives.
A “new transcendental street” for accessing and exiting Barcelona also starts to be materialized, formed by the Rovira tunnel, at that time not yet finished, and the Horta tunnel, due to be started. Both are included in the general metropolitan plan (Pla General Metropolità) of 1976.
7. Barcelona, 1986: The Bases of a New Traffic Infrastructure
A fact originated before 1978, was clearly reflected in the map of 1986 (figure 6): “the biological fact” [3] that signifies the beginning of the democratic normality and a deep change in the regional and local governance (1975). At the same time, the development of the general metropolitan plan (Pla General Metropolità) and the perspectives on the possibility to host the Olympic games of 1992 (the petition was presented in 1982) opens a period of optimism and dynamics.
Two important actions start to be reflected on the traffic map. Firstly, the opening of a part of the coastal ring road (Ronda Litoral) (between Zona Franca avenue and
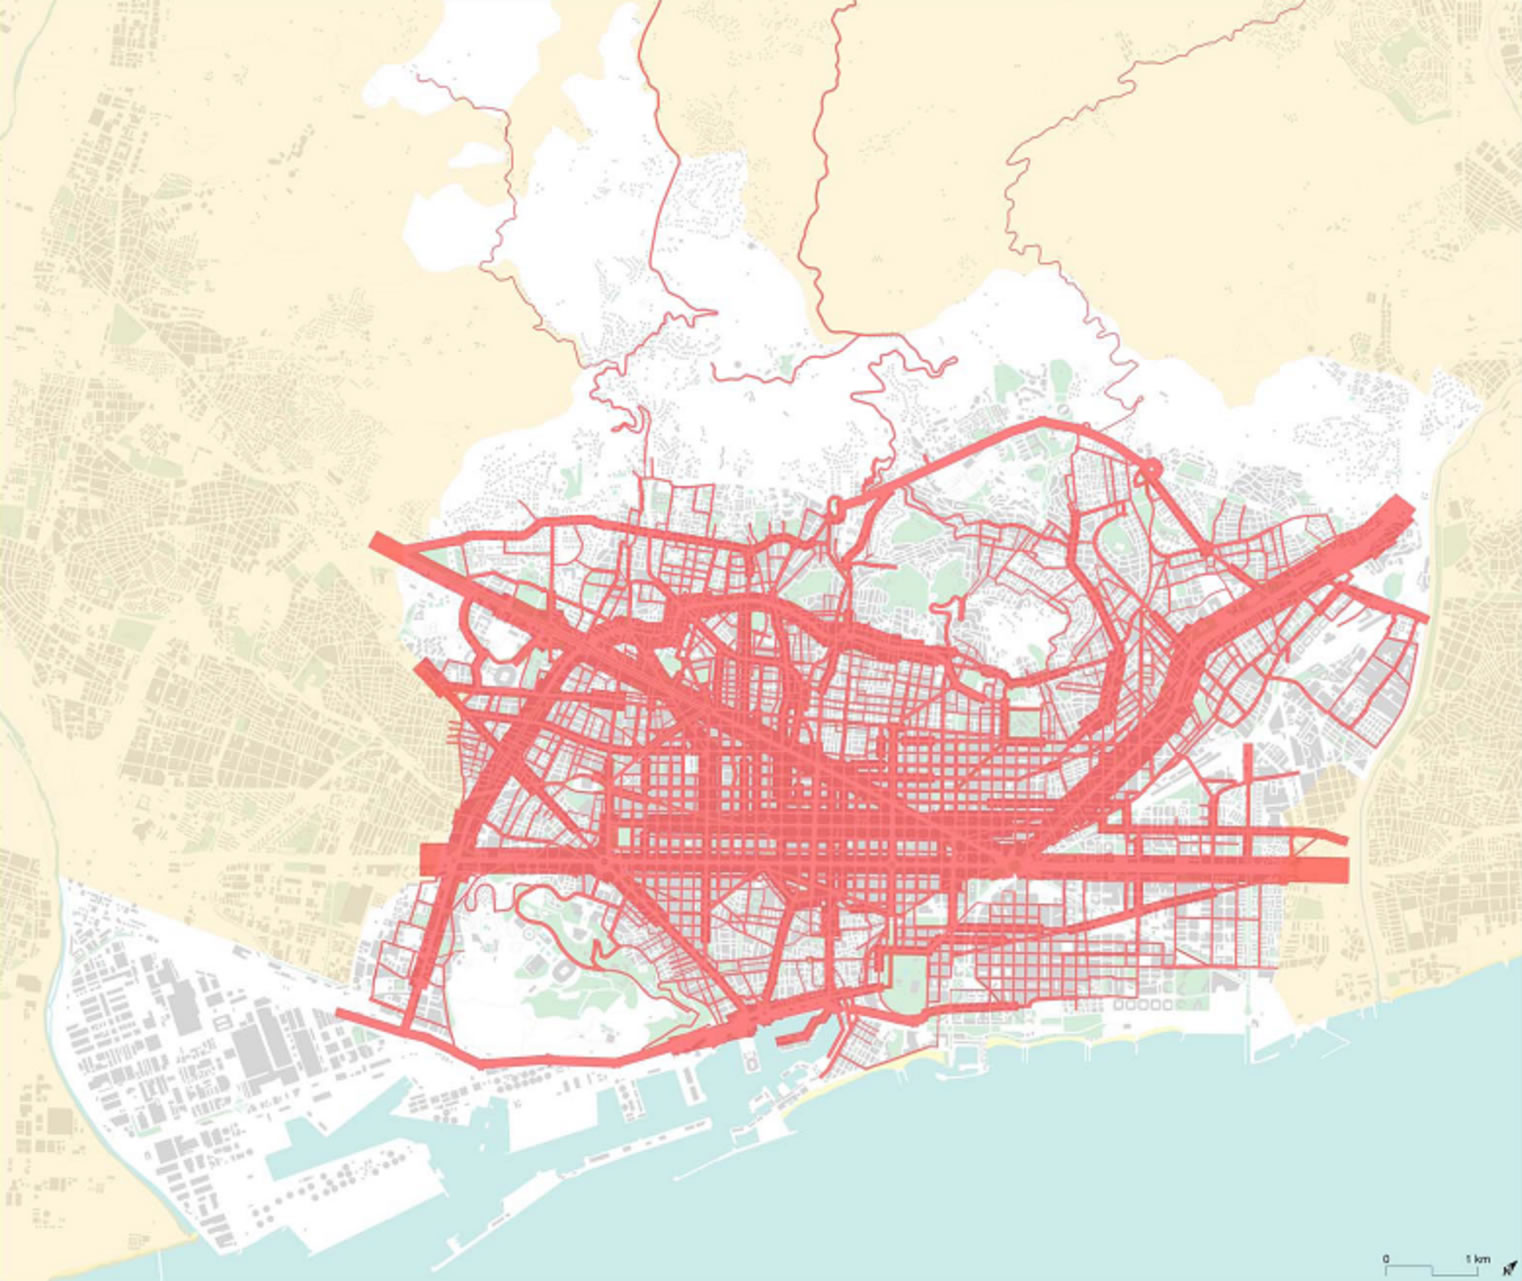

Figure 6. ADDT map of Barcelona (year 1986).
the Morrot area) which improves the access to and exit from the harbour of Barcelona; and, secondly, the beginning of the works on a part of the Ronda de Dalt, the upper ring road, despite being interrupted twice due to the opposition of some groups, allowed to open quite a long part (from Meridiana Avenue to República Argentina Avenue), thanks to the provisional actions of the city council of Barcelona, which connected the urban streets with the unfinished parts of the ministry of public works.
The opening of provisional itineraries at the coast and the mountain areas contributed, together with the perspective of the Olympic Games and the opening of the Vallvidrera tunnel, to create a favourable climate to consolidate the two ring roads. They facilitate the studies which would be essential up from the nomination of Barcelona as Olympic city (1986). The fact that the city had an existing general planning and alternative studies, helped to realize the “miracle” of complying with the short deadlines between 1986 and 1992.
8. Barcelona, 1990: The Maximum Saturation
In 1990 the urban road network of Barcelona reaches its maximum level of occupation: many of the main streets reach their maximum intensity within all the analyzed years (figure 7).
The situation of Gran Via de les Corts Catalanes street, Aragó street, Meridiana avenue and Ronda del Mig ring road is a paradigm: after the strong decrease experienced
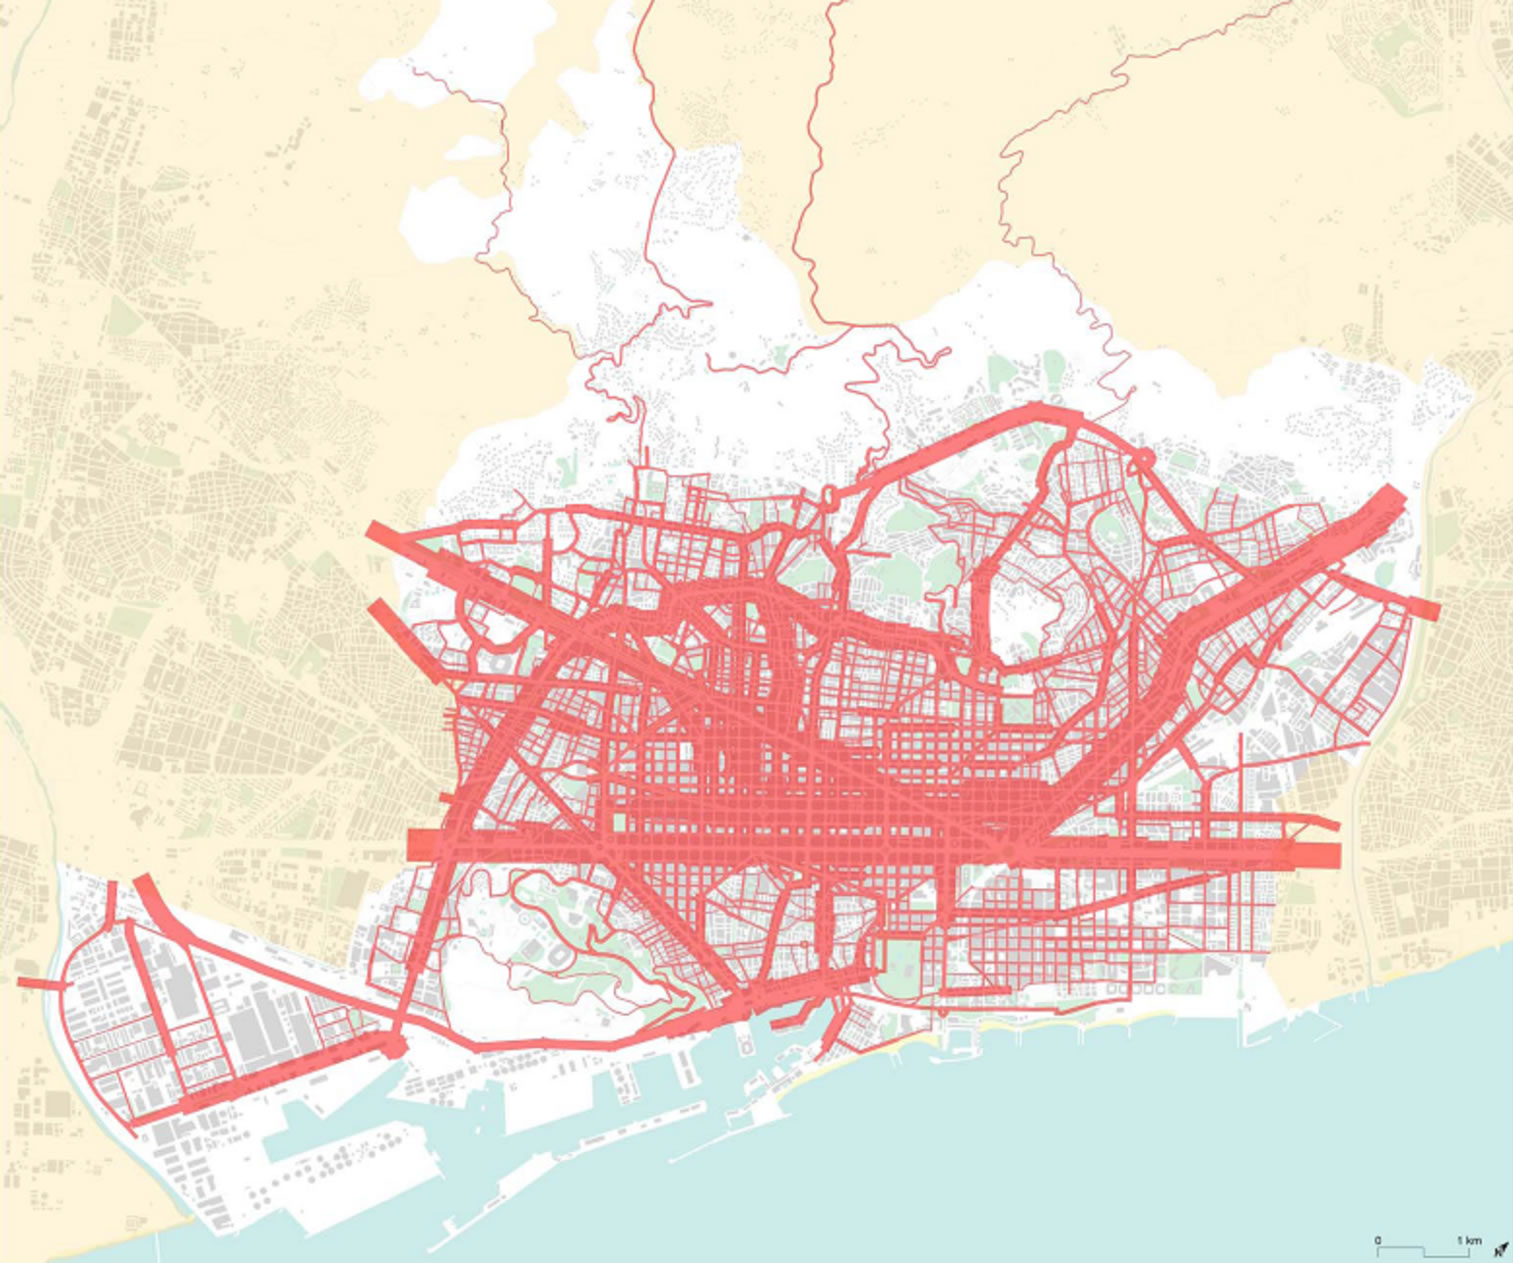

Figure 7. ADDT map of Barcelona (year 1990).
in 1986, they increase the traffic flows until reaching maximum levels of intensity.
Aragó street, at its crossing with Meridiana Avenue, registers extraordinary levels of intensity. The same happens to Meridiana Avenue which, together with the Gran Via de les Corts Catalanes street is the most frequently used entrance to Barcelona. The Diagonal Avenue continues to register important intensities, but the growth is more gradual: it seems that the traffic which circulates on this street is less sensible to the new infrastructures, as it does not register as much fluctuations during these years as Meridiana Avenue and Gran Via de les Corts Catalanes street.
The Ronda del Mig ring road has been converted into a street with capacity to canalize the traffic within the urban network outside the Eixample quarter, especially the part of the Ronda General Mitre ring road between Diagonal Avenue and Plaça Lesseps square.
The Rovira tunnel (1991) has to be highlighted, which immediately attracted a significant traffic volume, connecting the Ronda del Mig ring road, with the road, which later on would be the Ronda de Dalt ring road, offering the connection of the quarters of Horta and Carmel with the chess board pattern of the Eixample quarter. The Ronda del Mig ring road and the Rovira tunnel are the first actions with a vision to make more permeable the city, i.e. the wall (12 km) of continuous quarters established due to a growth lacking global planning. It is illustrative to compare the map of 1990 with the one of 1965 to observe the effects of the new itinerary.
At a more local level, the intensities registered in Balmes street between Diagonal Avenue and Ronda del Mig ring road, as well as some parts of Via Augsuta street and Muntaner street are significant. They are a clear proof of the lack of a connection mountain—sea. The hypothetic connection between Via Augusta street and the future Vallvidera tunnel with the chessboard street network of the Eixample would pass inexorably through Numància street, Entença street—Sarrià Avenue and would be the second important action to increase the permeability to the west of the city, i.e. the earlier mentioned wall of a length of 12 km between the Besòs and the Llobregat rivers.
9. Barcelona, 1993, Opening of the Ring Roads (Rondes)
One year after the Olympic Games of 1992, with a deep remodelling of the city which the event promoted, the panorama is very different compared to three years before (figure 8): the ring roads have been opened, main infrastructure of the last years, which pretends to reduce the through-traffic within the city.
The opening of the ring road (Ronda de Dalt (upper ring road) and Ronda del Litoral (coastal ring road)) provokes a sensible decrease of the intensity in the main urban streets. A progressive decrease of the level of vehicles in Meridiana Avenue and Aragó street can be observed. Most of the traffic flows entering Barcelona through Meridiana Avenue and Aragó street use the ring roads. The same can be said with reference to the Gran Via de les Corts Catalanes street and the coastal ring road. Taking advantage of this decrease, Aragó street and Meridiana Avenue which until this moment were used nearly exclusively by the through—traffic, are “civilized” and their lanes are narrowed creating much wider walkways in order to gain space for pedestrians. This type of action seemed to be impossible only some years ago.
The Ronda del Mig ring road continues registering significant flows. Also streets like the Via Laietana, Balmes and Muntaner continue to support heavy traffic flows: the opening of the ring roads does not seem to affect these streets a lot, which indicates that they support basically interurban traffic and in the direction sea-mountain.
But at the same time, they notice the opening of a new infrastructure: the Vallvidrera tunnel and its accesses. The new itinerary through the Collserola mountain range generates relatively little traffic due to two reasons: the lack of a planned connection with the Eixample quarter and the system of exploitation through direct toll. The lack of a direct connection with the Eixample quarter provokes an increasing traffic flow on Via Augusta street, which quickly converts into a congested road, affecting the efficiency of the new infrastructure through the Collserola mountain range.
Regarding the global effect of the ring roads, it is important to consider one element: the fact that intensity registered directly after its inauguration is higher than the intensity of the pre-existing streets. This gap between infrastructure demand and offer can be explained by the increase of income per capita and the motorization, without reaching the capacity of the new axis (which connects the Vallès regions with a road of European interest, the E-09) and the lack of improvement during nearly a century in the railway network.
10. Barcelona, 2000: Consolidation of the Decentralized Model
The last year of the 20th century showed few significant variations regarding the traffic flow intensities (figure 9): the tendencies observed after the Olympic Games and the opening of the ring roads persisted. The traffic flow intensities continued to decrease in some areas, especially the most centric ones: Meridiana Avenue, the central part of the Ronda General Mitre ring road, Aragó or Balmes
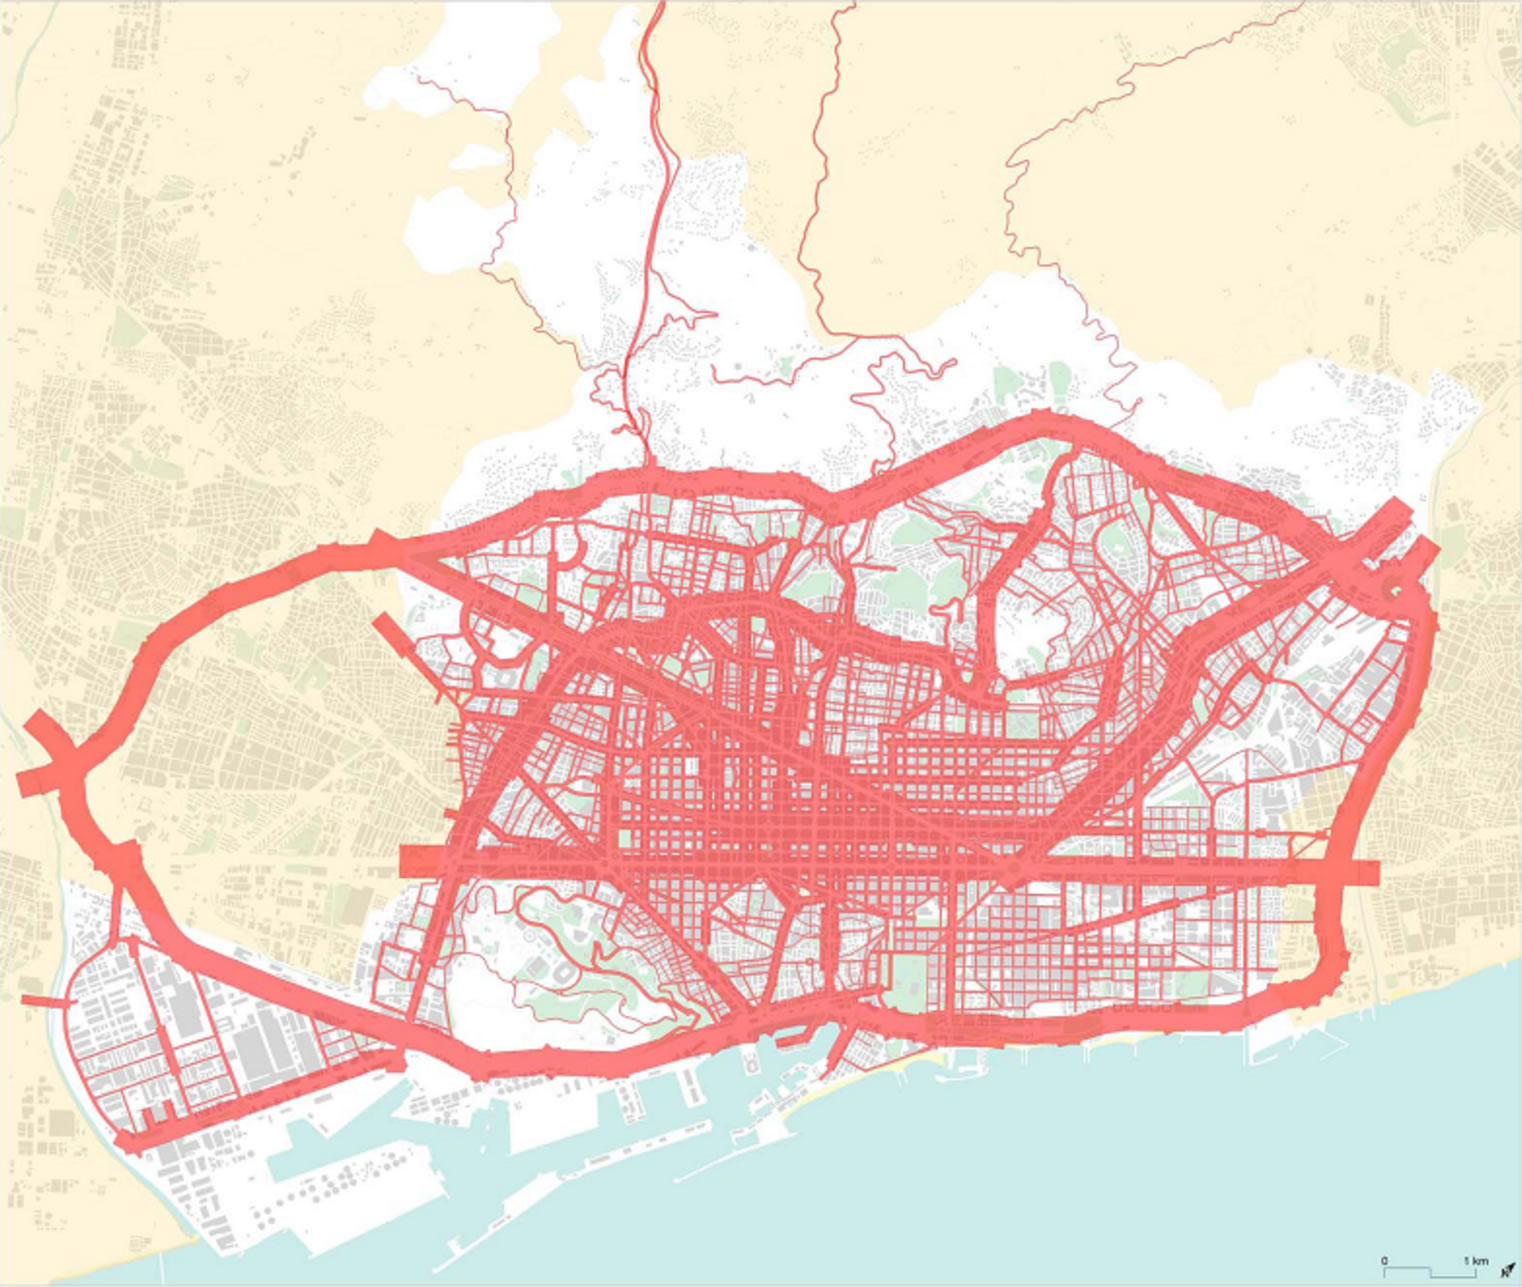

Figure 8. ADDT map of Barcelona (year 1993).
street above Diagonal Avenue.
The Vallvidrera tunnel increases the traffic sea-mountain slowly but continuously, while the intensity at the Rovira tunnel increases considerably. The later one converts into the most efficient north-east connection in the city, between Ronda del Mig and Ronda de Dalt ring roads, while at the first one, Via Augusta street to the north west of the city does not connect directly to the Eixample quarter.
Moreover, it becomes obvious that the importance of the AP-7 motorway, the B-30 road and the ring roads as alternative roads contribute to eliminate congestion in the city centre and to liberate the city from the through-traffic (long distance and flows between quarters and the population of the periphery of Barcelona at the south of the Collserola mountain range).
The elimination of the direct toll on the AP-7 motorway and the increase of the efficiency of the Ronda de Dalt ring road (with the extension outside the municipal limits of Barcelona: Southern and Northern part) allowed to be used as alternatives for getting to the cities of Sant Cugat, Cerdanyola, Sabadell or Terrassa, avoiding the direct toll of the Vallvidrera tunnel.
It can be observed that the reduction of flows thanks to the lateral lanes (B-30) and the elimination of the direct toll in this part of the motorway persists only a short time. The increase of vehicles in circulation has been absorbed by the main streets, mainly the Eixample quarter.
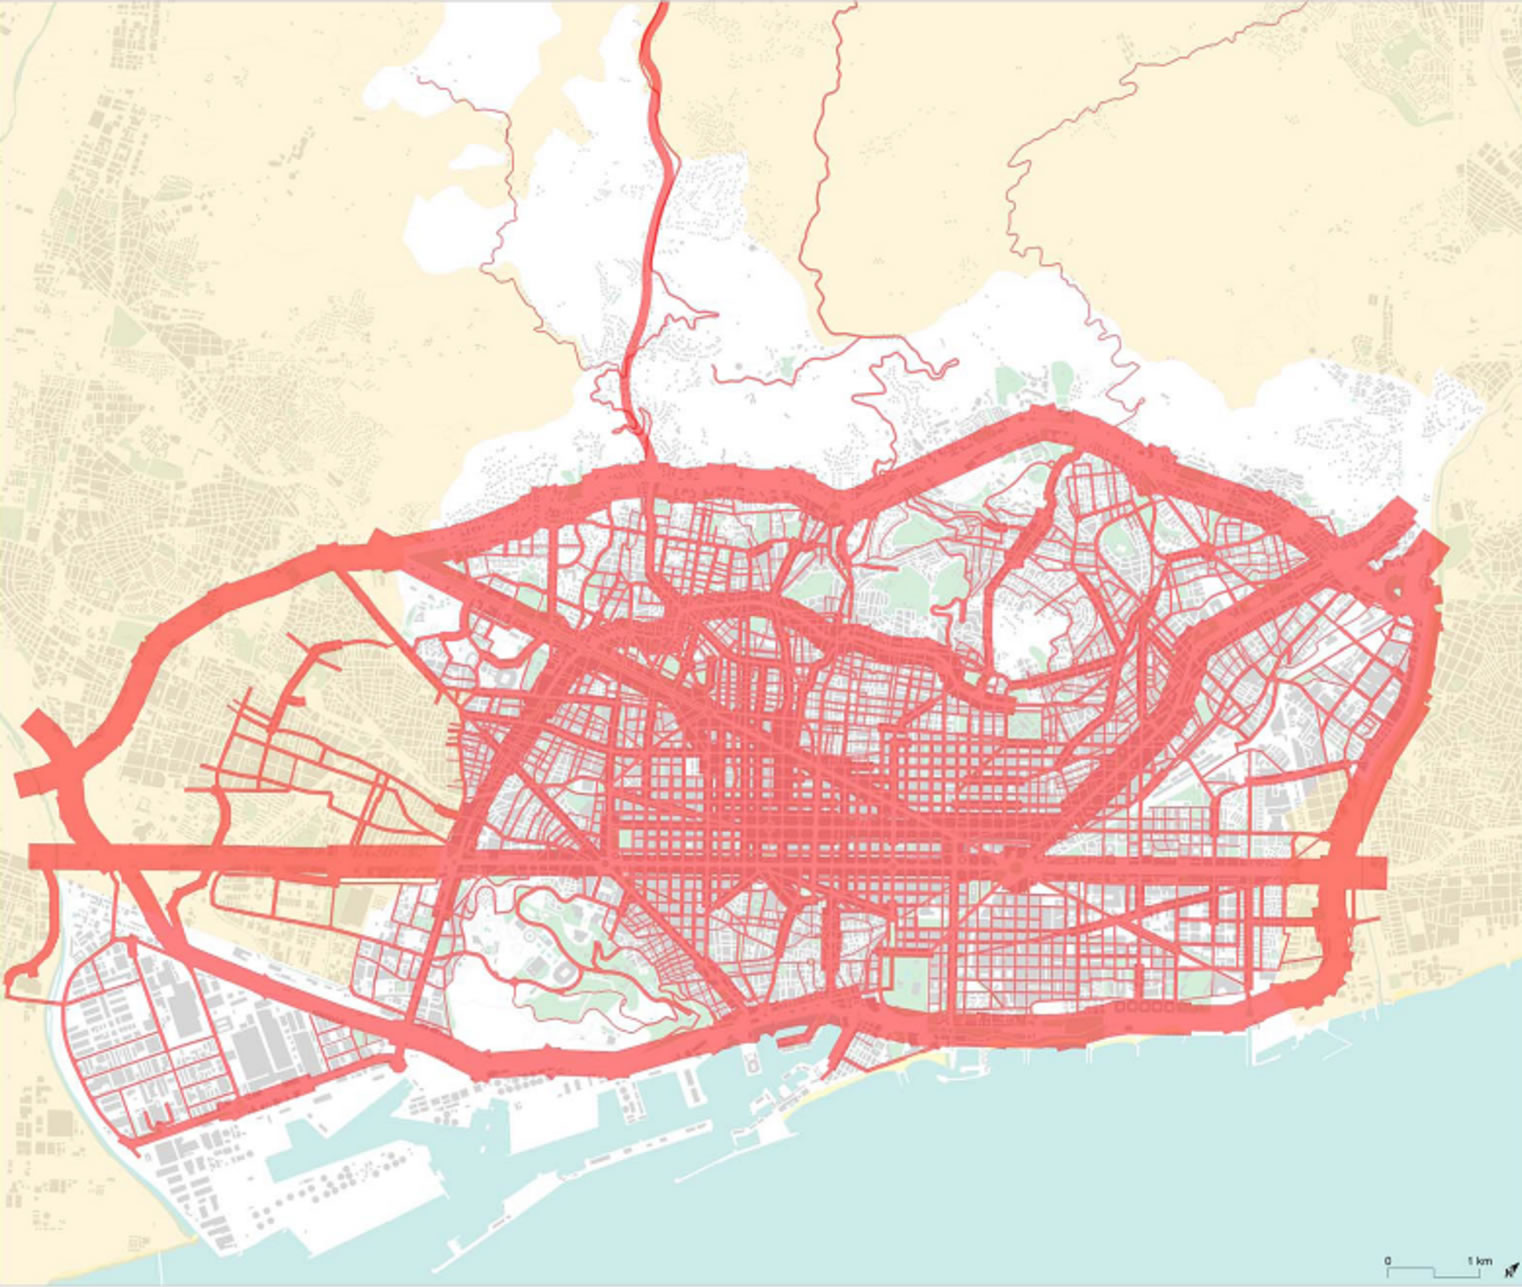

Figure 9. ADDT map of Barcelona (year 2000).
On the map of the year 2000 the change of the itinerary of the harbour traffic and of the Zona Franca area along the coastal ring road and the toll-free motorway on the right bank of the river Llobregat (between the cities of Sant Boi and Martorell), liberate the city from very considerable flows of lorries which until little before did not have any alternatives.
11. Barcelona, 2005: Arise of New Challenges
The time passed since the definitive approval of the general metropolitan plan (Pla General Metropolità) (29 years) and the Olympic Games (13 years) allow to clearly observing the highly positive effects of the new high capacity road network which gives continuity to the “transcendental streets” of the Cerdà plan.
Regarding the demand, the situation remains constant: the increase of the activity in the Zona Franca area, the significant extension of the harbour area, the introduction of the area of logistical activities in the municipality of Prat del Llobregat and the most spectacular increase of movements at Barcelona airport, which increased from 12 million passengers per year in 1992 to 30 million in 2005 contribute to the absorption of the capacity of existing infrastructures with the inherent challenges (figure 10).
Regarding the offer, the effects of the opening of the
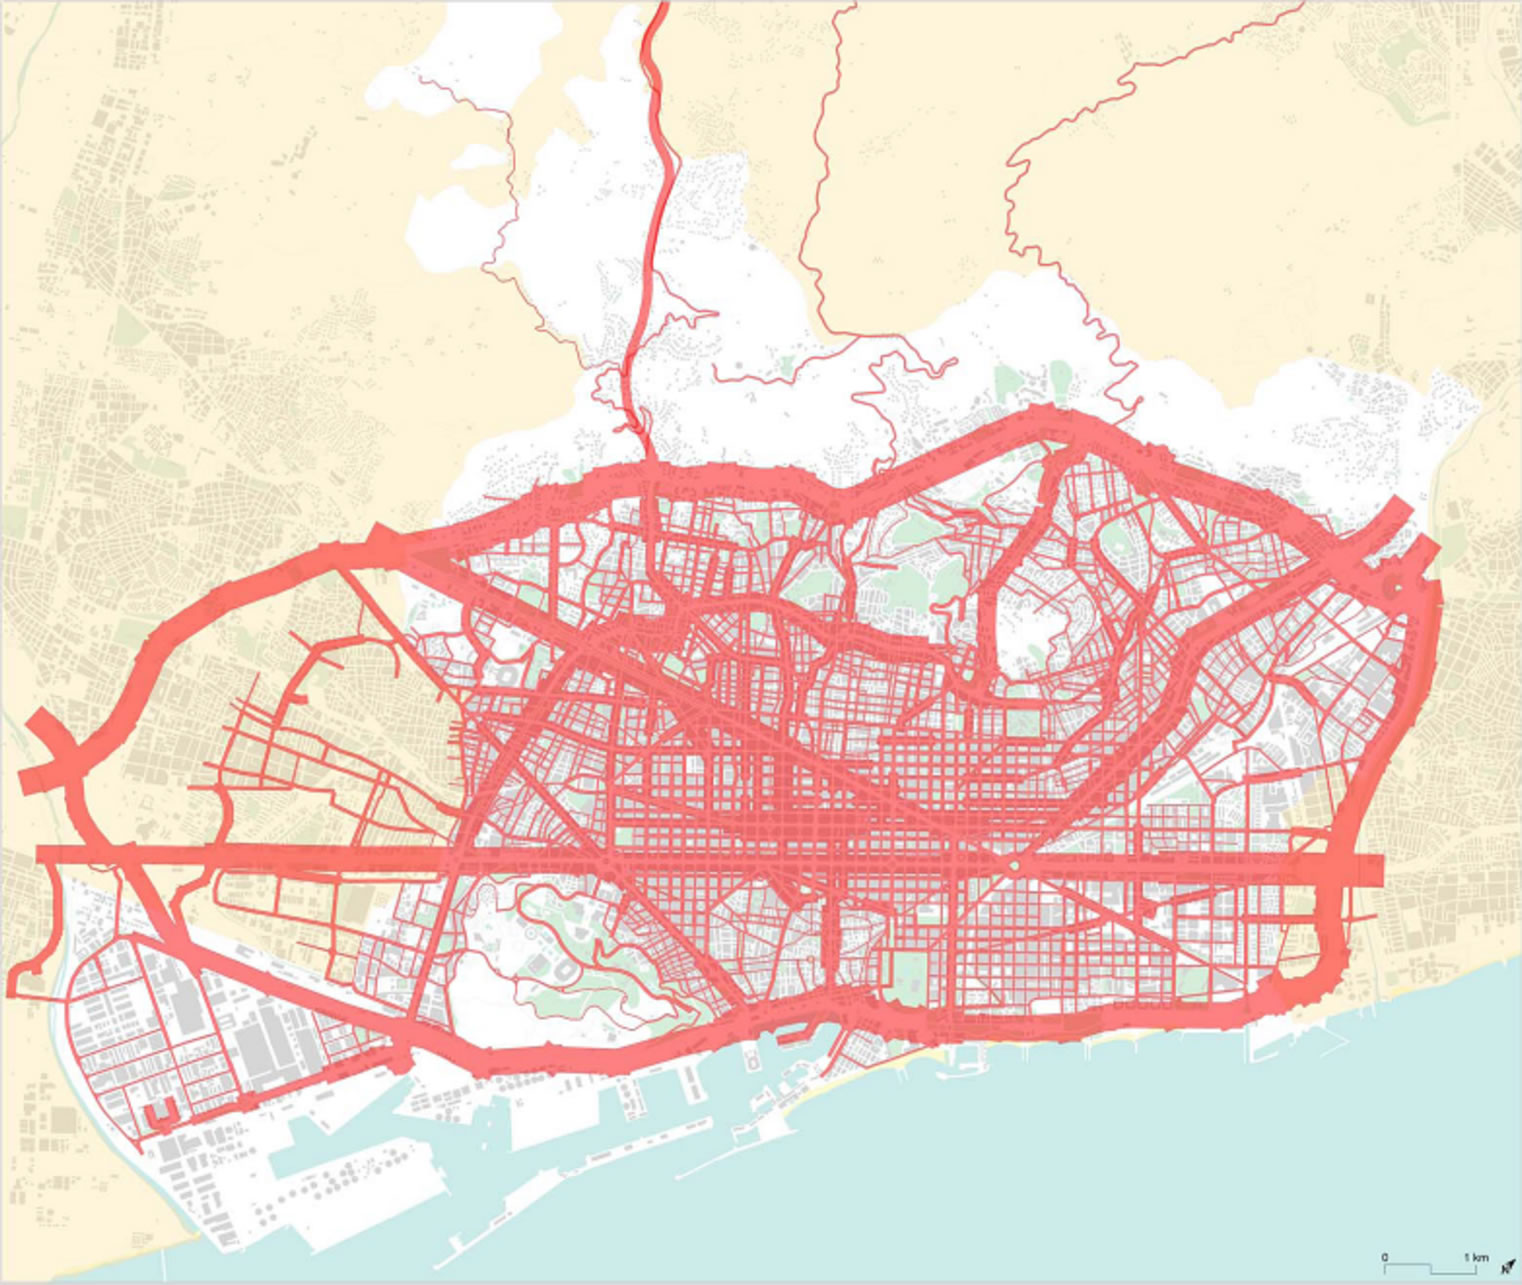

Figure 10. ADDT map of Barcelona (year 2005).
Northern and the Southern part of the upper ring road become evident; of the motorway C-32 towards Sitges and Vilanova i la Geltrú; of the motorway at the right bank of the Llobregat river which doubles the road capacity in its area closest to the coast, improving slowly but continuously, in the direction of the Cadi tunnel; of the extension of the motorway from the city of Mataró to the Tordera area, with the extension to three lanes in the whole itinerary and the extension to two lanes of the old national road N-II between Igualada and Lleida.
In this period a fourth phase of the high capacity progressive road network starts to become visible: the Eixample quarter of Cerdà, the general metropolitan plan (Pla General Metropolità), the metropolitan area (Àrea Metropolitana) (164 municipalities) and the urban region (Regió Urbana) (Catalonia), a necessary step to get de facto integrated into Europe.
Finally it is necessary to mention that the improvements of the public transport by road (bus) and rail (subway and commuter railway) contributed significantly to this stabilization of the traffic flows, although its growth rhythm is insufficient to catch up after the long period of “drought” regarding investments in these networks.
12. Conclusion
The analysis realized up from the initial annual average daily traffic flows through GIS, allowed a temporal comparative analysis. It gives a homogeneous picture of an evoluting element, such as the traffic flows. The visualization contributes to retrace the impact of the city’s traffic flows on its road network and to present an efficient way of detecting situations of saturation. The average annual daily traffic flow maps become an illustrative instrument of depicting missing connections. It is thereby a flexible and useful application for politicians and other decision makers.
REFERENCES
- Ajuntament de Barcelona, “Cens de Fluxes Anuals Diaris de Trànsit al Municipi,” Àrea de Mobilitat, Transports i Circulació de l’Ajuntament de Barcelona, Barcelona, 1965-2005.
- United Nations, Economic Commission for Europe, “Combined Census of Motor Traffic and Inventory of Standards and Parameters on Main International Traffic Arteries in Europe in 2000,” Genève, 2003.
- IDESCAT, “Població Per Sexe. Barcelona,” 2011. http://www.idescat.cat/territ/BasicTerr?TC=5&V0=1&V3=867&V4=538&ALLINFO=TRUE&PARENT=1&CTX=B&V1=08019&VOK=Confirmar
- AA.VV., “Cerdà. The Barcelona Extensión,” Institut d’Estudis Territorials, Barcelona, 2001.
- A. Soria, “Cerdà. Las Cinco Bases de la Teoría General de la Urbanización,” Electra, Barcelona, 1999.