Natural Science
Vol.08 No.11(2016), Article ID:71973,15 pages
10.4236/ns.2016.811048
Path Integral Molecular Dynamics Simulation on Atomic Distribution in Amorphized Ice Ic
Naoka Sato, Kenichi Kinugawa
Division of Chemistry, Graduate School of Humanities and Sciences, Nara Women’s University, Nara, Japan

Copyright © 2016 by authors and Scientific Research Publishing Inc.
This work is licensed under the Creative Commons Attribution International License (CC BY 4.0).
http://creativecommons.org/licenses/by/4.0/


Received: October 25, 2016; Accepted: November 11, 2016; Published: November 14, 2016
ABSTRACT
We have investigated the effects of compression and quantization on atomic distribution in ice Ic and in its compressed states at 77 K and 10 K, using the path integral molecular dynamics (PIMD) simulations over wide range of volume. It has been found that the high density amorphous ice (HDA) is attained by compression but volume range to retain ice structure is wider at 10 K than 77 K. We have discovered that quantum dispersion of atoms in ice Ic at 10 K induces non-zero probability that hydrogen-bonded H2O molecular molecules are oriented nonlinearly in the crystal structure, which was believed to contain exclusively linear orientation of hydrogen- bonded molecular pairs in this ice. It has been found that for HDA there is each non-zero probability of orientational disorder of hydrogen-bonded H2O pairs, of such uniform distribution of H atoms as observed in supercritical fluids in general, and of H atoms located at the O-O midpoint. The present PIMD simulations have revealed that these observed anomalous characteristics of atomic distribution in HDA are caused by both quantization of atoms and compression of the system.
Keywords:
Ice Ic, Path Integral, Molecular Dynamics, Amorphous Ice, Quantum Effect, Compression

1. Introduction
Ice Ic is known as a cubic crystal and has the lowest density among all polymorphs of ice as well as ice Ih [1] . The crystalline structure of ice Ic was determined by Arnold et al. [2] and by Kuhs et al. [3] using neutron powder diffraction (density 0.933 g∙cm−3 (19.3 cm3∙mol−1) at 80 K [2] ), and they confirmed that the structure of ice Ic is hydrogen disordered as well as ice Ih. On the other hand, Mishima et al. discovered that compression of Ice Ih and Ic at 77 K produced amorphous state called high density amorphous ice (HDA) [4] [5] . This is distinguished from low density amorphous ice (LDA) known as glassy water existing below the glass transition temperature. Reported density of HDA is 1.31 ± 0.02 g∙cm−3 (13.8 cm3∙mol−1) at 1 GPa and 1.17 ± 0.02 g∙cm−3 (15.4 cm3∙mol−1) at zero-pressure [4] [5] . The structure of HDA and LDA was revealed by the neutron diffraction measurement of the partial radial distribution functions (RDFs) at 80 K [6] , subsequently followed by their measurement of the RDFs of very high density amorphous ice (VHDA) [7] . Motivated by these discoveries of compressed amorphous states of ice Ic, a number of computer simulations have been extensively carried out to shed light on structures and properties of amorphous ices [8] - [22] .
Quantum effect of H atom is considered as remarkable in low-temperature substances, and the degree of quantum dispersion is parameterized as the de Broglie thermal wavelengths . For instance,
  of H atom is 2.0 Å (77 K) and 5.5 Å (10 K), which are far longer than the O-H covalent bond distance of water molecule. Actually, H atoms at low temperature behave more mysteriously than classical intuition recalled from the ball-and-stick molecular model [23] . Accordingly, in ice polymorphs and amorphous states at low temperature, such quantum effect should play some non-negligible roles in physical properties. In fact, many of reported computer simulations of ice Ic and HDA are in a category of classical mechanics, while only a few pioneering works of quantum simulations have been reported for these systems [24] [25] [26] . Among them, Gai et al. carried out path integral Monte Carlo simulation for HDA at 77 K using rigid molecular model SPC/E to calculate the RDFs, and they discussed the difference between H2O and D2O [26] . Herrero et al. performed isobaric path integral molecular dynamics (PIMD) simulations based on the flexible water model q-TIP4P/F to investigate the pressure effect on amorphization to HDA by examining the RDFs and other static properties [24] . Nevertheless, the exploration of quantum effect on the static properties of ice Ic and its compressed states is only just beginning.
The aim of the preset work is to investigate the detail of atomic distribution under compression of the system and quantization of atomic nuclei beyond the analysis reported so far. We have thus performed path integral molecular dynamics (PIMD) simulations of a series of H2O systems, for which at the beginning of the simulations the crystalline ice Ic structure was set at molar volume 25.7 - 9.84 cm3∙mol−1, including the reported experimental values of ice Ic and HDA. The compression is fulfilled by varying set volume in the present study; the simulations have been done under constant- temperature and constant-volume. The temperature has been set at 77 K and 10 K; 77 K is the temperature at which the existence of HDA was reported in the experiments, while at 10 K we expect quantum effect is expected to be more enhanced than 77 K.
2. Model and Methods of Computations
We have adopted a flexible model of water called the SPC/F2 potential [27] which is represented as the sum of the intra and intermolecular potential. All atoms in water molecules can move individually but the covalent bond in molecules is not allowed to be broken. The intermolecular interaction is represented in terms of Coulombic and Lennard-Jones terms.
Following the quantum-classical isomorphism based on path integral, the canonical partition function of a system of N atoms is written as
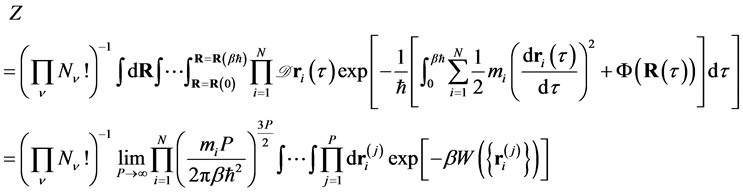
(1)
where  is the number of atoms of species
 ,
,  is the SPC/F2 potential, which is a function of a set of N atomic coordinates
  along imaginary-time
 , and
, and  is the mass of the i-th atom. In Equation (1), W is
 (2)
(2)
where . The second expression of Equation (1) is the primitive discretized form representing the classical-quantum isomorphism [28] ; the partition function of a quantum system Equation (2) is equivalent to that of a classical system consisting of N necklaces, each of which is composed of P beads
  connected with neighbors through springs (Hooke’s constant
 ). To evaluate static properties of the system, Newtonian equations of motion for the beads,
 (3)
(3)
are solved numerically. The mass of bead  is arbitrary but has simply been taken as
  in the present study. The second term in the right side of Equation (3) is frictional force coming from the first layer
  of massive Nosé-Hoover-chain (MNHC) thermostats [29] which are attached to each bead coordinate to control kinetic energy. This MD evolution, i.e. PIMD, ensures that the MD time average generates Boltzmann distribution
  appearing in Equation (1). In PIMD, only static averages have physical meaning though sampling in configurational space is done by solving Newtonian equations of motion Equation (3). The spatial distribution of beads evaluated as such an MD average is equivalent to the diagonal element of density matrix in the
quantum-statistical mechanical regime,  where
where 
and  is eigenfunction of the j-th state and the eigenenergy, respectively [30] .
The equations of motion Equation (3) and MNHC have numerically been integrated following the RESPA algorithm [31] . The chain length of MNHC has been taken as 3. The time increment of PIMD has been taken as 1.0 × 10⁻¹⁷ s. Sixty four H2O molecules have been contained in a cubic simulation cell with constant volume. The Trotter num- ber P of each atom has been taken as 140 (77 K) and 900 (10 K). Although the number of molecules in the box is not so many, the number of degrees of freedom to be computed in PIMD is even 322560 and 2073600 for , respectively. These values of P have been determined to fulfill the convergence of physical properties, which we have checked by watching potential energy and RDFs in preliminary runs. The simulations have been carried out at 77 K and 10 K and at the molar volume in the range of 25.7 - 9.84 cm3∙mol−1 (0.700 - 1.83 g∙cm−3), which includes the experimental value 19.3 cm3∙mol−1 (0.933 g∙cm−3) at 80 K [2] . At the beginning of each simulation, we put atoms at the sites of proton-ordered ice Ic with space group I41md, which is ferroelectric with all H2O dipoles pointing in the same direction [22] . The initial four million MD steps for equilibration were discarded, followed by one million steps’ run for which analysis has been carried out to present the results in this article. The periodic boundary condition has been imposed while Ewald’s method has been used to correct the cutoff of Coulombic term. For reference, the MD simulations in the classical limit (P = 1) has also carried out under the same conditions as PIMD.
The potential energy of the system and the RDFs between atomic species have been calculated from both PIMD and classical MD simulations. In addition, we have further analyzed the density distribution of H atoms as a function of newly defined coordinates, one of which is , where
  and
and  is the distance between the
  H atom and the adjacent i-th O atom and j-th O atom, respectively. One of these two O atoms is covalently bonded to the
  H atom, while the other is not (i.e., ice rule). Another coordinate R is the distance between the i-th and the j-th O atoms. In addition, we define the angle formed by the three atoms as
 . The definition of these three variables is schematically shown in Figure 1.
3. Results and Discussions
3.1. Potential Energy vs Molar Volume
Figure 2 shows the plot of intermolecular potential energy  as a function of molar volume. In Figure 2(a), it is reasonable that
  of PIMD at 77 K becomes the lowest at the experimental density 19.3 cm3∙mol−1 of ice Ic. However, in the classical

Figure 1. The definition of coordinates, s, R, and . “O(i)” and “O(j)” denote the i-th and j-th oxygen atom, respectively, while “
 ” is the first or second hydrogen atom belonging to the i-th or j-th water molecule. In the present definition, we do not distinguish the difference between covalent or hydrogen bond in which atom “
 ” participates. Note that each atomic nucleus is divided into P beads in an isomorphic necklace in the quantum regime of PIMD simulation.
 (a) (b)
Figure 2. The plot of intermolecular potential energy Einter as a function of molar volume. (a) 77 K; (b) 10 K. The arrows point the values of experimental molar volume of ice Ic (19.3 cm3∙mol−1 at 80 K [1] ) and HDA (15.4 and 13.8 cm3∙mol−1 at 77 K [4] [5] ).
limit, in Figure 2(a), the molar volume of the lowest  disagrees with the experimental value and is deviated to smaller value (17.3 cm3∙mol−1). In Figure 2(b), we can see the similar characteristics for 10 K as well, but the minimum potential energy of PIMD is observed both at 17.3 cm3∙mol−1. For the classical result it is seen at 17.3 cm3∙mol−1 as well as 77 K. These results imply significant quantum effect on the relationship between energetic stability and volume of ice Ic.
3.2. Ice Ic under the Experimental Condition
Figure 3 shows the oxygen-oxygen RDF gOO(r) and the hydrogen-hydrogen RDF gHH(r) obtained from both the PIMD and classical MD calculations at 77 K and experimental density. The overall profile and the peak positions in the classical limit are in good agreement with that of ice Ic by classical MD [22] . This profile evidently indicates the retention of ice Ic configuration. Although gOO(r) of PIMD has the same peak positions as that of the classical MD, the peaks are broadened because of spatial extent of beads or quantum dispersion.
In Figure 3, gHH(r) obtained from the classical MD is distinctively oscillatory, indicating the well-defined location of H atoms in ice Ic. This profile is also in good accordance with the RDFs obtained by Geiger et al.; in [22] the same kind of oscillatory RDFs indicates distinctive peaks clearly. However, gHH(r) of PIMD in Figure 3 exhibits smooth curve without such well-defined oscillations and it looks like the smoothed version of its classical counterpart. This smooth gHH(r) is obviously attributed to spatial extension of the distribution of H atoms, caused by quantization of atomic nuclei. Although at a glance this profile looks to be presentation of structural disorder of H atoms, it does not mean proton disorder because the SPC/F2 model does not allow H atoms to jump to the other sites through breaking of the O-H covalent bond.
Figure 4 shows the contour plot of distribution of H atoms as a function of new coordinates R and s, defined in Section 2. In Figure 4(b), in the classical limit, there are

Figure 3. The radial distribution functions  and
and  of ice Ic at 77 K and experimental molar volume 19.3 cm3∙mol−1. Only intermolecular correlation has been counted.
 (a) (b)
Figure 4. Contour plot of distribution of H atoms as a function of R and s in ice Ic at 77 K and experimental molar volume 19.3 cm3∙mol-1. (a) PIMD; (b) classical MD.
a couple of sharp distribution maxima at  Å and
Å and  Å, which is equivalent to
  Å and
Å and  Å. This is a consequence of retention of well-defined ice Ic crystal structure. On the other hand, the distribution obtained from the PIMD in Figure 4(a) is more broadened than the classical limit, whereas the maxima of distribution are still located at the same two spots as the classical counterpart. Consequently, both for the PIMD and the classical MD, the initially set configuration of ice Ic is well retained. This finding is in accordance with the above-described discussion that gHH(r) of PIMD is a smoothed version of the classical counterpart. This also supports that H atoms are not disordered but simply have broadened distribution centered around lattice points. In conclusion, for ice Ic at 77 K and experimental density, though there is significant extension of distribution of H atoms due to quantum dispersion, the crystalline structure remains in the framework of adopted model SPC/F2.
3.3. Volume and Temperature Dependences of Radial Distribution Functions
3.3.1. Results for 77 K
Figure 5 shows gOO(r) calculated from PIMD simulations for each set molar volume at 77 K and 10 K. At 77 K, in Figure 5(a1), for large molar volume than the experimental value there remain well-defined peaks of ice Ic. However, at 17.3 cm3∙mol−1 (Figure 5(b1)) gOO(r) starts to collapse; non-zero distribution exists between the first and second peaks. The collapse of gOO(r) is further promoted as the system volume is more compressed (16.2 - 9.84 cm3∙mol−1).
These RDFs obviously indicate the amorphousness or disorder of the distribution of oxygen atoms constituting the backbone of the whole system. Observed collapse of the RDFs is distinguished from such broadening of the distribution of quantized H atoms as observed in ice Ic in the last subsection. Rather it is certain that the present amorphization is caused by confinement of the system in small volume or compression. As seen in Figure 5(c1), gOO(r) at 77 K becomes even flatter and is uniform in the range of 3.3 - 4.0 Å under the utmost compression, indicating that the amorphization is further promoted. Figure 6 shows the RDFs  and
and  at 77 K. Also in this figure, we can see the same tendency of amorphousness as observed in Figure 5(b1) and Figure 5(c1); in Figure 6(c), Figure 6(d) as well, the RDFs clearly exhibit smooth curves characteristic of amorphous structure. With connection to the potential energy profile in Figure 2(a), the rise of Einter at higher density is attributed to this amorphousness of the system. The state attained for 13.8 and 15.4 cm3∙mol−1 presently is considered as identical to the HDA which Mishima et al. discovered for the same density.
3.3.2. Results for 10 K
In the right column of Figure 5, the collapse of gOO(r) at 10 K occurs only under the utmost compression conditions (Figure 5(c2)). Namely, the original ice Ic structure is retained at molar volume 15.4 cm3∙mol−1 and more (Figure 5(a2) and Figure 5(b2)) though at 15.4 cm3∙mol−1 amorphization already occurs at 77 K (see Figure 5(b1) and Figure 5(b2)).
Thus, the volume range to retain ice Ic structure is wider (25.7 - 15.4 cm3∙mol−1) at 10 K than 77 K (25.7 - 19.3 cm3∙mol−1). This suggests that enhanced quantum dispersion at lower temperature contributes to the stabilization of ice Ic structure. It seems that the atoms with more stretched distribution due to quantum dispersion at 10 K behave as if they were more expanded cushions with which the ice structure is filled up to support wider volume. The RDFs  and
and  at 10 K are shown in Figure 7. In this figure as well, the amorphousness is seen only under utmost compression condition (Figure 7(c) and Figure 7(d)). However, it is noteworthy that, in Figure 7(c), gHH(r) for HDA at 10 K is extremely flat. Surprisingly, such uniform profile is similar to RDFs of supercritical fluids in general [32] [33] . This is a consequence of both the quantum

Figure 5. The oxygen-oxygen radial distribution function goo(r) calculated from PIMD simulations. (a1, a2) Larger volume than experimental value of ice Ic; (b1, b2) Fairly compressed volume; (c1, c2) Extremely compressed volume. The three panels in the left (right) column are for 77 K (10 K). In every panel, goo(r) at the experimental molar volume 19.3 cm3∙mol−1 of ice Ic is drawn in black line for comparison.

Figure 6. The hydrogen-hydrogen radial distribution function  and the oxygen-hydrogen radial distribution function
  for compressed states at 77 K calculated from PIMD simulations. In these functions, only intermolecular correlation has been counted. The two panels in the left (right) column are
  (
( ). In every panel, the RDF for the experimental molar volume 19.3 cm3∙mol−1 of ice Ic is drawn in black line for comparison.
dispersion of atoms and the amorphous structure of the whole system.
3.4. Further Analysis of Distribution of H Atoms in Quantum Regime
In order to examine the distribution of H atoms, in Figure 8 we show the contour plot of distribution of H atoms for the PIMD results of ice Ic and HDA. In every panel in this figure, the distribution of H atoms is notably spread in space and gives non- classical appearance. In Figure 8(a2), for ice Ic at 10 K, we can observe a couple of separated spot distributions at  Å and
Å and . When the O-O distance is 2.7 Å which is the first peak distance in gOO(r) in Figure 5, this is equivalent to
 and
and  (see Figure 1). This angle denotes that the O-H-O configuration of three atoms is nonlinear and the hydrogen bond is bent. For ice Ic at 10 K, therefore there arises non-zero probability that hydrogen-bonded molecular pair has nonlinear orientation rather than the linear hydrogen bond characteristic of ice Ic. This is evidently caused by quantum dispersion which is enhanced by lowering the temperature. Such non-zero probability of nonlinear configuration has not

Figure 7. The hydrogen-hydrogen radial distribution function  and the oxygen-hydrogen radial distribution function
  for compressed states at 10 K calculated from PIMD simulations. The explanation is the same as Figure 6.
been reported so far in the classical MD simulations of ice Ic. We should note that, in spite of this probability, the system is not amorphized at this density 19.3 cm3∙mol−1 and retain the crystalline structure, as described in Section 3.2. Here let us discuss the above-described occurrence of non-linear orientation. Once a pair of hydrogen-bonded water molecules have nonlinear orientation, other adjacent molecules should be nonlinearly oriented as well to avoid rising up intermolecular potential energy. Such correlation of reorientation of water molecules can be fulfilled if the correlation is collective and concerted. In fact, a recent neutron quasielastic scattering experiment detected concerted tunneling transfer of H atoms in ice Ih and Ic at 5 K [34] . Further analysis focusing on the possibility of orientational correlation of water molecules will be our next subject.
For HDA, on the other hand, in Figure 8(b1) and Figure 8(b2) we can carefully see that there is no distribution at  Å and
Å and , but the edge of the distribution is located around
  Å and
Å and . Moreover, there is no spotty distribution like ice Ic at 10 K (Figure 8(a2)) but non-zero distribution is spread continuously arising from smaller
  toward the edge. This characteristics indicates that the position of H atoms is shifted closer to the middle of the O-O line segment than the loca-

Figure 8. Contour plot of distribution of quantized H atoms as a function of s and cosθ in ice Ic and HDA, obtained from PIMD simulations. Each molar volume for ice Ic and HDA shown in every panel is experimental value. The two panels in the left (right) column are for 77 K (10 K).
tion of  Å and that they are distributed continuously for
 , though the distribution is very slight. This continuous distribution therefore implies non-zero probability of orientational disorder of water molecules in HDA. As we have seen in gOO(r) in Figure 5, there is certainly the disorder of O atoms or the amorphousness of the whole system of HDA. It is now clear that such amorphous structure is accompanied with the orientational disorder of a very small portion of water molecules.
In Figure 8(a2), Figure 8(b1), and Figure 8(b2), we find that there is non-zero distribution also at s = 0 Å and  for HDA at 77 K and for both ice Ic and HDA at 10 K. This indicates the existence of H atoms located at the middle point of two adjacent O atoms (one of which is covalently bonded to the H atom). Furthermore, non- zero density distribution of H atoms is continuously spread along s axis at
 , i.e., along the O-O line segment (for reference see Figure 1). However, it should be carefully noted that this does not mean the H atom transfer as the quantum mechanical resonance of two diabatic states
 (4)
(4)
because the SPC/F2 potential employed in the present simulations does not include breaking of covalent bond of each individual H2O molecule [27] . It is certain that the present nonzero distribution at the middle point of two O atoms has been caused only by the compression and the quantization of atoms in the present framework of modeling, without taking into account of the H atom transfer.
4. Conclusions
We have revealed significant quantum effect on static distribution of atoms in ice Ic. At first, quantized ice Ic has the lowest intermolecular potential energy at the experimental density and temperature, while the molar volume of the minimum potential energy is deviated to smaller volume in the classical limit. The distribution of H atoms in ice Ic under the experimental condition is significantly broadened with retaining the crystalline structure of ice Ic. When ice Ic is cooled down to 10 K, the quantization of atoms produces non-zero probability that hydrogen-bonded water molecules are nonlinearly oriented even in ice Ic. This is also a result of quantum effect enhanced by lowering the temperature. In addition, there is also non-zero probability that H atoms are located at the middle point of two neighboring O atoms in ice Ic at 10 K. It should be noted that this broad distribution of H atoms does not mean such proton disorder as pointed out by using neutron diffraction experiments [2] [3] but is simply a consequence of quantum dispersion of H atoms with retaining the ice Ic structure essentially.
In the present simulations, setting of small molar volume or compression has induced the amorphization of ice Ic. At reported experimental density by Mishima et al. (15.4 and 13.8 cm3∙mol−1), quantized ice Ic has also been amorphized, and the achieved state is considered as identical to the HDA which Mishima et al. discovered. For HDA at 77 and 10 K, there is non-zero distribution of H atoms spanning over 
 . This suggests non-zero probability of orientational disorder of a small portion of water molecules in the amorphous structure. In this connection, gHH(r) under utmost compression exhibits very smooth curve and converges to unity. This feature resembles that of RDFs of supercritical fluids in general. In addition, there is also non-zero probability of H atoms at the middle point of two neighboring O atoms in HDA. These features of atomic distribution in HDA are attributed to both the quantum dispersion of atomic nuclei and the compression of the system.
Finally we should mention some perspectives. In relation to recent quasielastic neutron scattering experiments which revealed the existence of concerted motion of H atoms in ice Ih and Ic [34] , Benton et al. discussed the delocalization of H atoms in low- temperature ice to suggest the formation of even quantum liquid of protons in ice Ih [35] . Our findings of H atom delocalization may presumably be related to such liquid- like collective anharmonic motion suggested for low-temperature ice. However, no proton transfer mechanism has been installed in the present simulations based on the SPC/F2 model in which the intramolecular potential is quadratic. If a double-well-type adiabatic potential model representing proton transfer and quantum-mechanical resonance between diabatic states [36] were implemented in the simulation, the activation potential barrier at the O-O midpoint is lowered in the regime of temperature- dependent Feynman-Hibbs effective potential or centroid potential in path integral [37] [38] . This should result in increase of the distribution of H atoms at the middle point of the O-O line segment than the present result. Hydrogen atoms can then transfer from one potential minimum position to another minimum more easily, as in Equation (4). Next subject will be out to investigate how broad distribution of H atoms found presently may be connected to the dynamics of H atoms in ice and HDA on the basis of such a model and centroid molecular dynamics [39] . In addition, further investigation will be planned to pursue the compression and quantum effects in ice polymorphs such as ice XI, II, XV, and VIII, which exist at low temperature and high density with real proton order.
Acknowledgements
The present study was supported by JSPS Grant-in-Aid for Scientific Research No. 23654149.
Cite this paper
Sato, N. and Kinugawa, K. (2016) Path Integral Molecular Dynamics Simulation on Atomic Distribution in Amorphized Ice Ic. Natural Science, 8, 460-474. http://dx.doi.org/10.4236/ns.2016.811048
References
- 1. Dowell, L.G. and Rinfret, A.P. (1960) Low-Temperature Forms of Ice as Studied by X-Ray Diffraction. Nature, 188, 1144-1148.
http://dx.doi.org/10.1038/1881144a0 - 2. Arnold, G.P., Finch, E.D., Rabideau, S.W. and Wenzel, R.G. (1968) Neutron-Diffraction Study of Ice Polymorphs. III. Ice Ic. Journal of Chemical Physics, 49, 4365-4369.
http://dx.doi.org/10.1063/1.1669883 - 3. Kuhs, W.F., Bliss, D.V. and Finney, J.L. (1987) High-Resolution Neutron Powder Diffraction Study of Ice Ic. Journal de Physique, Colloque, C1, 631-636.
http://dx.doi.org/10.1051/jphyscol:1987187 - 4. Mishima, O., Calvert, L.D. and Whalley, E. (1984) 'Melting Ice' at 77 K and 10 kbar: A New Method of Making Amorphous Solids. Nature, 310, 393-395.
http://dx.doi.org/10.1038/310393a0 - 5. Mishima, O., Calvert, L.D. and Whalley, E. (1985) An Apparently First-Order Transition between Two Amorphous Phases of Ice Induced by Pressure. Nature, 314, 76-78.
http://dx.doi.org/10.1038/314076a0 - 6. Finney, J.L., Hallbrucker, A, Kohl, I., Soper, A.K. and Bowron, D.T. (2002) Structures of High and Low Density Amorphous Ice by Neutron Diffraction. Physical Review Letters, 88, 225503/1-225503/4.
http://dx.doi.org/10.1103/PhysRevLett.88.225503 - 7. Finney, J.L., Bowron, D.T., Soper, A.K., Loerting, T., Mayer, E. and Hallbrucker, A. (2002) Structure of a New Dense amorphous Ice. Physical Review Letters, 89, 205503/1-205503/4.
http://dx.doi.org/10.1103/PhysRevLett.89.205503 - 8. Matsumoto, M., Yagasaki, T. and Tanaka, H. (2015) Chiral Ordering in Supercooled Liquid Water and Amorphous Ice. Physical Review Letters, 115, 197801/1-197801/5.
http://dx.doi.org/10.1103/PhysRevLett.115.197801 - 9. Niall, J. and Tse, J.S. (2014) Reversible Pressure-Induced Crystal-Amorphous Structural Transformation in Ice Ih. Chemical Physics Letters, 609, 54-58.
http://dx.doi.org/10.1016/j.cplett.2014.06.026 - 10. Niall, J. and Tse, J.S. (2011) Thermal Conduction and Phonon Propagation in Pressure-Amorphized Ices. Physical Review B, 83, 184114/1-184115/9.
http://dx.doi.org/10.1103/PhysRevB.83.184114 - 11. Seidl, M., Loerting, T. and Zifferer, G. (2009) High-Density Amorphous Ice: Molecular Dynamics Simulation of the Glass Transition at 0.3 GPa. Journal of Chemical Physics, 131, 114502/1-114502/7.
http://dx.doi.org/10.1063/1.3224857 - 12. Belosludov, R.V., Subbotin, O.S., Mizuseki, H., Rodger, P.M., Kawazoe, Y. and Belosludov, V.R. (2008) Crystal-Like Low Frequency Phonons in the Low-Density Amorphous and High-Density Amorphous Ices. Journal of Chemical Physics, 129, 114507/1-114507/5.
http://dx.doi.org/10.1063/1.2977975 - 13. Tse, J.S., Klug, D.D., Guthrie, M., Tulk, C.A., Benmore, C.J. and Urquidi, J. (2005) Investigation of the Intermediate- and High-Density Forms of Amorphous Ice by Molecular Dynamics Calculations and Diffraction Experiments. Physical Review B, 71, 214107/1-214107/7.
http://dx.doi.org/10.1103/PhysRevB.71.214107 - 14. Slovak, J. and Tanaka, H. (2005) Computer Simulation Study of Metastable Ice VII and Amorphous Phases Obtained by Its Melting. Journal of Chemical Physics, 122, 204512/1-204512/6.
http://dx.doi.org/10.1063/1.1906217 - 15. Martonak, R., Donadio, D. and Parrinello, M. (2005) Evolution of the Structure of Amorphous Ice: From Low-Density Amorphous through High-Density Amorphous to Very High-Density Amorphous Ice. Journal of Chemical Physics, 122, 134501/1-134501/10.
http://dx.doi.org/10.1063/1.1870852 - 16. Martonak, R., Donadio, D. and Parrinello, M. (2004) Polyamorphism of Ice at Low Temperatures from Constant-Pressure Simulations. Physical Review Letters, 92, Article ID: 225702.
http://dx.doi.org/10.1103/PhysRevLett.92.225702 - 17. Shpakov, V.P., Rodger, P.M., Tse, J.S., Klug, D.D. and Belosludov, V.R. (2002) Thermodynamic Discontinuity between Low-Density Amorphous Ice and Supercooled Water. Physical Review Letters, 88, Article ID: 155502.
http://dx.doi.org/10.1103/PhysRevLett.88.155502 - 18. Tanaka, H. (1996) A Self-Consistent Phase Diagram for Supercooled Water. Nature, 380, 328-330.
http://dx.doi.org/10.1038/380328a0 - 19. Tse, J.S. and Klein, M.L. (1990) Pressure-Induced Amorphization of Ice Ih. Journal of Chemical Physics, 92, 3992-3994.
http://dx.doi.org/10.1063/1.457812 - 20. Wong, J., Jahn, D.A. and Giovambattista, N. (2015) Pressure-Induced Transformations in Glassy Water: A Computer Simulation Study Using the TIP4P/2005 Model. Journal of Chemical Physics, 143, Article ID: 074501.
http://dx.doi.org/10.1063/1.4928435 - 21. Tainter, C.J., Shi, L. and Skinner, J.L. (2014) Structure and OH-Stretch Spectroscopy of Low- and High-Density Amorphous Ices. Journal of Chemical Physics, 140, Article ID: 134503.
http://dx.doi.org/10.1063/1.4869293 - 22. Geiger, P., Dellago, C., Macher, M., Franchini, C., Kresse, G., Bernard, J., Stern, J.N. and Loerting, T. (2014) Proton Ordering of Cubic Ice Ic: Spectroscopy and Computer Simulations. Journal of Physical Chemistry C, 118, 10989-10997.
http://dx.doi.org/10.1021/jp500324x - 23. Ohta, Y., Ohta, K. and Kinugawa, K. (2004) Quantum Effect on the Internal Proton Transfer and Structural Fluctuation in the H5+ Cluster. Journal of Chemical Physics, 121, 10991-10999.
http://dx.doi.org/10.1063/1.1812739 - 24. Herrero, C.P. and Ramirez, R. (2012) High-Density Amorphous Ice: A Path-Integral Simulation. Journal of Chemical Physics, 137, Article ID: 104505.
http://dx.doi.org/10.1063/1.4750027 - 25. Herrero, C.P. and Ramirez, R. (2011) Path-Integral Simulation of Ice Ih: The Effect of Pressure. Physical Review B, 84, Article ID: 224112.
http://dx.doi.org/10.1103/PhysRevB.84.224112 - 26. Gai, H., Schenter, G.K. and Garrett, B.C. (1996) Quantum Simulation of High-Density Amorphous Ice. Physical Review B, 54, 14873-14876.
http://dx.doi.org/10.1103/PhysRevB.54.14873 - 27. Lobaugh, J. and Voth, G.A. (1997) A Quantum Model for Water. Journal of Chemical Physics, 106, 2400-2410.
http://dx.doi.org/10.1063/1.473151 - 28. Chandler, D. and Wolynes, P.G. (1981) Exploiting the Isomorphism between Quantum Theory and Classical Statistical Mechanics of Polyatomic Fluids. Journal of Chemical Physics, 74, 4078-4095.
http://dx.doi.org/10.1063/1.441588 - 29. Tobias, D.J., Martyna, G.J. and Klein, M.L. (1993) Molecular Dynamics Simulations of a Protein in the Canonical Ensemble. Journal of Physical Chemistry, 97, 12959-12966.
http://dx.doi.org/10.1021/j100151a052 - 30. Feynman, R.P. and Hibbs, A.R. (1965) Quantum Mechanics and Path Integrals. McGraw-Hill, New York.
- 31. Martyna, G.J., Tuckerman, M.E., Tobias, D.J. and Klein, M.L. (1996) Explicit Reversible Integrators for Extended Systems Dynamics. Molecular Physics, 87, 1117-1157.
http://dx.doi.org/10.1080/00268979600100761 - 32. Gernoth, K.A., Serhan, M. and Ristig, M.L. (2008) Quantum Structure of Normal-Liquid and Supercritical 4He. Physical Review B, 78, Article ID: 054513.
http://dx.doi.org/10.1103/PhysRevB.78.054513 - 33. Bolmatov, D., Zav’yalov, D., Gao, M. and Zhernekov, M. (2014) Structural Evolution of Supercritical CO2 across the Frenkel Line. Journal of Physical Chemistry Letters, 5, 2785-2790.
http://dx.doi.org/10.1021/jz5012127 - 34. Bove, L.E., Klotz, S., Paciaroni, A. and Sacchetti, F. (2009) Anomalous Proton Dynamics in Ice at Low Temperatures. Physical Review Letters, 103, Article ID: 165901.
http://dx.doi.org/10.1103/physrevlett.103.165901 - 35. Benton, O., Sikora, O. and Shannon, N. (2016) Classical and Quantum Theories of Proton Disorder in Hexagonal Water Ice. arXiv:1504.04158v3 [cond-mat.str-el]
- 36. Lobaugh, J. and Voth, G.A. (1996) The Quantum Dynamics of an Excess Proton in Water. Journal of Chemical Physics, 104, 2056-2069.
http://dx.doi.org/10.1063/1.470962 - 37. Kleinert, H. (1995) Path Integrals in Quantum Mechanics, Statistics, and Polymer Physics. 2nd Edition, World Scientific, Singapore.
http://dx.doi.org/10.1142/2092 - 38. Horikoshi, A. and Kinugawa, K. (2003) Quantum Dynamical Correlations: Effective Potential Analytic Continuation Approach. Journal of Chemical Physics, 119, 4629-4640.
http://dx.doi.org/10.1063/1.1595638 - 39. Bermejo, F.J., Kinugawa, K., Dawidowski, J., Cabrillo, C. and Fernández-Perea, R. (2005) Beyond Classical Molecular Dynamics: Simulation of Quantum-Dynamics Effects at Finite Temperatures. The Case of Condensed Molecular Hydrogen. Chemical Physics, 317, 198-207.
http://dx.doi.org/10.1016/j.chemphys.2005.04.010