Natural Science
Vol.6 No.11(2014), Article ID:47899,10 pages
DOI:10.4236/ns.2014.611080
Analysis of High-Resolution QTL Markers Associated with Rice Yields Using Data for Two Consecutive Years in Different Environmental Conditions
Ye-Jin Son1, Gyu-Ho Lee1, Hyun-Suk Lee1, Tri Handoyo1,2, Byung-Wook Yun1, Kyung-Min Kim1*
1Division of Plant Biosciences, School of Plant Biosciences, Kyungpook National University, Daegu, Korea
2Department of Agronomy, Faculty of Agriculture, Jember University, Jember, Indonesia
Email: *kkm@knu.ac.kr
Copyright © 2014 by authors and Scientific Research Publishing Inc.
This work is licensed under the Creative Commons Attribution International License (CC BY).
http://creativecommons.org/licenses/by/4.0/


Received 12 May 2014; revised 15 June 2014; accepted 25 June 2014
ABSTRACT
Previously we reported the identification of seven quantitative trait loci (QTLs) associated with the rice yield measuring five parameters including panicles per plant (PPP), spikelets per panicle (SPP), seed set percentage (SSP), 1000-grain weight (TGW) and yield in 2012. Here we report the analysis of QTLs using the same trait parameters data of the mapping population in 2013 for detecting highly conserved QTL markers. A total of 6 QTLs were identified from chromosomes 1, 7, 8, 10, 11, and 12, which were contrasted with our previous results (chromosomes 1, 2, 4, 5, 6, 8, and 11). In this comparison, three QTLs from chromosome 1, 8, and 11 were only found to be associated with the components of yield over two consecutive years indicating high sensitivity of QTL markers to the environment. Of those three QTLs, SPP-associated marker RM12285 was found to be dominantly expressed by real-time PCR (qPCR). In addition, compared to our previous report the numbers of mapping population and markers were significantly increased for higher resolution markers from 70 to 120, and from 143 to 217, respectively. We also found that the parameter SPP was dominantly correlated with the rice yield. Furthermore, the double haploid (DH) population facilitated to analyze the epistatic effects for yield and yield components in rice. Taken together, combining multiple mapping population data over years possibly enables narrowing down to the highly conserved QTL markers against diverse environmental fluctuation caused by such as drought and high temperature. Thus, these data would be critically exploited to improve for the crop breeding strategy.
Keywords:QTL, Rice Yield Component, Epistatic Interaction, qPCR

1. Introduction
One of the most demanded crops is rice being favored by more than half of the world population. The three major types in rice are indica, joponica, and javanicas showing their own specific phenotypes particularly depending on different environmental conditions. Almost 70% of populations in Korea and most Asian countries rely on their daily nourishment from rice. Even though the development of new varieties by crop breeding program has been operated successfully, the significant increment of world population hardly attenuates the problem of famine, particularly in developing countries. For this reason, it is still a top priority to increase the yield of rice. The advent of molecular markers assisted technology and molecular linkage genetic maps have made it possible to characterize the performance of individual QTLs. These techniques have been widely applied to identify QTLs controlling yield and its related traits on various crops, such as maize [1] -[3] , tomato [4] -[6] , wheat [7] [8] . The most important rice traits such as grain yield and quality have been focused to utilize QTL analysis [9] -[11] . Diverse rice genetic backgrounds in different environment allow the identification of a number of QTLs [12] - [16] providing breeders information to improve breeding strategies via marker-assisted selection (MAS). Classical quantitative genetic analysis enabled to find out the effect of epistasis. Using morphological markers the existence of digenic epistatic interactions in barley has been described [17] [18] . Recent studies of QTL mapping revealed that epistatic interactions among multiple loci played an important role in complex quantitative traits such as yield and yield components. To detect epistatic effects for yield and related traits, such as the F2, F2:3 chromosome segment substitution lines (CSSL), several mapping populations have been developed. To detect additive effects within a single locus and additive effects between loci, the double haploid (DH) population with homozygous genotypes derived from F1 plants via anther culture can be utilized. The control of quantitative traits is achieved by the polygenes that are characteristics of small effects and sensitive to the environment. The interaction of QTL environment (QE) is a critical component for plant evolution and breeding strategy. The yield and its related traits-associated QE have been extensively investigated in many crops [18] -[20] . In the previous studies, a number of QTLs detected in one or several different environments were found to have significant QE effects, indicating that QE interactions commonly occur on quantitative traits in various environments.
Further to our previous report that investigated the QTLs associated with yield in a single year-produced mapping population, in this study we collected a second consecutive year-produced data to improve selective efficiency via detection on QTLs controlling yield and yield components in different environments. In addition, we analyzed the effect of epistatic effects and QE interactions using the DH population in rice. Therefore, more conserved QTL markers with higher credibility under diverse environmental conditions might significantly elevate the efficiency of breeding strategy for the development of new crop varieties.
2. Materials and Methods
2.1. Plant Materials and Field Experiments
A population of 120 doubled haploid (DH) lines derived from a cross between “Cheongcheong” (Oryza sativa L. ssp. Indica) and “Nagdong” (Oryza sativa L. ssp. Japonica) was used in this study, which was conducted on the experimental farm of Kyungpook National University. The germinated seeds were sown in a seedling bed, and seedlings were transplanted into three-row plots after 30 days. The population was evaluated in a randomized complete block design with two replications of 2012 and 2013. Seventeen plants were cultivated in each row, with 30 cm between rows and 15 cm between plants within each row. The parents, “Cheongcheong” and “Nagdong”, were cultivated in ten plots as controls. All of the panicles from each plant were harvested and kept in different envelopes to avoid seed shattering. Panicles per plant (PPP) were identified as the mean number ofpanicles per plant. Spikelets per panicle (SPP) were counted as the average number of spikelets per panicle. Seed set percentage (SSP) was evaluated using the number of filled grains per plant divided by the number of spikelets per plant. The 1000-grain weight (TGW) was measured as the average weight of 1000 filled grains. Yield was evaluated as the weight of all filled grains of the plant, which was converted to kg per 10a (kg/10a). Mean values of the two replications were calculated for each trait and used in data analysis.
2.2. Genetic Linkage Map and QTLs Analysis
A genetic map consisting of 222 DNA makers was constructed using MAPMAKER/EXP Version 3.0 [21] . Distances between markers were presented in centiMorgans (cM) using the Kosambi function with an average interval of 10.6 cM. The completed genetic map used by the Plant Molecular Breeding Laboratory at the School of Applied Biosciences in Kyungpook National University. To identify the putative QTLs, composite interval mapping was employed using WinQTL Cartographer 2.5 [22] [23] . AnLOD value of 2.5 was used as the significant threshold for claiming a QTL at P < 0.05. QTLMapper 1.6 was used to detect the main effect QTLs, epistatic interactions and their environmental interactions with a threshold of P ≤ 0.005 [24] . The QTL locations identified in the current research were compared with previously reported QTLs affecting rice yield and related traits using agenomic database (http://gramene.org). The methods were similar to those described [14] .
2.3. Real-Time PCR (qPCR)@NolistTemp# The qPCR was conducted to compare phenotype and genotype with transcriptional expression based on relative expression. Microsatellite markers using codon region of OsAct 1 (accession no. Os3g0718100) as a reference gene was employed to confirm amplification with specific primers (5’-AGGCTCCTCTCAACCCCAAGGCCAATCG-3’, 5’-AGGTAATCAGTGAGATCACGCCCAGC-3’) and melting curves of the DH population of rice from a cross of “Cheongcheong” and “Nagdong”. Briefly a 20 µl mixture containing 3 µl of 30 ng/µl template cDNA and DNA, 10 µl of QuantiSpeed SYBR NO-ROX (PhileKorea, Cat. No. QS105-05), 1 µl of 20 pM of each primer and 5 µl of nuclease-free water (Qiagen, Cat. No. 129114) was analyzed byqPCR.qPCR was carried out using the following program: 95˚C for 2 min, followed by 45 cycles of 95˚C for 5 s, 60˚C for 10 s and 72˚C for 10 s.3. Results
The yield and components were summarized for parents and 120 DH lines in 2012 and 2013 (Table 1). Phenotypic transgressive and continuous variations were observed for most traits. 2012 “Nagdong” had higher values for spikelets per panicle, seed set percentage and grain yield, while 2012 “Cheongcheong” had higher panicles per plant and 1000-grain weight. 2013 “Nagdong” had higher values for seed set percentage. 2013 “Cheongcheong” had higher panicles per plant, spikelets per panicle, and grain yield. Although the parents have higher grain yield, some extremely low values for grain yield were observed due to the low seed set percentage in the DH population.
This phenomenon was probably attributable to the origin of the progeny from sub-specific (indica-japonica) crosses. Significant correlations (P < 0.05, P < 0.01) were calculated among yield and related traits in 2012 and 2013 (Table 1). Spikelets per panicle, seed set percentage and 1000-grain weight showed strong positive correlations with yield. The 1000-grain weight had a strong positive correlation with seed set percentage. In addition, negative correlations existed among panicles per plant, spikelets per panicle and 1000-grain weight (Table 2).
In the DH population, the frequency distributions of yield and the yield components PPP, SPP and TGW had a normal distribution. On the other hand, SSP and YIELD have learned to right.Putative QTLsandsignificant QTLs detected for yield and yield components are shown in Table2
In 2012 a total of 12 QTLs were identified on seven chromosomes (all except for chromosomes 1, 7, 9, 10, 12), while in 2013 a total of 12 QTLs were identified on six chromosomes (all except for 2, 3, 4, 5, 6, 9). Two of the QTLs were detected in both years on chromosomes 8 and 11, respectively.
One of the QTLs identified at qPPP 8 between markers 72-RM22499 in 2012. Another QTL was detected at qPPP11 between markers RM26002-26162 in 2013 Four QTLs were identified on chromosomes 2, 3, 5 and 6 in 2012 and chromosome 7 in 2013. SPP QTLs identified qSPP2 between RM6-RM213, qSPP3 between RM15749-RM3525, qSPP5 between RM18130-RM3381, and qSPP6 between RM20196-RM20355 in 2012. In 2013 qSPP7 only identified between RM8261 and RM420. Alleles from “Cheongcheong” showed increased effects at qSPP2 andqSPP6, while the “Nagdong” allele had an increased effect at qSPP3, qSPP5 and qSPP7. A total of four QTLs were resolved for seed set percentage over two years. One of the QTLs, qSSP9, was identi

Table 1. Analysis of yield and yield components between parents and DH population in 2012 and 2013.
aMean ± standard deviation.
Table 2. Phenotypic correlations among yield and yield components in a 120 DH population.
Table 3. QTLs detected for yield and yield components in a 120 double-haploid population in 2012 and 2013.
**Significant at P = 0.01.
fied in both years. The “Cheongcheong” allele had an increased effect at qSSP8andqSSP8-1, while the “Nagdong” allele showed an increased effect at qSSP1. Four and six QTLs were detected in 2012 and 2013, respectively. One of the QTLs, qTGW8, was identified during both years at chromosome 8. The “Nagdong” alleles contributed to heavy 1000-grain weight at these loci, while the increasing effect caused by the “Cheongcheong” allele was only identified at qTGW2 and qTGW8-5 in 2012 and qTGW1-1 andqTGW1-2 in 2013. Two QTLs, qYIELD4 and qYIELD11, were detected on chromosomes 4 and 11 in 2012. Another two QTLs, qYIELD1 and qYIELD12, were detected on chromosomes 1 and 12 in 2013. The “Cheongcheong” alleles showed increased yield at qYIELD1, qYIELD4, qYIELD11, qYIELD1 and qYIELD12 (Table 3, Figure 1).
A total of 25 digenic interactions were detected for yield and yield components in this study (Table 3). The highest LOD was qYIELD11 6.18 between RM3428 and RM27123 in 2012, and qTGW11 7.05 between RM27123 and RM27161 in 2013. In addition, the main effect QTLs made greater contributions to the phenotype variations for spikelets per panicle and 1000-grain weight. Selection was the high coincidence at relationship between 18 selected CNDH lines and the QTL at parent’s genotype in 2013.
Hypostasis and epistasis selected 18CNDH lines related about strong and weak phenotype, respectively.We selected yield hypostasis related four markers RM3428, RM26771, RM26748, and RM26801 for coincidence between phenotype and genotype in 2012 (Table 4). PPP hypostasis related RM26002 (Table 5), SSP hypostasis related two markers RM12285 and RM3482 (Table 6), and TGW epistasis related RM3512 (Table 7).
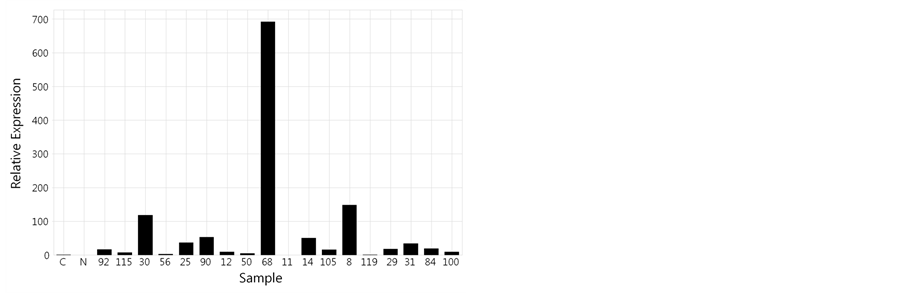
Amplification efficiencies were calculated from the slopes of standard curves generated by the qPCR data analysis program. It is qPCR result with CNDH lines and OsAct1 using RM12285, this could confirm that is been shown revelation aspect of specification gene connected with phenotype, and reveals variously (Table 8, Figure 2). Relation with revelation of specification gene by Phenotype and marker agreed a little (T value was 1.240ns). Also, was construed that there are been a lot of SSPs as specific gene expression is larger because re
aInterval markers are those within the significance threshold on each border of the QTL range; bThe proportion of evaluated phenotype variation attributable to a particular QTL was estimated by the coefficient of determination (R2); cPositive values of the additive effect indicate that alleles from “Cheongcheong” are in the direction of increasing the traits; dIncrease allele is the source of the allele causing an increase in the measured trait.
Table 4. Relationship between 18 selected CNDH lines and the QTLS at parent’s genotype in 2012.
aCheongcheong indicates maternal line; bNagdong indicates fetal line and each sample’s correspondence with chromosome markers. This table shows the highest index of concordance (over 70%).
Table 5. Relationship between 18 selected CNDH lines and the RM26002 of qPPP11 at parent’s genotype in 2013.
aCheongcheong indicates maternal line; bNagdong indicates fetal line and each sample’s correspondence with chromosome markers. This table shows the highest index of concordance (over 70%).
Table 6. Relationship between 18 selected CNDH lines and the QTLS at parent’s genotype in 2013.
aCheongcheong indicates maternal line; bNagdong indicates fetal line and each sample’s correspondence with chromosome markers. This table shows the highest index of concordance (over 70%).
Table 7. Relationship between 18 selected CNDH lines and the QTLS at parent’s genotype in 2012.
aCheongcheong indicates maternal line; bNagdong indicates fetal line and each sample’s correspondence with chromosome markers. This table shows the highest index of concordance (over 70%).
Table 8. Relationship between expression ratio, phenotype, andgenotype.
qPCR data shown the efficiency ratio of each sample. E is the expression ratio based on qPCR. P is phenotype at spikelets per panicle in 2013. G is relationship between 18 selected CNDH lines and the RM12285 marker of qSPP1 at parent’s genotype.
gression line appears by Y = 0.814X − 23.260 (Figure 3).
4. Discussion
In this study, only 3 of 12 QTLs affecting yield and yield components were identified over two years, indicating that individual QTLs are sensitive to the environment. Using populations derived from a combination between japonica and indica, 16 HD QTLs were consecutively identified [25] . An interval was identified on chromosome 1 between markers RZ730 and RZ801, where QTLs were associated with panicle number, plant height, maximum tiller number and flag leaf length [19] . This is the first report of the qPPP1-1 flanking marker 1008 and RM575. A QTL for spikelets per panicle flanked by markers RM237 and RM128 on chromosome 1 and 4 was reported. In this study, qSPP2 was between RM6 and RM213 which were the same regions [14] . A QTL associated seed set percentage was found with a peak marker RM23 on chromosome 1 [26] . The same chromosome region between markers RM35 and RG81A for the 35.3 percentage ripened grain was reported [27] . A QTL flanked by markers 1019 and RM488 in the same region was detected for two years [28] . In this study, we also detected a QTL flanked by markers 404 and RM22861 in the same region for two years. QTLs of 1000-grain weight, qTGW3 and qTGW5, were the most important genes for grain length and grain width in rice, respectively [29] . In this study, qTGW8 was detected both years. The qYIELD4 flanked by C2807 and RM252 on chromosome 4 was reported [30] . This QTL was on same loci detected in studies for yield [9] [31] . In the present study, the qYIELD4 flanked by markers 16429 and 1205 was identified in the same region. Investigation of phenotypic correlations between five traits indicated that SPP and SSP showed the highest correlation. The “Cheongcheong” alleles showed an increased number of panicles per plant. A specification gene expressed the highest amplification by RM12285of qSPP’s using qPCR. CNDH lines were compared estimate ratio and genotype, phenotype. As a result of the spikelets per panicle is many tillering type so this crop suitable early season cultivar at mountain region.
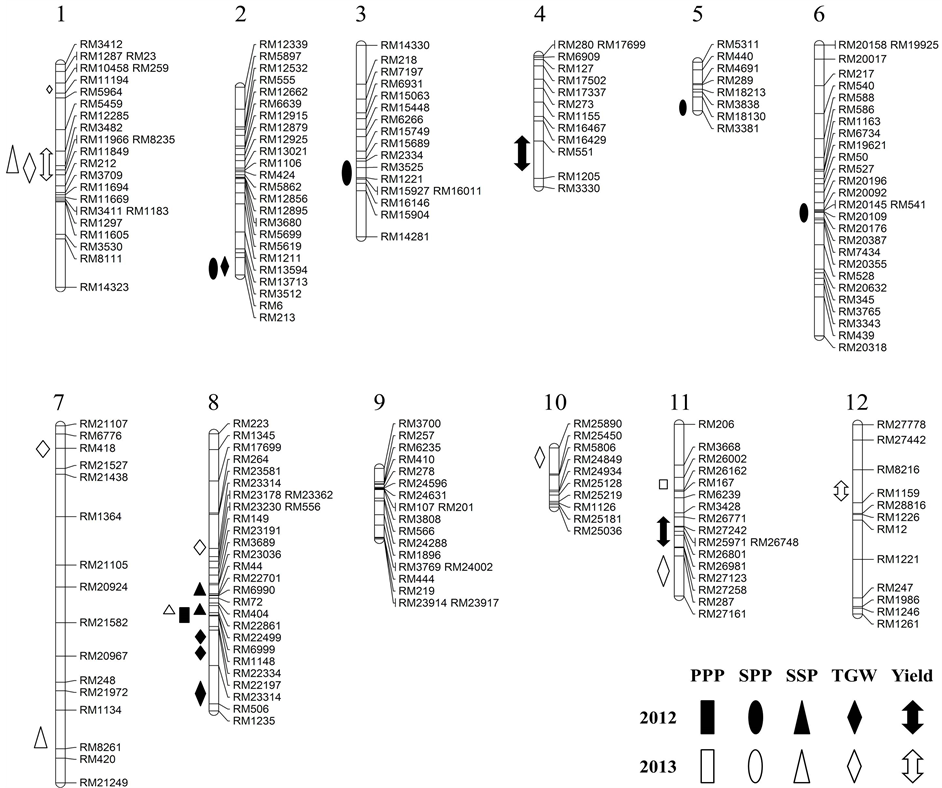
Figure 1. QTLs for yield and yield components were identified in 120 double-haploid lines derived from a “Cheongcheong/Nagdong” cross. The approximate positions of centromeres are represented within 12 chromosomes by the black bars. Diagonal symbols indicate that the QTLs were identified in 2012; clear symbols indicate that the QTLs were detected in 2013. The epistatic loci are shown on the left sides of chromosomes.
 (a)
(a)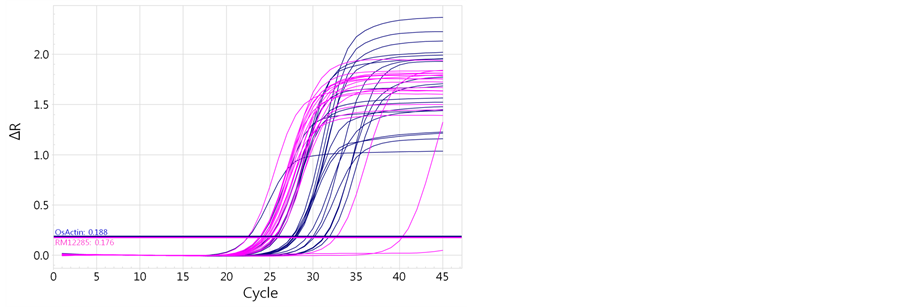 (b)
(b)
Figure 2. Quantitative analysis of RM12285 with OsAct 1 in the DH population. (a) Auburn indicates OsAct 1and blue indicates RM12285. (b) The relative expression of the DH population of rice from a cross of “Cheongcheong” and “Nagdong”.
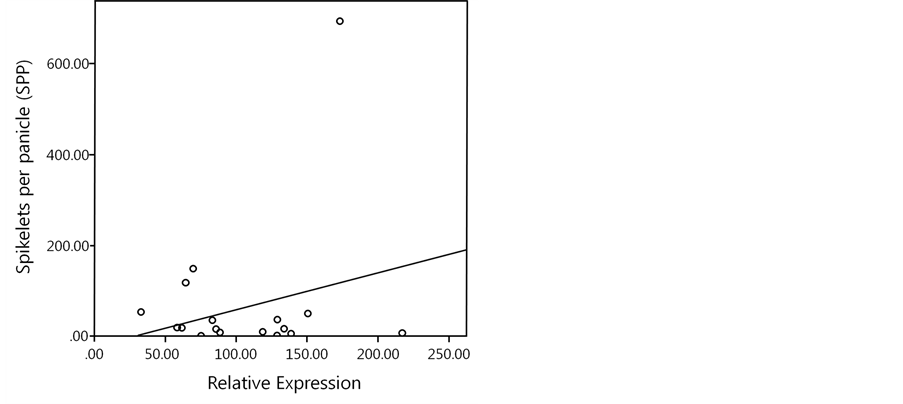
Figure 3. Correlation between relative expression by qPCR and SPP as a phenotype of SPP in the CNDH population of rice from a cross of “Cheongcheong” and “Nagdong”. Y = 0.814X – 23.260.
5. Conclusion and Recommendations
We focused on analysis of high-resolution QTL markers associated with rice yields using data for two consecutive years in different environmental conditions. Three QTLs from chromosome 1, 8, and 11 were only found to be associated with the components of yield over two consecutive years indicating high sensitivity of QTL markers to the environment as a total of 6 chromosomes in each single year. Of those three QTLs, SPP-associated marker RM12285 was found to be dominantly expressed by qPCR. With multiple data profiling over years it would facilitate to narrow down to closely associated with yield components, thus we are further planning for fine mapping by collecting more data of QTLs over next few years under diverse environmental conditions.
Acknowledgements
This work was supported by a grant from the Next-Generation BioGreen 21 Program (No. PJ0080912014), Rural Development Administration, Republic of Korea.
References
- Burr, B., Burr, F.A., Thompson, K.H., Albertson, M.C. and Stuber, C.W. (1998) Gene Mapping with Recombinant Inbreds in Maize. Genetics, 118, 519-526.
- Beavis, W.D., Grant, D., Albertsen, M. and Fincher, R. (1991) Quantitative Trait Loci for Plant Height in Four Maize Populations and Their Associations with Qualitative Genetic Loci. Theoretical and Applied Genetics, 83, 141-145. http://dx.doi.org/10.1007/BF00226242
- Veldboom, L.R. and Lee, M. (1994) Molecular-Marker-Facilitated Studies of Morphological Traits in Maize. II: Determination of QTLs for Grain Yield and Yield Components. Theoretical and Applied Genetics, 89, 451-458. http://dx.doi.org/10.1007/BF00225380
- Paterson, A.H., Lander, E.S., Hewitt, J.D., Peterson, S., Lincoln, S.E. and Tanksley, S.D. (1988) Resolution of Quantitative Traits into Mendelian Factors by Using a Complete Linkage Map of Restriction Fragment Length Polymorphisms. Nature, 335, 721-726. http://dx.doi.org/10.1038/335721a0
- Tanksley, S.D. and Nelson, J. (1996) Advanced Backcross QTL Analysis: A Method for the Simultaneous Discovery and Transfer of Valuable QTLs from Unadapted Germplasm into Elite Breeding Lines. Theoretical and Applied Genetics, 92, 191-203. http://dx.doi.org/10.1007/BF00223376
- Frary, A., Nesbitt, T.C., Grandillo, S., Knaap, E., Cong, B., Liu, J., Meller, J., Elber, R., Alpert, K.B. and Tanksley, S.D. (2000) fw2.2: A Quantitative Trait Locus Key to the Evolution of Tomato Fruit Size. Science, 289, 85-88. http://dx.doi.org/10.1126/science.289.5476.85
- Kato, K., Miura, H. and Sawada, S. (2000) Mapping QTLs Controlling Grain Yield and Its Components on Chromosome 5A of Wheat. Theoretical and Applied Genetics, 101, 1114-1121. http://dx.doi.org/10.1007/s001220051587
- Roeder, M.I.S., Huang, X.Q. and Boerner, A. (2008) Fine Mapping of the Region on Wheat Chromosome 7D Controlling Grain Weight. Functional & integrative genomics, 8, 79-86. http://dx.doi.org/10.1007/s10142-007-0053-8
- Yu, S.B., Li, J.X., Xu, C.G., Tan, Y.F., Gao, Y.J., Li, X.H., Zhang, Q.F. and Saghai Maroof, M.A. (1997) Importance of Epistasis as the Genetic Basis of Heterosis in an Elite Rice Hybrid. Proceedings of the National Academy of Sciences of the United States of America, 94, 9226-9231. http://dx.doi.org/10.1073/pnas.94.17.9226
- Xing, Y.Z., Tan, Y.F., Hua, J.P., Sun, X.L., Xu, C.G. and Zhang, Q.F. (2002) Characterization of the Main Effects, Epistatic Effects and Their Environmental Interactions of QTLs on the Genetic Basis of Yield Traits in Rice. Theoretical and applied genetics, 105, 248-257. http://dx.doi.org/10.1007/s00122-002-0952-y
- Yoon, D.B., Kang, K.H., Kim, H.J., Ju, H.G., Kwon, S.J., Suh, J.P., Jeong, O.Y. and Ahn, S.N. (2006) Mapping Quantitative Trait Loci for Yield Components and Morphological Traits in an Advanced Backcross Population between Oryza grandiglumis and the O. sativa Japonica Cultivar Hwaseongbyeo. Theoretical and applied genetics, 112, 1052-1062. http://dx.doi.org/10.1007/s00122-006-0207-4
- McCouch, S.R. and Doerge, R.W. (1995) QTL Mapping in Rice. Trends in Genetics, 11,482-487. http://dx.doi.org/10.1016/S0168-9525(00)89157-X
- Xiao, J., Li, J., Grandillo, S., Ahn, S.N., Yuan, L., Tanksley, S.D. and McCouch, S.R. (1998) Identification of Trait-Improving Quantitative Trait Loci Alleles from a Wild Rice Relative Oryza rufipogon. Genetics, 150, 899-909.
- Thomson, M.J., Tai, T.H., McClung, A.M., Lai, X.H., Hinga, M.E., Lobos, K.B., Xu, Y., Martinez, C.P. and McCouch, S.R. (2003) Mapping Quantitative Trait Loci for Yield, Yield Components and Morphological Traits in an Advanced Backcross Population between Oryza rufipogon and the Oryza sativa Cultivar Jefferson. Theoretical and Applied Genetics, 107, 479-493. http://dx.doi.org/10.1007/s00122-003-1270-8
- Ashikari, M., Sakakibara, H., Lin, S., Yamamoto, T., Takashi, T., Nishimura, A., Angeles, E.R., Qian, Q., Kitano, H. and Matsuoka, M. (2005) Cytokinin Oxidaseregulates Rice Grain Production. Science, 309, 741-745. http://dx.doi.org/10.1126/science.1113373
- Chu, S.H., Jiang, W., Lee, J., Chin, J.H., Koh, H.J., Song, X.J., Huang, W., Shi, M., Zhu, M.Z. and Lin, H.X. (2007) A QTL for Rice Grain Width and Weight Encodes a Previously Unknown RING-Type E3 Ubiquitin Ligase. Nature Genetics, 39, 623-630. http://dx.doi.org/10.1038/ng2014
- Fasoulas, A.C. and Allard, R.W. (1962) Nonallelic Gene Interactions in the Inheritance of Quantitative Characters in Barley. Genetics, 47, 899-907.
- Paterson, A.H., Damon, S., Hewitt, J.D, Zamir, D., Rabinowitch, H.D., Lincoln, S.E., Lander, E.S. and Tanksley, S.D. (1991) Mendelian Factors Underlying Quantitative Traits in Tomato: Comparison across Species, Generations, and Environments. Genetics, 127, 181-197.
- Zhuang, J.Y., Lin, H.X., Lu, J., Qian, H.R., Hittalmani, S., Huang, N. and Zheng, K.L. (1997) Analysis of QTL×Environment Interaction for Yield Components and Plant Height in Rice. Theoretical and Applied Genetics, 779, 799-808. http://dx.doi.org/10.1007/s001220050628
- Campbell, T., Baenziger, P.S., Gill, K.S., Eskridge, K.M., Budak, H., Erayman, M., Dweikat, I. and Yen, Y. (2003) Identification of QTLs and Environmental Interactions Associated with Agronomic Traits on Chromosome 3A of Wheat. Crop Science, 43, 1493-1505. http://dx.doi.org/10.2135/cropsci2003.1493
- Lincoln, S., Daley, M. and Lander, E. (1992) Constructing Genetic Maps with MAPMAKER/EXP 3.0. Whitehead Institute Technical Report, 3rd Edition.
- Zeng, Z.B. (1994) Precision Mapping of Quantitative Trait Loci. Genetics, 136, 1457-1468.
- Basten, J., Weir, B.S. and Zeng, Z.B. (2005) QTL Cartographer, Version 1.17. Department of Statistics, North Carolina State University, Raleigh.
- Wang, L., Zhu, J., Li, Z.K. and Paterson, A.H. (1999) Mapping QTLs with Epistatic Effects and QTL×Environment Interactions by Mixed Linear Model Approaches. Theoretical and Applied Genetics, 99, 1255-1264. http://dx.doi.org/10.1007/s001220051331
- Yano, M., Kojima, S., Takahashi, Y., Lin, H. and Sasaki, T. (2001) Genetic Control of Flowering Time in Rice, a Short-Day Plant. Plant Physiology, 127, 1425-1429. http://dx.doi.org/10.1104/pp.010710
- Tan, L.B., Zhang, P.J., Liu, F.X., Wang, G.J., Ye, S., Zhu, Z.F., Fu, Y.C., Cai, H.W. and Sun, C.Q. (2008) Quantitative Trait Loci Underlying Domesticationand yield-Related Traits in an Oryza sativa × Oryza rufipogon Advanced Backcross Population. Genome, 51, 692-704. http://dx.doi.org/10.1139/G08-054
- Cho, Y.G., Kang, H.J., Lee, J.S., Lee, Y.T., Lim, S.J., Gauch, H., Eun, M.Y. and McCouch, S.R. (2007) Identification of Quantitative Trait Loci in Rice for Yield, Yield Components, and Agronomic Traits across Years and Locations. Crop Science, 47, 2403-2417. http://dx.doi.org/10.2135/cropsci2006.08.0509
- Zhao, X., Qin, Y. and Sohn, J.K. (2010) Identification of Main Effects, Epistatic Effects and Their Environmental Interactions of QTLs for Yield Traits in Rice. Genomics, 32, 37-45.
- Zhang, Z.H., Li, P., Wang, L.X., Hu, Z.L., Zhu, L.H. and Zhu, Y.G. (2004) Genetic Dissection of the Relationships of Biomass Production and Partitioning with Yield and Yield Related Traits in Rice. Plant Science, 167, 1-8.http://dx.doi.org/10.1016/j.plantsci.2004.01.007
- You, A., Lu, X., Jin, H., Ren, X., Liu, K., Yang, G., Yang, H., Zhu, L. and He, G. (2006) Identification of Quantitative Trait Loci across Recombinant Inbred Lines and Testcross Populations for Traits of Agronomic Importance in Rice. Genetics, 172, 1287-1300. http://dx.doi.org/10.1534/genetics.105.047209
- Lin, H.X., Qian, H.R., Zhuang, J.Y., Lu, J., Min, S.K., Xiong, Z.M., Huang, N. and Zheng, K.L. (1996) RFLP Mapping of QTLs for Yield and Related Characters in Rice (Oryza sativa L.). Theoretical and Applied Genetics, 92, 920-927. http://dx.doi.org/10.1007/BF00224031
NOTES

*Corresponding author.