Natural Science
Vol.4 No.8A(2012), Article ID:21652,7 pages DOI:10.4236/ns.2012.428080
Multi-parametric analysis for forecasting volcanic and seismic phenomena
![]()
1Energy and Environment Division of D.I.I.M., University of Catania, Catania, Italy
2Department of Physics and Astronomy, University of Catania, Catania, Italy;*Corresponding Author: daniela.morelli@ct.infn.it
3Department of Geology Science, University of Catania, Catania, Italy
Received 26 April 2012; revised 28 May 2012; accepted 11 June 2012
Keywords: Volcanic-Seismic Event; Monitoring; Emission; Ultrafine Dust; Radon
ABSTRACT
The history of the Etna volcano (Sicily) is marked by the alternation of brief intervals of eruptive activity and long periods of apparent inactivity. Usually during the periods of pseudo-inactivity, there are evident symptoms that the volcano is still active, e.g. fumaroles, hot springs and gaseous emissions. The variation of previous phenomena may be used to forecast seismic and volcanic-events. The aim of this research has been to evaluate and analyze the variation in emissions of ultra fine dusts and in soil Radon concentration, during the period of pseudo–inactivity, to obtain indexes able to forecast the possible events. Investigations have been carried out near two active faults on the slopes of Mt. Etna. The present paper presents the results of the monitoring survey, the analysis methodology and the development of the index to forecast possible seismic events. Research is currently in progress to refine the index which could be utilized not only to forecast possible seismic volcanic events, but also as a key to give early warning to the Civil Protection Agency so that they may be ready in time as soon as an eruptive event will occur.
1. INTRODUCTION
All along the times the humanity have tried to forecast seismic and volcanic events.
Earthquake predictions are based mainly on the observation of precursory phenomena. However, the physical mechanism of earthquakes and precursors is at present poorly understood, because the factors and conditions governing them are so complicated. Methods of prediction based merely on precursory phenomena are therefore purely empirical and involve many practical difficulties.
A seismic precursor is a phenomenon which takes place sufficiently prior to the occurrence of an earthquake. These precursors are of various kind, such as ground deformation, changes in sea-level, in tilt and strain and in earth tidal strain, foreshocks, anomalous seismicity, change in b-value, in microsismicity, in earthquake source mechanism, hypocentral migration, crustal movements, changes in seismic wave velocities, in the geomagnetic field, in telluric currents, in resistivity, in radon content, in groundwater level, in oil flow, and so on. These phenomena provide the basis for prediction of the three main parameters of an earthquake: place and time of occurrence and magnitude of the seismic event.
The most important problem with all these precursors is to distinguish signals from noise. A single precursor may not be helpful, the prediction program strategy must involve an integral approach including several precursors.
Moreover, in order to evaluate precursory phenomena properly and to be able to use them confidently for predictive purposes, one has to understand the physical processes that give rise to them. Physical models of precursory phenomena are classified in two broad categories: those based on fault constitutive relations, which predict fault slip behavior but no change in properties in material surrounding the fault, and those based on bulk rock constitutive relations, which predict physical property changes in a volume surrounding the fault. Nucleation and lithospheric loading models are the most prominent of the first type and the dilatancy model is of the second type [1-4].
The problems increase when there is the presence of both volcanic and tectonic structures as in the case of Mt. Etna were our investigations have been carried out.
Several studies have been carried out on Mt. Etna with the purpose to find possible earthquakes or eruptions precursors. Many of them have been carried out investigating radon concentration trends [5-11]. The peculiarity of this study is that to have used multi-parameter: suspended particles, gas emission and radon in-soil, to investigate volcano geophysical behaviour.
2. SITES OF INVESTIGATION
The Etnean area is characterized by several tectonic structures. We have carried out our investigations in two sites chosen considering the most active faults. In the Etnean area several fault systems became very active before and sometime during eruptive events. The most extended among the cropping up structural discontinueties have been chosen, which lays along the NE-SW direction through the volcano. The first site (Biancavilla) is placed in the SW flank, while the second site (VenaPiedimonte Etneo) in the NE one. Structurally the set of faults, which characterizes the south-western flank near Biancavilla (where the first station is located) represents the extension, along the NE-SW direction, of northeastern fault-system of the Naca and Piedimonte area (in which the second station is located).
Several researchers [12,13] have observed that the fault segment in the South West Mt. Etna sector, become significantly seismic active when an eruptive event is coming; instead the segment in the NE sector and in the Valle del Bove valley shows a seismicity at less energy, however it is site of eruptions sometimes very dangerous for the neighboring villages.
The Figure 1 shows a view of the fault system and the site locations.
The first site (Biancavilla) is located at about 1,100 meters above the sea level, between Biancavilla and Ragalna villages, in a region in which the Biancavilla fault and the Ragalna fault are predominant [14].
The second site (Vena) is located at about 740 m above the sea level [14].
3. METHODOLOGY
The measurements have been carried out from August 2001 to October 2002, using the following measuring instruments:
• Meteorological stations;
• Mini environmental dust monitor;
• Portable IR analyzer;
• Soil radon detector and seismic station.
The meteorological parameters have been detected by means of a Babuc ABC meteo-climatic stations. The measured data have been registered with a time intervals of one hour.
Particulate matters have been measured using the En-
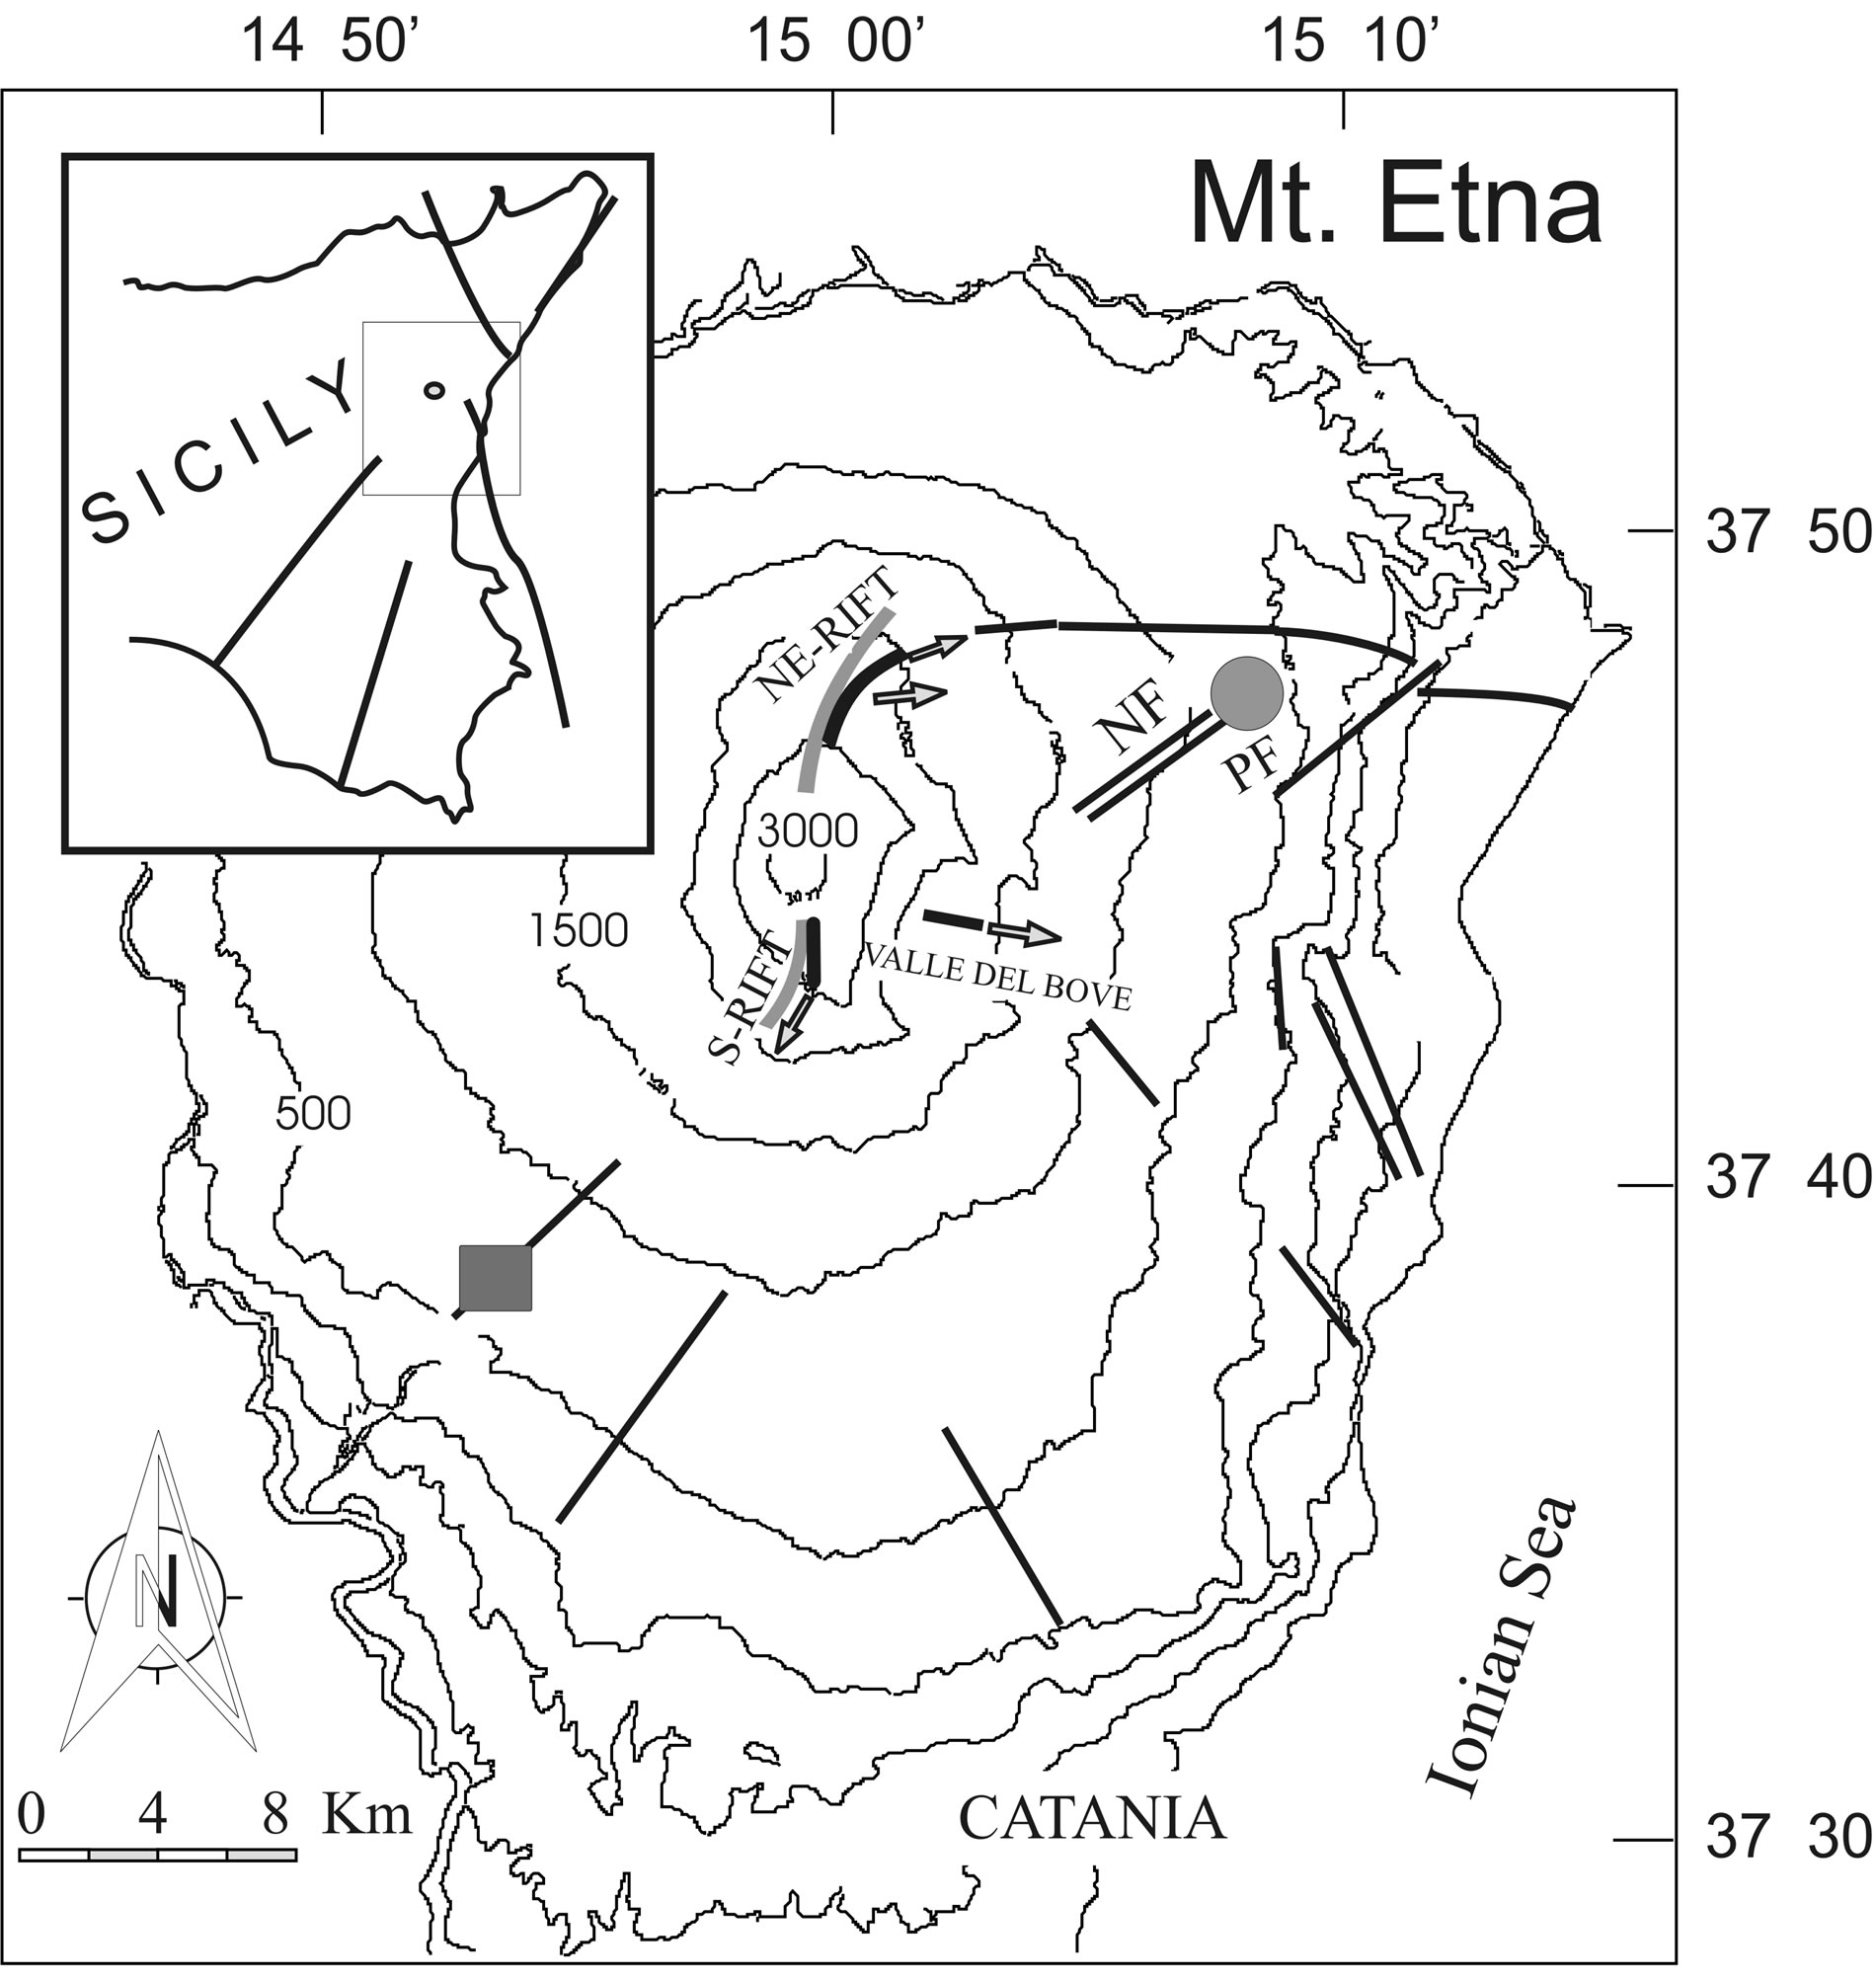
Figure 1. Mt. Etna Volcano—Vena site (●); Biancavilla site (■).
virocheck Grimm Model 107 that performs particulate size measurements by 90-degree laser light scattering of ultra fine dust concentrations (PM10, P2.5, PM1). The measured data have been registered with a time intervals of 10 minutes.
Carbon dioxide concentrations have been measured by the portable air meter analyzer Miran 1B2: based on the IR methodology. The measured data have been Registered with a time intervals of 10 minutes.
Soil radon concentrations have been measured using a portable system that uses an ionization chamber to detect alpha-particles from Radon decay (Alpha Gurad-Genitron). The drawing system of soil gas consists of a drilling rod with an exchangeable drilling tip, with air-lock closed by a rivet and a capillary probe. The drilling rod is driven into the ground and a capillary probe is inserted into the drilling rod, the higher part of the capillary probe is connected to a filter in order to eliminate the moisture, then to a progeny filter that allow the 222Rn pass only. The system is connected to the ionization chamber by means of a pump. Counting time was 10 minutes, the flow rate of 0.05 l/min, and the probe was driven into the soil at 1 m depth, in order to reduce meteorological influence [15].
The seismic event have been measured by a seismic station that is composed by a three directional 1 Hz seismometer connected with a portable digital acquisition data system and a GPS time signal receiver.
All registered data have been processed and analyzed using an appropriate spreadsheet able to calculate minimum, mean and maximum values of monitoring survey.
4. DATA ANALYSIS
4.1. Biancavilla Site
The analysis of survey data provided the following information:
• Very irregular wind velocity, generally varying between 0.7 m/s and 3.9 m/s, with a maximum peak value of 5.6 m/s.
• Typical seasonal temperature trend varying between 6˚C and 7˚C.
• Daily CO2 concentration varying from 420 ppm to 490 ppm. The highest values have been found during the night and the lowest values during the day, in accordance with the processes of chlorophyll photosynthesis.
• Low values of PM concentration, varying daily around 20 mg/m3.
The Figure 2 shows the CO2 concentrations measured during a day with seismic events.
It has been noted that mean daily in-soil radon concentrations have a clear seasonal trend, with a cyclicity that can be linked to the weather conditions.
A multi regression analysis has been performed to take into account the influence of the meteorological parameters and to investigate possible radon anomalies not linked to the natural seasonal variations, using the recorded meteorological parameters (Temperature, Humidity and Pressure).
We fitted our data with the following function:
 (1)
(1)
where A, B, C and D are the fit parameters, T, H and P the Temperature, Humidity an pressure values respectively.
Using fit parameters we determined the theoretical radon trend curve (function of the weather conditions) as reported in Figure 3.
The radon anomalies were afterwards investigated on CO2
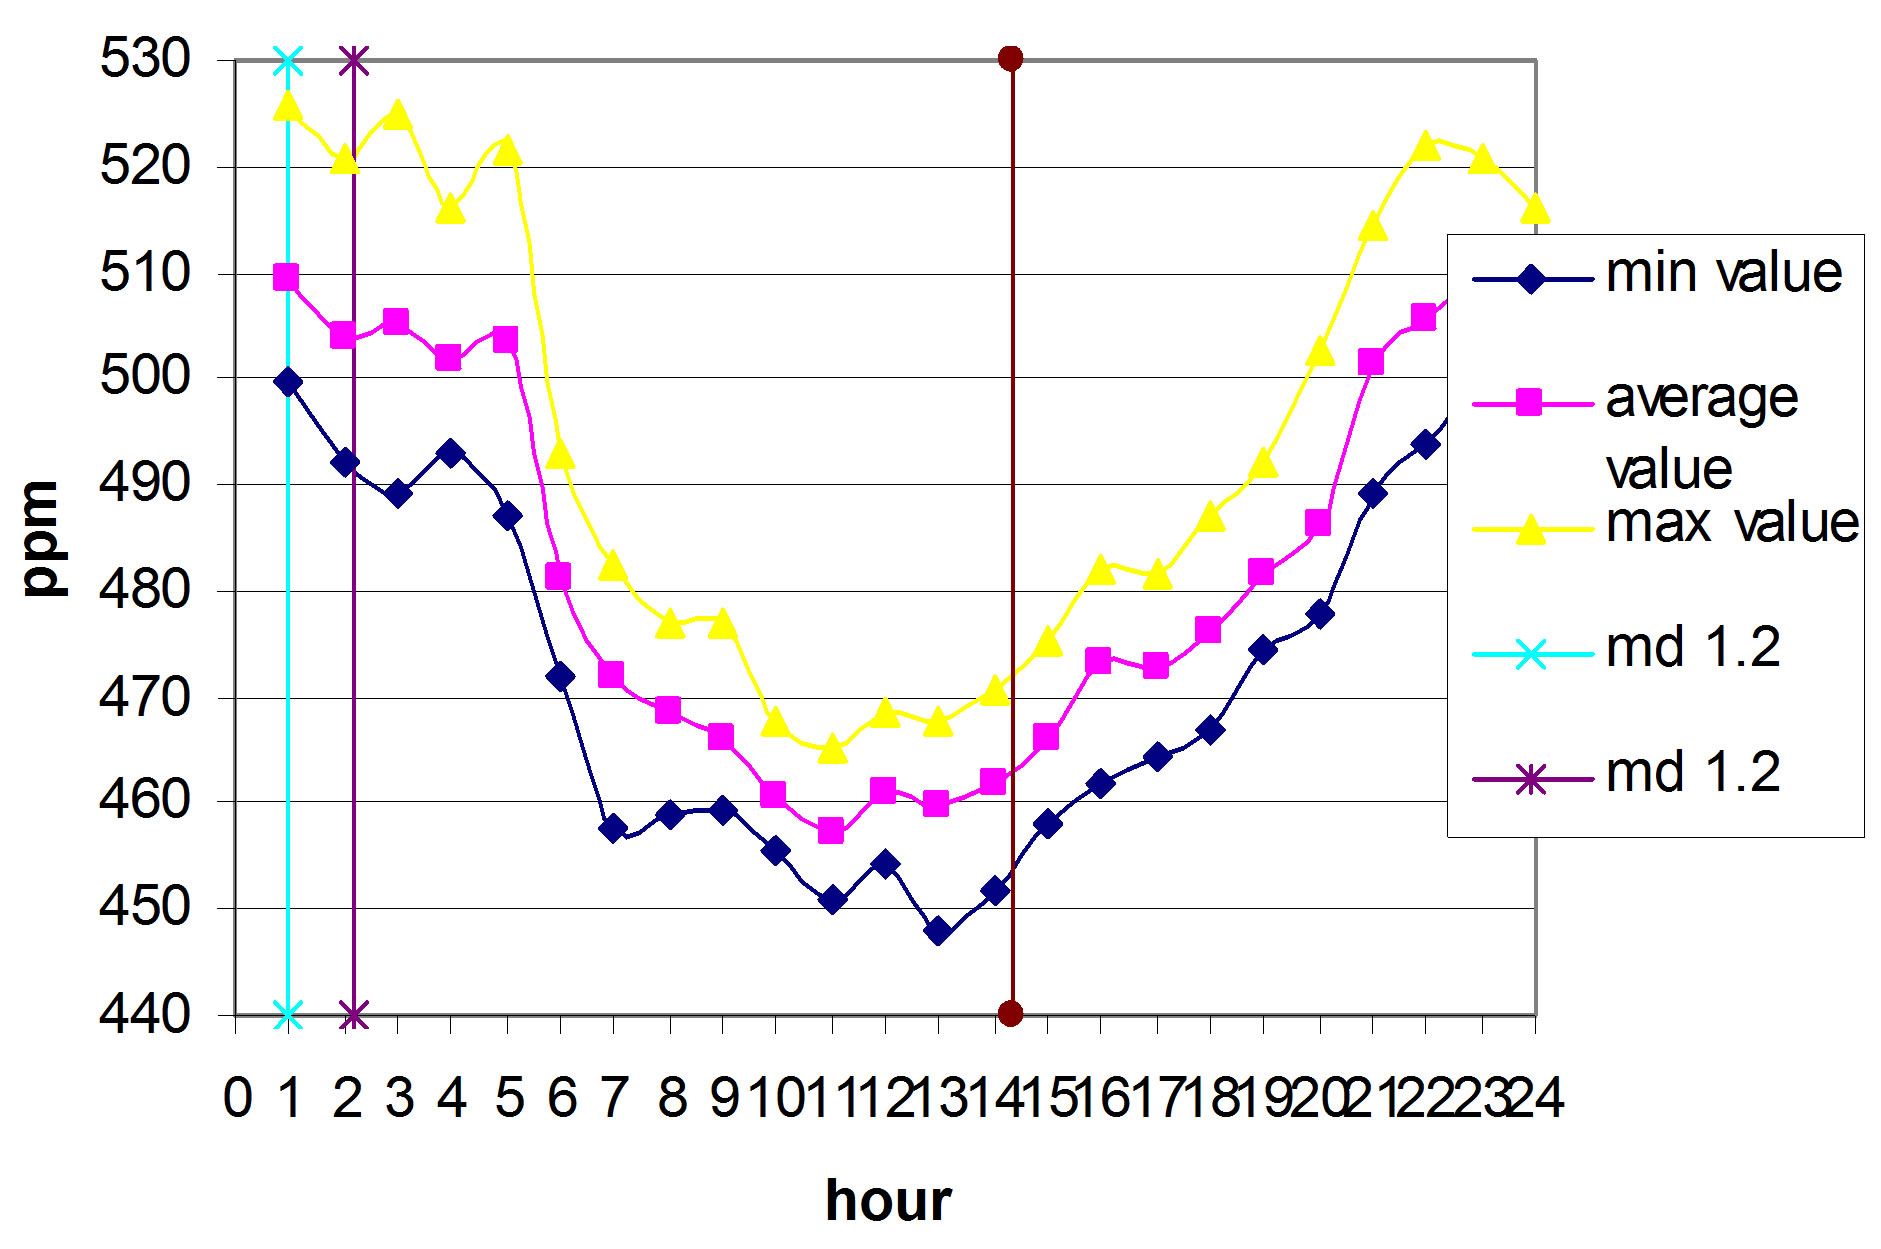
Figure 2. CO2 concentrations measured during a day with seismic events.

Figure 3. Daily in soil Radon concentrations measured (black) and calculated (red).
data smoothed by the seasonal trend considering the following quantity:
 (2)
(2)
where Rnmeas are the experimental values and Rnth the calculated one.
4.2. Vena Site
The analysis of survey data provided the following information:
• Regular trend of wind direction: from E-SE in the morning, from W-NW at midday, from E-SE at night.
• Typical seasonal temperature trend, varying between –5˚C and 25˚C
• Daily CO2 varying between 500 ppm and 600 ppm in the months of April-May and 440 to 540 ppm in June-July. The highest values were found during the night and the lowest during the day, in accordance with the trend of chlorophyll photosynthesis processes, as above.
• Daily PMi concentration varying between 15 mg/m3 and 50 mg/m3.
• Some isolated cases of very high PMi concentration values (150 mg/m3), caused by local human interfereence.
Figure 4 shows the PMx (PM10; PM2.5 and PM1.0) concentrations measured during a day with seismic event.
Mean daily in soil radon concentrations record from August 2001 till October 2002 are reported in the Figure 5.
Also for the NE site the recorded in-soil radon concentration data shown a seasonal trend and the same multiple regression analysis, using meteorological parameter, was carried out too. The obtained theoretical curve is reported in figure.

Figure 4. PMx concentrations measured during a day with seismic event.

Figure 5. Daily in soil Radon concentrations measured (black) and calculated (red).
It is possible to observe that the experimental values are anomalous respect to expected values.
5. CORRELATION WITH SEISMIC EVENTS
The acquired data have been compared with the local seismicity recorded during the measurements period. In particular the measured PMx and CO2 data have been compared with the total daily number of earthquake occurred and with their magnitude.
Figures 6 and 7 show examples of the daily trend of CO2 and PMx, respectively, measured during a day for which seismic events were registered.
Post processing of whole values for each day of measurement have been summarized in tabular form with reference to the following data:
• Peak values of CO2 concentration;
• Peak values of PM concentration;
• Magnitude of occurred seismic-events;
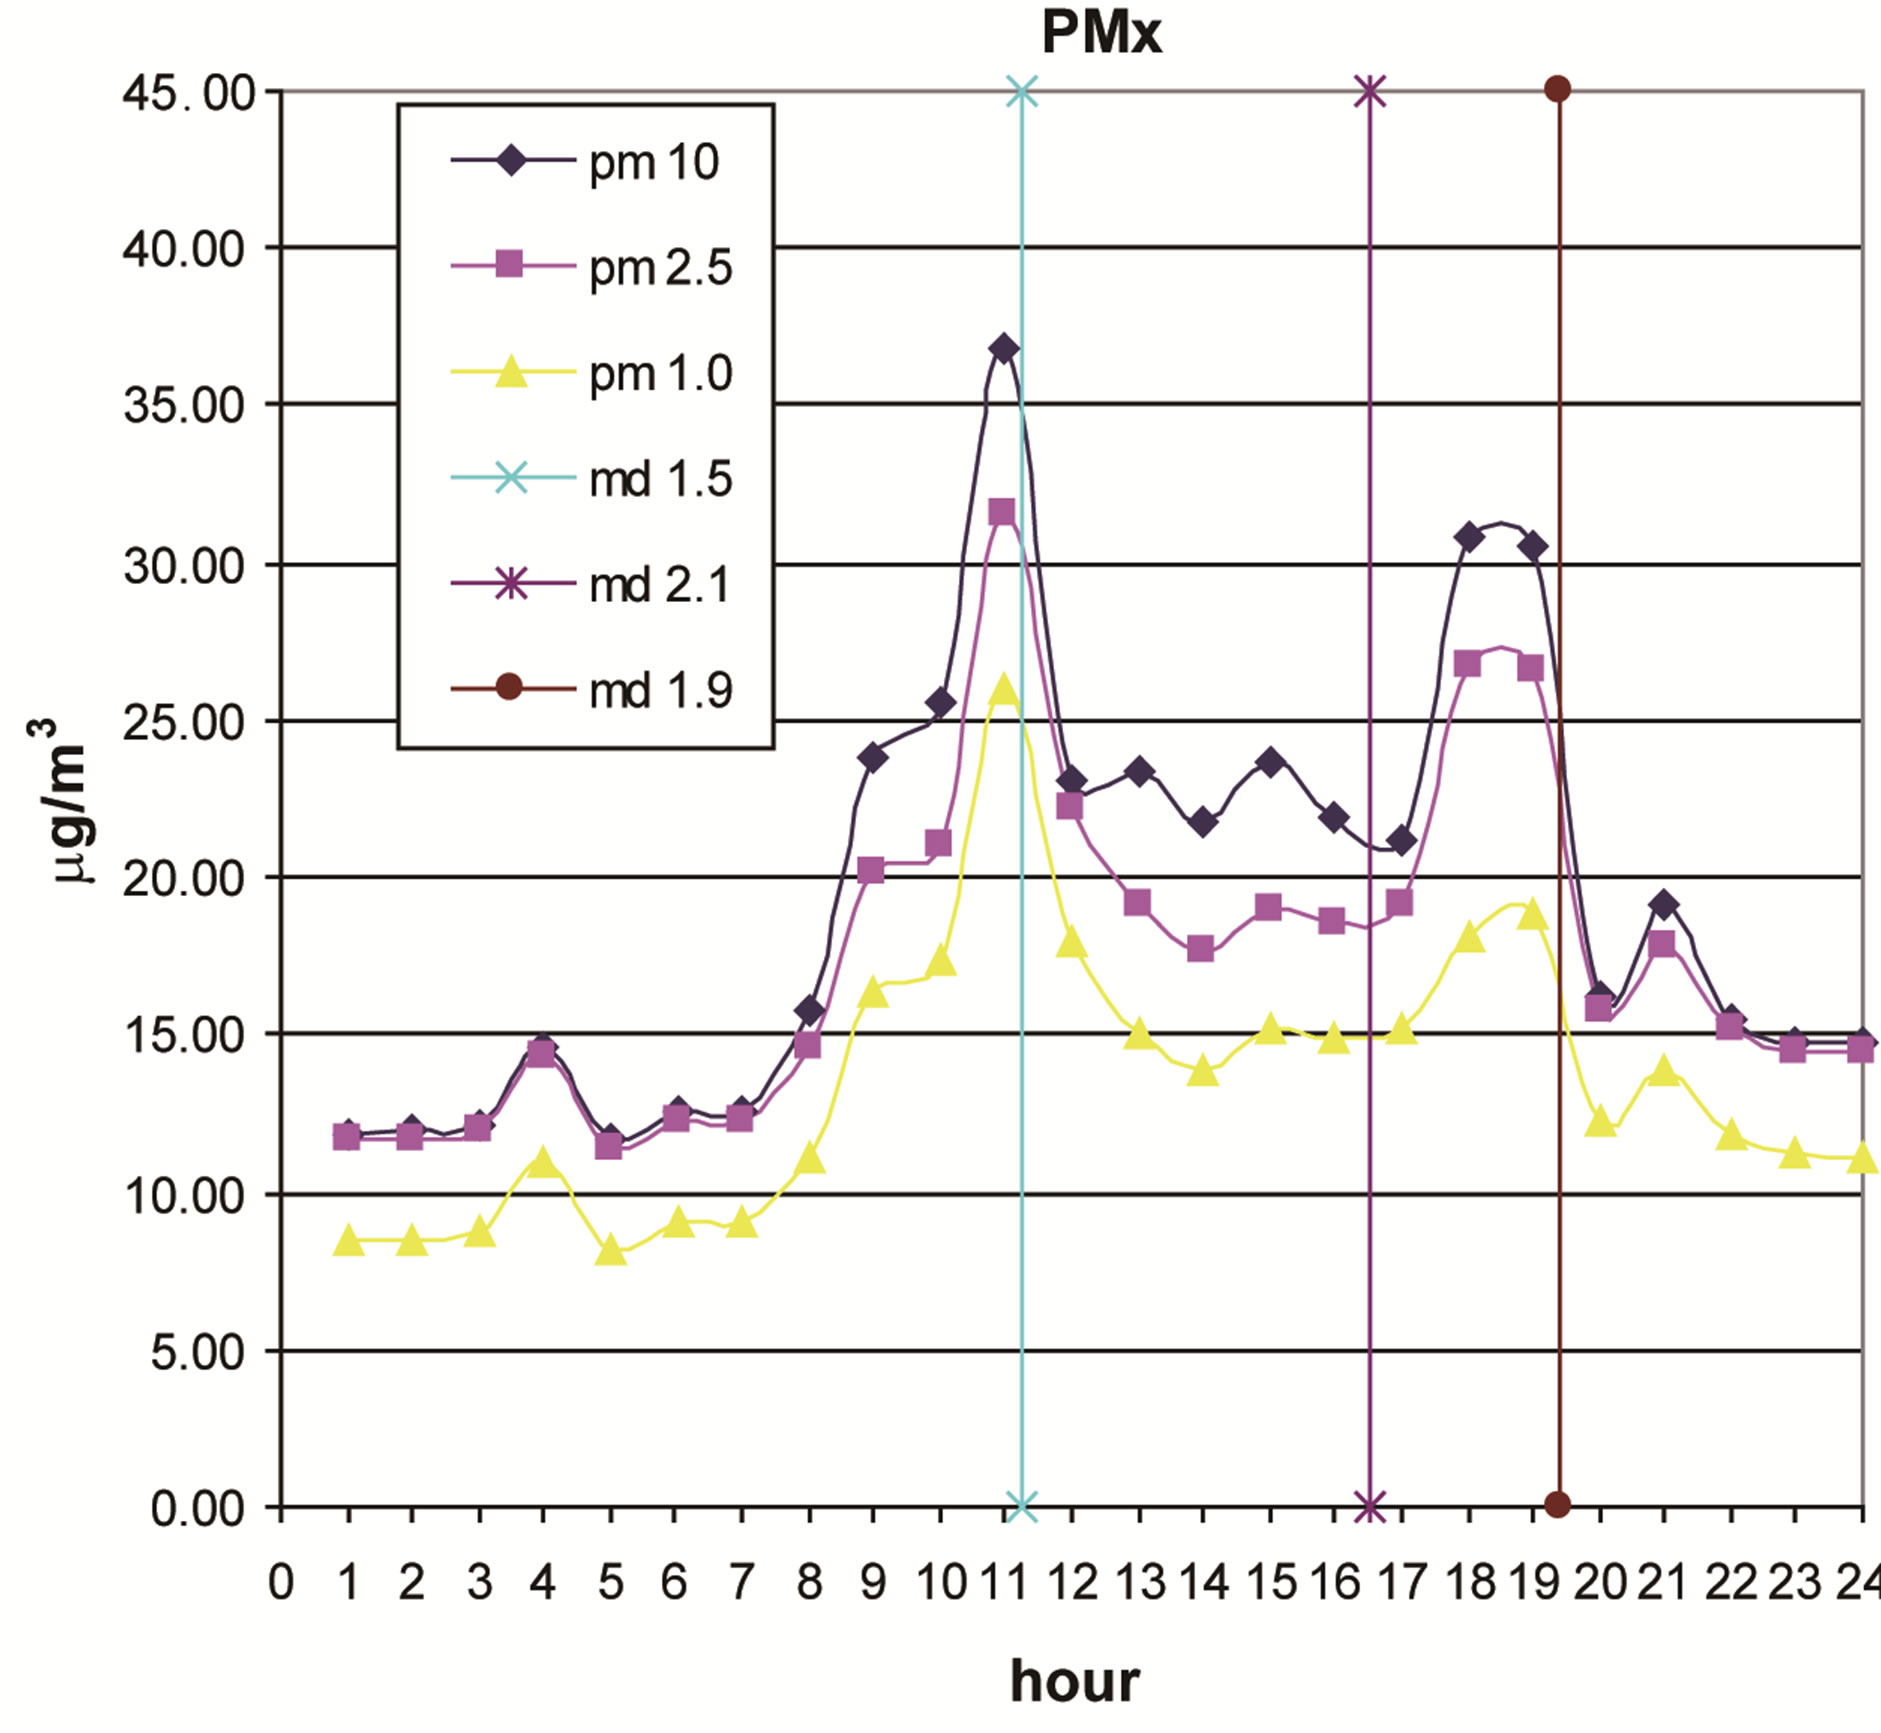
Figure 6. PMx concentration measured in the NE site (Vena) in a days in which seismic events occurred.
CO2

Figure 7. CO2 concentration measured in the NE site (Vena) during a day in which seismic events of magnitude between Md 1.2 and Md 2 occurred. The time of the seismic events and their magnitude are indicated by vertical lines of different colors in the graph.
• Velocity and direction of wind.
At first glance, survey data show that there is no evident correlation of maximum values of CO2 and PM concentrations with seismic-events.
In fact, it has been noted that seismic-events sometimes occur before and sometimes after peak values; moreover peak values did not vary significantly during days with high seismic activity (number and intensity).
The Figure 8 shows the mean daily trend in PM10 concentration compared with mean daily magnitude
5.1. PM10 Analysis
Further analysis were performed using only the concentrations of PM10 being the PM10 the most widely
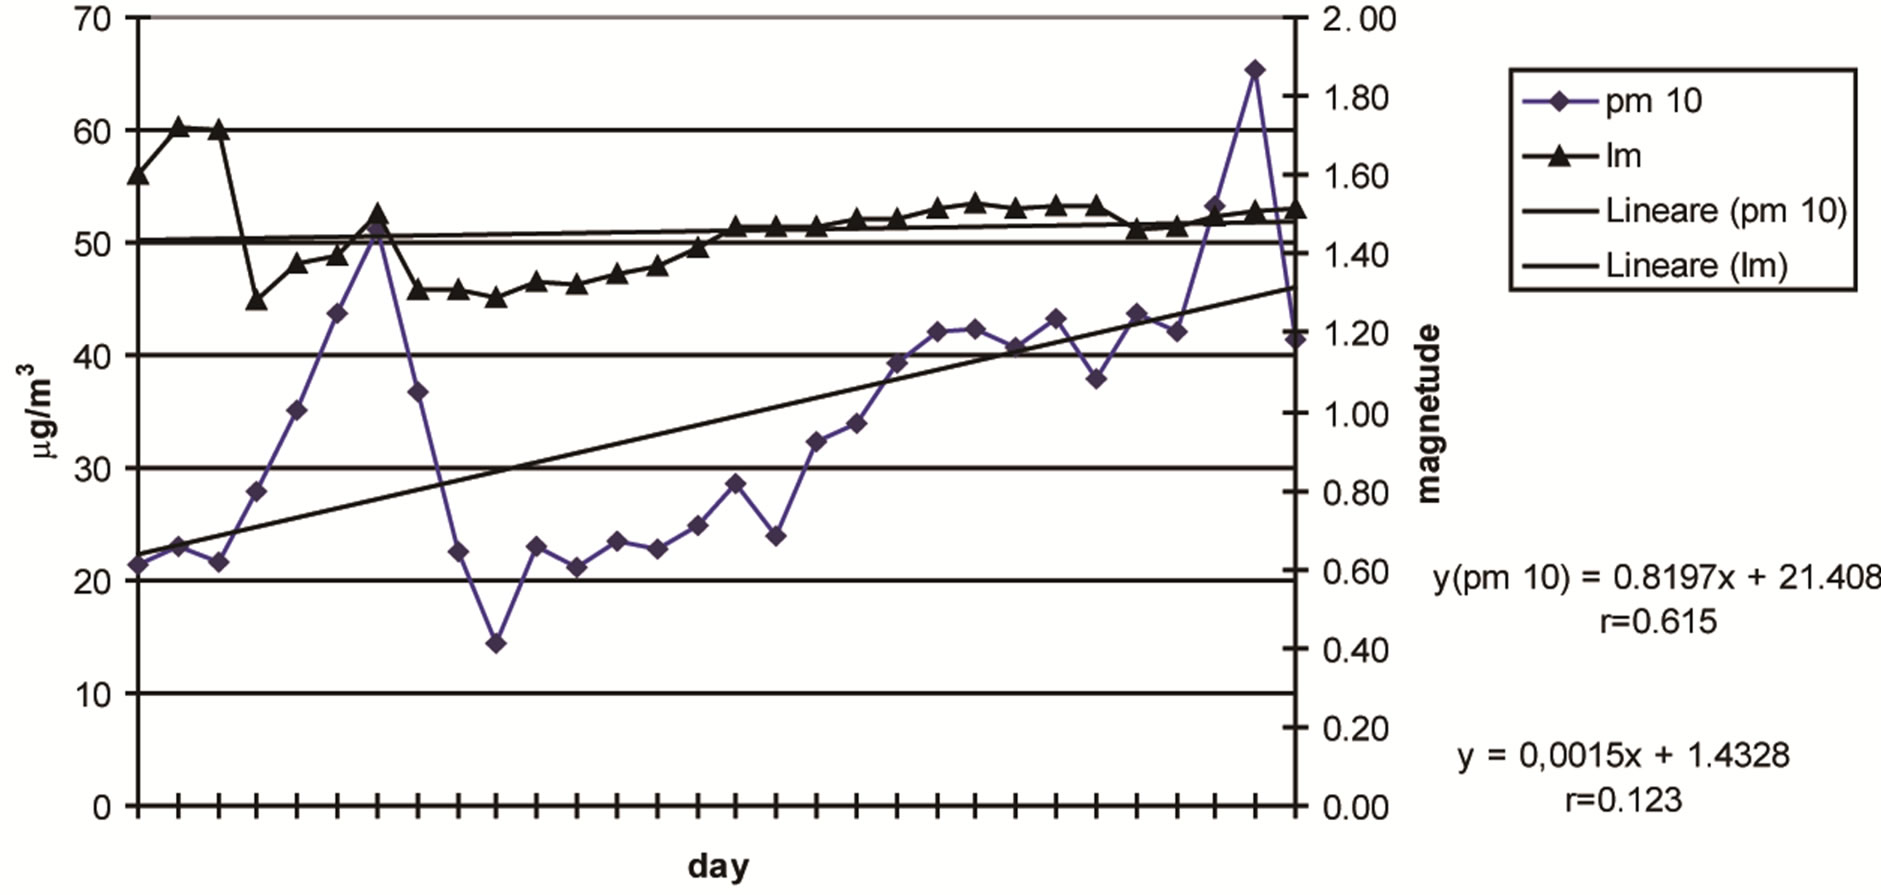
Figure 8. Mean daily trend in PM10 concentration compared with mean daily magnitude.
parameter used for the studies of volcanic ashes fallout [16-18] and because the trends of variation of PM2.5 are quite similar to PM10.
In any case other analysis have been performed with the aim of find possible correlation between PM10 concentrations and the parameter termed “Seismicity of Period” (Im) that is the average intensity of earthquakes occurring in a given period of time.
 (3)
(3)
where:
Im(i) = Average of seismic magnitudes of i-day;
n = Number of consecutive days investigated.
We have compared the daily mean PM10 concentrations with the Seismicity of Period, as shown in Figure 9, and noticed that an increasing (or decreasing) trend in PM10 concentration is correlated to an increasing (or decreasing) trend in Im.
For evaluate the goodness of this possible correlation, the researchers have interpolated the acquired data using some mathematical regression but they haven’t obtained appreciable results. In fact, not only the indices had very low correlations, but also the data did not present the same law for different measurement periods: great variations for each time period investigated measurement periods.
Considering that short period analysis (monthly) did not permit to define any clear correlation between PM10 concentrations and seismic events, the researchers have proceeded to analyze phenomena during a period of three-month.
We have defined a parameter termed “Force Peak” (FP) that is the “condition” that happen when the PM10 present at least three consecutive days of increasing concentration followed at least of three days of decreasing concentration.
The FP has been afterwards correlated with the more significant seismic events, i.e. with an intensity greater than 2 on the Richter scale.
In this way, it has been built a graph where was reported the mean daily PM10 concentration with both mean and maximum daily magnitude (Figure 10) and with the daily number of seismic events (Figure 11).
The analysis of the above graphs have prompted the following considerations:
• An FP of PM10 is followed by significant seismic activity
• FP of PM10 is followed, in 90% of cases, by significant seismic-volcanic activity within three days.
• The constant increase in daily main value of PM10 after an FP is matched by an increase in seismic activity and, in some cases, as well as earthquakes of increasing magnitude, there is also an increasing number of seismic swarms.

Figure 9. Analysis of correlation between PM10 and Im.
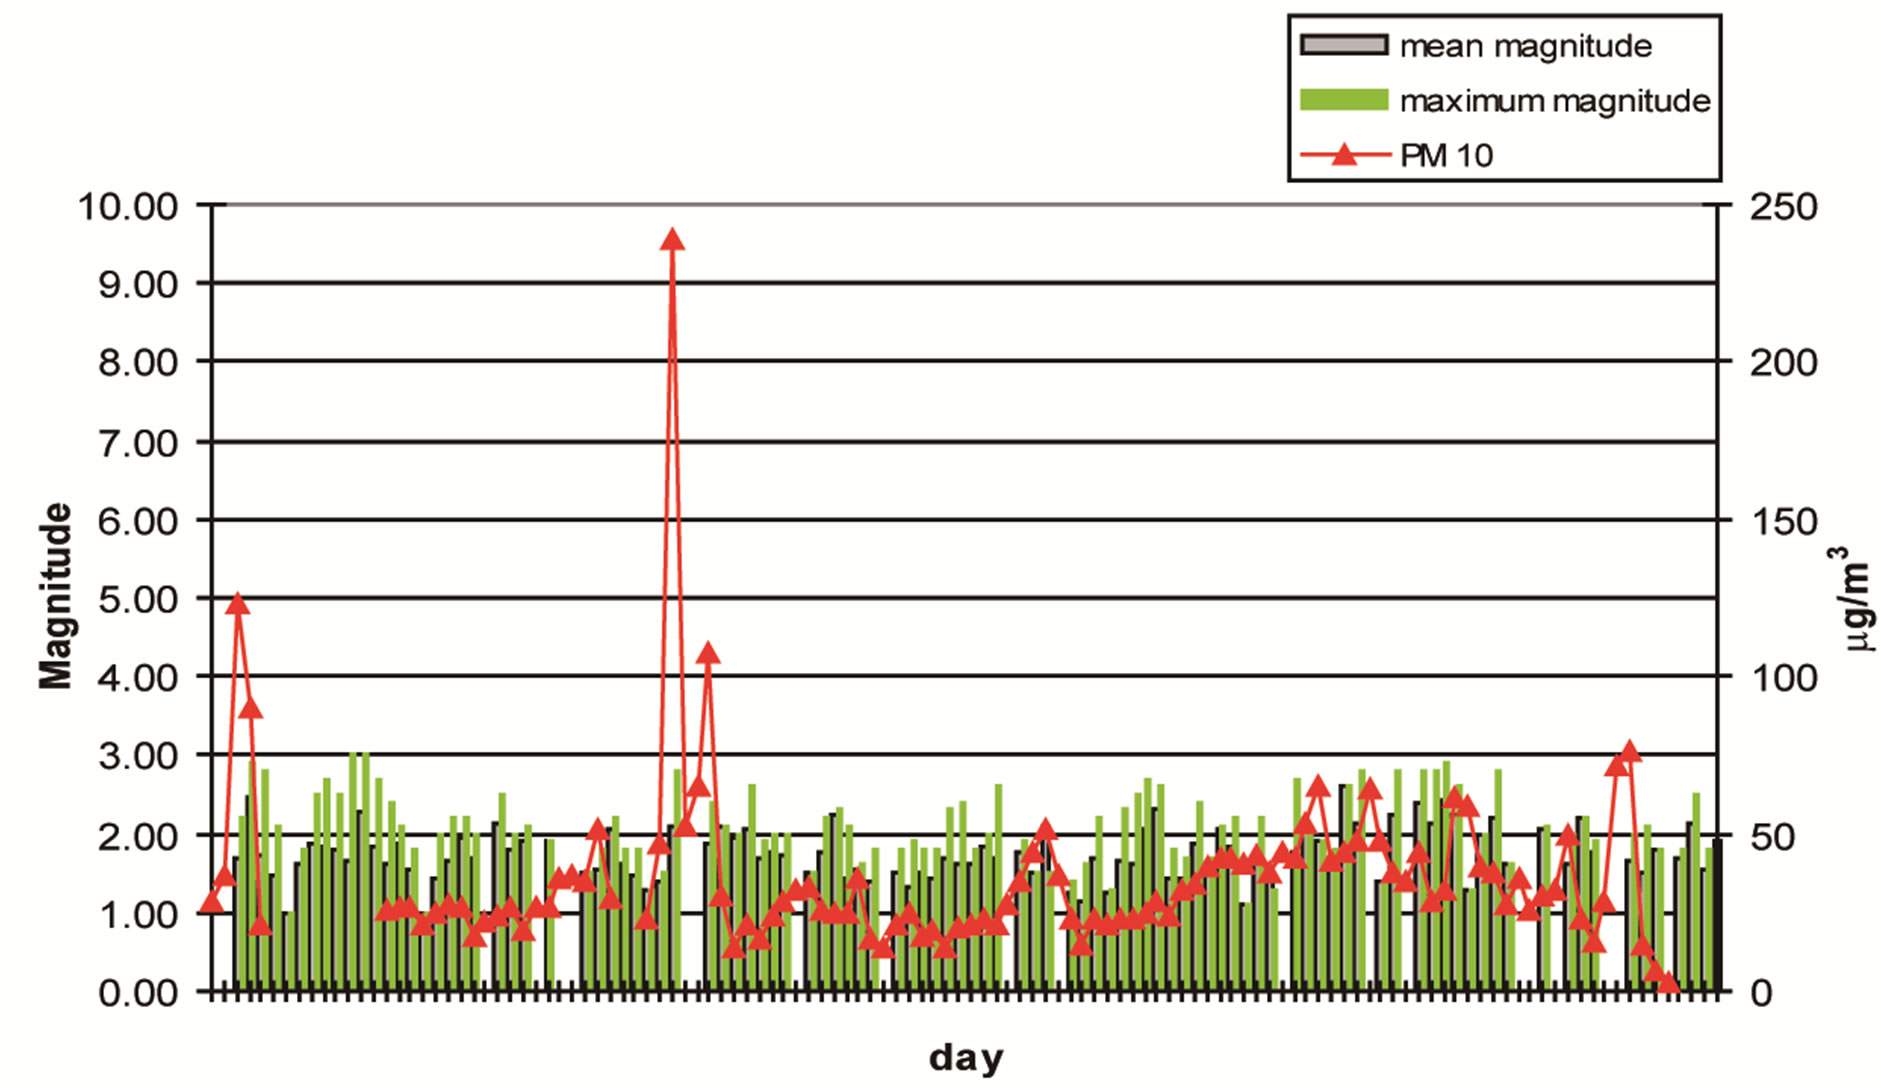
Figure 10. Mean daily trend in PM10 concentration compared with mean and maximums value of magnitude of seismic event.

Figure 11. Mean daily trend in PM10 concentration compared with daily number of seismic events.
• The presence of many FP over a short time interval together with high values of PM10 concentration, marks a period with seismic events of considerable magnitude, also in accordance with the comments made above using the Seismicity of Period (seismic response to a trend in increasing PM10 concentration) as analysis parameter.
5.2. Radon Analysis
Soil radon concentrations have also been compared with seismic events occurred. As described in the previous section, the comparison has carried out on the data filtered by the meteorological influence. A mean value was also calculated and as standard we defined an anomaly a value higher than the mean plus two times the standard deviation (blue line in picture). In Figures 12 and 13 are reported the Radon data compared respectively with the number of earthquake and the magnitude for the SW site.
It is possible to observe some radon anomalies not all linked to earthquakes. The higher were recorded the 11th
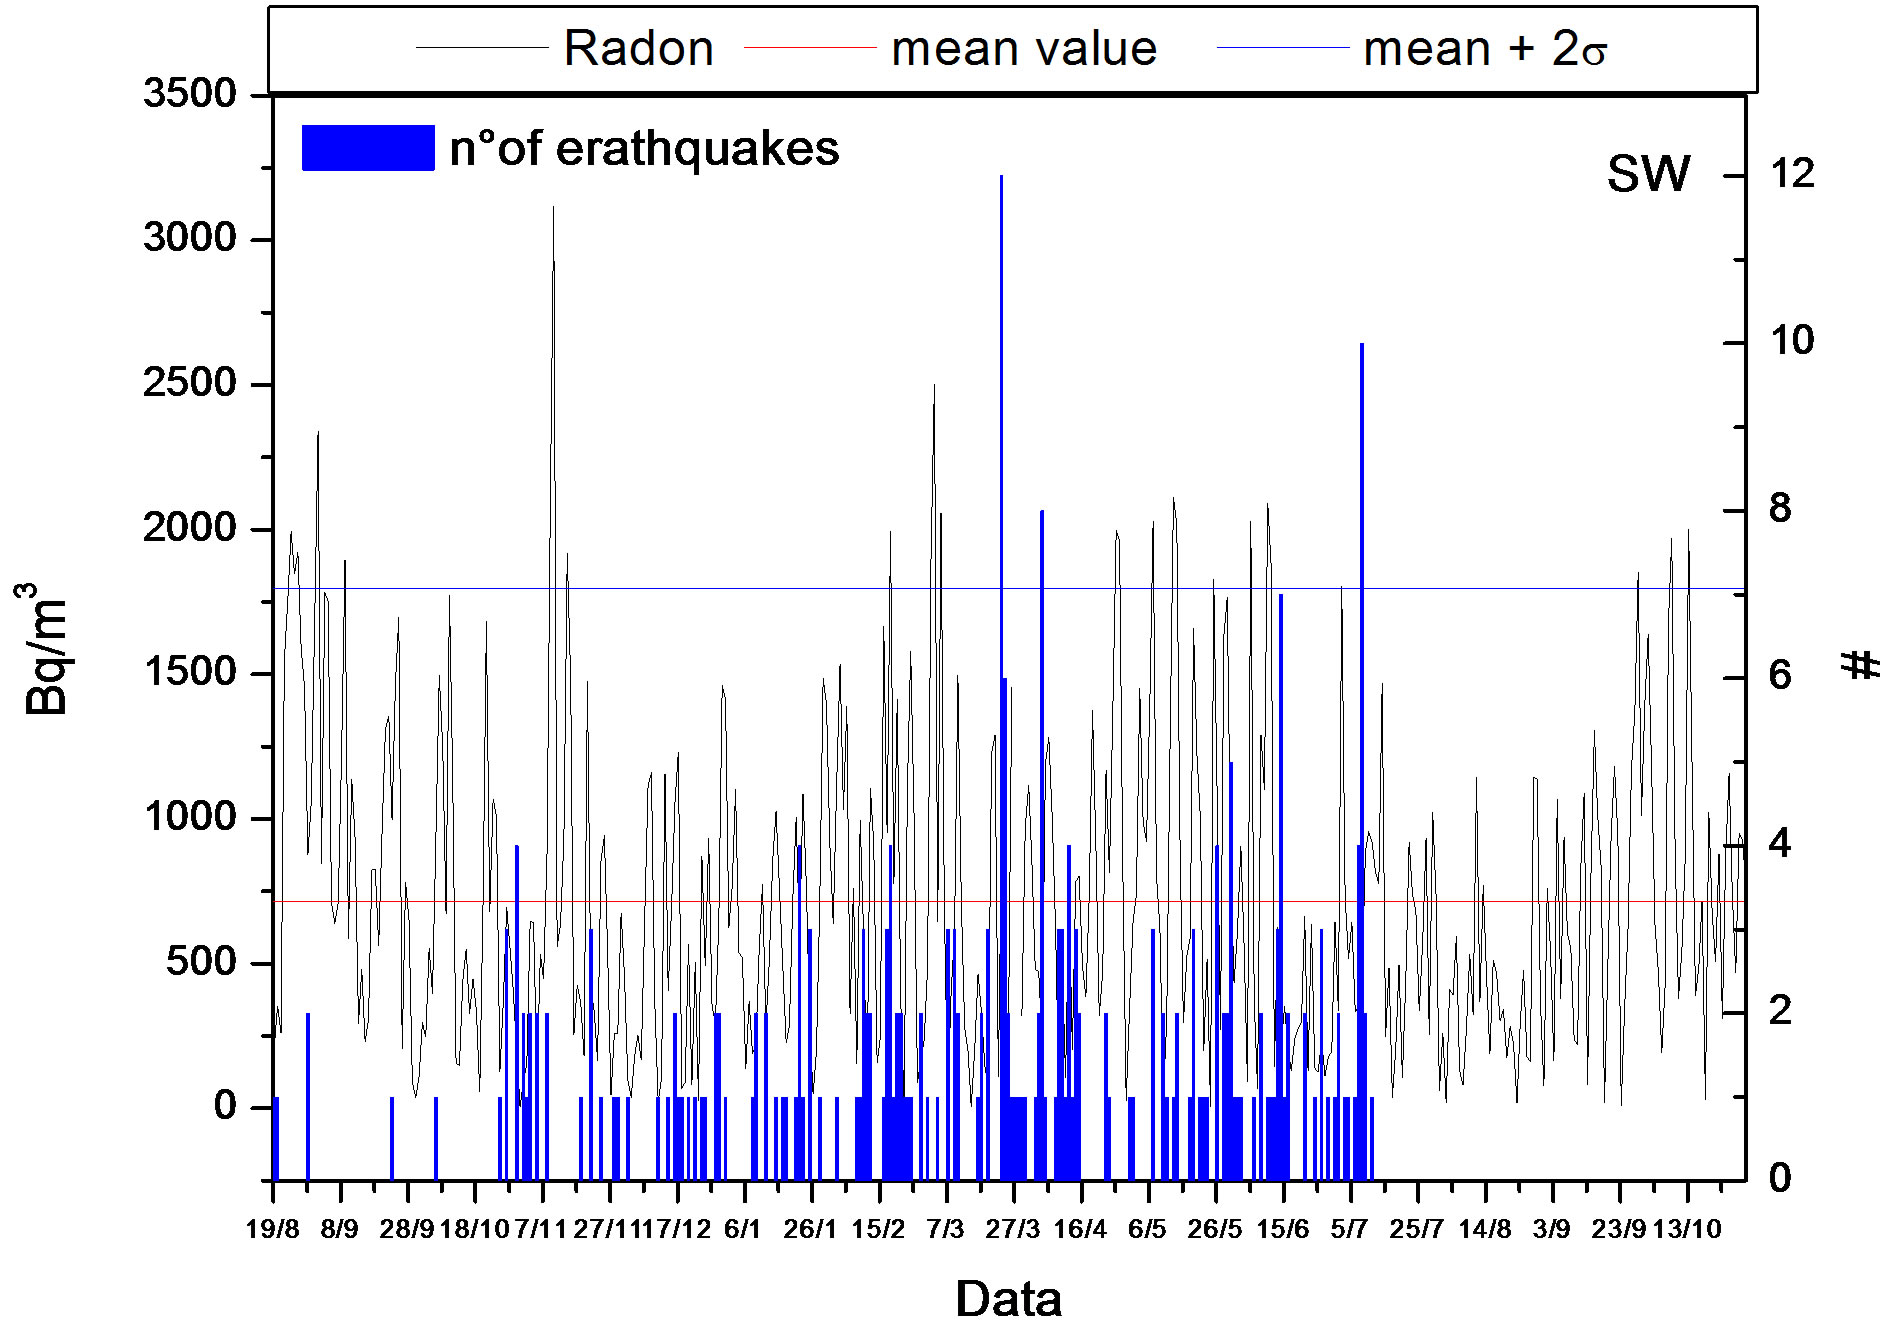
Figure 12. Radon data compared with the number of earthquake occurred per day (Biancavilla).

Figure 13. Radon data compared with the earthquake mean magnitude recorded per day (Biancavilla).
November 2001 and the 4th March 2002. This second one was followed by a big number of earthquakes till 24th of March (12 seismic events).
In the following Figures 14 and 15 are shown the comparisons among soil radon concentration values and number of earthquakes and magnitude in Vena site.
In this case two main anomalies were recorded: the first one from November, 25th till December, 4th 2001 this anomaly occurred about in the same period of that one recorded in the SW site, the second anomaly was recorded in the period 13-18 May 2002 when no evident anomalies were recorded in the south west site.
6. CONCLUSIONS
The first phase of experimental research led to the development of two new indexes to be refined in the near future and validated by further measurement campaigns:
Im = Seismicity of Period qualitatively correlates the trend in PM10 concentration to the mean seismic magnitude. This index requires further investigation, to be un

Figure 14. Radon data compared with the number of earthquake occurred per day (Vena).

Figure 15.Radon data compared with the earthquake mean magnitude recorded per day (Vena).
dertaken in the next measurement campaign, in an attempt to determine the mathematical law of correlation.
• FP = “Force Peak” is already effective in correlating seismic volcanic events greater than 2 on the Richter scale with PM10 concentrations in the air and giving, moreover, both the probability of a seismic-volcanic event (90%) and the time range (3 days) of its occurrence.
At the current state of research, the FP index is not, of course, able to single out with deterministic exactness either the day when a seismic-volcanic event will occur or the magnitude of the event. However, it can certainly be used as an “early warning” (3) and (4) for the Civil Protection Agency to be ready to intervene in the, inauspicious, case that the magnitude of the event forecast using the FP technique could be dangerous for the inhabitants of small towns on the foothills of Mt. Etna.
From this viewpoint, it could be desirable to build a network of environmental steady stations at targeted points near the faults on the slopes of Etna. These would identify, in real time, the occurrence of an FP. The next phase of the research will be to use data acquired in a future measurement campaign in an attempt to correlate Im to FP and thus determine mathematical laws able to also forecast the magnitude of the seismic-volcanic event.
No clear evidences were observed with the in soil radon concentration values, even if being the anomalies occurred in both sites during the same period it can indicate a possible linked not with the seismic events but with the volcano dynamism, the investigation period in fact lay between two main eruptions the July 2001 and the October 2002.
REFERENCES
- Singh, M., Ramola, R.C., Singh, B., Singh, S. and Virk, H.S. (1991) Radon anomalies: Correlation with seismic activities in northern India. In: Durrani, A.S. and Radomir, I., Eds., Radon Monitoring in Radioprotection, Environmental and/or Earth Science, World Scientific Publishing Co. Pte. Ltd., Hackensack, 354-375.
- Virk, H.S. (1995) Radon monitoring of microseismicity in the Kangra and Chamba Valley of Himachal Pradesh, India. Nuclear Geophysics, 9, 141-146.
- Virk, H.S. and Sing, B. (1994) Radon recording of Uttarkashi earthquakes. Geophysical Research Letters, 21, 737- 740. doi:10.1029/94GL00310
- Al-Hilal, M., Sbeinati, M.R. and Darawcheh, R. (1998) Radon variation and microearthquakes in western Syria. Applied Radiation and Isotopes, 49, 117-123. doi:10.1016/S0969-8043(97)00248-0
- Immè, G., La Delfa, S., Lo Nigro, S., Morelli, D. and Patanè, G. (2006) Soil radon concentration and volcanic activity of Mt. Etna before and after the 2002 eruption. Radiation Measurements, 41, 241-245. doi:10.1016/j.radmeas.2005.06.008
- Immè, G., La Delfa, S., Lo Nigro, S., Morelli, D. and Patanè, G. (2006) Soil radon monitoring in NE flank of Mt. Etna (Sicily). Applied Radiation and Isotopes, 64, 624- 629. doi:10.1016/j.apradiso.2005.12.007
- Morelli, D., Immè, G., La Delfa, S., Lo Nigro, S. and Patanè, G. (2006) Evidence of soil radon as tracer of magma uprising at Mt. Etna. Radiation Measurements, 41, 721- 725. doi:10.1016/j.radmeas.2006.04.026
- La Delfa, S., Immè, G., Lo Nigro, S., Morelli, D., Patanè, G. and Vizzini, F. (2007) Radon measurements in the SE and NE flank of Mt. Etna (Italy). Radiation Measurements, 42, 1404-1408. doi:10.1016/j.radmeas.2007.06.004
- La Delfa, S., Agostino, I., Morelli, D. and Patanè, G. (2008) Soil radon concentration and effective stress variation at Mt Etna (Sicily) in the period January 2003-April 2005. Radiation Measurements, 43, 1299-1304.
- Morelli, D., Immé, G., Altamore, I., Aranzulla, M., Cammisa, S., Catalano, R., Giammanco, S., La Delfa, S., Mangano, G., Neri, M., Patané, G. and Rosselli-Tazzer, A. (2011) Radiation measurements as tool for environmental and geophysics studies on volcano-tectonic areas. Il Nuovo Cimento C, 1, 155-165.
- Morelli, D., Immé, G., Cammisa, S., Catalano, R., Mangano, G., La Delfa, S. and Patanè, G. (2012) Radioactivity measurements in volcano-tectonic area for geodynamic process study. EPJ Web of Conferences, 24, 05009.
- Benina, A., Imposa, S., Gresta, S. and Patanè, G. (1984) Studio macrosismico e strutturale di due terremoti tettonici avvenuti sul versante meridionale dell’Etna, Atti III. Convegno Annuale Del GNGTS, Roma, 14-16 November 1984, 931-946.
- Patanè, G., Coco, G., Corrao, M., Imposa, S. and Montalto, A. (1995) Source parameters of seismic events at Mount Etna Volcano, Italy, during the outburst of the 1991-1993 eruption. Physics of the Earth and Planetary Interior, 89, 149-162. doi:10.1016/0031-9201(95)03013-M
- Romano, R., et al. (1982) Mount Etna Volcano. Memorie Società Geologica Italiana, 23, 205.
- Immè, G., La Delfa, S., Lo Nigro, S., Morelli, D. and Patanè, G. (2005) Gas Radon emission related to geodynamic activity of Mt. Etna. Annals of Geophysics, 48, 65-71.
- Fano, V., Cernigliaro, A., Scondotto, S., Perucci, C.A. and Forastiere, F. (2010) The fear of volcano: Short-term health effects after Mount Etna’s eruption in 2002. European Respiratory Journal, 36, 1216-1218. doi:10.1183/09031936.00078910
- Carn, S.A. (2010) Quantifying tropospheric volcanic emissions with AIRS: The 2002 eruption of Mt. Etna (Italy). Geophysical Research Letters, 32, L02301. doi:10.1029/2004GL021034
- Barsotti, S., Andronico, D., Neri, A., Del Carlo, P., Baxter, P.J., Aspinall, W.P. and Hincks, T. (2010) Quantitative assessment of volcanic ash hazards for health and infrastructure at Mt. Etna (Italy) by numerical simulation. Journal of Volcanology and Geothermal Research, 192, 85-96. doi:10.1016/j.jvolgeores.2010.02.011