Engineering
Vol.6 No.7(2014), Article
ID:46708,9
pages
DOI:10.4236/eng.2014.67036
Experimental Study on Flow Characteristic in Sloping Weir
Joongu Kang1, Sungjoong Kim1, Hongkoo Yeo1, Namjoo Lee2
1Water Resource Research Department, Korea Institute of Construction Technology, Goyang, Korea
2Kyungsung University, Busan, Korea
Email: jgkang02@kict.re.kr
Copyright © 2014 by authors and Scientific Research Publishing Inc.
This work is licensed under the Creative Commons Attribution International License (CC BY).
http://creativecommons.org/licenses/by/4.0/


Received 26 March 2014; revised 26 April 2014; accepted 3 May 2014
Abstract
Drop structure is a key hydraulic structure used in river improvement projects for flood control purposes. However, as demand for riparian construction techniques with environmental considerations is increasing both domestically and internationally, discontinuation of aquatic organisms as a result of high head is raised as a serious issue associated with the existing drop structures. Accordingly, it has become necessary to install a drop structure with a mild slope rather than the existing drop structures with high head, so that the structure can function as a migration channel for fish, which is severed by the existing drop structures, and also improve surrounding landscapes. In this study, which was initiated based on the necessity as such, a drop structure of mild slope was defined as sloping weir and flow characteristics under different conditions were analyzed through a hydraulic experiment. Focusing on efficiency according to energy dissipation that takes place according to different gradients of sloping weir, particle sizes of riverbed materials and the effect of hydraulic jump occurring at the downstream of a structure, this study aimed at identifying flow characteristics according to the conditions of sloping weirs. The hydraulic experiment was carried out on a variable-slope channel measuring 0.6 m in width and 20.0 m in length. As for riverbed materials, materials with two particle sizes (16 mm and 25 mm) were selected. For the experiment, models with different slope ratios to the structure, such as 1V:2H, 1V:3H and 1V:4H, were created. For flow conditions and hydraulic jump locations, an amount of water satisfying four water level conditions by stage was flown according to water level at the inlet area. Then, eight points were selected from inlet area, drop area, jet flow area and downstream area by controlling water level at the downstream area and adjusting the location of hydraulic jump occurrence. Water level (y), flow velocity (V), length of hydraulic jump (Lr) and distance of hydraulic jump occurrence (Lj) were measured at the eight points.
Keywords
Drop Structure, Sloping Weir, Energy Dissipation, Hydraulic Jump

1. Introduction
Diversion weir is one of the most frequently installed riparian structures. This structure with embankment functions is installed in a cross-sectional direction of a river in order to increase water level for water collection and ship transportation and to prevent countercurrent [1] . In general, diversion weir is comprised of a main body, an apron and a bed pitching and the related design standards are suggested in River Design Criteria [1] . However, flood damages in the past, such as by typhoon Rusa and Maemi, indicated that riverbed scouring in downstream area or the use of inappropriate apron and bed pitching is the main causes of destruction. Diversion weirs can be proposed in various types according to the purpose of use. In Korea’s design standards, diversion weirs are divided into round crest weir, the generally installed fixed weir, and movable to adjust water level. Flow around diversion weirs can be divided into flow at the upstream, flow at the slope and flow at the downstream. In particular, flow at the downstream of a structure is affected by water level in the downstream area. In case of a diversion weir design, key hydraulic design factors can be largely divided into jet flow occurring at the downstream of a structure, flow of hydraulic jump and scouring that occurs on the riverbed. Most existing drop structures (steep slope and RCW) are designed with steep slope, and thus a strong jet flow occurs and this, in turn, generates hydraulic jumps of various forms according to water level conditions at the downstream of a structure. In general, flow at the downstream of a structure changes in terms of hydraulic jump location, length and form according to water level at the downstream area. If water level is low, a strong jet flow occurs at the downstream of a structure and then roller is generated. As water level increases, the area of jet flow decreases and eventually submerged hydraulic jump occurs. A large number of studies have been conducted on flow characteristics at the downstream of diversion weirs and studies on hydraulic jump, especially, have a very long history. As a study conducted in the earlier days about diversion weir design, Moore [2] , in an investigation of diversion weirs, analyzed the formation of hydraulic jump at the downstream following a drop. Moore indicated flow velocity distribution with consideration given to water surface shapes. The mechanism of energy dissipation was studied by Viparelli [3] . Ohtsu et al. [4] could not confirm attenuation of the maximum flow velocity with an exception of the impact of internal flow conditions at the responding water depth, length of hydraulic jump and an increase of boundary stress according to the hydraulic jump. This was an interesting study because it showed that a hydraulic jump is a special condition for submerged jump. As demand for riparian construction techniques with environmental considerations is increasing both domestically and internationally, discontinuation of aquatic organisms and water quality deterioration have been raised as serious issues associated with the existing weirs. To solve these problems, weirs of various shapes are being proposed. A most typical shape is a sloping weir. Sloping weir is effective in terms of controlling energy attenuation through slope adjustment and also of water purification as it generates aeration using materials used in the sloping surface, and thus increases the amount of dissolved oxygen in water.
In a study on sloping weir, Rice et al. [5] conducted an experiment on riprap placed loosely on top of a sloping waterway. This study proposed a new formula by combining the relationship with roughness coefficient proposed by Manning and Darcy-Weibach with experiment data from Abt et al. [6] based on an average particle size of 26 - 157 mm and waterway slope of 0.01 - 0.02. Pagliara et al. [7] conducted an experiment on waterways with three different gradients using sloping blocks and compared the scale effects in terms of relative loss and water depth. However, studies on sloping weir have not been carried out as diversely as RCW.
This study is a hydraulic experiment to analyze downstream flow of weirs by changing gradients of sloping weirs and riverbed materials. This experiment was conducted in order to analyze flow around sloping weir and locations of hydraulic jump occurrence and critical conditions were analyzed.
2. Experiment Setup
The experiment on sloping weir was conducted on a waterway with variable slope measuring 0.6 m in width and 20.0 m in length (Figure 1 and Figure 2). As a flow measuring equipment, a one-dimensional flow meter (VO1000, KENEK) was used, based on judgment that it would be difficult to secure water depth in sloping and jet flow areas. In addition, a water level meter (PH-355, KENEK) was used to measure the water level. Wooden drop models measuring 0.2 m in height and 0.3 m in crest length each were created with four slopes (1V:2H, 1V:3H, 1V:4H, 1V:6H) and were installed in the waterway (Figure 3). As a coating material for the sloping drop model, glass beads measuring 16 mm and 26 mm in diameters were used.
The sloping weir experiment was conducted under flow conditions within the range of Q = 0.03977 - 0.00762
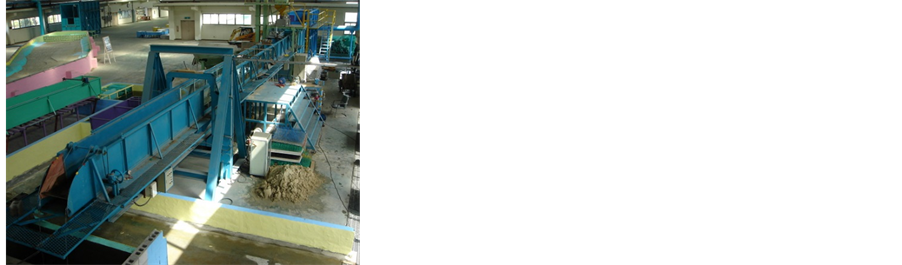
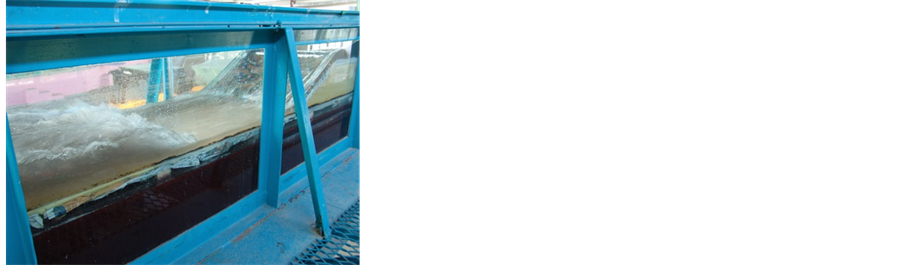
Figure 1. View of experiment channel.
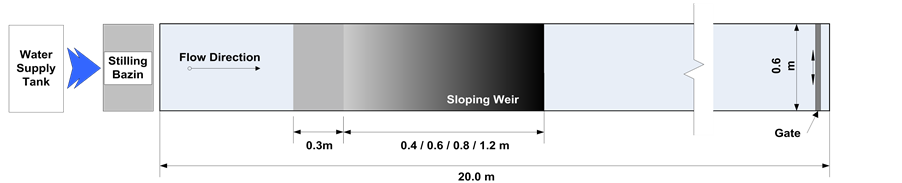
Figure 2. Specifications of experiment channel.
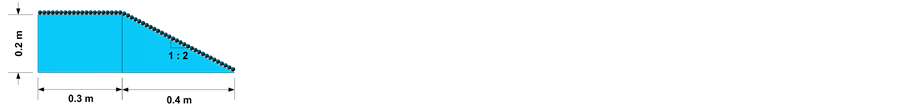
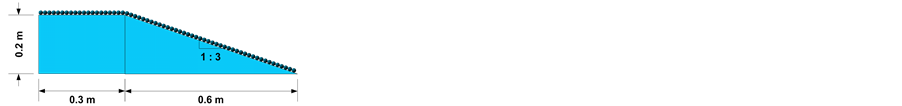

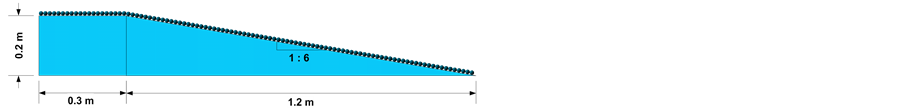
Figure 3. Cross-sections of sloping drop models (gradients: 1V:2H, 1V:3H, 1V:4H, 1V:6H).
m3/s. The experiment was carried in relation to 32 water levels in inlet area using two of the same riverbed materials and sloping conditions (1V:2H - 6H). Figure 4 is a schematic diagram showing characteristics of water overflowing sloping weir. As for flow conditions and hydraulic jump occurring locations, amount of water satisfying the conditions of four water levels was let flow by stage and a total of eight measuring points were selected in inlet area (1), drop area (5), jet flow area (1) and downstream area (1) as shown in Figure 5 according to the changing hydraulic jump locations through gate control at the downstream area. Then, water level (y), flow velocity (V), length of hydraulic jump (Lr) and the distance of hydraulic jump occurrence (Lj) were measured in the eight points. Flow velocity was measured before and after hydraulic jump occurrence using a onedimensional propeller flow meter and Micro 16 MHz ADV (SONTEK). In addition, energy dissipation was examined by investigating flow velocity distribution characteristics within the length of hydraulic jump occurrence and changes in flow velocity distribution at the downstream of weir were investigated by measuring flow velocity in a vertical direction from points with consistent intervals.
3. Results
3.1. Hydraulic Jump Characteristics at Loss Water Jet Occurrence
Water overflowing weir passes the critical depth near connection points and flow that becomes smaller than that at the critical depth is converted to water jet at the upstream area. The energy becomes minimized at the critical depth. In this study, gradient, particle size at the sloping area and impact at the end of weir and sloping area, the
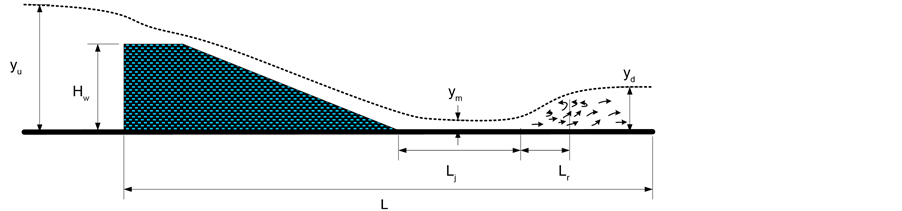
Figure 4. Schematic diagram of flow characteristics.
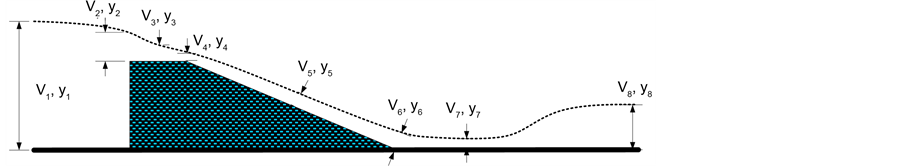
Figure 5. Measuring points.
conditions of sloping weir, were analyzed using water levels at the upstream and downstream as well as energy head. Energy head according to distance  displays a trend of decrease as flow becomes smaller regardless of the gradient and particle size of drop structure. However, difference in energy reduction occurred at the end of the drop structure. Together with water level after hydraulic jump, downstream water level of a weir is a key factor for the impact of hydraulic jump and design conditions. The water jet flow running down along the slope is a normal flow and the flow state changes near an area connected to the downstream flow. At this point, hydraulic jump and a considerable amount of energy loss occur. Figure 6 shows water level at inlet area (yμ) and water level at jet flow area (ym) averaged with the height of weir (Hw) in relation to slope conditions. As water head in inlet area increases in relation to the height of drop structure, water head at jet flow area also displays a trend of increase. As for particle size, in a sloping weir applied with glass measuring 25 mm, a relatively larger size, water head at jet flow area decreased as the gradient became smaller. However, on the other hand, in a sloping weir applied with glass measuring 16 mm, a relatively smaller size, water head at flow jet area increased as the gradient became smaller. Relative loss of sloping weir in relation to critical water depth ratio (yc/Hw) at the end of the sloping weir is as follows:
 (Chanson, 1994) (1)
where, α is angle of inclination, y is normal depth, yc is critical depth and Hw is the height of drop structure.
Figure 7 shows the results of relative loss analysis in relation to critical depth ratio. Relative loss decreased as critical depth ratio to the height of sloping weir increased. As for the difference in energy dissipation in relation to the differences in particle size, the rate of decrease for D25 with a relatively larger particle size was found to be smaller than that of D16 as the water depth ratio increased. Figure 8 shows comparison in relation to gradients. It shows that relative loss increased slowly as gradient became larger.
3.2. Hydraulic Jump Characteristics at Water Jet Occurrence
Flow at the downstream of a weir shows differences in jet flow area, hydraulic jump area and upstream area according to water levels at the downstream area and amount of water inflow at the upstream area. In jet flow area, the strong stream power is a cause of riverbed scouring and is also an important factor in a weir design. The jet flow is designed for occurrence mainly in a section where apron is installed. Therefore, to ensure safety of riverbed at the downstream area during a weir design, it is necessary to minimize jet flow area. However, amounts of water flow and water levels vary widely, and thus it is difficult to apply hydraulic conditions to minimize jet
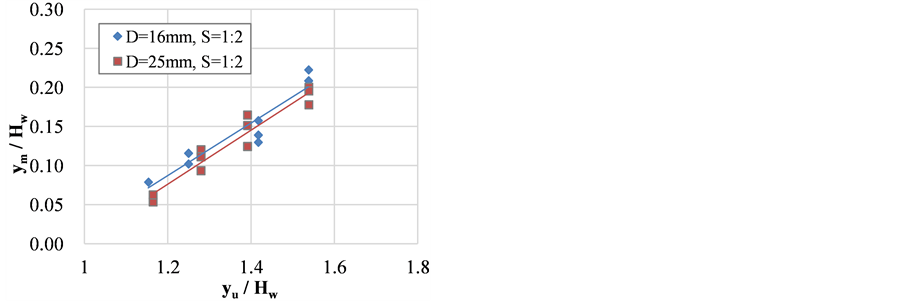

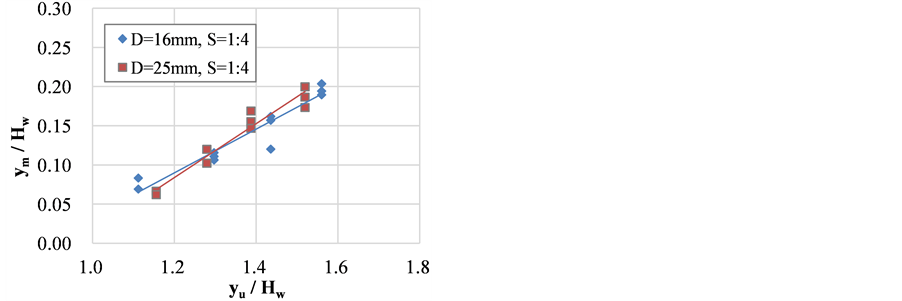
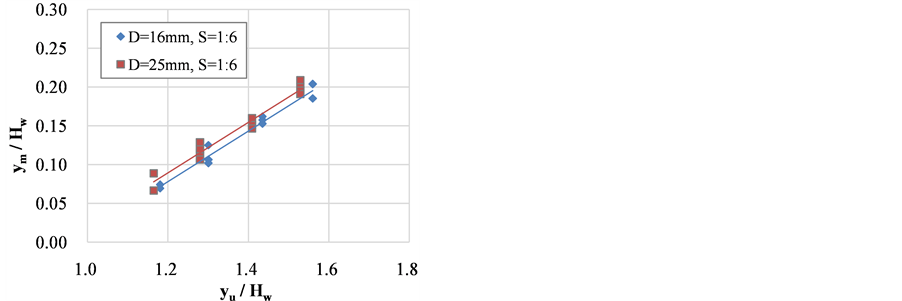
Figure 6. Water level fluctuations at upstream/downstream in relation to height of weir according to gradient.
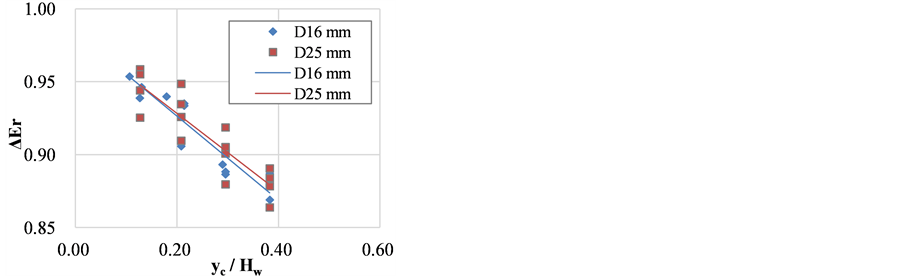
Figure 7. Relative loss to critical depth ratio.
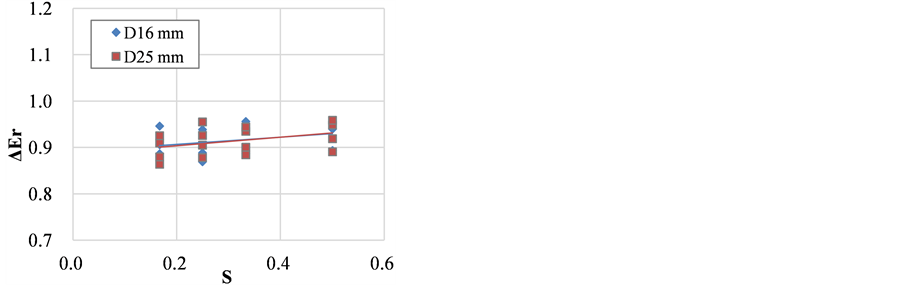
Figure 8. Relative loss according to gradient.
flow area in a weir design to all rivers. At this, construction techniques to maintain riverbed at the downstream of a weir were proposed both domestically and internationally. In the US and Europe, a general technique used for riverbed maintenance is to install a structure (breaking structure) designed to lower stream power, and thus to forcefully generate hydraulic jump effect. In this test, a jet flow area, a hydraulic jump area and an upstream area were examined first according to conditions at the upstream and the downstream of a weir.
Figure 9 shows locations of hydraulic jump occurrence at the downstream of a weir according to water levels at the downstream area by flow. The differences in water level between upstream and downstream (yμ – yd) and the distance of hydraulic jump occurrence (Lj) were averaged with the height of weir (Hw). The location of hydraulic jump occurrence became closer to weir as water level at the downstream increased. As for changes in the location of hydraulic jump occurrence according to gradient, the changes were insignificant when gradient was 1/2 - 1/4. However, in case gradient is 1/6, the distance of hydraulic jump occurrence became shorter according to water level at the downstream area. This implies that the distance of hydraulic jump occurrence is affected by the gradient of weir. Figure 10 shows changes in the distance of hydraulic jump occurrence according to flow to examine the impact of water depth at the downstream area in relation to critical depth ratio at which water overflows the weir. Here, the critical depth (yc) and distance of hydraulic jump occurrence (Lj) were averaged with the height of weir (Hw). As a result of the experiment, the length of hydraulic jump occurrence was found to increase as flow value became higher. In addition, hydraulic jump length became shorter as water level at the downstream increased. Under the condition of large flow, changes in hydraulic jump length were large in relation to downstream water depth and impact exerted by downstream water level on the distance of hydraulic jump occurrence was found to gradually decrease as flow became smaller.
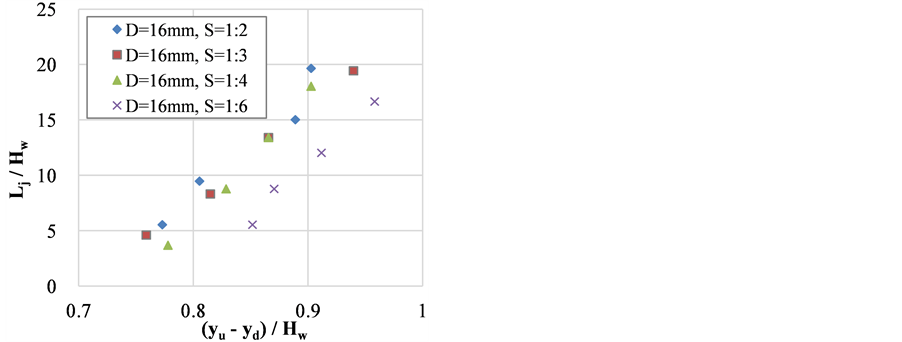
Figure 9. Locations of hydraulic jump occurrence according to upstream/downstream water.
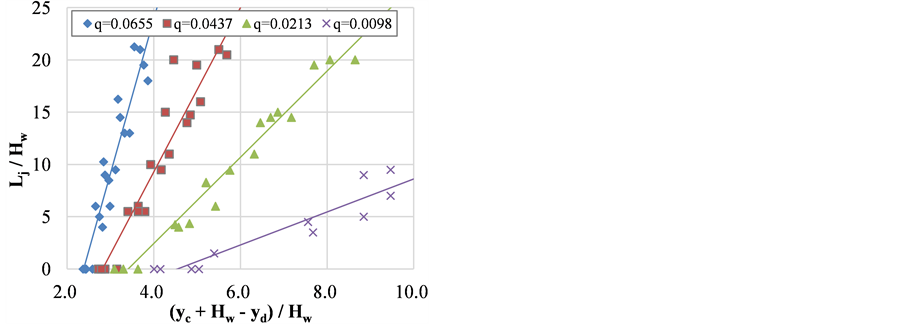
Figure 10. Locations of hydraulic jump occurrence according to flow.
3.3. Hydraulic Jump Characteristics at Critical Depth
Submerged hydraulic jump is a form of hydraulic jump to protect a structure and stabilize riverbed as jet flow does not occur at the downstream of a weir. Analysis of upstream/downstream water level impact on submerged hydraulic jump occurrence can be used as important data in bed pitching length and apron length estimation. Therefore, in this study, water depth for submerged hydraulic jump occurrence was defined as a critical depth, and thus the flow characteristics were examined. As for flow characteristics, impact of upstream/downstream water levels in relation to the gradient of weir and particle size in the riverbed was compared.
Figure 11 and Figure 12 show relationship of upstream and downstream water levels at critical depth occurrence according to gradient. Upstream water level (yμ) and downstream water level (yd) were averaged with the height of weir (Hw). As a result of the examination, changes in critical depth according to weir gradient under test conditions set in this study were found insignificant. Figure 13 shows upstream and downstream water levels according to particle size in order to examine impact according to particle size in the riverbed. The result of comparison indicated that changes in water level according to riverbed conditions were insignificant. Therefore, it was found that riverbed particle size of a sloping weir did not produce any impact.
Figure 14 shows comparison of upstream and downstream water levels in RCW and sloping weir. When critical depth occurs, downstream water level of sloping weir was lower than that of RCW under a condition that upstream water depth is the same. A formula to calculate critical depth (H1) of RCW was proposed as follows by Knap in 1960.
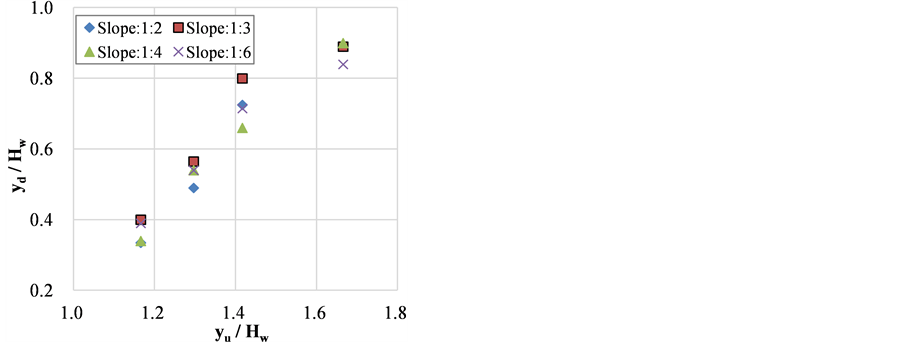
Figure 11. Upstream water level at critical depth occurrence according to weir gradient (16 mm).

Figure 12. Upstream and downstream water levels at critical depth occurrence according to weir gradient (25 mm).
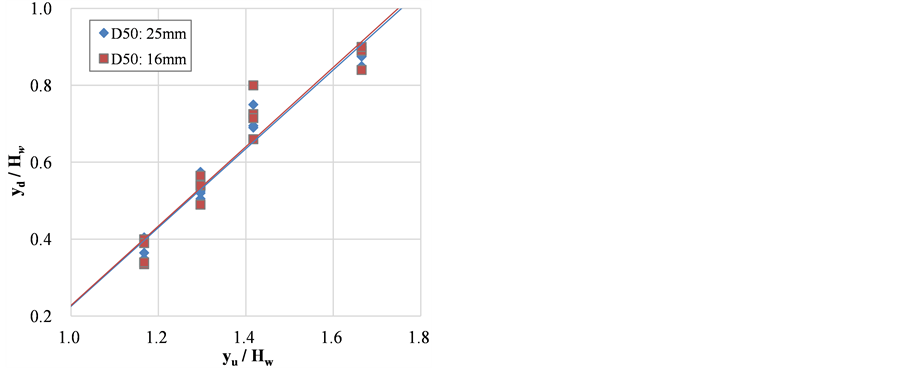
Figure 13. Comparison of upstream and downstream water levels at critical depth occurrence according to riverbed material.
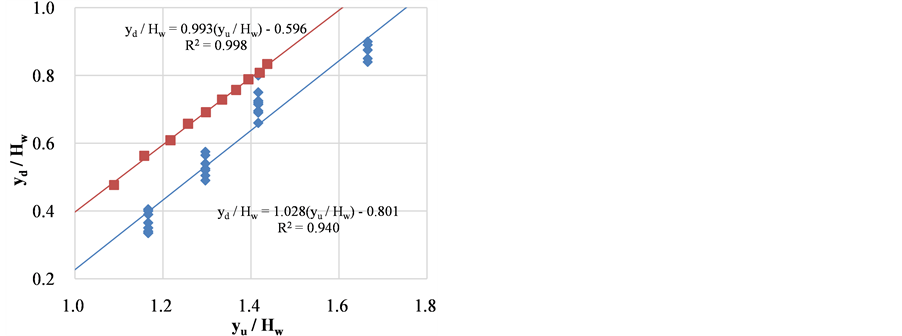
Figure 14. Comparison between RCW and sloping weir.
 [8] (2)
Variables used in the formula for critical depth estimation were proposed as upstream water depth (H0), critical depth at weir (yc) and downstream water depth (H1). Figure 15 compares the results of this study against the previously proposed RCW results. As a result of the comparison, it was found that critical water depth in a sloping weir was the same as that of RCW in low flow condition. However, as flow increased, critical depth became lower than that of RCW. This is because energy loss from the sloping surface of a sloping weir is larger than in RCW.
4. Conclusions
In this study, trends of and design standards proposed by existing studies were identified through literature survey and hydraulic experiments on flow characteristics of a sloping weir were conducted in relation to two riprap particle sizes (16 mm and 25 mm) and four gradients (1V:2H, 1V:3H, 1V:4H and 1V:6H). Through the experiment, impact caused by slope (S), particle size (D), water level (y), height of weir (Hw) and end of weir/sloping area, the conditions of a sloping weir, was compared in terms of upstream and downstream water levels and energy dissipation. While energy head according to distance displayed a trend of decrease as flow became smaller regardless of the slope of weir and particle size, differences in energy decrease were found at the end of
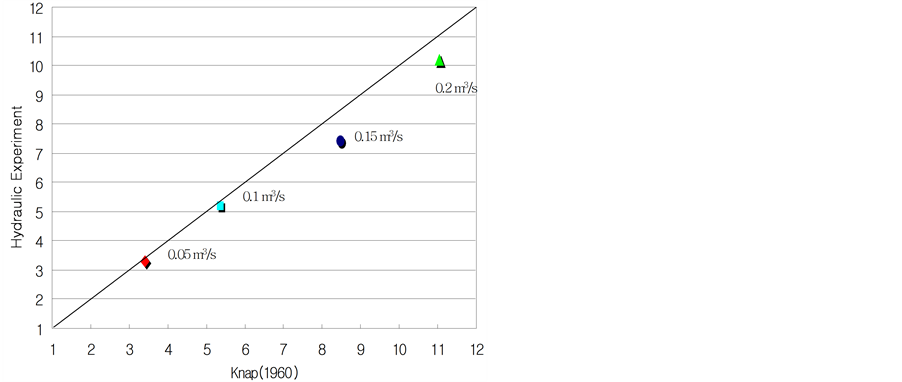
Figure 15. Comparison of critical depth calculation and experiment result.
the weir. As for hydraulic jump efficiency, it increased as Froude number and riverbed particle size became larger.
As a result of comparing upstream (inlet area) water head (yμ/Hw) against downstream (jet flow area) water head (ym/Hw) of a weir according to particle size, it was found that water head at the jet flow area also increased as upstream water head became larger in relation to the structure height. For a sloping weir applied with riprap measuring 25 mm in diameter, a relatively larger size, water head in jet flow area decreased as slope became mild. On the other hand, for a sloping weir with riprap measuring 16 mm in diameter, a smaller size, jet flow head increased as slope became mild.
It was found that relative loss (ΔEr) at the end of a sloping weir in relation to critical depth ratio (yc/Hw) to the structure height decreased as the critical depth ratio increased. As gradient became higher, relative loss displayed a tendency to increase slowly.
As for the difference in water level before and after hydraulic jump (yd − ym) and length of hydraulic jump occurrence (Lj) according to the height of structure (Hw), the difference displayed a tendency to decrease as the length of hydraulic jump occurrence increased regardless of gradient and particle size. Hydraulic jump length in relation to downstream water depth displayed large fluctuations as the flow was larger and the fluctuations gradually became smaller as flow decreased.
Acknowledgements
This research was supported by a grant (12-TI-C02) from Advanced Water Management Research Program funded by Ministry of Land, Infrastructure and Transport of Korean Government.
References
- Korea Water Resources Association (2009) River Design Criteria and Commentary.
- Moore, W.L . (1943) Energy Loss at the Base of a Free Overfall. Transactions of the American Society of Civil Engineers, 108, 1343-1392.
- Viparelli, M. (1988) Dissipazioni di Energia Nelle Correnti. Idrotecnica, 14, 229-246.
- Ohtsu, T .I., Yasuda, Y. and Awazu, S. (1990) Free and Submerged Hydraulic Jumps in Rectangular Channels. Research Institute of Science and Technology, Nihon University, Tokyo, 1-50.
- Rice, C.E., Kadavy, K.C. and Robinson, K.M. (1998) Roughness of Loose Rock Riprap on Steep Slopes. Journal of Hydraulic Engineering, 124, 179-185. http://dx.doi.org/10.1061/(ASCE)0733-9429(1998)124:2(179)
- Abt, S.R., et al. (1987) Development of Riprap Design Criteria by Riprap Testing in Flumes: Phase 1. NUREG/ CR-4651, US Nuclear Regulatory Commission, Washington DC.
- Pagliara, S. and Chiavaccini, P. (2006) Energy Dissipation on Block Ramps. Journal of Hydraulic Engineering, 132, 41-48. http://dx.doi.org/10.1061/(ASCE)0733-9429(2006)132:1(41)
- Knapp, F.H. (1960) Ausfluss, Ueberfall und Durch im Wasserbra. Verlag G. Braun, Karlsruhe.