Engineering
Vol.6 No.4(2014), Article ID:43796,8 pages DOI:10.4236/eng.2014.64020
Automatic Detection of the Electrical Elicited Stapedius Reflex by Evaluation of Its Electromyographic Signals
Ralf Warmuth1, Martin Behrens2, Rüdiger Dahl3, Karsten Ehrt3, Hans Wilhelm Pau3, Ralf Salomon1
1Institute of Applied Microelectronics and Computer Engineering, University of Rostock, Rostock, Germany
2Department of Exercise Science, University of Rostock, Rostock, Germany
3Medical School, ENT Department, University of Rostock, Rostock, Germany
Email: ralf.warmuth@uni-rostock.de
Copyright © 2014 by authors and Scientific Research Publishing Inc.
This work is licensed under the Creative Commons Attribution International License (CC BY).
http://creativecommons.org/licenses/by/4.0/


Received 27 November 2013; revised 27 December 2013; accepted 4 January 2014
ABSTRACT
This paper provides a first preliminary description of the dependencies between the stapedius muscle’s behavior and its neuronal activation with the adjustment of cochlear implants in mind. For that, stapedial electromyography (EMG) data are compared with EMG data which were derived from the quadriceps femoris muscle. The rationale behind is, that the stapedius muscle is classified as a striated skeletal muscle as the quadriceps femoris muscle is. Thus, the stapedius should expose a behavior which is similar to that of peripheral skeletal muscles. The stapedial reactions were provoked with contralateral acoustic stimulation and ipsilateral electrical stimulation, respectively. The data from the quadriceps femoris muscle were evoked voluntarily. The correlation of the derived data and their stimuli have shown the following main key points: 1) The stapedius muscle behaves like a regular skeletal muscle; 2) The stapedius muscle exhibits an extended range in which the muscle’s force is linear to the stimulation; 3) On both sides of the linear regime, the stapedius muscle exhibits a sigmoidal behavior.
Keywords:Stapedius Reflex; Cochlear Implant; Automatic Adjustment; Electromyography; Stapedial Reaction

1. Introduction
The stapedius reflex is very important in that it is related to the threshold of discomfort for loudness perception of humans [1] . In case the loudness exceeds a certain threshold, the stapedius muscle contracts [2] [3] . Furthermore, the electrically evoked stapedius reflex threshold correlates with the human’s most comfortable loudness level [4] . Because of this property, the stapedius reflex is also utilized during the implantation of cochlear implants (CI) as the basis of the first, preliminary implant setup [5] [6] . In addition to the calibration described above, the stapedius reflex and especially the contraction strength might also be used during a continuous recalibration process of the implants speech processor in everyday life situations. The idea is, to relate the stapedial activity to the electrical output of the cochlear implant. Such a relation with the comfort and discomfort levels in mind might bear the possibility to conclude the level of sound perception of the user. To find the mentioned relationship, it is necessary to continuously measure the stapedial reactions caused by the implant as well as the associated cochlear stimulus. In a straight forward approach, this goal might be achieved by directly measure both the electrical stimulation inside the cochlea and the exerted force of the stapedius muscle. This, however, is not feasible for the following three reasons: 1) The stapedius muscle is hidden inside the pyramidal eminence, and thus provides very limited access; 2) The muscle is merely approximately 2 mm in length, and thus not accessible to most of the available surface electrodes; 3) The stapedius muscle is fixed to bones, i.e. the pyramidal eminence and the stapes by a tendon, on both sides, and thus inaccessible to external force measurement devices. For these three reasons, this paper presents a rather indirect technique based on methods that are used in sport sciences. In this field, measuring the correlation between the neuronal stimulation in terms of electromyography (EMG) of a large skeletal muscle and its exerted force is a routine. Section 2 describes a typical experimental setup, which consists of an external force meter, some (surface) electrodes, and a series of electrical filters. The mentioned setup is used to determine the EMG activity of the quadriceps femoris muscle. The rationale behind this is that the stapedius muscle is a skeletal muscle as well. It is just orders of magnitude smaller and has no attachment to any of the limbs. Although the quadriceps femoris muscle is deliberately addressable, the produced force could provide an indicator to the used effort, as a special kind of stimulus. Therefore, this paper uses the very same analysis tool for both the stapedius as well as the quadriceps femoris muscle. Section 3 summarizes the used methods and parameter settings. Then, Section 4 describes the outcome of a series of experiments that were performed on the quadriceps femoris and the stapedius muscle in vivo. Afterwards, Section 5 discusses a qualitative relation of the attained data. The three key points are: 1) The stapedius muscle reacts to an increasing cochlear stimulation similar to a regular skeletal muscle; 2) The experiments suggest that the stapedius muscle exhibits an extended range in which the muscle’s force is linear to the cochlear stimulation; 3) On both sides of the linear regime, the stapedius muscle exhibits a sigmoidal behavior, as is known from the large skeletal muscles. Section 6 ends this paper with a brief discussion.
2. Background: Sport Science and Large Skeletal Muscles
For the improvement of force, endurance, and coordination, sport sciences frequently use specific tools that correlate a muscle’s exerted force with its neural activation. A typical setup consists of an external force measurement device, some (surface) electrodes, and a signal processing unit, e.g., a PC or laptop, which transforms the raw electromyogram (EMG) data into their cause, i.e., the exerted force. Figure 1 illustrates an example setup that measures the EMG signals of the quadriceps femoris muscle and the resulting torque. The muscle exerts a
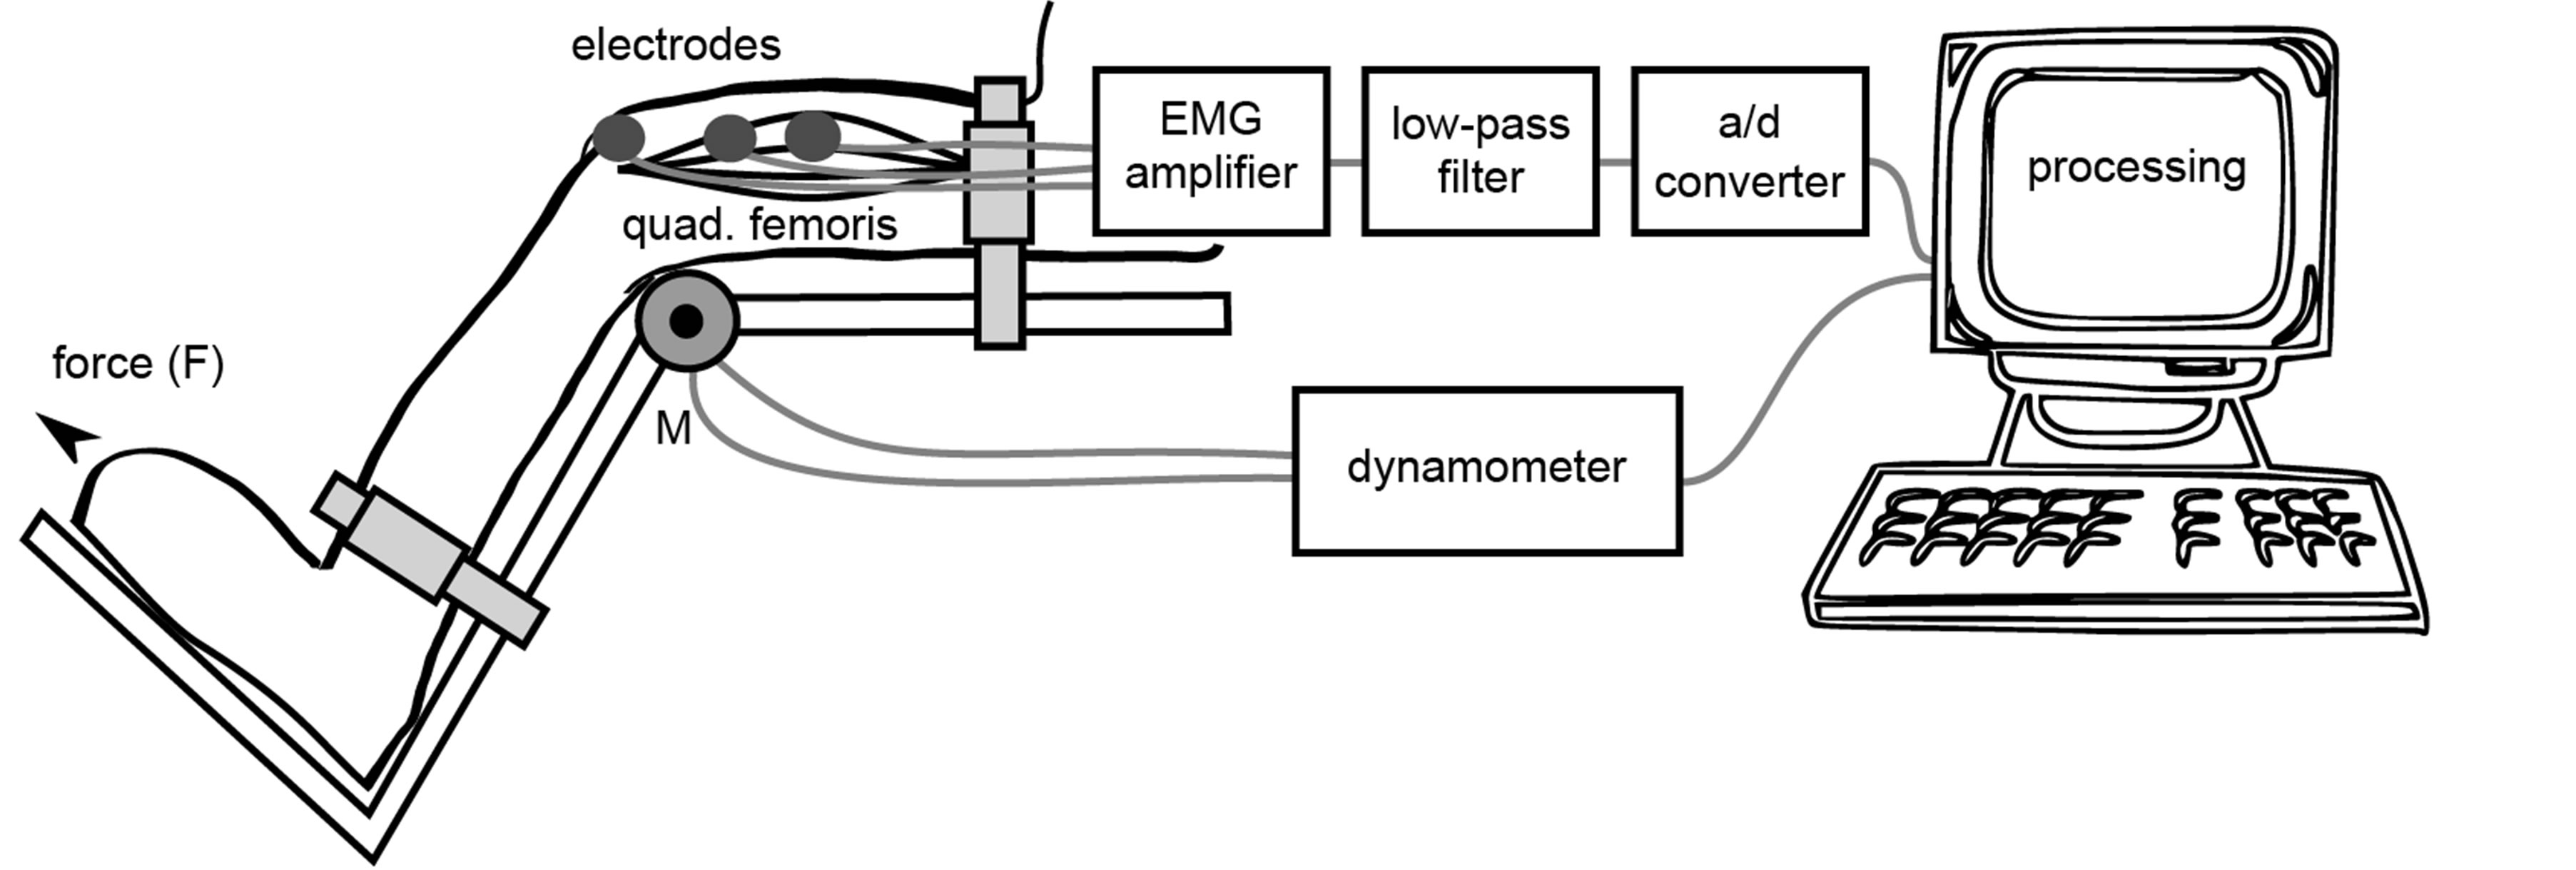
Figure 1. Test setup quadriceps femoris.
force F, which led to a torsional moment M in the knee that in turn is measured mechanically by a dynamometer, and subsequently transferred to the processing unit. Through another channel, the unit receives the digitized and pre-filtered signal from the connected surface electrodes that measure the compound muscle action potentials of the muscle. A filter bank inside the processing unit normally extracts the useful information from both signals. Figure 2 illustrates the used filter bank. As can be seen, the bank reads the raw EMG signal data from which at least humans cannot derive any useful information. In essence, the bank calculates the envelope curve of the signal (called EMG intensity in this paper). The calculation starts off with a band-pass filter that dampens interfering noise outside the physiological frequencies and also removes the steady state component. Afterwards, a rectifier rectifies the filtered signal and subsequently transfers it to a low-pass filter that in turn calculates the envelope. In contrast to the original EMG signal, the envelope curve visibly mirrors the muscles exerted force. Although the absolute produced force is not detectable, the EMG intensity provides a qualitative estimation of the exerted force produced by the muscle under test [7] . For further details on EMG-based experimentation, the interested reader is referred to the pertinent literature [8] [9] .
3. Methods
The experiments have been done on two muscles: 1) the quadriceps femoris muscle; and 2) the stapedius muscle. The remainder of this section describes the experimental setups for these two muscle types. The studies were approved by the local ethics committee.
3.1. Quadriceps Femoris, a Large Skeletal Muscle
One male subject with an age of 28 years and with a weight of 80 kg provided the torque and EMG data. Figure 1 illustrates the used setup. The subject’s upper leg was fixed on a chair, whereas its lower leg was fixed 2 - 3 cm above the lateral malleolus on the lever of a CYBEX NORM dynamometer (Computer Sports Medicine, Inc., Stoughton, MA). During the measurements, the knee and hip joint angles were kept constant at 80˚ (0˚ equals a full extension). The anatomical knee flex-extension axis was aligned with the dynamometer’s axis. Bipolar surface EMG electrodes (Ambu Blue©) with a diameter of 2 cm, recorded the EMG signals of the three superficial muscle heads, i.e., the vastus medialis, the vastus lateralis, and the rectus femoris. The reference electrode was attached to the patella of the same leg. All electrodes were places on shaved, clean, and abraded skin above the muscle bellies in the presumed muscle fiber’s direction with a center-to-center distance of 2 cm. The derived signals were amplified 2500 times, and pre-filtered in the range of 10 Hz to 1300 Hz. For further processing, the measured values were digitized with a 12 bit analog-to-digital converter (DAQ CardTM-6024E, National Instruments, USA). The torque and EMG data were recorded simultaneously and stored on a PC’s hard disk for later analysis. The measurement series contained the following five stages: 191 Nm over 4 s, 130 Nm over 4 s, 103 Nm over 6.5 s, 74 Nm over 8 s, and 45 Nm over 9 s. The stages had an intermittence of 20 s. The subject performed isometric voluntary contractions.
3.2. Stapedius, Intraoperative Data Collection
Two middle-aged male patients provided stapedius EMG data during different unilateral middle ear surgeries.
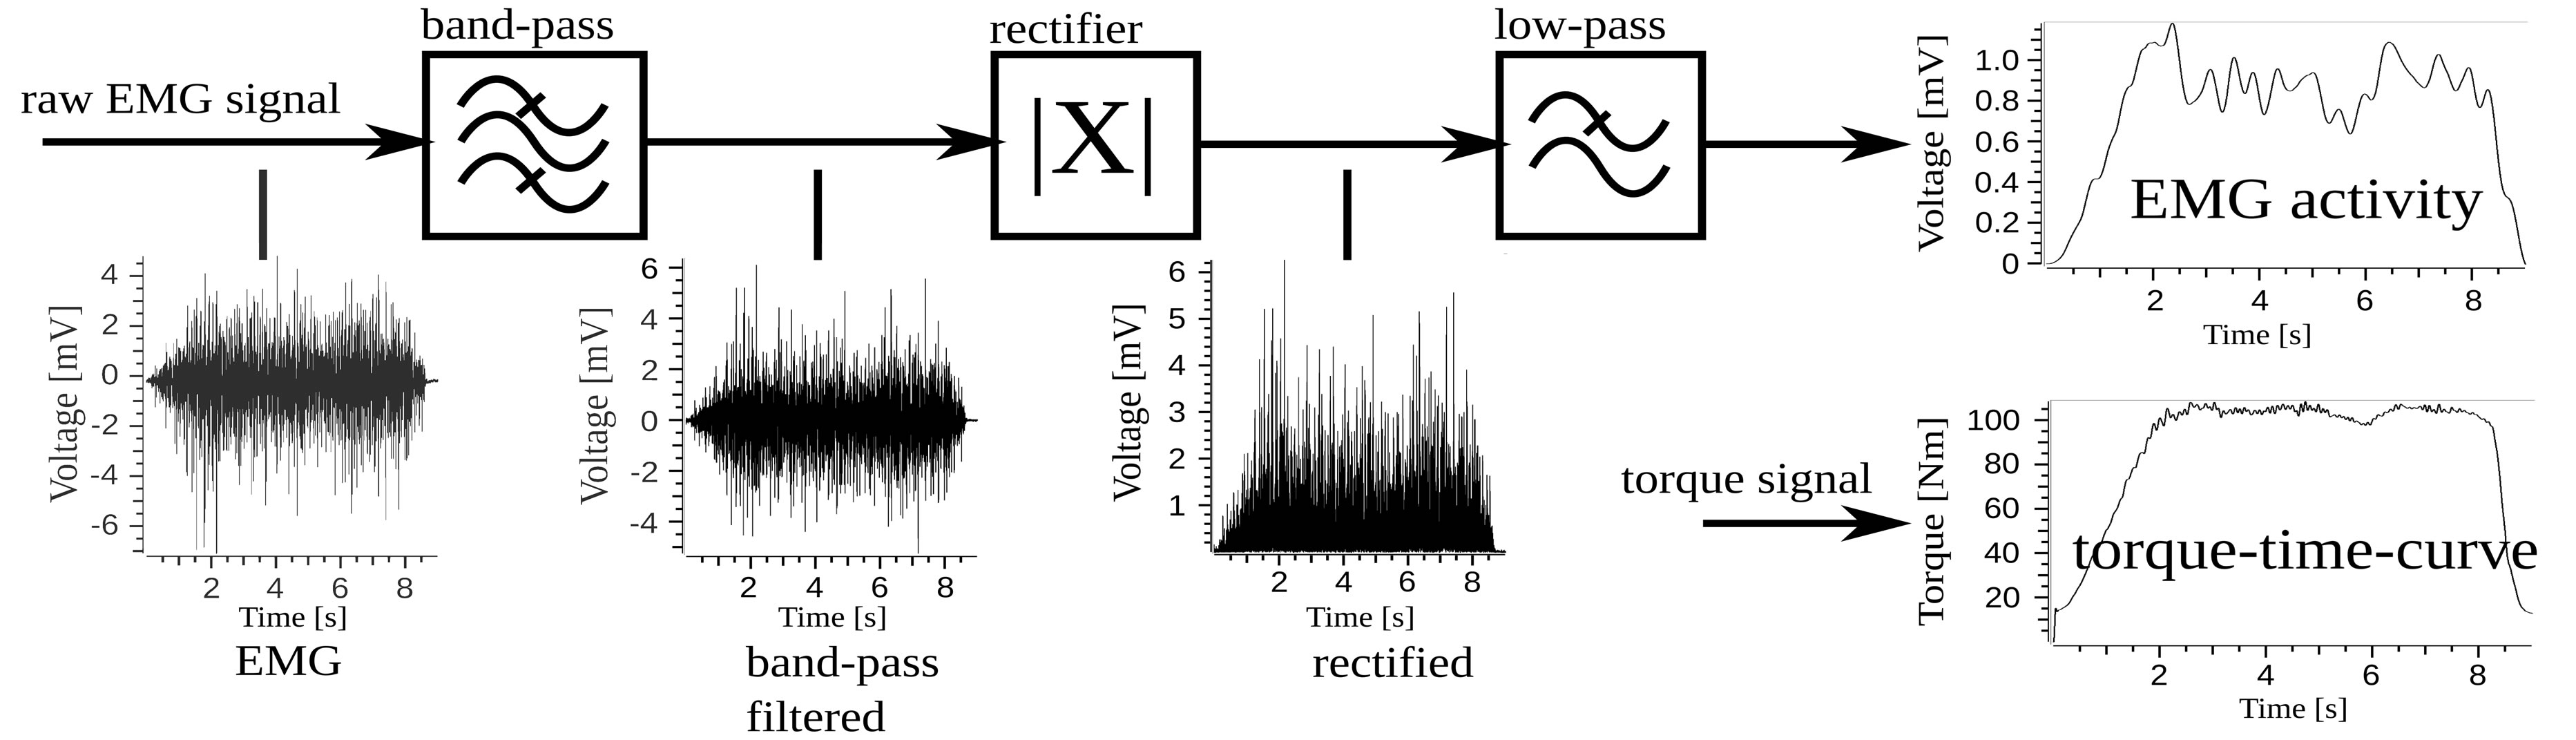
Figure 2. The EMG intensity calculation: The band-pass removes noise from the raw EMG signal. The rectifier and the subsequent low-pass calculate the envelope curve. The result is compared to the voluntarily produced torque-time-curve.
The two experiments comprised different stimulation setups: contralateral, acoustic stimulation and ipsilateral, electrical stimulation. During the experiments, a bipolar hook electrode derived the EMG signal from the ipsilateral stapedius muscle. The hook electrode consisted of two tungsten needles with 125 µm in diameter. The distance between the needles was approximately 200 µm to 250 µm. For further information, the interested reader is referred to the pertinent literature [10] that provides a more detailed description of this hook electrode. The electrode was connected to an EMG unit (Dantec Counterpoint MK II, Dantec Electronic, Skovlunde, Denmark) that prefiltered the signal with a band-pass with the cut-off frequencies of 10 Hz and 2 kHz and subsequently digitized and recorded the stapedius muscle’s signal with a resolution of 12 bit. In case of an acoustic stimulation, the sampling rate was 5121.6 Hz, whereas it was 5128 Hz in case of an electrical stimulation. Both, the different stimulation setups and the patterns were as follows.
3.2.1. Stapedius, Acoustic Stimulation Setup (Contralateral)
Measurements were carried out during middle ear surgery on a diseased ear (chronic suppurative otitis media). The contralateral ear was normal in terms of hearing. Thus, the contralateral side could be stimulated acoustically. As the resulting muscle contractions due the evoked stapedius reflex appear on both ears, it was possible to measure the EMG signal even of the ear under surgery. A GSI-tympanometer performed the acoustic stimulition using sinusoidal tone bursts with 2 kHz frequency. The bursts were emitted by an earphone that was plugged into the contralateral ear. Each acoustic burst lasted for one second and was followed by an intermittence of 0.5 s. The bursts had the following sound pressure levels (SPL): 100 dB, 105 dB, 110 dB, 115 dB, and 120 dB. The stimulation amplitude during each burst was kept constant.
3.2.2. Stapedius, Electrical Stimulation Setup (Ipsilateral)
These measurements were performed during cochlear implant surgery on a deaf ear. After the CI-electrode had been implanted, the electrical stimulation of single electrodes with a certain strength elicited stapedius reflex responses on both ears. The EMG-recordings were performed on the ear under surgery. The newly implanted cochlear electrode array performed the electrical stimulation with electrode No. 1. The stimulation bursts consisted of charge-balanced, rectangular, biphasic current pulses with a frequency of 1550 Hz. Each burst lasted for 0.5 s. The bursts intensities were set to the following charges: 40.0 nC, 35.1 nC, 30.5 nC, 26.5 nC, 23.4 nC, 20.4 nC, 20.4 nC, 18.3 nC, 17.3 nC, 15.8 nC, 13.8 nC, 12.0 nC, 9.0 nC, 6.0 nC, 3.9 nC, 3.0 nC, 1.9 nC, 1.1 nC, 1.0 nC, and 0.0 nC. In addition, the surgeon visually observed the stapedial contractions.
3.3. Filter Characteristics and Data Processing
Unless otherwise stated, all measured values were processed as described in Section 2. The used filters were implemented as a digital Butterworth filter of 4th order with cut-off frequencies of 20 Hz and 500 Hz in case of the band-pass filter, and 2 Hz in case of the low-pass filter. For reasons of clarity and comprehensibility, another step of calculation was introduced at the end of processing. That is, each data point that is shown in the following figures condenses the processed EMG intensity as well as the applied stimulus to the respective mean value during the duration of the stimulus. Figure 3 depicts this merge on the base of time and therefore the generation of the stimulus-EMG intensity characteristic. As can be seen, the abscissa of every figure contains the stimulition amplitudes whereas the ordinate shows the resulting EMG intensity in µV of the muscle under observation.
4. Experiments
This section summarizes the results of the experiments described in Section 3.
4.1. Quadriceps Femoris Muscle (EMG Intensity to Torque)
Figure 4 shows the results of the calculations done for the quadriceps femoris muscle. The data contain the averaged EMG intensity of the three observed muscle heads. The abscissa shows the exerted torque of the subject. As can be seen, the curve possesses an almost linear behavior that can be split into two parts. The first part starts at the minimum point (45 Nm, 387 µV) and increases up to 103 Nm (793 µV) with approximately 7 µV/Nm. In the second part, however, the curve increases from 103 Nm up to 191 Nm (2029 µV) with approximately 14 µV/Nm. The average slope is approximately 11 µV/Nm. In summary, the EMG intensity is almost linear to the
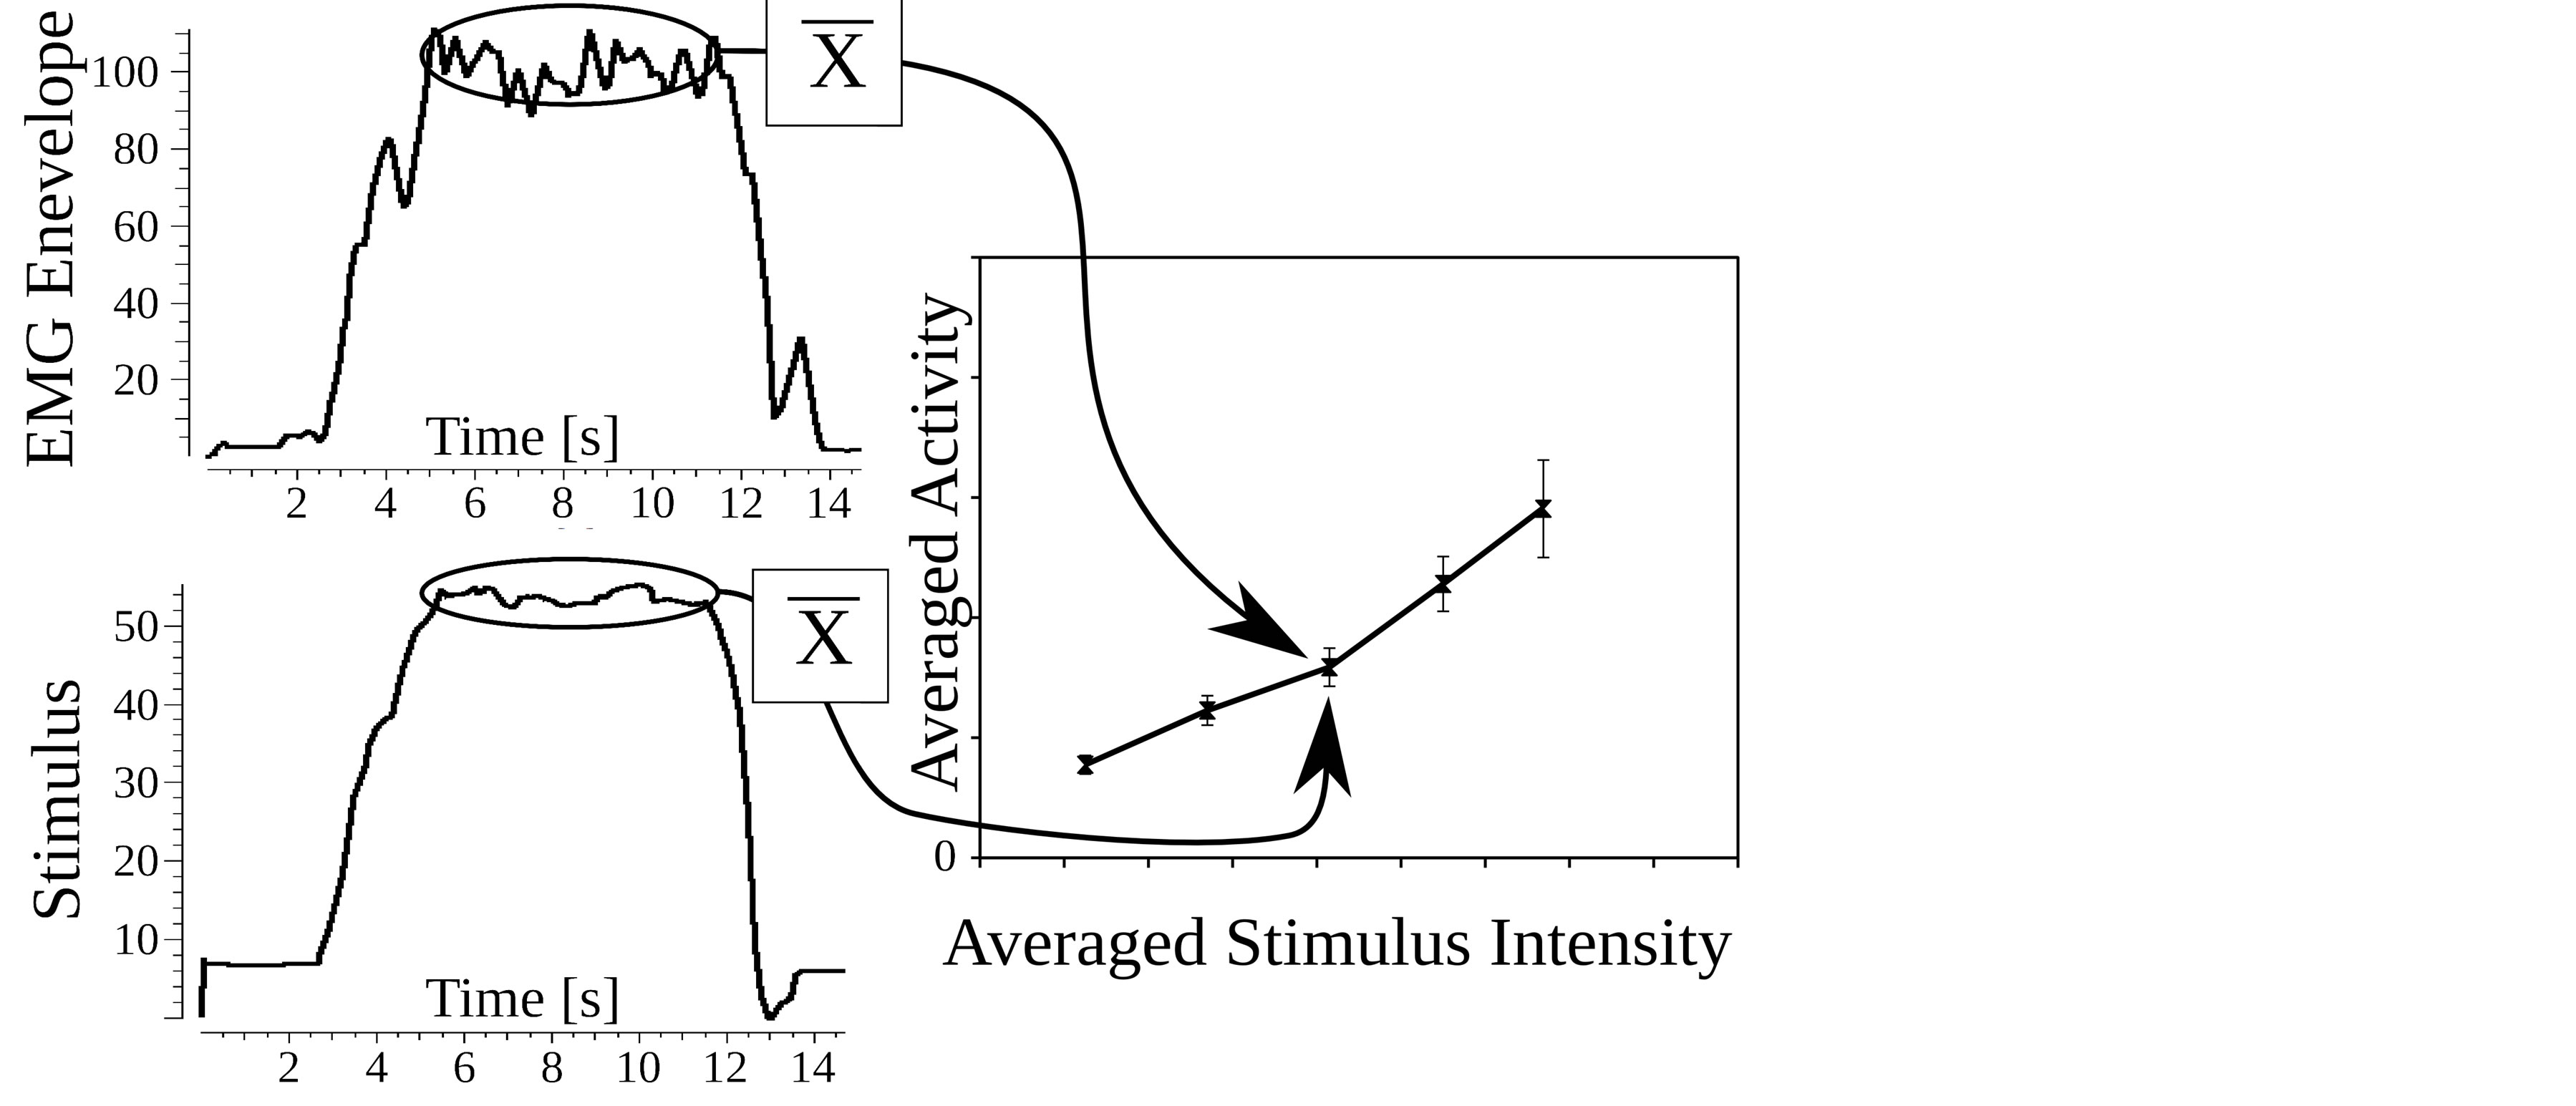
Figure 3. Example for the merge on the base of time for the relation between averaged EMG intensity and the causing stimulus amplitude. Data were measured at the quadriceps femoris muscle.
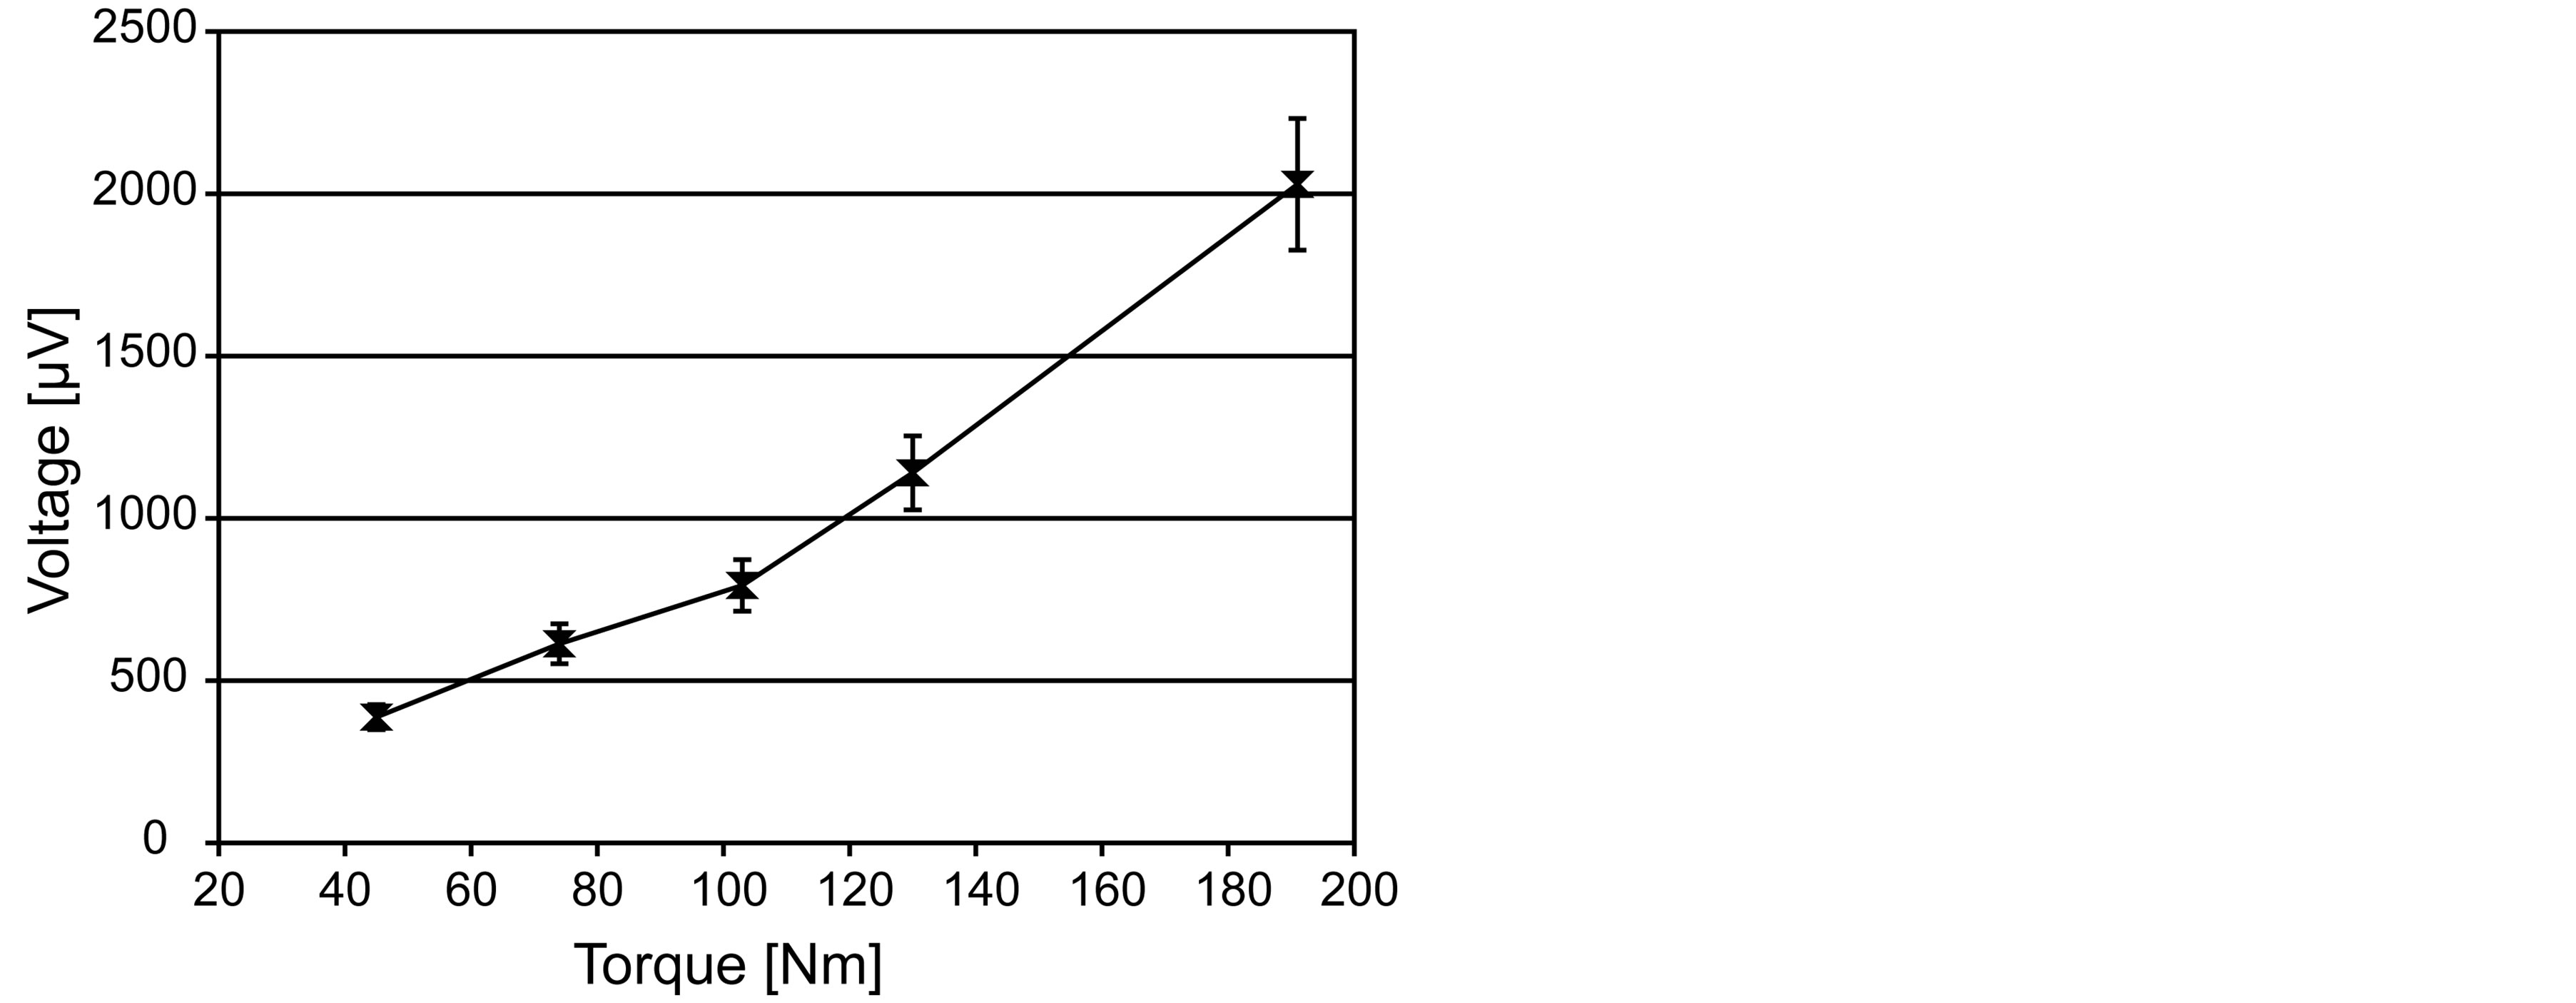
Figure 4. Characteristic curve of the quadriceps femoris muscle.
exerted torque and thus to the produced force. These results are in accordance to the pertinent literature [9] [11] .
4.2. Stapedius, Acoustic Stimulation (Contralateral)
The very same system was used to process the EMG signals measured during the introduced acoustic stimulition. Figure 5 shows the EMG intensity of the ipsilateral stapedius muscle. In this figure, the abscissa shows the stimulating sound amplitudes. As can be seen, a linear increase of the sound pressure level caused an almost linear increase of stapedial activity. The first stimulus of 100 dB provoked an electrical reaction of 363 µV that barely lay above the ambient noise level. The following stimulations of 105 dB (900 µV), 110 dB (1133 µV), and 115 dB (1358 µV) were clearly visible in the EMG. The maximum stimulation with 120 dB caused the maximum EMG intensity of 1688 µV. The slope is approximately 66.25 µV/dB. This observation of linearity corresponds to the pertinent literature [12] [13] .
4.3. Stapedius, Electrical Stimulation (Ipsilateral)
Figure 6 shows the stapedial EMG intensity as a result of the electrical stimulation induced by the cochlear implant. The abscissa shows the stimulating charges. As can be seen, the stapedial response presumably contains three thresholds: t1 the electrically measurable threshold of stapedial activity (18.3 nC with 237 µV), v the vi
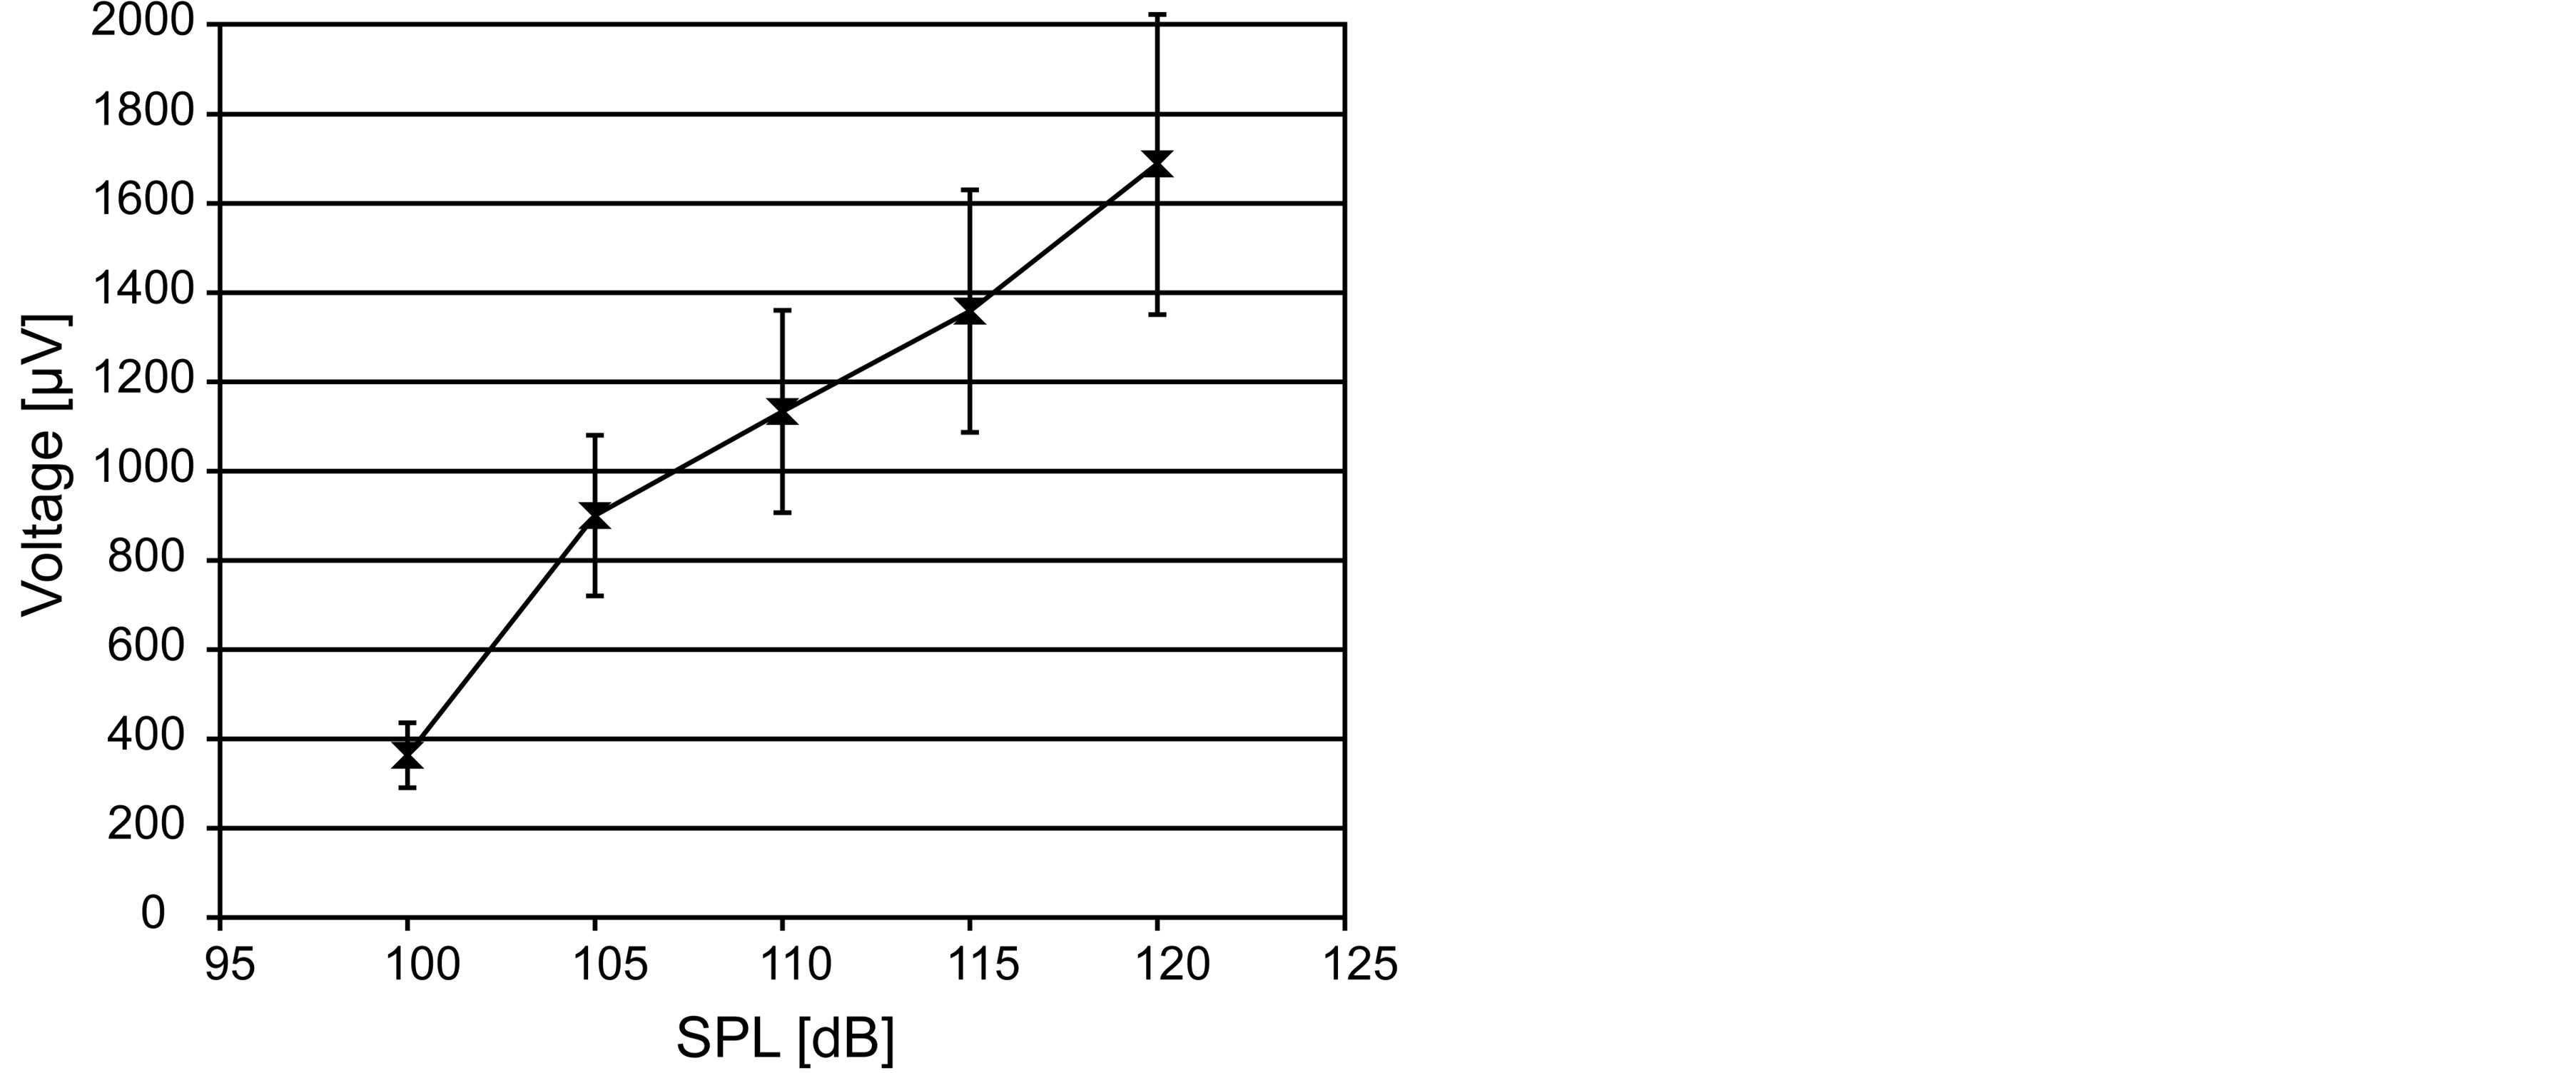
Figure 5. Averaged EMG activity in µV of the stapedius muscle as dependency of the applied contralateral acoustic stimulation in dB (SPL).
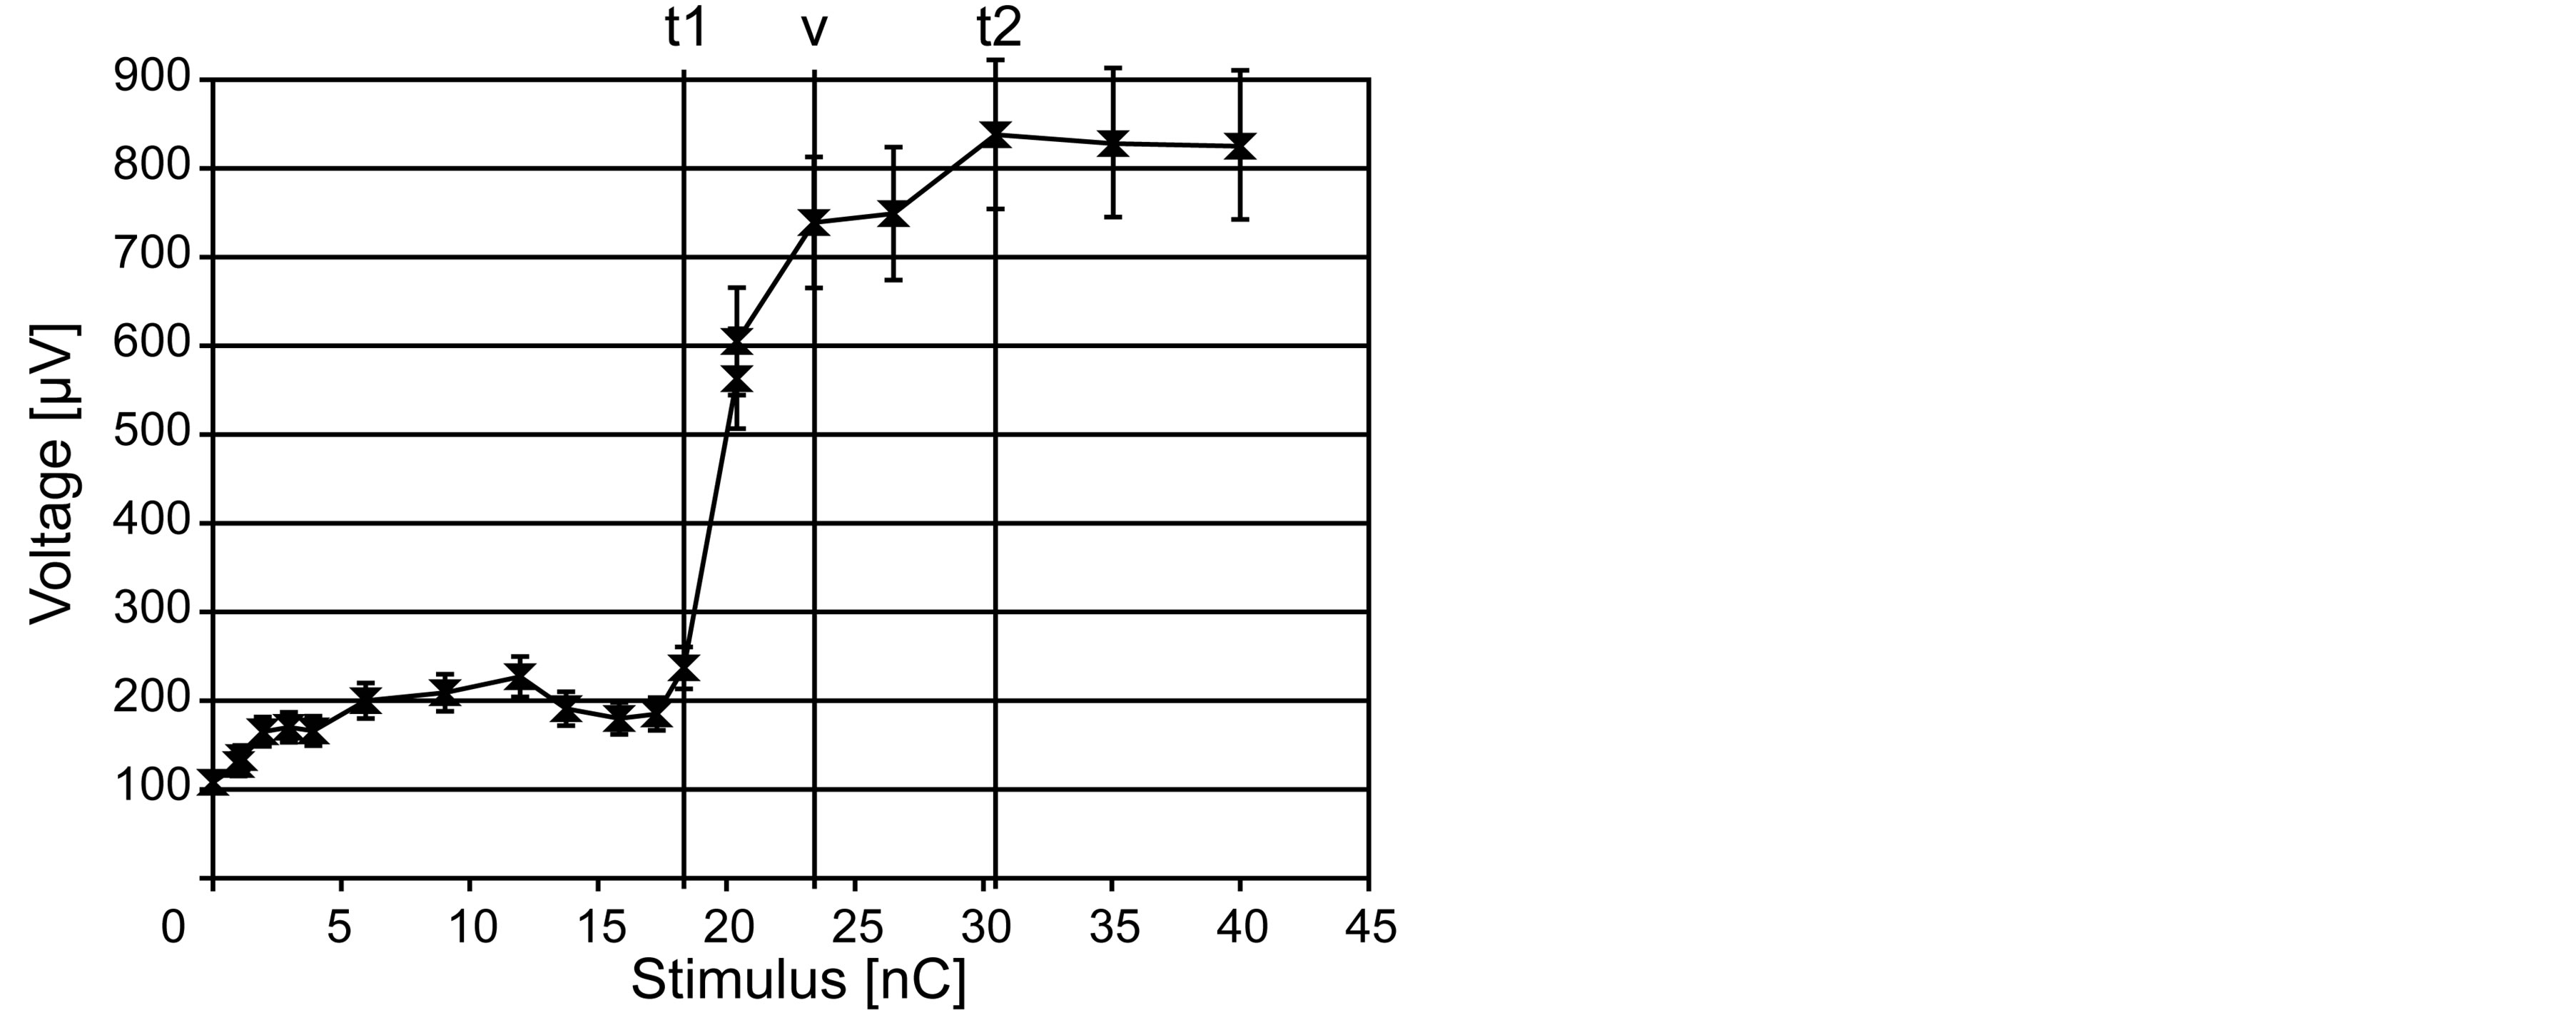
Figure 6. Averaged stapedial EMG activity in µV as dependency of the applied ipsilateral electrical stimulation in nC per pulse.
sually observed threshold (23.4 nC with 739 µV), and t2 the saturation threshold (30.5 nC with 838 µV). These thresholds divide the stapedial response into four parts. The first part, ranging from 0 nC (110 µV) to t1, probably lacks any stapedial activity due to the almost constant amplitude of approximately 160 µV. Instead, this area presumably contains, among other things, the ambient noise level and remnants of the electrical stimulation caused by the implant and the transient behavior of the used band-pass filter. The second part spreads from t1 to the visual stapedius reflex threshold v. This part contains the maximum slope with 98 µV/nC. During the next part, between the thresholds v and t2, the slope significantly flattens to 14 µV/nC. Beyond threshold t2, an increasing stimulation charge did not lead to any further growth of the EMG intensity. The stapedius muscle presumably reached its maximum activity. To summarize, four states of stapedial activity are visible: 1) no activity; 2) activity only visible in the EMG; 3) electrically and visibly observable activity; and 4) the saturated stage.
5. Conclusions to the Behavior of the Stapedius Muscle
In sport science, the used system is widely known and used for skeletal muscles. However, it is common knowledge that the EMG intensity only allows for a qualitative estimation of the force due to the nature of EMG measurements. With reference to the made quadriceps femoris measurements, the EMG intensity qualitatively represents the stimulation amplitude (in form of the voluntary exerted torque) in an almost linear way. By using
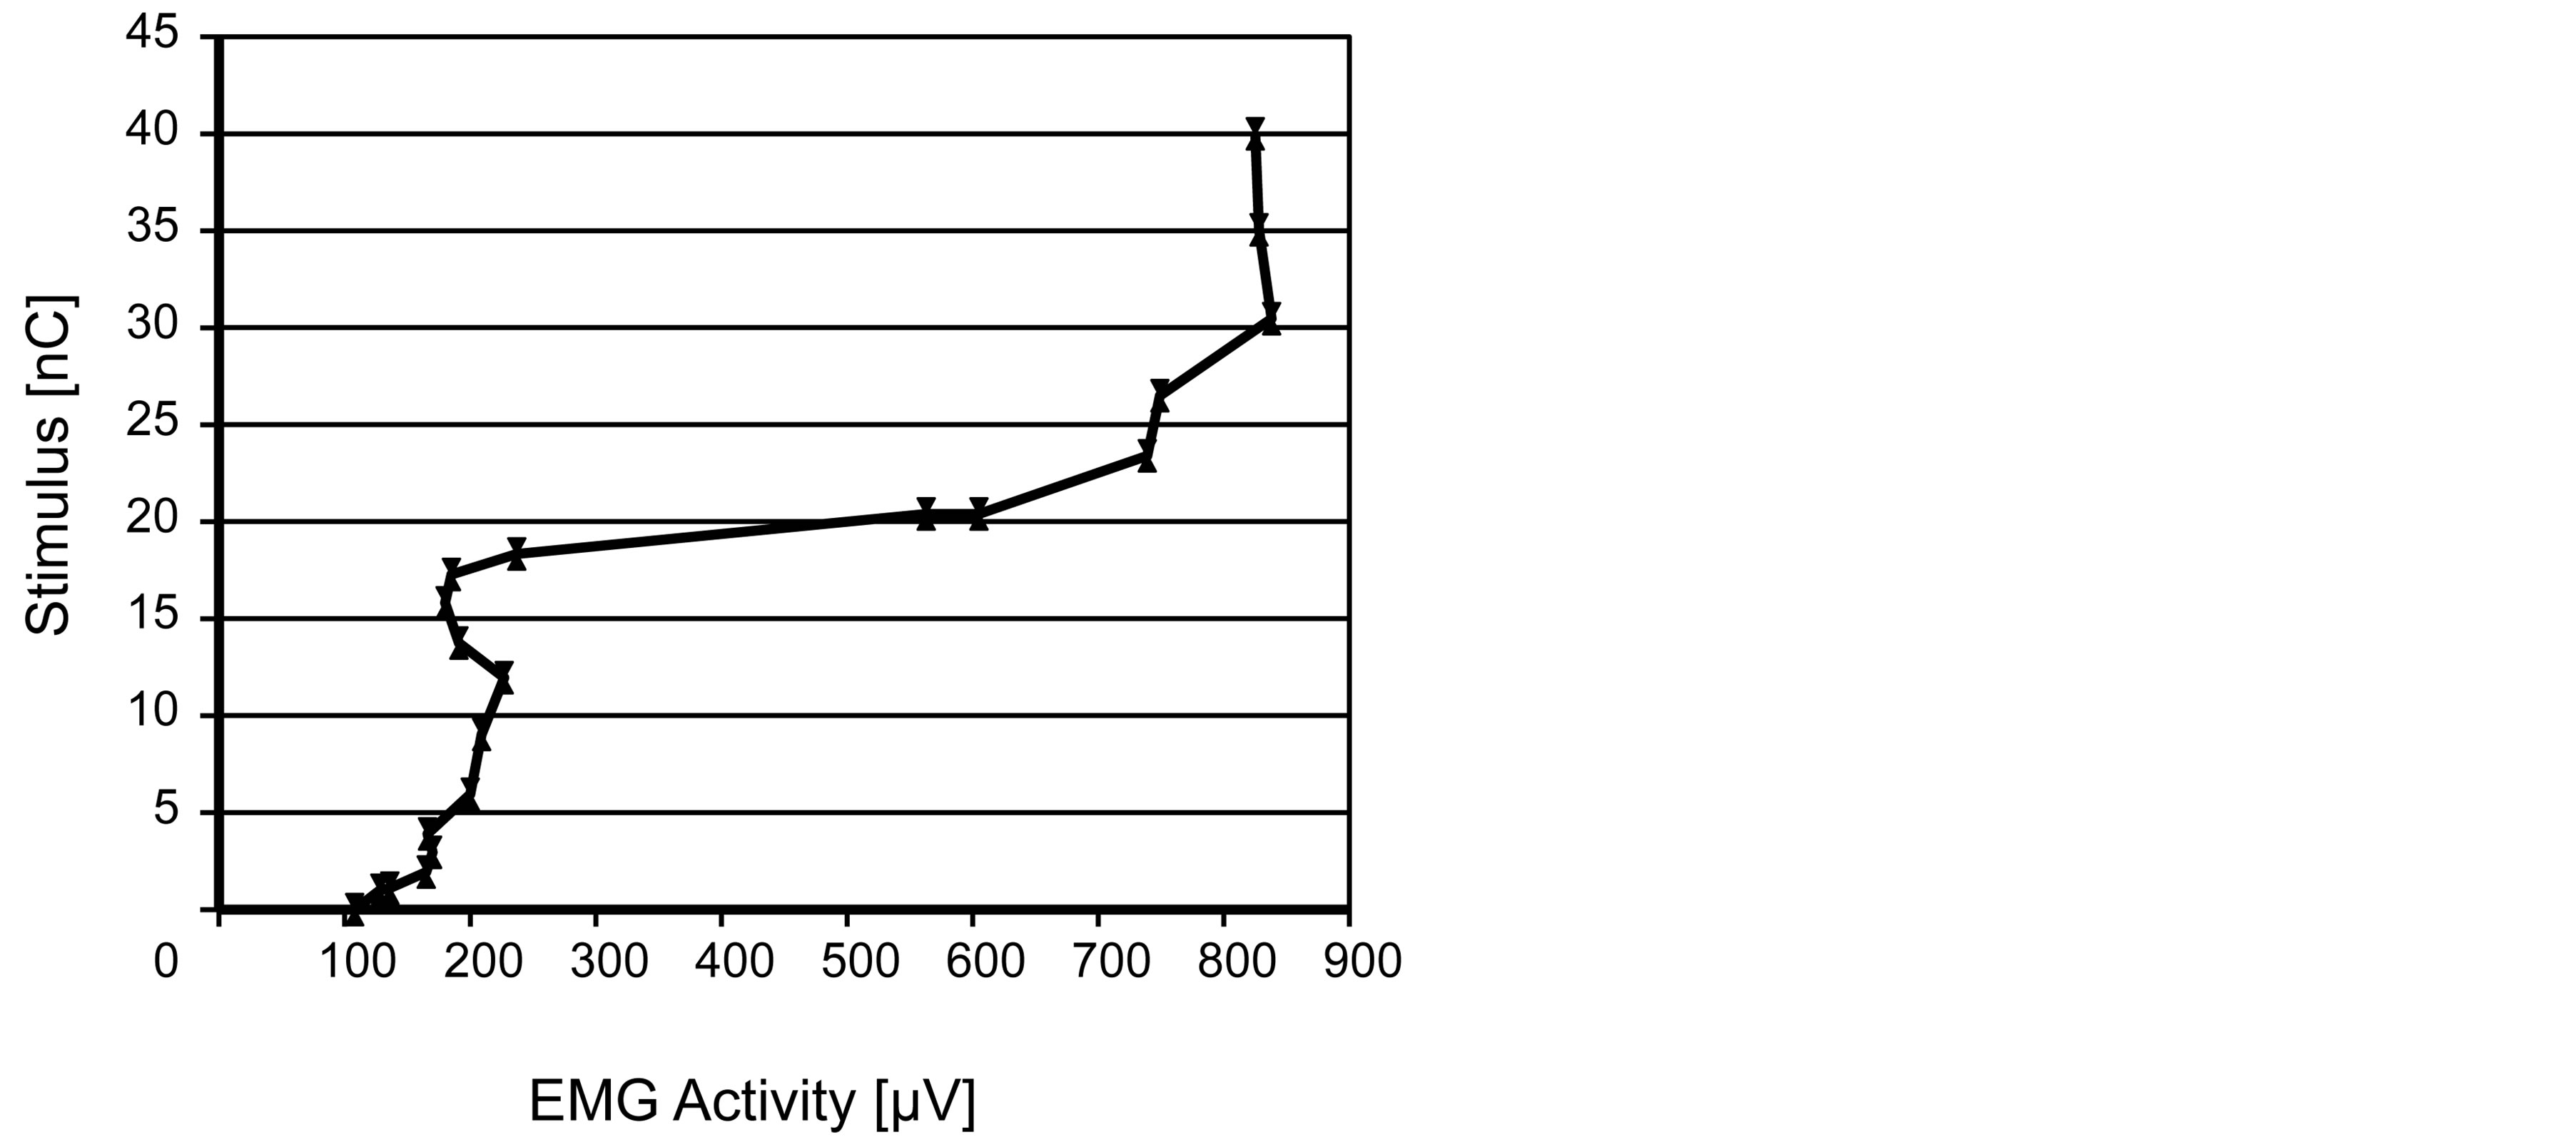
Figure 7. Indication from the EMG intensity (stapedial EMG data) to the perceived loudness.
the same system to analyze the stapedial EMG signals, an almost linear relation between acoustic stimulation and EMG intensity has been observed as well. The electrically evoked stapedial reaction showed a similar behavior. Thus, the exerted stapedial force presumably grows linearly the more intense the stimulation inside the cochlea becomes (within the muscle’s physiological bounds). However, the linear stage has limits. After exceeding a specific level of electrical stimulation, the increase of EMG intensity flattened down 0. This behavior presumably originates from the overexcitation of the hearing system or from the overload of the stapedial system. In terms of muscle overexcitation, experiments at the quadriceps femoris muscle [14] showed a similar behavior. During the acoustic experiments, the saturation stage was not recognizable. Probably, this was due to the low acoustic amplitude or the use of the contralateral ear for stimulation. Furthermore, the made experiments led to the assumption that the stapedial activity is related to the perceived loudness. With the relation between the comfort levels for cochlear implants and the stapedius reflex in mind, the perceived loudness should be derivable from the measured stapedial EMG intensity through inversion. Figure 7 depicts this proposed correlation.
6. Discussion
Even though data seem conclusive in combination with the common knowledge about peripheral skeletal muscles, the amount of available stapedial data was rather small. Thus, a strong demand for data with higher resolution in terms of stimulation amplitude exists for the electrical evoked stapedial responses to check the presented assumptions. Another uncertainty is subject to the EMG approach: Surface EMG electrodes as well as the used hook electrode record only parts of the emitted EMG signal due to limited coverage and due to interactions among the action potentials. Thus, only parts of the electrical activity are measurable. This drawback can be reduced by increasing the averaging period at the cost of responsiveness by a smaller cut-off frequency of the low-pass filter. That is why, the presented experiment results are not directly comparable due to the different stimulations. Thus, only the qualitative behavior and the correlation between stimulus and EMG intensity can be used.
Nevertheless, future research will be devoted to the recording of the electrically evoked stapedial reflex with a higher resolution of the stimulation intensities and on more subjects. Furthermore, long-term measurements will be looking into the natural behavior of the stapedius muscle during continuous cochlear implant stimulations.
Acknowledgements
Special thanks are due to R. Joost, E. Heinrich, and M. Hinkfoth (Institute of Applied Microelectronics and Computer Engineering, University of Rostock, Germany) for continuous support and valuable discussions.
Parts of this research were supported by the DFG funded research training group 1505, “welisa”.
References
- Niemeyer, W. (1971) Relations between the Discomfort Level and the Reflex Threshold of the Middle Ear Muscles. International Journal of Audiology, 10, 172-176.
- Chiveralls, K. and Fitzsimons, R. (1973) Stapedial Reflex Action in Normal Subjects. British Journal of Audiology, 7, 105-110. http://dx.doi.org/10.3109/03005367309082598
- Niemeyer, W. and Sesterhenn, G. (1974) Calculating the Hearing Threshold from the Stapedius Reflex Threshold for Different Sound Stimuli. International Journal of Audiology, 13, 421-427. http://dx.doi.org/10.3109/00206097409071701
- Hodges, A., Balkany, T., Ruth, R., Lambert, P., Dolanash, S. and Schloffman, J. (1997) Electrical Middle Ear Muscle Reflex: Use in Cochlear Implant Programming. Otolaryngology—Head and Neck Surgery, 117, 255-261. http://dx.doi.org/10.1016/S0194-5998(97)70183-9
- Zehnder, A., Allum, J.H.J., Honegger, F. and Probst, R. (1999) Bedeutung der Intraoperativ Registrierten Elektrischen Stapediusreflexschwelle für die Cochlear-Implant-Anpassung bei Kindern. HNO, 47, 970-975. http://dx.doi.org/10.1007/s001060050477
- Bresnihan, M., Norman, G., Scott, F. and Viani, L. (2001) Measurement of Comfort Levels by Means of Electrical Stapedial Reflex in Children. Archives of Otolaryngology—Head & Neck Surgery, 127, 963-966. http://dx.doi.org/10.1001/archotol.127.8.963
- Staudenmann, D., Roeleveld, K., Stegeman, D. F. and Van Dieën, J. H. (2010) Methodological Aspects of SEMG Recordings for Force Estimation—A Tutorial and Review. Journal of Electromyography and Kinesiology, 20, 375-387. http://dx.doi.org/10.1016/j.jelekin.2009.08.005
- De Luca, C.J. (1997) The Use of Surface Electromyography in Biomechanics. Journal of Applied Biomechanics, 13, 135-163.
- Alkner, B.A., Tesch, P.A. and Berg, H.E. (2000) Quadriceps EMG/Force Relationship in Knee Extension and Leg Press. Medicine and Science in Sports and Exercise, 32, 459-463. http://dx.doi.org/10.1097/00005768-200002000-00030
- Pau, H.W., Zehlicke, T., Sievert, U., Schaudel, D., Behrend, D. and Dahl, R. (2009) Electromyographical Recording of the Electrically Elicited Stapedius Reflex via a Bipolar Hook Electrode. Otology & Neurotology, 30, 1-6.
- Fukuda, T.Y. and Echeimberg, J.O. (2010) Mean Square Value of the Electromyographic Signal in the Isometric Torque of the Quadriceps. Hamstrings and Brachial Biceps Muscles in Female Subjects. The Journal of Applied Research, 10, 32-39.
- Fisch, U. and Schulthess, G. (1963) Electromyographic Studies on the Human Stapedial Muscle. Acta Oto-Laryngologica, 56, 287-297.
- Zakrisson, J.E., Borg, E. and Blom, S. (1974) The Acoustic Impedance Change as a Measure of Stapedius Muscle Activity in Man. Acta Oto-Laryngologica, 78, 357-364.
- Levy, M., Mizrahi, J. and Susak, Z. (1990) Recruitment, Force and Fatigue Characteristics of Quadriceps Muscles of Paraplegics Isometrically Activated by Surface Functional Electrical Stimulation. Journal of Biomedical Engineering, 12, 150-156. http://dx.doi.org/10.1016/0141-5425(90)90136-B