Engineering
Vol.5 No.10A(2013), Article ID:37228,7 pages DOI:10.4236/eng.2013.510A002
Pb-Ca-Sn-Ba Grid Alloys for Valve-Regulated Lead Acid Batteries
Department of Physical Chemistry, Saratov State University Named after N. G. Chernyshevsky, Saratov, Russia
Email: burashnikova_mm@mail.ru
Copyright © 2013 Marina M. Burashnikova et al. This is an open access article distributed under the Creative Commons Attribution License, which permits unrestricted use, distribution, and reproduction in any medium, provided the original work is properly cited.
Received June 16, 2013; revised July 16, 2013; accepted July 23, 2013
Keywords: Lead-Acid Battery; Lead Alloys; Barium; Corrosion Layer
ABSTRACT
The effect of barium additives on the process of anodic corrosion of lead-tin-calcium alloys in a 4.8 М sulfuric acid solution was studied. Cyclic voltammetry, impedance spectroscopy, weight loss measurements and scanning electronic microscope analysis have allowed exploring the oxidation process and characterizing the formed corrosion layer. According to our results, barium introduction into lead-tin-calcium alloys increases their hardness, reduces their electrochemical activity, and improves their corrosion stability. Reduction of the calcium content in the alloy can be compensated by adding barium. Barium dopation at lead-tin-calcium alloys decreases the resistance of the oxide layer formed on the grid surface, in a deeply discharged state, and raises its resistance during floating conditions and at a charged state of the positive electrode.
1. Introduction
Pb-Sn-Ca alloys are most widely used for making grids of valve-regulated lead acid (VRLA) batteries. However, the high requirements to power sources entail the necessity of further modifications of the alloys used. These alloys should possess higher mechanical characteristics and enhanced corrosion stability for thinner grids, and general stability under exploitation. So, Pb-Sn-Ca alloys are doped with additional components. Barium is one of such components [1-4]. According to Ref. [5], grids made by punching or continuous casting from a Pb-SnCa alloy with a barium additive provide the improved mechanical properties and the increased corrosion resistance. However, the literature lacks data about the influence of a barium additive on the electrochemical and corrosion properties of Pb-Sn-Ca alloys, and about the properties of the contact corrosion layer formed on the alloy surface. The aim of the present paper was to examine the electrochemical and corrosion behavior of Pb-Sn-Ca-Al-Ba alloys with various barium contents.
2. Experimental
2.1. Preparation of Working Electrodes
The following alloys served the objects of our study: Pb-1.0 wt% Sn-0.06 wt% Ca-0.015 wt% Al (alloy 1), Pb-1.0 wt% Sn-0.06 wt% Ca-0.015 wt% Al-0.015 wt% Ba (alloy 2), Pb-1.0 wt% Sn-0.06 wt% Ca-0.015 wt% Al-0.03 wt% Ba (alloy 3), Pb-1.0 wt% Sn-0.06 wt% Ca-0.015 wt% Al-0.06 wt% Ba (alloy 4). The bariumcontaining alloys were prepared by fusion of the lead-tin, calcium-aluminum and lead-barium alloys. The alloy components were fused in alundum crucibles placed into a resistance furnace, at 500˚C (for the calcium-aluminum and lead-barium alloys the temperature was 850˚C) during 3 h in an argon atmosphere. Then they were cast into a fluoroplastic mould heated up to 200˚C. The obtained round plates of a 25 mm diameter and a 2 mm thickness were kept in the furnace at 200˚C during 5 h for homogenization. The surface of the working electrodes was treated by mechanical polishing with emery paper with successive decreasing the grain size down to 10 µm. Then, the electrodes were polished with thick felt and immersed into a special solution for chemical polishing of lead (99 vol% CH3COOH, 1 vol% H2O2). The working electrode was washed with double-distilled water and ethanol before immersing into the electrolyte solution.
2.2. Cyclic Voltammetry (CV) and Electrochemical Impedance Spectroscopy (EIS) Measurements
A three-electrode cell was used for electrochemical measurements. An Ag/AgCl/KCl electrode served as a reference one (E0 = 0.201 V vs. SHE at 25˚C). All potentials reported here are referenced to the standard hydrogen electrode (vs. SHE). A platinum plate (Pt 99.99%) was used as an auxiliary electrode. The electrolyte, a 4.8 M H2SO4 solution, was prepared from H2SO4 and double-distilled water. Before every experiment, a cathode potential of −1.0 V was applied for 10 min in order to remove any oxides formed during the pretreatment. Cyclic voltammetry (CV) and electrochemical impedance spectroscopy (EIS) measurements were performed using an AUTOLAB PGSTAT302N controlled by a personal computer. Cyclic voltammetric curves were recorded for each electrode at a potential scanning rate 20 mV·s−1 during hundred cycles within potential ranges from −0.7 to 0.0 and from 1.5 to 2.5 V. An anode corrosion film was formed on the studied electrodes before impedance measurements. The anode corrosion film on the electrode surface was formed under several potentials during one hour after preliminary cycling (5 cycles) from −1.0 V up to the film formation potential. Then, an impedance spectrum was recorded at the same potential. Impedance was measured just after the corrosion layer growth in the same cell and at the same potential within a frequency range from 100 kHz to 1 MHz with amplitude of 10 mV. All measurements were made at room temperature (22˚C ± 0.5˚C). The recorded impedance spectra were processed by ZView® 3.0а software (Scribner Associates, Inc.) with selection of equivalent circuits.
2.3. Metallographic Examinations
For microstructural analysis of lead alloys, the surface of the samples was mechanically polished with emery paper with various roughness. Then, the samples were carefully washed with distilled water, polished chemically in a solution of the following composition: 1.5 ml of 50% hydrogen peroxide and 48.5 ml of icy acetic acid. After this, the electrode was polished with thick felt and washed with distilled water once again. The micrographic specimens were etched during 3 h without heating or 0.5 - 2 min in a heated (up to 70˚C - 80˚C) solution of the following composition: 10 ml of concentrated acetic acid; 10 ml of concentrated nitric acid; 40 ml of glycerol. Then they were washed with distilled water. The surface of the samples was examined by means of a metallographic digital Altami MET1M complex equipped with a digital camera and connected to a PC.
2.4. Scanning Electron Microscopy (SEM) Imaging
Morphological studies on the surface of oxidized electrodes made of the above alloys were performed by means of a MIRA 2 LMU scanning electronic microscope equipped with a system of energy-dispersion microanalysis (INCA Energy). The resolution of this microscope reaches 5 nm, and the sensitivity of the INCA Energy detector is 133 eV/10 mm2, which enables analysis of chemical elements from beryllium to plutonium to be carried out in deep vacuum. The anodic corrosion film on the electrode surface was formed under a potential of 1.3 V during six hours after preliminary cycling (5 cycles) from −1.0 V to the potential of film formation.
2.5. Corrosion Test
The corrosion resistance of the alloys under examination was estimated by the weight loss of the samples after their oxidation under potentiostatic conditions and oxide film removal. The samples as disks of a 2.3 cm diameter were kept at a potential of 2.15 V (vs. SHE) in a threeelectrode cell in a 4.8 M solution of sulfuric acid at 40˚C. The duration of anodic polarization of the electrodes was 10, 30, 60, and 180 min. Under this anode potential, lead alloys are oxidized to lead dioxide with oxygen release. Therefore, we selected more severe conditions for corrosion tests of alloys in comparison with those occurring in real LABs, where the positive electrode may be under such potentials at significant overcharges only. Prior to measurements, the electrodes were thoroughly washed with distilled water and mechanically polished with emery paper of various roughnesses. Then, they were again washed with distilled water and treated with ethanol; each electrode was dried and weighed. After anodic polarization, the oxide film formed was removed during 30 min in a boiling solution of the following composition: 80 g/dm3 of sodium hydroxide; 50 g·dm−3 of mannitol; 0.62 g·dm−3 of hydrazine sulfate. This solution had previously been found out not to dissolve the metal components of the alloy at boiling. Further, the electrodes were washed with distilled water, dried, and weighed once again. The corrosion weight loss (mg·cm−2) was calculated by the following formula:
where  is the initial weight of the sample, mg;
  the weight of the sample on removal of the corrosion products, mg; S the surface area of the sample before the test, cm2.
3. Results and Discussion
3.1. Cyclic Voltammetry
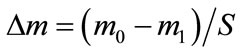
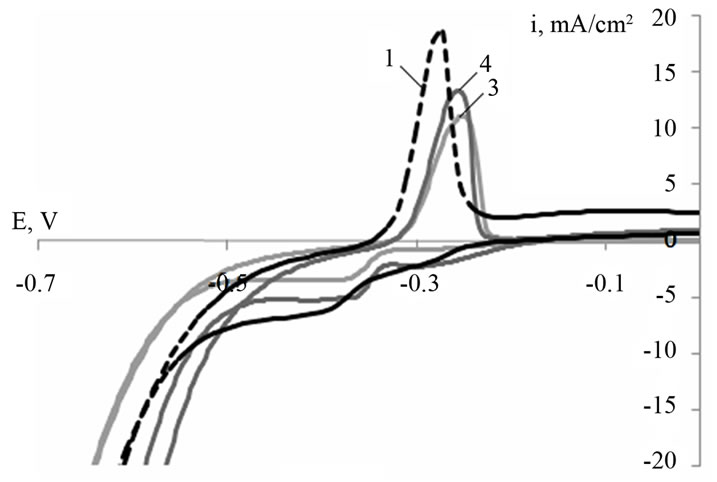
Figure 1 shows typical cyclic voltammograms of a leadtin-calcium electrode with a barium additive (0.03 and 0.06 wt%) within a potential range from −0.7 to 0.0 (Figure 1(a)) and from 1.5 to 2.5 V (Figure 1(b)) at the fortieth cycle. The recorded curves look typically for the lead electrode and are characterized by the same processes [6]. Figure 1 indicates that barium introduction into the Pb-Sn-Ca alloy leads to a shift of the peaks corresponding to the processes of lead oxidation to lead sulfate (Figure 1(a)) and that of lead sulfate to lead dioxide (Figure 1(b)), towards the positive side. It is necessary to note that the peak currents of oxidation of the Pb-Sn-CaBa electrodes decrease. Therefore, barium introduction into the alloy leads to some decrease in their electrochemical activity.
3.2. Corrosion Test
The mechanical and corrosion properties of lead-calcium and lead-tin-calcium alloys are repeatedly described [7]. Ref. [8] shows the influence of calcium additives at the tin content of 0.5 and 1.5 wt% on the fluidity limit, strength at stretching, creep resistance, and corrosion rate. So, for example, the maximum values of the fluidity limit, strength at stretching, and creep resistance were reached at a calcium content 0.075 wt% and a tin one 1.5 wt%.
 (a)
(a) (b)
(b)
Figure 1. Cyclic voltammograms for Pb-1.0 wt% Sn-0.06 wt% Са (alloy 1), Pb-1.0 wt% Sn-0.06 wt% Са-0.03 wt% Ba (alloy 3), Pb-1.0 wt% Sn-0.06 wt% Са-0.06 wt% Ba (alloy 4) electrodes within a potential range from −0.7 to 0.0 V (a) and from 1.5 to 2.5 V (b) (vs. SHE). Cycle number is 40; scan rate is 20 mV/s.
However, the corrosion rate of Pb-Sn-Ca alloys continuously grows with the calcium content. In our previous paper [9] it was shown that in the lead-tincalcium alloy with 1 wt% of tin the decrease in the calcium content from 0.08 down to 0.06 wt% leads to a significant increase in its corrosion stability, but its mechanical properties worsen. However, barium introduction (0.015 wt%) into the alloy containing 0.06 wt% of Ca and 1 wt% of tin entails a significant increase in its hardness, with its value to reach 20.5 N·mm−2. For comparison: the hardness of the alloy containing 0.08 wt% of Ca is 14.5 N·mm−2. The high hardness of the Pb-Sn-Ca alloys is due to the formation of a fine intermetallic phase (PbSn)3Ca sedimenting into the lead matrix [10]. The additional increase in hardness of the alloys with a barium additive can be explained by the formation of another intermetallic compound BaPb3 [11]. A decrease in the calcium content can therefore be compensated by barium introduction. Table 1 provides data on the influence of a barium additive on the corrosion characteristics of lead-tin-calcium alloys. It follows from the obtained data that the barium additive somewhat reduces the corrosion losses at long corrosion times.
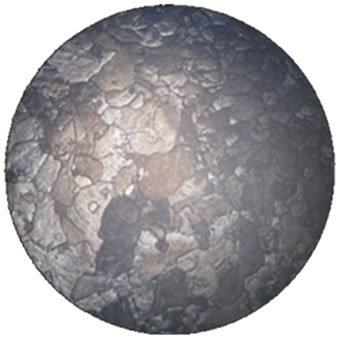
The corrosion and mechanical properties of alloys are mainly determined by their microstructure. Our microstructural analysis of the studied alloys has shown that barium introduction leads to the formation of a more homogeneous structure of grains and to an increase in their size (Figure 2), which leads to reduction of intercrystalline corrosion.
3.3. Impedance Spectroscopy
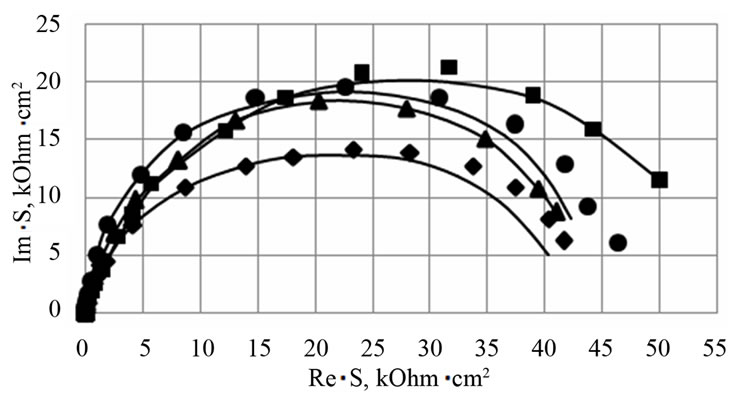
To study the influence of a barium additive on the resistance of the anode corrosion film formed on the positive grid surface, three values of potentials were chosen which the corrosion film was grown at. The 1.3 V potential corresponds to the deeply discharged state of the positive electrode. In these conditions, a PbO/PbSO4 corrosion layer is formed on the positive grid surface. Under this potential, corrosion is insignificant, but the growth of the PbO insulating layer may quickly increase the internal resistance of the battery. The second potential (1.7 V) corresponds to the mode of additional charging of the battery (a floating test). In this potential range, a complex corrosion layer is formed, consisting of PbO, PbOx (1 < x < 2), and PbSO4. There, corrosion is stronger but the risk of an increased internal resistance is high as well. The 2.05 V potential corresponds to the charged state of the positive electrode. In these conditions, PbO2 is formed. Figure 3 shows Nyquist plots for the electrodes made of the examined alloys with a corrosion layer formed under potentials of 1.3 V and 1.7 V. For
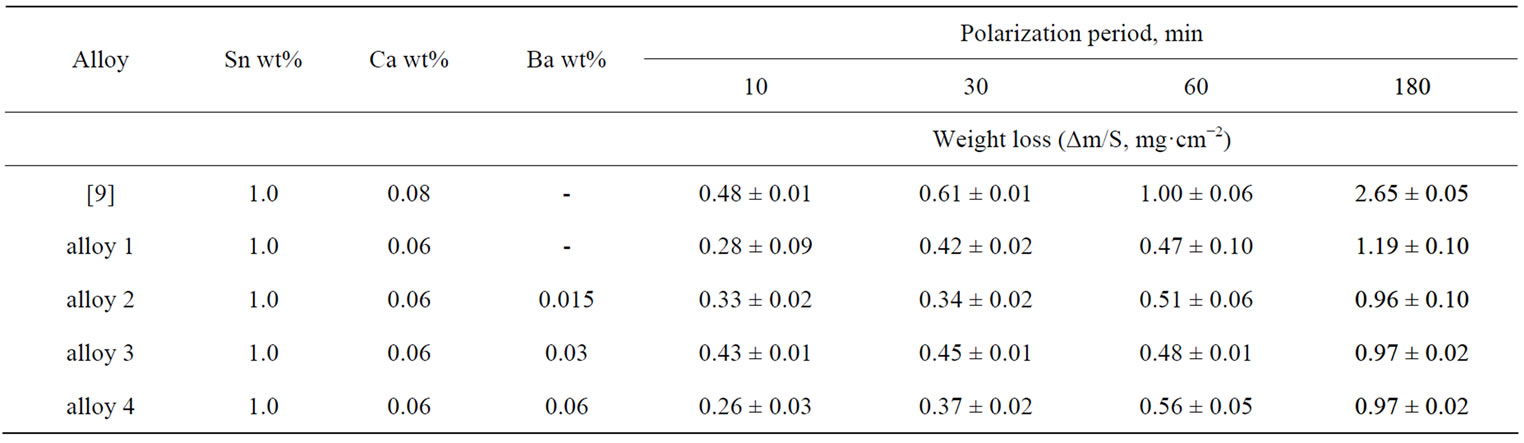
Table 1. Barium effect of the corrosion properties of lead-tin-calcium alloys (Е = 2.15 V, T = 40˚C, 4.8 M H2SO4).
 (a)
(a)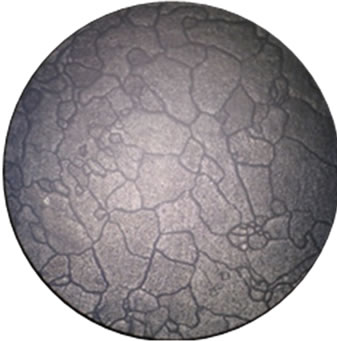 (b)
(b)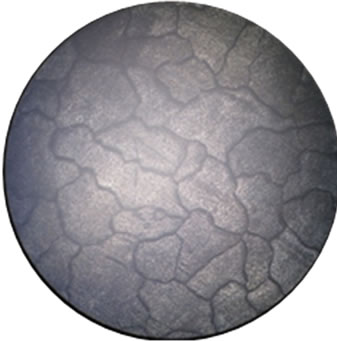 (c)
(c)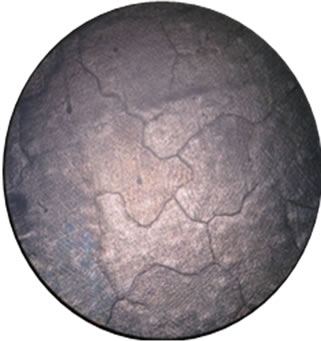 (d)
(d)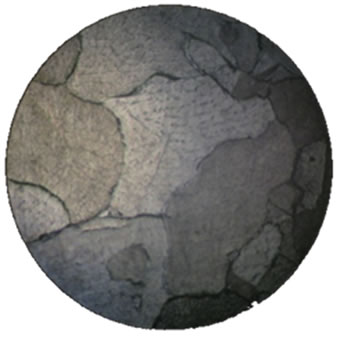 (e)
(e)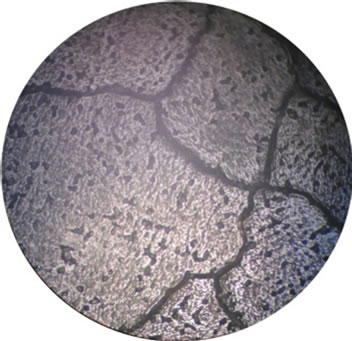 (f)
(f)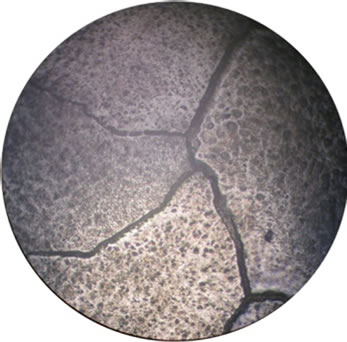 (g)
(g)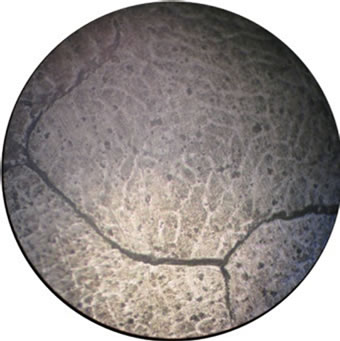 (h)
(h)
Figure 2. Microstructure of our alloys: (a), (e)—alloy 1, (b), (f)—alloy 2, (c), (g)—alloy 3, (d), (h)—alloy 4). (a), (b), (c), (d)—scale 40×, (e), (f), (g), (g)—scale 200×.
 (a)
(a)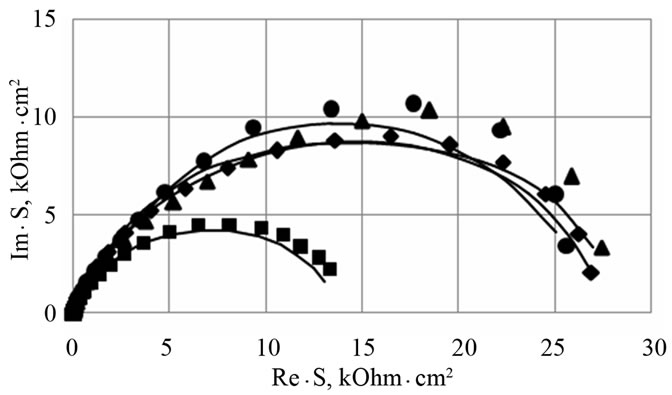 (b)
(b)
Figure 3. Nyquist plots for Pb-1.0 wt% Sn-0.06 wt% Са (■-alloy 1), Pb-1.0 wt% Sn-0.06 wt%Са-0.015 wt% Ba (♦-alloy 2), Pb-1.0 wt%Sn-0.06 wt% Са-0.03 wt% Ba (▲-alloy 3), Pb-1.0 wt% Sn-0.06 wt% Са-0.06 wt% Ba (●-alloy 4) electrodes with a corro-sion film on their surface formed during 1 h at a potential E=1.3 V (a) and E=1.7 V (b) with preliminary cycling of the electrodes (5 cycles) within the range from −1.0 V to the potential of growth. Experimental data (■), (♦), (▲), (●) and fit line (–).
data processing, the equivalent circuit (Figure 4) was used, earlier proposed for interpretation of frequency spectra with an oxide film appeared on the lead electrode at E = 1.3 V and 1.7 V [6]. Rs corresponds to the ohmic resistance of the electrolyte. The С element describes the capacitance of the double electric layer on the electrode/electrolyte (PbSO4/electrolyte) interface. R1 and R2 can be attributed to the resistances of the external part of the corrosion layer composed of lead sulfate and the internal part made of lead oxide, respectively.
The calculated values of this equivalent circuit elements describing the frequency dependences of electrode impedances for electrodes made of lead-tin-calcium alloys with a barium additive with an anode film on their surface, formed at potentials 1.3 V and 1.7 V are given in Table 2.
It is seen from the table that a corrosion film with a high resistance is formed under the potential of 1.3 V. The total impedance of the system is mainly contributed by the R2 resistance belonging to the internal oxide layer of the anode film. At this potential, the internal oxide layer is lead (II) oxide. R1, which is attributed to the resistance of the external sulfate film, has rather low values. Barium introduction into the Pb-Sn-Ca alloy increases in the resistance of the sulfate film and a small decrease in the resistance of the internal oxide film.
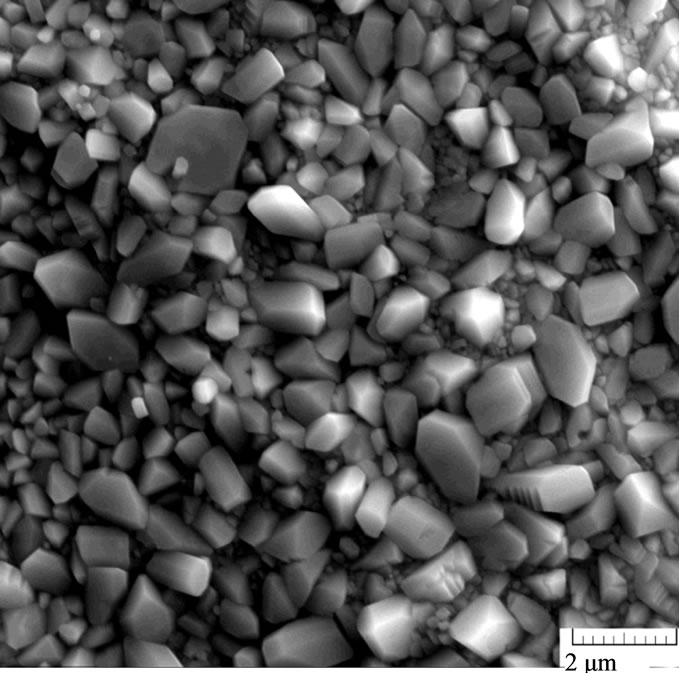
Under the potential 1.7 V, the total impedance of the system decreases: the resistance of both sulfate and oxide films decreases. In these conditions, non-stoichiometric lead oxides are formed; they possess better conductivity, which entails a decrease in the impedance of the system. However, barium introduction into the alloy increases the resistance of the internal oxide film (R2). As electron microscopic studies show, the anode film on the Pb-Sn-Ca-Ba alloys, unlike the Pb-Sn-Ca one, is characterized by a combination of coarse and fine crystals (Figure 5). The presence of fine crystals makes the film denser, which hinders PbO oxidation to PbOx (1 < x < 2). Figure 6 shows the frequency dependences of the electrode impedance recorded for electrodes made of the Pb-Sn-Ca and Pb-Sn-Ca-Ba alloys after their anodic oxidation at a potential of 2.05 V. They are regular semi-
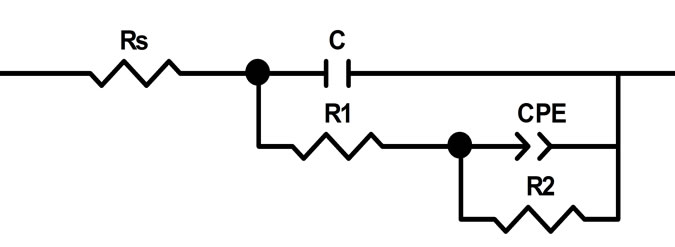
Figure 4. Equivalent circuit used for approximation of impedance spectra in the frequency range of 0.01 - 50,000 Hz, recorded on previously oxidized electrodes made of leadtin-calcium alloys with a barium additive at potentials 1.3 and 1.7 V in a sulfuric acid solution.
 (a)
(a)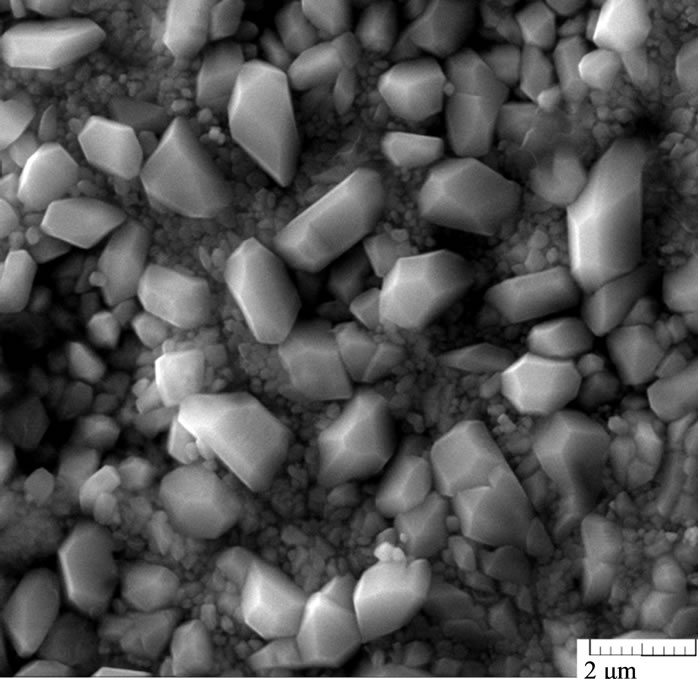 (b)
(b)
Figure 5. Electron microscopic photos of the anode films formed in potentiostatic conditions (Е = 1.3 V) on the surface of the lead-tin-calcium alloy (Pb-1.0 wt%, Sn-0.08 wt% Ca) (a) and the lead-tin-calcium-barium alloy (Pb-1.0 wt%, Sn-0.06 wt%, Ca-0.015 wt% Ba).
circles without any deformation. The resistance of the anode films formed under these conditions has the lowest value among all studied films at other potentials (Table 3).
In this case, the equivalent circuit, well approximating the electrode impedance, consists of a block of the capacity C of the double layer and the resistance R connected in parallel, which, in turn, is connected in series to Rs (the ohmic resistance of the electrolyte) (Figure 7) [6].
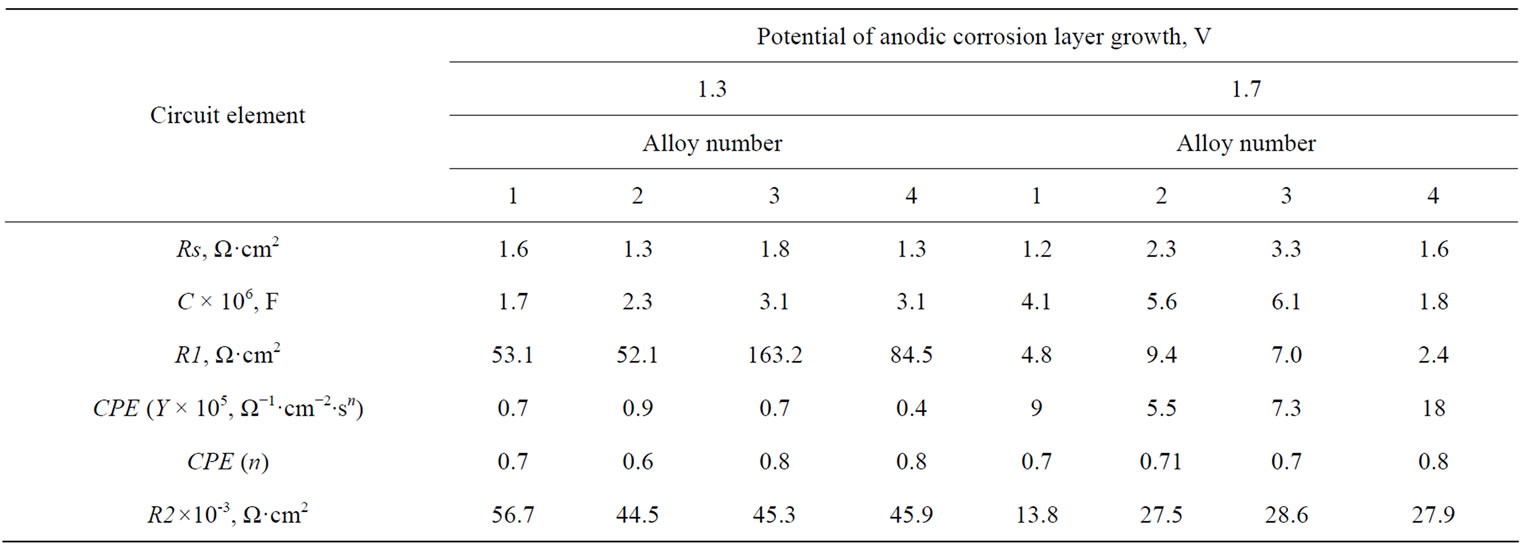
Table 2. Values of the equivalent circuit parameters calculated from impedamce spectra of the Pb-Sn-Ca и Pb-Sn-Ca-Ва electrodes with an anode corrosion film formed during 1 h under potentials 1.3 and 1.7 V.
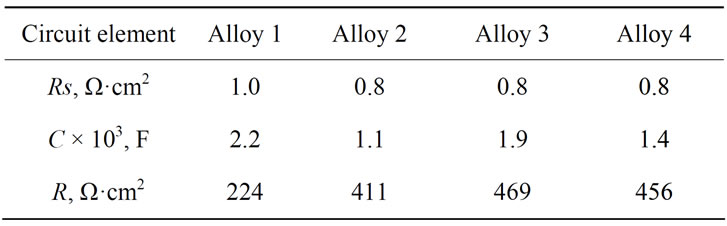
Table 3. Values of the equivalent circuit paremeters calculated form impedance spectra for Pb-Sn-Ca and Pb-SnCa-Ва electrodes with an oxide film formed during 1 h under 2.05 V.
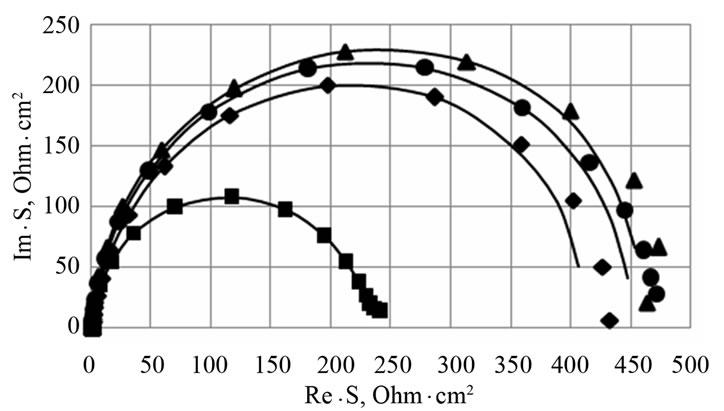
Figure 6. Nyquist plots for Pb-1.0 wt% Sn-0.06 wt% Са (■-alloy 1), Pb-1.0 wt% Sn-0.06 wt% Са-0.015 wt% Ba (♦-alloy 2), Pb-1.0 wt% Sn-0.06 wt% Са-0.03 wt% Ba (▲-alloy 3), Pb-1.0 wt% Sn-0.06 wt% Са-0.06 wt% Ba (●-alloy 4) electrodes with a corrosion film on their surface formed during 1 h at potential E = 2.05 V with preliminary cycling of the electrodes (5 cycles) within the range from –1.0 V to the potential of growth. Experimental data (■), (♦), (▲), (●) and fit line (–).
This equivalent circuit gives evidence of the anode film formed at the potential of 2.05 V being single-layered by structure and consisting of well-conducting oxide phases. The calculated values of the elements of the proposed equivalent circuit describing the frequency dependences of electrode impedance for the electrodes with
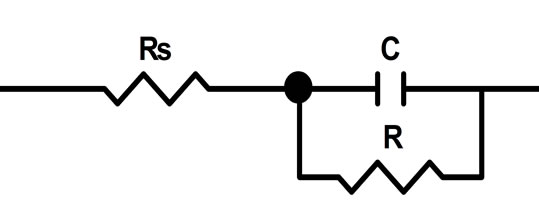
Figure 7. Equivalent circuit used for fitting of impedance spectra within the frequency range of 0.01 - 50,000 Hz, recorded on previously oxidized electrodes made of lead-tincalcium alloys with a barium additive at a potential 2.05 V in a sulfuric acid solution.
an oxide film on their surface formed at a potential 2.05 V are given in Table 3. As is seen from Table 3, at the potential of 2.05 an oxide film is formed with a low resistance, mainly consisting of well-conducting PbO2. However, barium introduction into lead-tin-calcium alloys leads to an increase in the resistance of the formed oxide film on the surfaces of the electrodes.
4. Conclusions
Barium introduction into lead-tin-calcium alloys increases their hardness, reduces their electrochemical activity and, as a consequence, increases their corrosion stability. Hence, to improve the physicomechanical and corrosion properties of the positive grids of hermetical lead-acid batteries, optimization of the lead-tin-calcium alloy composition can be conducted towards decreasing the calcium content in the alloys with their simultaneous barium dopation.
It has been established by impedance spectroscopy that dopation of lead-tin-calcium alloys with barium reduces the resistance of the oxide layer formed on the grid surface, in the deep discharge conditions (E = 1.3 V). When the positive electrode is in floating conditions (E = 1.7 V) or is completely charged (E = 2.05 V), barium introduction into the lead-tin-calcium alloys of the positive grids somewhat raises the resistance of the oxide film formed on the grid surface in these conditions.
REFERENCES
- J. Furukawa, T. Hiraki, Y. Mori and Y. Nehyo, “LeadBased Alloy for Lead-Acid Battery, Grid for Lead-Acid Battery and Lead-Acid Battery,” Pat. EP1496556B1, 2008.
- L. D. Silva-Galvan and L. F. V. Del Mercado, “SilverBarium Lead Alloy for Lead-Acid Battery Grids,” Pat. EP1264907A1 (US20020182500, US20050142443), 2001.
- L. Albert and B. Madelin, “Method for the Continuous Manufacture of Positive Battery Grids and Positive Grids Obtained by Said Method,” Pat. EP0996987A1, 2000.
- J. Furukawa, Y. Nehyo and M. Ozaki, “Lead-Based Alloy for Lead-Acid Battery Grid (Text from WO200410 4244A1),” Pat. EP1629132A1, 2006.
- E. Gullian, L. Albert and J. L. Caillerie, “New Lead Alloys for High-Performance Lead-Acid Batteries,” Journal of Power Sources, Vol. 116, No. 1-2, 2003, pp. 185-192. http://dx.doi.org/10.1016/S0378-7753(02)00705-X
- M. M. Burashnikova, I. A. Kazarinov and I. V. Zotova, “Nature of Contact Corrosion Layers on Lead Alloys: A Study by Impedance Spectroscopy,” Journal of Power Sources, Vol. 207, 2012, pp. 19-29. http://dx.doi.org/10.1016/j.jpowsour.2011.12.042
- D. A. J. Rand, P. T. Moseley, J. Garche and C. D. Parker, “Valve-Regulated Lead-Acid Batteries,” ELSEVIER, Amsterdam, 2004.
- R. D. Prengaman, “Wrought Lead Calcium Tin Alloys for Tubular Lead-Acid-Battery Grids,” Journal of Power Sources, Vol. 53, No. 2, 1995, pp. 207-214. http://dx.doi.org/10.1016/0378-7753(94)01975-2
- E. V. Inozemtseva, M. M. Burashnikova and I. A. Kazarinov, “Influence of Some Components of Lead-Antimony and Lead-Calcium Alloys on Their Mechanical and Corrosion Properties,” Elektrokhimicheskaya Energetika, Vol. 7, No. 4, 2007, pp. 196-199.
- E. Rocca, G. Bourguignon and J. Steinmetz, “Corrosion Management of PbCaSn Alloys in Lead-Acid Batteries: Effect of Composition, Metallographic State and Voltage Conditions,” Journal of Power Sources, Vol. 161, No. 1, 2006, pp. 666-675. http://dx.doi.org/10.1016/j.jpowsour.2006.04.140
- H. Okamoto, “Ba-Pb (Barium-Lead),” Journal of Phase Equilibria and Diffusion, Vol. 29, No. 3, 2008, p. 293. http://dx.doi.org/10.1007/s11669-008-9310-3