Engineering
Vol.5 No.9A(2013), Article ID:36783,7 pages DOI:10.4236/eng.2013.59A002
Monitoring of Lactic Fermentation with a Coupling Electronic Nose and Gas Chromatography
1Integral Laboratory of Research on Food, Tepic Institute of Technology, Tepic, Mexico
2Orizaba Institute of Technology, Division of Graduate Studies and Research, Orizaba, Mexico
3UMR Qualisud (Integrated Approach to the Food Quality), University of Montpellier 2, Montpellier, France
Email: *arturoragazzo@hotmail.com
Copyright © 2013 m. Calderon-santoyo et al. This is an open access article distributed under the Creative Commons Attribution License, which permits unrestricted use, distribution, and reproduction in any medium, provided the original work is properly cited.
Received May 28, 2013; revised June 28, 2013; accepted July 5, 2013
Keywords: Electronic nose; lactic fermentation; PCA; volatile compounds
ABSTRACT
In this work, the performance of dehydratation-desalcoholization system based on an electronic nose coupled to gas chromatography was tested. The system was used for monitoring the volatile compounds produced during a lactic fermentation with a heterofermentative bacteria (Lactobacillus fermentum Ogi E1). The monitoring was carried out with dehydratation and desalcoholization or dehydratation only, on the basis of low ethanol concentration produced by this bacteria. In the first case, fermentation head-space analyses showed low signals from each gas sensor, then the principal components analyses (PCA) resulted confused. However with the only dehydratation system, the electronic nose was able to detect some volatile compounds during bioprocess. The PCA showed a single distribution, permitting to conclude that principal component 1 represented the ethanol concentration. The system is appropriate to monitor some parameters during the fermentations process as ethanol, lactate and biomass concentration.
1. Introduction
Electronic noses (E-noses) are tested and applied since the eighties as aromatic quality sensors in the agricultural, environmental, medical, biotechnological and food domains [1-3]. They are typically composed of an array of non-specific chemical gas sensors characterized by a broad and partly overlapping selectivity to volatile compounds. This concept was inspired by the human nose and clearly shows similarity with the human brain-olfactory system [4]. E-nose is on the contrary a fast, reliable, costeffective, in line, automatic and operator-friendly system of aroma analysis [3,5]. Nevertheless, the E-nose’s gas sensors provide a large and complex amount of data (i.e. sensor responses), which has to be processed by pattern recognition techniques such as principal component analysis (PCA), linear discriminant analysis (LDA) or neural network (NN) [6,7]. Recently, several studies proposed to improve discrimination between E-nose data, first analyzing by PCA, in order to reduce the data dimension, and secondly, selecting some of the most relevant principal component values as input in classification techniques such as LDA or NN [5,8]. Data processing improves the selectivity of the systems leading to an extensive range of applications.
Samples classification [6,9], adulterations or detection of defaults in aroma [10,11], quality measurement [8] and process monitoring [12-14] are the main applications of the E-nose technology. Recent applications of E-nose concerned the biotechnological domain. E-nose was implemented to study its ability for diagnosis, detection and screening of various stages of renal disease [15] or for monitoring industrial processes related to microorganisms [14,16,17] or cells cultures [18-20]. In the latter areas, the initial studies consisted in analyzing the headspace generated by various microorganisms grown on Petri dishes with the E-nose and detecting and identifying microorganisms from the responses of the E-nose treated by chemometrics [21,22]. For instance, Dutta et al. [21] showed that gas sensors efficiently identified six species of bacteria responsible for eye infections and ten clinically important microorganisms were successfully tested and identified by [22] Moens et al. (2006). Gardner et al. [23] successfully predicted the class and growth phase of two potentially pathogenic bacteria by analyzing samples of the cultivation headspace with six Metal Oxide Semiconducting (MOS) gas sensors. A cultivation of Saccharomyces cerevisiae on glucose was monitored on-line (ethanol concentration and course cultivation) by analyzing the cultivation gas effluent with the E-nose [24]. The potential of the E-nose technology was confirmed as well on a production-scale CHO-cell process [18], on the detection of the metabolic burden on a recombinant E. coli strain [16] or bacterial infections in cell cultures [19,20] successfully monitored growth of Methanobacterium formicicum using a MOS and MOSFET (Metal Oxide Semiconducting Field Effect Transistor) E-nose in order to detect disturbances in the microbiological process [25] and to identify two different oenological Saccharomyces cerevisiae strains in alcoholic fermentation [14].
In the other hand, Lactobacillus fermentum is a heterofermentative bacteria [26] producing ethanol in low concentrations (environs 4 g/l). This concentration is enough for being detected by the MOS sensors. This bacteria is able to produce some volatile compounds. Jackson et al. [27] have detected more than 15 volatile compounds in pork loin tissue inoculated with Lactobacillus plantarum and Lactobacillus fermentum where the principal aroma compounds were acetone, sulfurdioxide, dichloride ethane, trichloride methane, benzene and toluene.
The aim of this study was to investigate on-line lactic fermentation with an E-nose equipped with a back-flush gas chromatography removing alcohol and/or water from samples before analyzing.
2. Material and Methods
2.1. Microorganism and Growth Conditions
Lactobacillus fermentum Ogi E1 (I-2028, CNCM, Institut Pasteur) isolated from ogi [26] was used in this study. A simplified yeast extract medium (SYAM), set up to study the physiology of L. fermentum Ogi E1 [28] was used as fermentation medium. For routine cultivation, a modified MRS medium [29] was used with potato soluble starch (Prolabo-Merck eurolab, Lyon, France) as substrate, following the composition given by [30].
2.2. Lactic Fermentation
Fermentations at pH 5.0 with potato soluble starch as substrate were performed at 30˚C in 2 l bioreactors (Inceltech, Toulouse, France) with a 1.5 l working volume. pH was controlled with either NaOH (5N) or HCl (5N). The growth medium was gently stirred (200 rpm) to maintain homogeneity. The bioreactors were inoculated (10% v/v) with 12-hour pre-cultures. To establish anaerobic conditions as recommended by Calderon et al. [28], the fermentation medium was flushed with nitrogen while the medium was cooling just after autoclaving (120˚C, 15 min). Then a slight overpressure of nitrogen was maintained within the reactor during fermentation. Fermentations were run twice.
2.3. Electronic Nose
A commercially available E-nose (FOX 4000, Alpha MOS, France) with eighteen different metal oxide semiconductor gas sensors (MOS) was used. The different sensors were disposed in three temperature-controlled chambers; each chamber included six sensors, a thermometer and a humidity sensor. The sensor arrangement in each chamber is depicted on Table 1. A generator of purified air (Whatman, UK) with a CaCl2 post dehydration column was used to provide clean dry air to the electronic nose system.
The bioreactor headspace gas was continuously pumped with the aid of a membrane compressor (Fisher Bioblock Scientific, France) placed before the sampling loop. Due to the small bioreactor volume, the gas sample was reintroduced in the bioreactor in order to avoid depresssion and volatile compounds losses. Sampling from this gas flow was performed every 30 min through a 6-port automated sampling valve and the sample was introduced in a gas chromatograph (IGC 121C, Intersmat, Belgium) equipped with a Porapak Q column (1 m × 0.32 cm). The samples were then dehydrated and de-alcoholised or dehydrated only by a patented back-flush technique [31]. In this technique three multiway electrovalves were used for automatic injection in the GC, column back-flush and automatic injection in the E-nose.
2.4. Analytical Methods
2.4.1. Ethanol
Ethanol was analyzed on-line by gas chromatography (IGC 121C, Intersmat, Belgium) with a flame ionization detector and a dehydration-dealcoholisation system. The analytical column was a 1 m Porapak Q column operated at 180˚C. Nitrogen served as carrier gas at a flow rate of 18 ml/min. The ethanol calibration was carried out using standard ethanol solutions placed in the bioreactor and analyzed in the gas chromatograph-E-nose system in the operating culture conditions. This calibration was
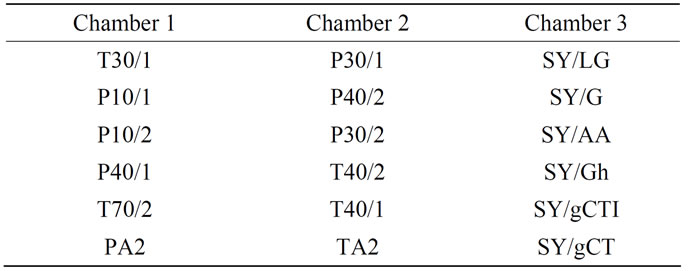
Table 1. Name and arrangement of sensors in the three temperature-controlled chambers of the E-nose.
carried out before each fermentation batch.
2.4.2. Biomass
The determination of cell mass concentration was performed by an optical sensor (653/BT65 model, Wedgewood Technology Inc, CA, USA) measuring medium turbidity. Previously, a calibration curve was carried out in order to transform optic density into biomass concentration (g dry matter/l).This determination was conducted in order to verify a correct performance of the lactic fermentation [28].
2.4.3. Lactate and Ethyl Acetate
These compounds were determined by HPLC using an Aminex HPX-87H column (Biorad, Yvry-sur-Seine, France) as previously described by Calderón et al. [28].
2.5. Data Analysis
The software provided with the E-nose system was used to acquire and store the gas sensor array signals. From each sensor signal, the fractional difference was calculated as shown in equation (1):
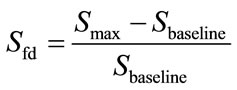 (1)
(1)
Where Sfd corresponds to the modified signal, Smax to the maximum sensor signal value, and Sbaseline to the base line sensor signal value.
Each sensor signal was auto-scaled (i.e. mean-centered and divided by its standard deviation for rescaling with unit variance) to obtain SfdN. The maximum value of SfdN for each sensor was used for PCA to avoid domination of high sensor responses in data processing. Relevant information contained in low sensor responses was thus taken into account in multivariate analysis processing. PCA were carried out with the chemometric toolboxes of the software Matlab 6.5 (the MathWorksInc, MA, USA).
3. Results and Discusion
Ethanol, lactate as well as optical density were monitored (Figure 1) and the results are accorded with those obtained previously Calderon et al, 2001 [28]. A diminution in the growth rate was found after eight hours probably due to the lactate accumulation or substrate starvetion.
3.1. Monitoring of Emissions of Volatile Compounds with Dehydration and Dealcoholisation
Due to the design of the GC-electronic nose, GC-system could be used for the sample dealcoholisation and/or dehydration prior to the measurements with the E-nose. In the second case, it suffices to switch the valve back-
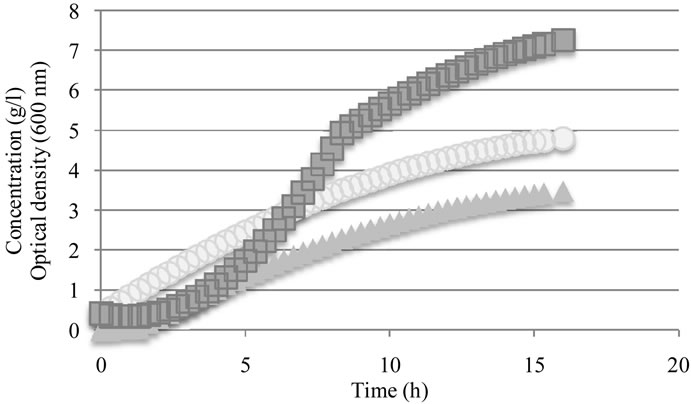
Figure 1. Monitoring of lactic fermentation ( Ethanol (g/L),
  Optical Density (600 nm),
  Lactate /g/L)).
flush immediately after the release of water before the elution of ethyl acetate, about 20 seconds after injecttion.
There is evidence that signals delivered by sensors are low and that in the principal component analyses, all dates are totally overtype and unreadable (results not shown). In our working conditions, after removing alcohol and water, the head-space of bioreactor has not measurable information.
However, some approaches have been done: Signals intensity from sensors increment during the first four hours (Figure 2). The organic volatile compounds concentration is low and during exponential phase the volatile compounds production was stopped. It is important to indicate that this time correspond with the total starch consummation. The starch is a complex matrix able to retain volatile compounds. This non-specific interaction between aroma compounds and polysaccharides were reported as a reduction in aroma compound volatility [32]. Authors have reported that the polysaccharides form a complex with the volatile compounds and their volatileity is decreased. Then it is due a possible interference of starch with the detection of volatile compounds. Firstly it was detected an increase in electronic nose signals according to starch consummation. After total starch consummation, the values of electronic nose signals rested constants. This fact corresponds with the beginning of the exponential phase and to the ethanol production during the fermentation process. The effect of ethanol on the volatility decrease has been reported too. Then, it is possible that the volatility of volatile compounds during this fermentation stage was masked by the ethanol production as demonstrated by Ragazzo-Sanchez et al. [33].
3.2. Monitoring of Emissions of Volatile Compounds with Dehydration Only
Fermentation monitoring with dehydration only was performed with the total volatile compounds produced. Samples were taken in the head-space and only dehydrated previous to electronic nose analysis. Results showed a net production of volatile compounds since the first fermentation hours. Global volatile compounds concentrations become more important after 3 h and until 14 h (Figure 3). After that, signals delivered by the electronic nose rest constants.
The PCA showed a clear evolution of the sensors during the fermentation process (Figure 4). The particular form of this curve is obtained when an electronic nose analyzes different concentrations of volatile compounds. This trend has been obtained during the analysis of reference solutions containing ethanol and ethyl acetate (results not showed). It is possible that principal axis 1 meaning correspond to the variation in ethanol concentration in the fermentation. The meaning for the axis 2 is more difficult to elucidate, but it could be in corresponddence to the variation in the ethyl acetate concentration (even production or monitoring of a re-consummation).
A multilinear regression between sensors responses and ethanol and ethyl acetate concentrations was conducted. The correlation obtained for this variables presented a good regression coefficient of 0.9. The regression coefficient was enhanced to 0.95 after selection of specifics sensors (number 1, 3, 6 and 7).For each group an array is built on the new variables. Unknown samples are projected on the discriminate subspace and compared to each group via the associated array. This method is used to predict quantitative values, based on a calibration curve, and correlated with quantitative variable characteristics of the analyzed sample (Figure 5). The correlation for ethyl acetate is less linear, then a correlation coefficient of 0.7 was obtained and 0.74 after optimization.
The higher variation registered correspond to ethanol concentration. Then, the whole information given by the electronic nose could be related as a direct function of this variable, which is related to other fermentation variables.
In the other hand, some sensors shown a typical trend related to microbial grow and production of metabolites during a fermentation process (figure 3).
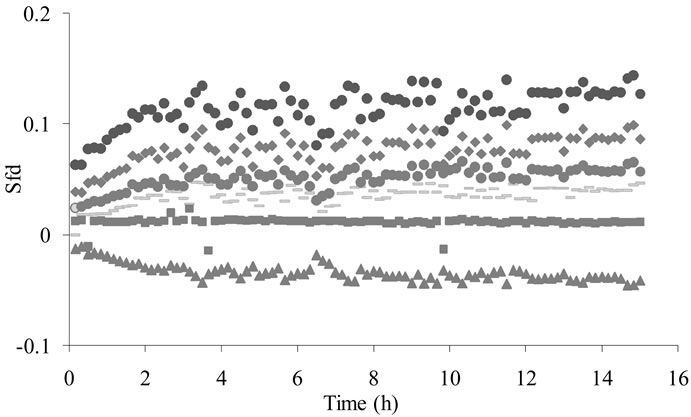
Figure 2. MOS sensors' responses obtained during lactic fermentation after dehydration and alcohol removal ( T30/1,
  P30/1,
  P30/2,
  T40/2,
  T40/1,
  SY/Gh).
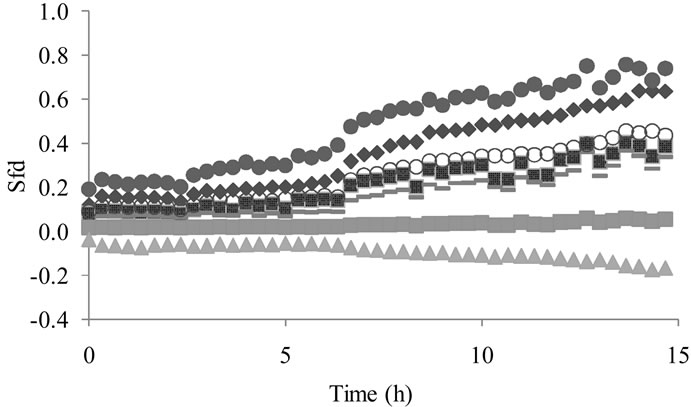
Figure 3. MOS sensors responses to the head-space formed during the lactic fermentation after dehydration ( T30/1,
  P30/1,
  P40/2,
  P30/2,
  T40/2,
  T40/1,
  SY/Gh).
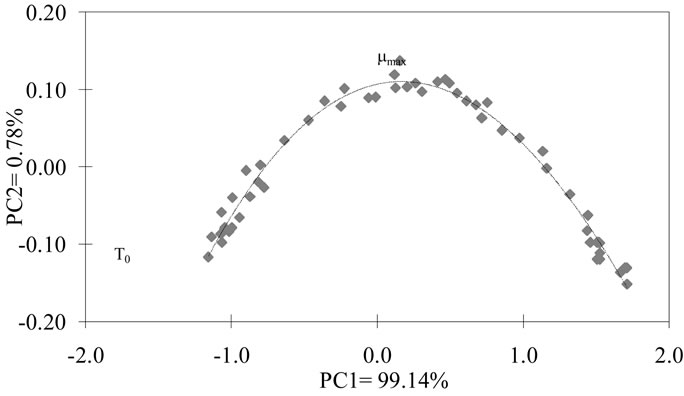
Figure 4. PCA analysis previous dehydration using the maximal level of responses of sensors MOS during the lactic fermentation.
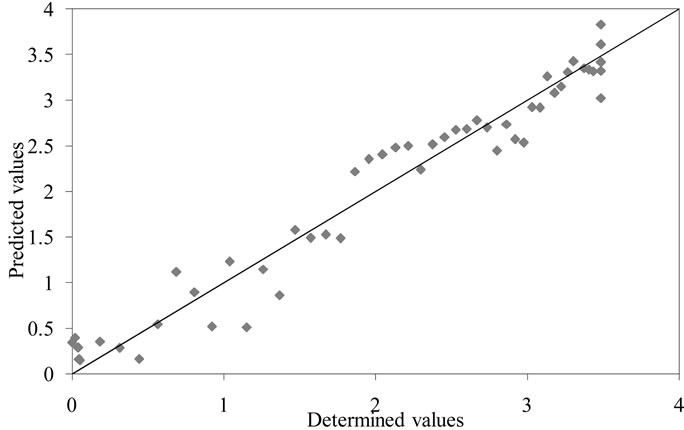
Figure 5. Correlation between ethanol concentrations (g∙L−1) predicted from electronic nose analysis and real concentrations.
Some studies on MOS sensors have shown responses curves that were linear with head-space concentrations [34,35]. However, their non-linearity is documented by the manufacturer [36] and confirmed [37]. Beside, other authors have underlined the difficulty to distinguish between different head-space concentrations of a volatile compound [38,39] with electronic noses. There are few studies in this direction, as presented by Ragazzo et al. [40], who demonstrated the non-linear dependence of the sensor signals up on the volatile compound concentration, by analyzing a series of solutions of a same chemical but at different dilutions. These authors proposed that several sensors were able to predict the concentration of ethyl acetate and hexanol at concentration from 100 and 150 mg/L.
The regression coefficient between the sensor P30/1 and the optical density at 600 nm, ethanol and lactate concentration, with a non-linear function, were 0.95, 0.96 and 0.98 respectively (figure 6), similar approaches were observed with others sensor (Table 2).In the whole cases, when the predictions were possible, the regression coefficient corresponding to microbial grow was lower thanthose corresponding to ethanol and lactate. This could be
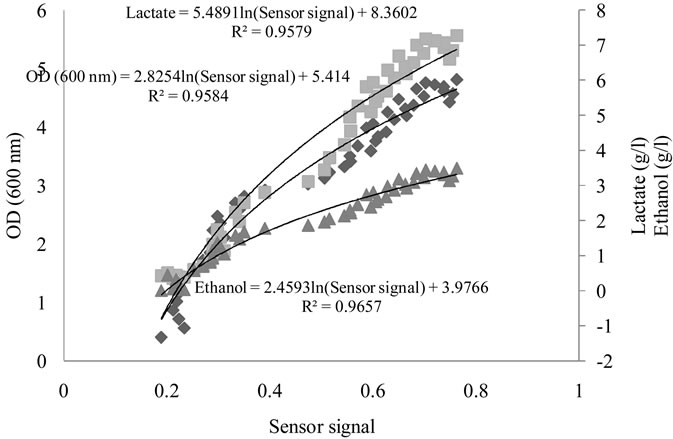
Figure 6. Optical Density (DO) ( ), Lactate (
 ) and Ethanol (
 ) predictions by P30/1 sensor during fermentation process.
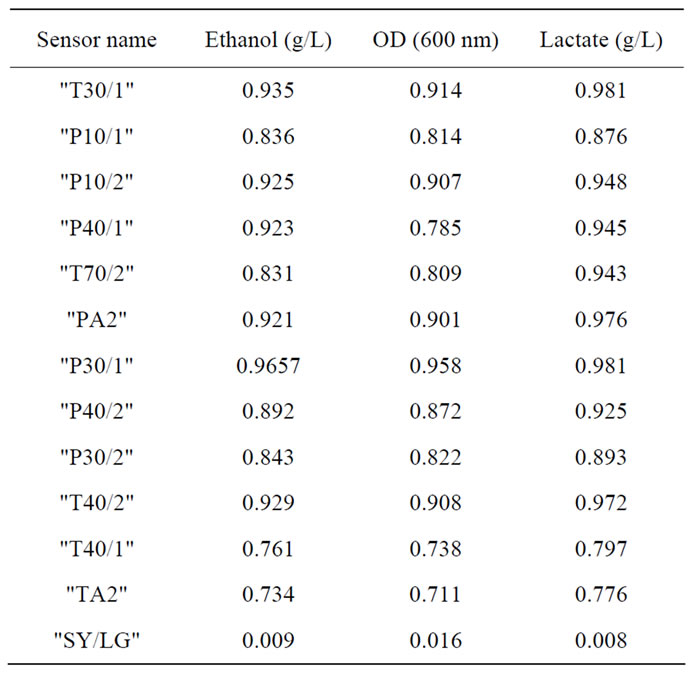
Table 2. Regression coefficient from prediction some products during fermentation process by the MOS.
due to the specific nature of each sensor. In the case of ethanol and lactate sensors are specific to these molecules, but concerning biomass detection, the sensors respond to a global volatile compounds produced by the bacteria.
4. Conclusions
It was possible to monitor the lactic fermentation sampling of the total head-space. The correlation between ethanol concentration and the signal sensors presented a typical curve and it was possible to determine the maximal growth rate.
The prediction capability in addition to the versatility of the computer to be used online, places the electronic nose system coupled to the gas chromatography, in an advantageous position compared to conventional analytical systems.
5. Biographies of Authors
Montserrat Calderon-Santoyo studied biochemistry Engineering at InstitutoTecnológico de Morelia. MCs in Biochemistry Engineering at InstitutoTecnológico de Veracruz. PhD in Food Sciences at the Université des Sciences et Techniques du Languedoc at Montpellier, France with distinction in 2001. Now she is professsor/researcher at Instituto Tecnológico de Tepic. In 2002, she was appointed member of the Mexican National Researchers System (SNI). She teaches at the MSc and PhD in Food Sciences. She is responsible of Food Microbiology laboratory at Laboratorio Integral de Investigación en Alimentos (LIIA).
Pedro Ulises Bautista-Rosales studied Biochemistry Engineering in 2004 and MSc in Food Science in 2007 at Instituto Tecnológico de Tepic. PhD in Use, Management and Preservation of Natural Resources at the Centro de Investigaciones Biológicas del Noroeste at La Paz, Baja California Sur, México with distinction in May 2013.
Guadalupe Luna-Solano studied Chemical Engineering and Foods Science postgraduate at the InstitutoTecnológico de Veracruz and received her PhD in 2003. Two years later, she joined the chemical and biochemical department of the InstitutoTecnólogico de Orizaba of Veracruz as researcher professor, at the same department where she teaches food engineering. In 2006, she was appointed member of the Mexican National Researchers System (SNI). The main focus of her work is the application of drying process (lyophilization, osmotic drying, spray drying, and fluidized bed drying) in the different foods and microorganism as yeast and bacteria.
Charles Ghommidh is professor at the Food Science Department of Polytech Montpellier (France). He received a PhD in Bioengineering at the Institut National des Sciences Appliquées in Toulouse (France) in 1980. His research interests are in Fermentation Technology and Modelling, with a special attention to data acquisition and analysis.
Juan Arturo Ragazzo-Sánchez studied Chemistry Engineering and MCs in Biochemistry Engineering in 1998 at Instituto Tecnológico de Veracruz. PhD in Food Sciences at the Université des Sciences et Techniques du Languedoc at Montpellier, France with distinction in 2001. Now he is professor/researcher at Instituto Tecnológico de Tepic. He teaches at the MSc and PhD in Food Sciences. In 2002, he was appointed member of the Mexican National Researchers System (SNI). He is responsible of Food Engineering laboratory at Laboratorio Integral de Investigación en Alimentos (LIIA).
REFERENCES
- E. R. Thaler and C. W. Hanson, “Medical Applications of Electronic Nose Technology,” Expert Review of Medical Devices, Vol. 2, No. 5, 2005, pp. 559-566.
- A. Rudnitskaya and A. Legin, “Sensor Systems, Electronic Tongues and Electronic Noses, for Monitoring of Biotechnological Processes,” Journal of Industrial Microbiology & Biotechnology, Vol. 35, No. 5, 2008, pp. 443-451.
- M. Peris and L. Escuder-Gilabert, “A 21st Century Technique for Food Control: Electronic Noses,” Analytica Chimica Acta, Vol. 638, No. 1, 2009, pp. 1-15. doi:10.1016/j.aca.2009.02.009
- J. W. Gardner and P. N. Barlett, “A brief history of electronic nose,” Sensors and Actuators B: Chemical, Vol. 46, No. 1, 1994, pp. 211-220.
- H. Yu, Y. Wang and J. Wang, “Identification of Tea Storage Times by Linear Discrimination Analysis and Backpropagation Neural Network Techniques Based on the Eigenvalues of Principal Components Analysis of E-Nose Sensor Signals,” Sensors, Vol. 9, No. 10, 2009, pp. 8073- 8082. doi:10.3390/s91008073
- J. A. Ragazzo-Sanchez, P. Chalier, D. Chevalier, M. Calderon-Santoyo and C. Ghommidh, “Identification of Different Alcoholic Beverages by Electronic Nose Coupled to GC,” Sensors and Actuators B: Chemical, Vol. 134, No. 1, 2008, pp. 43-48. doi:10.1016/j.snb.2008.04.006
- H. Zhang, J. Wang and S. Ye, “Prediction of Soluble Solids Content, Firmness and pH of Pear by Signals of Electronic Nose Sensors,” Analytica Chimica Acta, Vol. 606, No. 1, 2008, pp. 112-118. doi:10.1016/j.aca.2007.11.003
- H. Yu, Y. Wang, H. Xiao and M. Liu, “Quality Grade Identification of Green Tea Using the Eigenvalues of PCA Based on the E-Nose Signals,” Sensors and Actuators B: Chemical, Vol. 140, No. 2, 2009, pp. 378-382. doi:10.1016/j.snb.2009.05.008
- B. Tudu, A. Jana, A. Metla, D. Ghosh, N. Bhattacharyva and R. Bandyopadhyay, “Electronic Nose for Black Tea Quality Evaluation by an Incremental RBF Network,” Sensors and Actuators B: Chemical, Vol. 138, No. 1, 2009, pp. 90-95. doi:10.1016/j.snb.2009.02.025
- H. Zheng and W. Jun, “Electronic Nose and Data Analysis for Detection of Maize Oil Adulteration in Sesame Oil,” Sensors and Actuators B: Chemical, Vol. 119, No. 2, 2006, pp. 449-455.
- H. C. Yu, J. Wang and Y. Xu, “Identification of Adulterated Milk Using Electronic Nose,” Sensors and Materials, Vol. 19, No. 5, 2007, pp. 275-285.
- N. Bhattacharyya, S. Seth, B. Tudu, P. Tamuly, A. Jana, D. Ghosh, R. Bandyopadhyay, M. Bhuyan and S. Sabhapandit, “Detection of Optimum Fermentation Time for Black tea Manufacturing Using Electronic Nose,” Sensors and Actuators B: Chemical, Vol. 122, No. 2, 2007, pp. 627- 634. doi:10.1016/j.snb.2006.07.013
- N. Gutiérrez-Méndez, B. Vallejo-Cordoba, A. F. González-Córdova, G. V. Nevárez-Moorillón and B. RiveraChavira, “Evaluation of Aroma Generation of Lactococcuslactis with an Electronic Nose and Sensory Analysis,” Journal of Dairy Science, Vol. 91, No. 1, 2008, pp. 49-57. doi:10.3168/jds.2007-0193
- M. Calderon-Santoyo, P. Chalier, D. Chevalier-Lucia, C. Ghommidh, J. A. Ragazzo-Sanchez, “Identification of Saccharomyces cerevisiae Strains for Alcoholic Fermentation by Discriminant Factorial Analysis on Electronic nose Signals,” Electronic Journal of Biotechnology, Vol. 13, No. 4, 2010, pp. 1-12.
- H. Haick, M. Hakim, M., Patrascu, Ch. Levenberg, N. Shehada, F. Nakhoul and Z. Abassi, “Sniffing Chronic Renal Failure in Rat Model by an Array of Random Networks of Single-Walled Carbon Nanotubes,” ACS Nano, Vol. 3, No. 5, 2009, pp. 1258-1266. doi:10.1021/nn9001775
- T. Bachinger,C. F. Mandenius,G. Striedner, F. Clementschitsch, E. Dürrschmid, M. Cserjan-Puschmann, O. Doblhoff-Dier and K. Bayer, “Non-Invasive Detection of the Metabolic Burden on Recombinant Microorganisms during Fermentation Processes,” Journal of Chemical Technology and Biotechnology, Vol. 76, No. 1, 2001, pp. 885-889.
- J. J. Clemente, S. M. S. Monteiro, M. J. T. Carrondo and A. E. Cunha, “Predicting Sporulation Events in a Bioreactor Using an Electronic Nose,” Biotechnology and Bioengineering, Vol. 101, No. 3, 2008, pp. 545-552.
- T. Bachinger, U. Riese, R. Eriksson and C. F. Mandenius, “Monitoring Cellular State Transitions in a ProductionScale CHO-Cell Process Using an Electronic Nose,” Journal of Biotechnology, Vol. 76, No. 1, 2000, pp. 61-71. doi:10.1016/S0168-1656(99)00179-0
- T. Bachinger, U. Riese, R. Eriksson and C. F. Mandenius, “Gas Sensor Arrays for Early Detection of Infection in Mammalian Cell Culture,” Biosensors and Bioelectronics, Vol. 17, No. 5, 2002, pp. 395-403.
- K. Kreij, C. F. Mandenius, J. J. Clemente, A. E. Cunha, S. M. S. Monteiro, M. J. T. Carrondo, F. Hesse, M. Molinas, R. Wagner, O. W. Merten, C. Geny-Katinger, P. Martensson, T. Bachinger and J. Mitrovics, “On-Line Detection of Microbial Contaminations in Animal Cell Reactor Cultures Using an Electronic Nose Device,” Cytotechnology, Vol. 48, No. 1-3, 2005, pp. 41-58. doi:10.1007/s10616-005-3587-4
- R. Dutta, E. L. Hines, J. W. Gardner and P. Boilot, “Bacteria Classification Using Cyranose 320 Electronic Nose,” BioMedical Engineering Online, Vol. 1, No. 4, 2002, pp. 1-7. doi:10.1186/1475-925X-1-4
- M. Moens, A. Smet, B. Naudts, J. Verhoeven, M. Ieven, P. Jorens, H. J. Geise and F. Blockhuys, “Fast Identification of Ten Clinically Important Microorganisms Using an Electronic Nose,” Letters in Applied Microbiology, Vol. 42, No. 2, 2006, pp. 121-126. doi:10.1111/j.1472-765X.2005.01822.x
- J. W. Gardner, M. Craven, C. Dow and E. L. Hines, “The Prediction of Bacteria Type and Culture Growth Phase by an Electronic Nose with a Multi-Layer Perceptron Network,” Measurement Science and Technology, Vol. 9, No. 1, 1998, pp. 120-127. doi:10.1088/0957-0233/9/1/016
- H. Liden, T. Bachinger, L.Gorton and C. F. Mandenius, “On-Line Determination of Non-Volatile or Low-Concentration Metabolites in a Yeast Cultivation Using an Electronic Nose,” Analyst, Vol. 125, No. 6, 2000, pp. 1123-1128. doi:10.1039/a909585c
- J. Brandgård, I. Sundh, A. Nordberg, A. Schnürer, C. F. Mandenius and B. Mathisen, “Monitoring Growth of the Methanogenic Archaea Methanobacterium formicicum Using an Electronic Nose,” Biotechnology Letters, Vol. 23, No. 4, 2001 pp. 241-248. doi:10.1023/A:1005643606640
- V. Agati, J. P. Guyot, J. Morlon-Guyot, P. Talamond and D. J. Hounhouigan, “Isolation and Characterization of New Amylolytic Strains of Lactobacillus fermentum from Fermented Maize Doughs (mawè and ogi) from Benin,” Journal of Applied Microbiology, Vol. 85, No. 1, 1998, pp. 512-520. doi:10.1046/j.1365-2672.1998.853527.x
- T. C. Jackson, G. R. Acuff, T. R. Sharp and J. W. Savell, “Volatile Compounds on Sterile Pork Loin Tissue Inoculated with Lactobacillus plantarum and Lactobacillus fermentum,” Journal of Food Science, Vol. 57, No. 1, 1992, pp. 783-784. doi:10.1111/j.1365-2621.1992.tb08098.x
- M. Calderon, G. Loiseau and J. P. Guyot, “Nutritional Requirements and Simplified Cultivation Medium to Study Growth and Energetics of a Sourdough Lactic Acid Bacterium Lactobacillus fermentum Ogi E1 during Heterolactic Fermentation of Starch,” Journal of Applied Microbiology, Vol. 90, No. 1, 2001, pp. 508-516. doi:10.1046/j.1365-2672.2001.01272.x
- J. C. DeMan, M. Rogosa and M. E. Sharpe, “A Medium for the Cultivation of Lactobacilli,” Journal of Applied Bacteriology, Vol. 23, No. 1, 1960, pp. 130-135. doi:10.1111/j.1365-2672.1960.tb00188.x
- J. P. GuyotandMorlon-Guyot, “Effect of Different Cultivation Conditions on Lactobacillus manihotivorans OND32T, an Amylolytic Lactobacillus Isolated from Sour Starch Cassava Fermentation,” International Journal of Food Microbiology, Vol. 67, No. 3, 2001, pp. 217-225.
- J. A. Ragazzo-Sánchez, P. Baldet, C. Ghommidh, P. Chalier, A. Deratani, J. C. Boulet, P. Grenier, M. Persin, J. Crouzet, E. Chanié and A. Perrain, “Sampler of Volatile Components,” European Patent No. 02291627.4, 2004.
- S. Langourieux and J. Crouzet, “Study of Aroma Compounds-Polysaccharides Interactions by Dynamic Exponential Dilution,” Lebensmittel-Wissenschaft & Technologie, Vol. 27, No. 6, 1994, pp. 544-549.
- J. A. Ragazzo-Sánchez, P. Chalier and C. Ghommidh, “Coupling Gas Chromatography and Electronic Nose for Dehydration and Desalcoholization of Alcoholized Beverages: Application to Off-Flavour Detection in Wine,” Sensors and Actuators B: Chemical, Vol. 106, No. 1, 2005, pp. 253-257. doi:10.1016/j.snb.2004.08.006
- L. Carmel, N. Sever, D. Lancet and D. Harel, “An Enosealgortithm for Identifying Chemicals and Determining Their Concentration,” Sensors and Actuators B: Chemical, Vol. 93, No. 1-3, 2003, pp. 77-83. doi:10.1016/S0925-4005(03)00246-6
- B. P. J. De lacy Costello, R. J. Ewen, J. Guernion and N. Ratcliffe, “Highly Sensitive Mixed Oxide Sensors for the Detection of Ethanol,” Sensors and Actuators B: Chemical, Vol. 873, No. 1, 2002, pp. 207-210.
- 2013. www.figasensor.com.
- P. Mielle and F. Marquis, “Gas Sensors Errays (‘Electronic Noses’): A Study about the Speed/Accuracy Ratio,” Sensors and Actuators B: Chemical, Vol. 68, No. 3 2000, pp. 9-16.
- S. A. Miettinen, H. Tuorila, V. Piironen, K. Vehkalahti and L. Hyvönen, “Effect of Emulsion Characteristics on Release of Aroma as Detected Sensory Evaluation, Static Headspace Gas Chromatography and Electronic Nose,” Journal of Agricultural and Food Chemistry, Vol. 50, No. 15, 2002, pp. 4232-4239. doi:10.1021/jf0107205
- A. Branca, P. Simonian, M. Ferrante, E. Novas and M. R. Negri, “Electronic Nose Based Discrimination of a Perfumery Compound in a Fragrance,” Sensors and Actuators B: Chemical, Vol. 92, No. 1-2, 2003, pp. 222-227. doi:10.1016/S0925-4005(03)00270-3
- J. A. Ragazzo-Sanchez, P. Chalier, D. Chevalier-Lucia and C. Ghommidh, “Electronic Nose Discrimination of Aroma Compounds in Alcoholised Solutions,” Sensors and Actuators B: Chemical, Vol. 114, No. 2, 2006, pp. 665-673. doi:10.1016/j.snb.2005.05.032
NOTES
*Corresponding author.