Engineering
Vol. 5 No. 1 (2013) , Article ID: 26393 , 8 pages DOI:10.4236/eng.2013.51002
Elimination of Oil Residual inside the Copper Pipe Using Ladder Technique
Department of Intelligent Mechanical Engineering, Faculty of Engineering, Fukuoka Institute of Technology, Fukuoka, Japan
Email: kswitsar@kmitl.ac.th, murayama@fit.ac.jp
Received October 31, 2012; revised November 29, 2012; accepted December 11, 2012
Keywords: Copper Pipe; Ladder; Oil; Purging; Pressure; Residual; PPLM; SPLM
ABSTRACT
This study presents the methodology to eliminate oil residual in copper pipe due to rolling process for manufacturing coil used in air conditioner. The pressure caused by Nitrogen flow rate was applied starting from 0, 5, 10, and 15 bar, respectively which was depending on time delay and pipe length. The developed system was divided into 2 modules: Parallel pressure ladder module (PPLM) [1] and Serial pressure ladder module (SPLM) which were experimented with 2 sizes of copper pipe: diameter 7.29 mm, thickness 0.25 mm, and length 10 km, and diameter 8 mm, thickness 0.25 mm, and length 10 km. From experiment, it can be noted that PPLM would perform better in elimination of oil residual compared to SPLM. About 97.44% (0.04 mg/m) and 97.59% (0.05 mg/m) of oil residual can be respectively eliminated from diameter 7.29 mm pipe and diameter 8 mm pipe which exceeded the standard allowance of 30% or 0.1 mg/m. Moreover, the cost of Nitrogen can be reduced by 6.25% per month.
1. Introduction
In copper pipe manufacturing process, oil residual would significantly remain in the pipe that may lead to the further applications of copper pipe such as difficulty in welding pipe, corrosion and leakage [2]. Oil residual is caused by manufacturing process after melting and rolling. Every process may need oil lubricant as the major component of any process. However, the quality audit of copper pipe from rolling process needs to inspect not only proper pipe size and no leakage but also oil residual inside the pipe to be minimized by not exceeding 0.1 mg/m. This study proposes the methodology to eliminate oil residual inside the pipe as well as the database management system which can collect the data in real time for further data analysis.
2. Fundamental Method
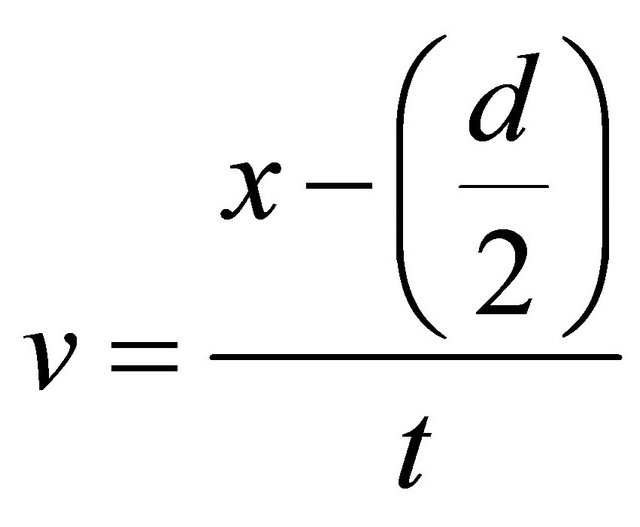
This study used Nitrogen in different pressure levels to purge out oil residual from copper pipe. It is also necessary to maintain the pressure by considering flow rate of Nitrogen simultaneously based on the size and the length of copper pipe after ironing process as shown in Figure 1. Physical characteristic of copper roll illustrated in Figure 2 can be used to indicate the velocity (v) of Nitrogen supplied to copper pipe as given in Equation (1).
 (1)
(1)
where x is the length of Nitrogen flowing in horizontal direction (m);
d is the diameter of pipe (m);
t is the flowing time of Nitrogen (s).
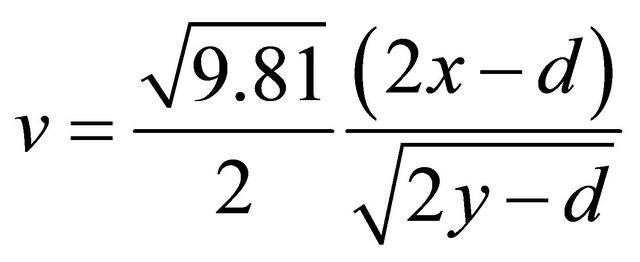
The length of vertical drop due to Nitrogen flowing through the pipe can be calculated by Equation (2) where 9.81 is the earth’s gravity (g) [3].
 (2)
(2)
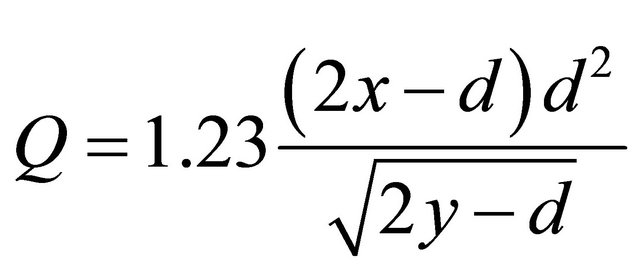
Design of oil residual purging system after ironing process should consider the appropriate quantity of Nitrogen supplied as well as the size of copper pipe in order to obtain the optimum capacity and to estimate the cost of Nitrogen to be used in each month. These can be calculated by analyzing flow rate of Nitrogen supplied as shown in Equations (3) and (4), respectively.
 (3)
(3)
 (4)
(4)
where Q is the flow rate of Nitrogen (l/min).
 (a)
(a)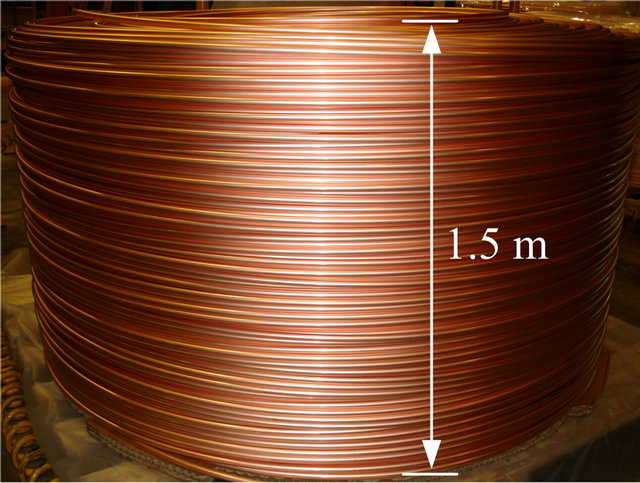 (b)
(b)
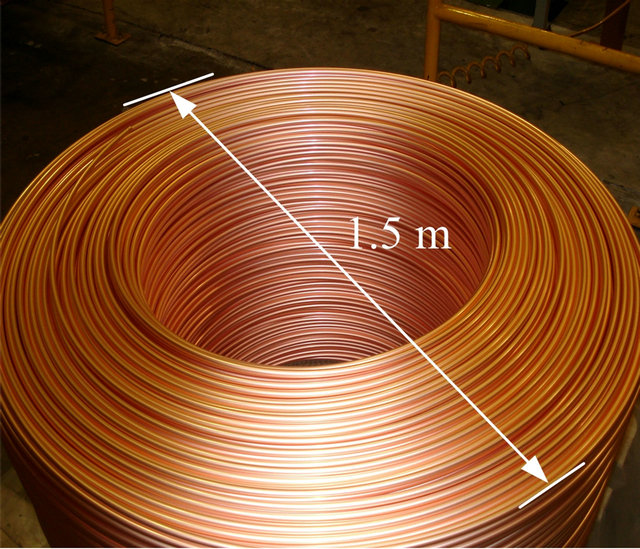
Figure 1. Copper roll after ironing process. (a) Top view; (b) Side view.

Figure 2. Physical characteristic of pipe.
A is the cross section area of copper pipe (m2).
The velocity of Nitrogen through pipe f 7.29 mm and pipe f 8 mm can be calculated by using Equation (3) where x = 1.5 m, y = 1.5 m. Therefore, the velocity of Nitrogen through pipe f 7.29 mm = 0.2436 m/s, which through pipe f 8 mm = 0.2496 m/s, and the average velocity of Nitrogen (vavg) through both pipes is 0.2466 m/s. From Equation (4), flow rates of Nitrogen through pipe f 7.29 mm and pipe f 8 mm are 0.0461 l/min.
3. Design of the Ladder System
Design of oil residual purging system was applied the ladder technique which was dependent on the flow rate of Nitrogen. This study was separated into two systems: the parallel pressure ladder module (PPLM) and the serial pressure ladder module (SPLM) which was performed by using the same methodology. The experiment was used two sizes of copper pipe f 7.29 mm and f 8 mm, thickness of 0.25 mm and length of 10 km. The system developed was divided the pressure levels into 3 ranges regarding to the flow rate of Nitrogen and the appropriate delay time which was a function of copper pipe length. The initial range of the Nitrogen was maintained at the specific pressure (5 bar), supplied to copper pipe, and then delayed for 5 minutes for the pipe length of 0 to 500 m. The second range was 10 bar Nitrogen which was fed through copper pipe and delayed for 10 minutes for the pipe length of 500 m to 1000 m. The third range was 15 bar of Nitrogen supplied through the copper pipe length of 1000 m to 10,000 m and then delayed for 90 minutes. All processes would be taken about 105 minutes for 1 copper roll (10 km of pipe length). The previous studies on flow rate and Nitrogen pressure control have been proposed by using several methodologies such as a control procedure for eliminating the mal flow rate distribution of evaporating flow in parallel pipes, monitoring and control of gas flow rate in a Pyrocarbon coating furnace for heart valves, a novel method of using a control valve for measurement and control of flow and cavitation flow instability of subcooled liquid Nitrogen in converging diverging nozzles [4-7].
3.1. Parallel Pressure Ladder Module (PPLM)
Parallel ladder system aims to regulate the Nitrogen flow rate by using parallel pressure supplying method for purging oil residual inside the pipe after manufacturing processes. This system consists of a control module which is a PLC controller to switch 3 sets of control valves on and off at low pressure (5 bar), normal pressure (10 bar), and high pressure (15 bar) as shown in Figure 3.
From Figure 3, the pressure control regarding to Nitrogen flowing through the pipe with each on-off valve controller are under the specific conditions. The pressure was uniformly increased from 0 to 5 bar, 5 to 10 bar, and 10 to 15 bar in 3.29 seconds for each single step.
The procedure is started by releasing Nitrogen though the system via a 3/4 inch solenoid valve at the specific pressure (40 bar), and using valve V4, V5 and V6 to regulate pressure levels supplied to copper roll. Valve V4, valve V5, and valve V6 were for controlling pressure level of 5 bar, 10 bar, and 15 bar, respectively. After finishing the last procedure, oil residual inside the pipe was measured and recorded by using database program via data logger. Figure 4 shows three sets of control valves in control module used in this study.
3.2. Serial Pressure Ladder Module (SPLM)
The Serial pressure ladder module (SPLM) system was used in order to regulate the Nitrogen flow rate by using
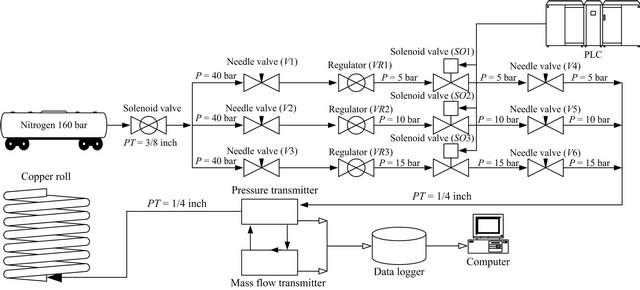
Figure 3. Diagram of parallel pressure ladder module (PPLM).

Figure 4. Pressure control system for industrial factory.
serial pressure supplying method to purge oil residual inside the pipe after manufacturing processes. The experiment of SPLM was performed similarly to PPLM. In case of SPLM, the system aims to regulate the Nitrogen flow rate by using serial pressure supplying method to purge oil residual inside the pipe after manufacturing processes. Only one set of regulator valve (VR1) and solenoid valve (SO1) were used for adjusting pressure levels into the system. The initial length (from 0 to 500 m) was supplied the pressure of 5 bar Nitrogen, fed through copper pipe, and then delayed for 5 minutes. After that, the 10 bar Nitrogen was then fed through copper pipe with the length of 500 m to 1000 m and delayed for 10 minutes. The final range was for the pipe with the length of 1000 m to 10,000 m. Nitrogen with the pressure of 15 bar was supplied through copper pipe and then delayed for 90 minutes (as shown in Figure 5). All processes would be taken about 105 minutes for 1 copper roll (10 km of pipe length) which was similar to the experiments of PPLM system.
4. Monitoring System
Experimental results from both systems developed were converted from pressure value to voltage (P to V) by using the pressure transmitter [8]. The data were sent to a computer for analyzing and processing through LabVIEW software [9]. Figure 6 illustrates the rate of Nitrogen use in each range. The horizontal direction of graph is the period time of experiment (min) and the vertical direction of graph is Nitrogen use (l/min). In this graph, “point A” is the range of 0 to 500 m, “point B” is the range of 500 m to 1000 m and “point C” is the range of 1000 m to 10,000 m. Figure 7 shows the pressure level control and the period time to delay Nitrogen supplied through copper pipe per one copper roll (10 km of pipe length).
5. Experimental Condition
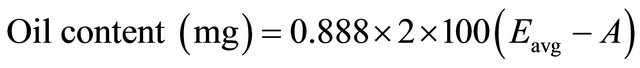
Reliability and efficiency of the system can be analyzed from experiments and data of oil residual inside the pipe. Comparison and analysis of collected data were conducted by using oil content analyzer (HORIBA model OCMA-20) for the range of 5 to 20 PPM. Experiments were performed 20 times for each size of copper pipe with the length of 1 m as shown in Equation (5).
 (5)
(5)
Therefore, A can be calculated by Equation (6).
 (6)
(6)
where Eavg is mean value of experiments.
do is the outer diameter of pipe (mm).
5.1. Experiment and Analysis of PPLM
Experiment using PPLM system for purging oil residual inside the copper pipe was performed with f 7.29 mm pipe. To evaluate the precision of the system developed, repeatability analysis was also carried out by repeatedly

Figure 5. Diagram of serial pressure ladder module (SPLM).
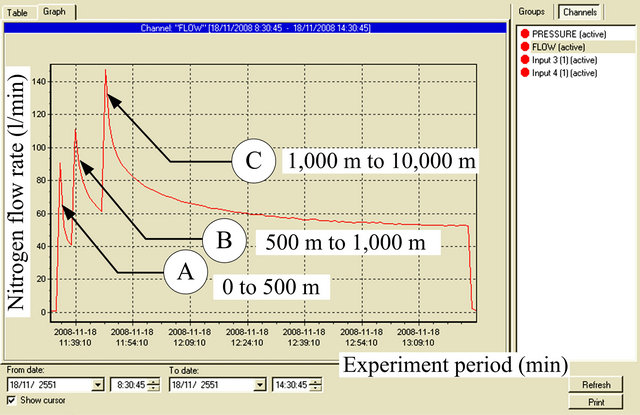
Figure 6. Nitrogen flow rate monitoring system.
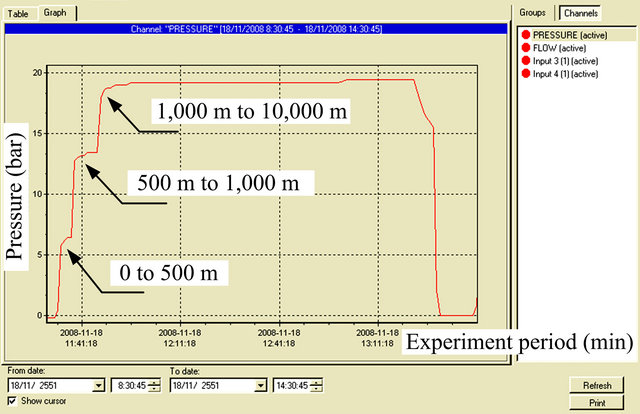
Figure 7. Pressure levels control and period time to delay.
experimented with 20 rolls of copper pipe at the pressure levels of 5 bar, 10 bar, and 15 bar. Each roll of copper pipe would contain oil residual about 1.58 mg/m in average after ironing process. From experiment, the amount of oil residual inside copper pipe after using the PPLM system was reduced to 0.04 mg/m or 2.56% on average.
Therefore, the PPLM can eliminate oil residual from copper pipe about 1.54 mg/m or 97.44% on average.
Considering an amount of oil residual from 20 rolls of the f 7.29 mm copper pipe, it can be noted that the difference between the minimum and maximum of oil quantity remaining inside the copper pipe was approximately ±2.9%. After ironing process, the oil remaining inside of each roll copper was uneven as shown in Figure 8.
Figure 9 shows the experimental results using PPLM system with a standard copper pipe (f 8 mm). Repetitive measurements were also carried out with 20 rolls of copper pipe to estimate the precision and repeatability of the system developed each roll of copper pipe normally contains oil residual inside after ironing process approximately 1.95 mg/m on average. From experiment, an amount of oil residual inside the copper pipe after using the PPLM system was reduced to 0.05 mg/m or 2.41% on average. Therefore, the PPLM can purge oil residual out from copper pipe by approximately 1.90 mg/m or 97.59%. Considering an amount of residual oil remaining inside the roll copper, it can be noted that the difference between the minimum and maximum amount of oil remaining inside the roll copper was about ±3.32%.
Efficiency analysis for evaluating appropriate pressure exploitation was performed by specifying the initial pressure level to be supplied through the copper pipe at 5 bar and then increasing 2 bar interval until reaching 15 bar. For every step of pressure level tested, there were 3 repeated experiments as shown in Table 1 which was similar to the experiments of pipe f 8 mm. The data recorded consists of oil residual before test, oil residual after test, percentage of oil residual, oil drain, and percentage of oil drain. Data of oil residual in pipe f 7.29 mm and pipe f 8 mm can be plotted by graphs shown in Figure 10 and Figure 11, respectively.
Table 1. Pressure experiment of pipe f 8.00 mm.

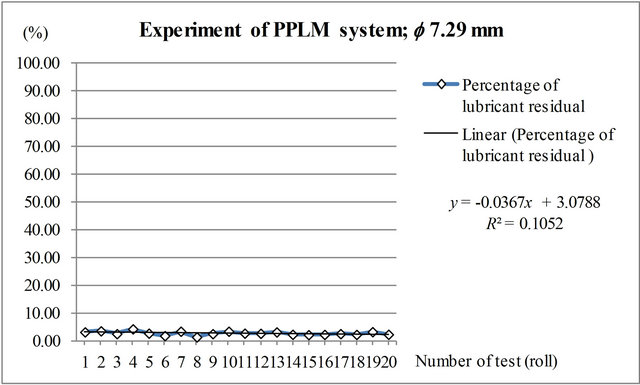
Figure 8. Oil residual in f 7.29 mm copper pipe using PPLM.
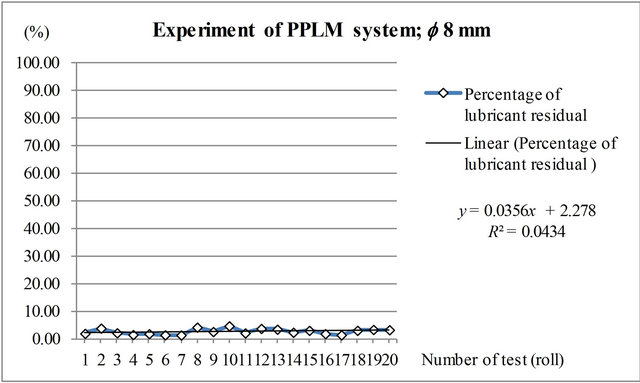
Figure 9. Oil residual in f 8 mm copper pipe using PPLM.

Figure 10. A appropriate pressure testing, f 7.29 mm.
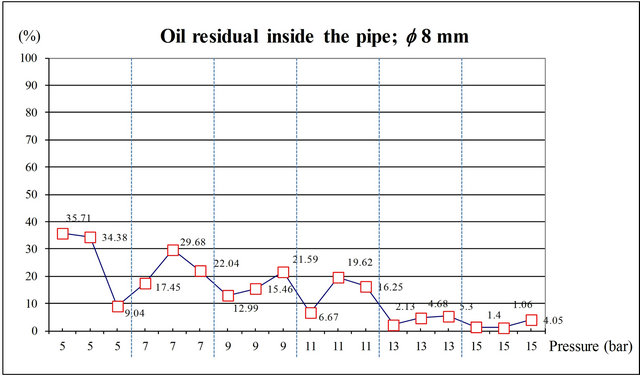
Figure 11. A appropriate pressure testing, f 8 mm.
5.2. Experiment and Analysis of SPLM
Experiment using SPLM system to purge oil residual inside the f 7.29 mm copper pipe was performed by repeatedly measuring the results from 20 rolls of copper pipe. Precision and repeatability of the system developed were then estimated. Each roll of copper pipe would contain oil residual after ironing process approximately 1.13 mg/m on average. From experiment, an amount of oil residual inside copper pipe after using SPLM system was reduced to 0.29 mg/m or 25.23% on average.
Therefore, the system developed can purge oil residual out from copper pipe by 0.85 mg/m or 74.77% on average. Considering an amount of oil residual remaining inside the roll copper, it can be noted that the difference between the minimum and maximum amount of oil remaining inside the rolls of copper pipe was approxi- mately ±10.09% as shown in Figure 12.
Figure 13 shows the experimental results of oil remaining inside the f 8 mm copper pipe using SPLM system. Repetitive measurements were also carried out with 20 rolls of copper pipe similarly to a case of f 7.29 mm copper pipe. Each roll would contain oil residual inside the pipe after ironing process by 1.55 mg/m on average. From experiment, an amount of oil residual inside copper pipe using SPLM system was reduced to 0.38 mg/m or 24.79% on average. Therefore, the SPLM system can purge oil residual out from copper pipe approximately

Figure 12. Oil residual in f 7.29 mm copper pipe using SPLM.
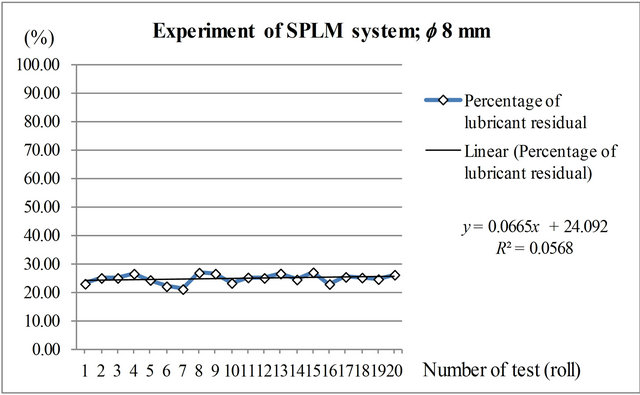
Figure 13. Oil residual in f 8 mm copper pipe using SPLM.
1.17 mg/m or 75.24% on average. Considering an amount of oil remaining inside a copper pipe, it can be noted that the difference between the minimum and maximum amount of oil remaining was approximately ±5.9%. It can also be comparing between PPLM and SPLM system as shown in Figures 14 and 15.
Table 2 shows the average value of oil residue inside copper pipe per diameter of pipe before and after testing in 20 rolls of copper pipe. The data recorded were oil residual before test (mg/m), oil residual after test (mg/m), percentage of oil residual (%), oil drain (mg/m), and percentage of oil drain (%).
From experimental study, accuracy, precision, and reliability were analyzed by considering the mean value and standard deviation (STD) as well as minimum and maximum amount of oil residue inside the copper pipe after finished purging process (PPLM and SPLM system) as shown in Table 3 [10].
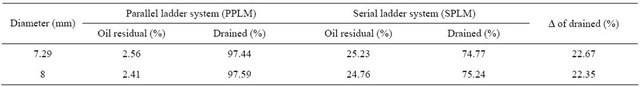
Comparing the experimental results from two systems developed, it can be observed that the efficiency in purging oil residue inside the copper pipe of PPLM system was higher than that of the SPLM system which was 22.67% for pipe f 7.29 mm and 22.35% for pipe f 8 mm, as shown in Table 4.
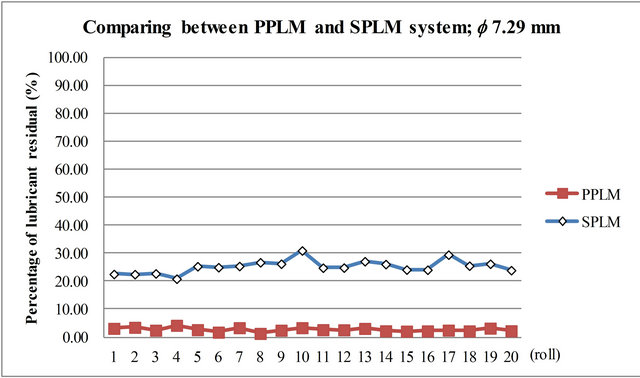
Figure 14. Oil residual in f 7.29 mm copper pipe were compared between using PPLM and SPLM system.

Figure 15. Oil residual in f 8 mm copper pipe were compared between using PPLM and SPLM system.
Table 2. Repeatability analysis of copper pipe f 7.29 mm and f 8 mm.
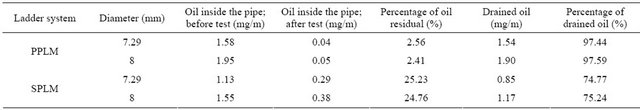
Table 3. Mean, standard deviation and minimum - maximum; after test.

Table 4. Comparison of an efficiency to purging oil between PPLM and SPLM system.
6. Conclusion
Elimination of oil residual inside copper pipe by using ladder pressure technique should be concerned about the appropriate pressure level of Nitrogen for any pipe size and delay time to be remained pressure inside the pipe which depends on the pipe length. It is because the excessive pressure and delay time would increase Nitrogen cost and also damage by bulging or deforming the copper pipe. On the other hand, if the pressure is too low, the quantity of oil residual would exceed the standard level (30% or less than 0.1 mg/m). From measurement of oil residual from several pressure levels, it can be observed that the proper pressure ladder levels for the very long pipe (10,000 m) were 5 bar, 10 bar, and 15 bar. Consuming rates of Nitrogen for PPLM and SPLM were 122.7 l/min and 132.5 l/min, respectively. Therefore, PPLM module for eliminating oil residual inside the pipe is effective and can lower the cost of Nitrogen by 6.25% per month.
REFERENCES
- W. Sriratana, N. Tammarugwattana, S. Ganmanee and L. Tanachaikhan, “Application of Parallel Ladder Technique for Purging Oil Residual inside the Copper Pipe,” IEEE 3rd International Conference on Communication Software and Networks, Xi’an, 27-29 May 2011, pp. 72-75.
- C. Chaiyachit, S. Satthamsakul, W. Sriratana and T. Suesut, “Hall Effect Sensor for Measuring Metal Particles in Lubricant,” International Multi Conference of Engineers and Computer Scientists, Hong Kong, 14-16 March 2012, pp. 894-897.
- E. O. Doebelin, “Measurement System: Application and Design,” 5th Edition, International Edition, Singapore City, 2003, pp. 578-672.
- Y. Taitel, U. Minzer and D. Barnea, “A Control Procedure for the Elimination of Mal Flow Rate Distribution in Evaporating Flow in Parallel Pipes,” Solar Energy, Vol. 82, No. 4, 2008, pp. 329-335. doi:10.1016/j.solener.2007.09.005
- J. H. Z. and X. Chen, “Monitoring and Control of Gas Flow Rate in a Pyrocarbon Coating Furnace for Heart Valves,” International Conference on Consumer Electronics, Communications and Networks, Xianning, 16-18 April 2011, pp. 4189-4193.
- M. A. Atmanand and M. S. Konnur, “A Novel Method of Using a Control Valve for Measurement and Control of Flow,” IEEE Transactions on Instrumentation and Measurement, Vol. 48, No. 6, 1999, pp. 1224-1226. doi:10.1109/19.816140
- K. Ohira, T. Nakayama and T. Nagai, “Cavitation Flow Instability of Subcooled Liquid Nitrogen in Converging-Diverging Nozzles,” Cryogenics, Vol. 52, No. 1, 2012, pp. 35-44. doi:10.1016/j.cryogenics.2011.11.001
- P. F. Dunn, “Measurement and Data Analysis for Engineering and Science,” McGraw-Hill International Edition, New York, 2005, pp. 144-158.
- National Instruments Corporation, “LabVIEW User Manual,” National Instruments Corporation, Texas, 2003.
- United Kingdom Accreditation Service, “The Expression of Uncertainty and Confidence in Measurement,” United Kingdom Accreditation Service, London, 1997.