Materials Sciences and Applications
Vol. 3 No. 5 (2012) , Article ID: 19185 , 7 pages DOI:10.4236/msa.2012.35039
Photoelectrochemical and Spectroscopic Studies of Colloidal Nano-Particles of Mixed TiO2/V2O5 Metal-Oxide Semiconductors
![]()
1Department of Science, Mathematics, and Informatics, School of Art and science, Indiana University Kokomo, Kokomo, USA; 2Rose Hulman Institute of Technology, Terre Haute, USA.
Email: *kkasem@iuk.edu
Received February 3rd, 2012; revised March 9th, 2012; accepted April 15th, 2012
Keywords: TiO2/V2O5; nanoparticles; semiconductors; photolysis; hydrogen production
ABSTRACT
Due to its importance in hydrogen production during the photolysis process of aqueous suspensions process, mixed TiO2/V2O5 metal-oxide semiconductors were prepared and subjected to crystal structure investigation using X-ray technique. The photoelectrochemical behavior of these TiO2/V2O5 was investigated by photolysis of aqueous suspensions of these oxides containing [Fe(CN)6]4−. X-ray diffraction analysis indicated that the TiO2 crystallites grow in the (1 0 1) direction, while The V2O5 crystallites seem to be growing in the (4 2 0) direction, with increasing concentration of V2O5. Photolysis studies show that photochemical activities that maintained the [Fe(CN)6]4−/[Fe(CN)6]3− redox reversibility increased by increasing V2O5 up to 50% and then decreased at greater percentages. Aqueous nano systems used in these studies retained their stability as indicated by the reproducibility of their photo-catalytic activities.
1. Introduction
Water as an abundant source of hydrogen has been a focus of interest of green energy researchers. Photo-dissociation of water into hydrogen and oxygen using powder suspensions of some semiconductors was recently reported by several researchers [1-8]. Most of the studies on the photo-dissociation of water were done over compact semiconductor electrodes. Colloidal semiconductors were used because of their larger surface area and their ability to carry out all reactions that were previously associated with massive semiconductor electrodes. In some systems, platinized semiconductors powders such as TiO2 were used for simultaneous production of oxygen and hydrogen. Several methods were used to generate ordered assemblies of narrow band gap semiconductor nanostructures for harvesting visible-light energy. In most of these methods, one material with a specific band gap is being produced. Some studies, performed on metal chalcogenides such as sulfides, selenides, tellurides [9-16], reported low conversion efficiencies. The photocurrent obtained using such nano-particle assemblies is often low because fast charge recombination limits photocurrent and consequently hydrogen generation.
Hydrated electrons ( ) can play an important role in the photodissociation of water through this reaction:
 (1)
(1)
This reaction proceeds with a rate k ≈ 1 × 10¹⁰ M−1·sec−1 [17]. The molecular orbital structure of hexacyanoiron(II) or [Fe(CN)6]4− allows electronic transition under the photo excitation condition and the reaction produces hydrated electrons according to the following equation:
 (2)
(2)
The oxidation process compromises the reported high rate. The disadvantage of a homogeneous process for hydrogen production is its irreversibility. However, thisdisadvantage can be overcome through the use of a semiconductor system which acts as an electron donor and reduces [Fe(CN)6]3− back to [Fe(CN)6]4−. Achieving such a goal will create the conditions of reversible ergodynamics. The conditions could be reached if the rate of reduction of [Fe(CN)6]3− could be equated to the rate of formation of hydrated electrons from [Fe(CN)6]4−.
p-Type semiconductors particles can be used for the heterogeneous reduction of hydrogen ions to generate hydrogen if a suitable hole-scavenger is present in the suspension media. With the high rate of photo-generation of hydrated electrons in homogenous solutions, it is possible that hydrogen can be generated heterogeneously and homogeneously by the photolysis of colloidal particles suspended in Ferro-cyanide solutions at room temperature.
In this paper, we highlight the preparation of TiO2/ V2O5 and the effects that the percentage of V2O5 may cause on the growth and orientation of each oxide in their common crystal structure and on the rate of hydrogen production during the photolysis process using visible light photons. The possibility of using these systems in a solar energy-based photolysis cell that achieve the goal of reversible, cyclic, and efficient process for hydrogen production is explored.
2. Experimental
2.1. Reagents
All reagents were of analytical grade. Titanium Oxide TiO2 doped with V2O5 was prepared as described elsewhere [18] using NaVO3 and TiCl3 as starting materials.
2.2. Instrumentation
A BAS 100W electrochemical analyzer (Bioanalytical Co.) was used to perform the electrochemical studies. Steady state reflectance spectroscopy was performed using a Shimadzu UV-2101 PC. An Olympus BXFLA60 reflected light.
2.3. X-Ray Studies
X-ray diffraction studies were carried out on a Bruker AXS D8 Focus X-ray diffraction machine. The basic principle of operation relies on Bragg diffraction. The setup utilizes X-rays from a copper target that have their main intensity at 154.2 pm. This average wavelength actually has two contributions; the dominant contribution is from Copper Kα1 (l = 154.06 pm) and a secondary contribution from Copper Kα2 (l = 154.44 pm). Bragg diffraction is modeled by the following expression:
 (3)
(3)
Here n is the diffraction order (n = 1 for our analysis), l is the x-ray wavelength, d is the distance between scattering planes, and q is the angle of diffraction. The diffraction data are in the form of intensities versus scattering angles. Strong peaks correspond to constructive interference between certain scattering planes, and allow for the evaluation of the distance between the scattering planes and their orientation. The scattering angle (2q) was varied from 10˚ to 90˚ with a resolution of 0.02˚. The resulting signal was integrated long enough to provide clear unambiguous peaks. Once the peaks are identified as resulting from a certain constituent (TiO2 or V2O5), they are fitted to a Gaussian curve with the help of mathematical analysis software such as Maple. This curve fitting yields the full width at half maximum (FWHM) which is then used to find the Diffracting Crystallite Size (DCS), t, (in angstroms) with the help of the following expression [19].
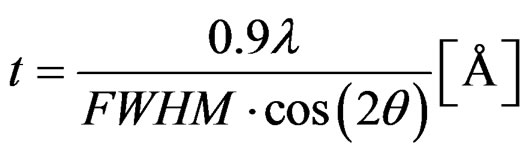 (4)
(4)
This in turn can reveal information about growth trends of certain crystallites (orientations) with increasing concentration of various constituents.
2.4. Photolysis Cell
The electrolysis cell was 100 mL one compartment a Pyrex cell with a quartz window facing the irradiation source. The working electrode was a 10-cm2 platinum gauze cylinder with a fixed potential of 0.100 Volt more negative than the reduction potential of [Fe(CN)6]3−. Suspensions were stirred with a magnetic stirrer during the measurements. An Ag/AgCl/Cl− reference electrode was also fitted in this compartment. A platinum counterelectrode was housed in a glass cylinder sealed in one end with a fine porosity glass frit. Unless otherwise stated, the photolysis took place in 0.2 M phosphate pH 6 buffer, containing 0.02 M K4[Fe(CN)6]. The cell diagram and the bases for our choice of this solution is mentioned in our previous work [4,7].
Irradiations were performed with a solar simulator 300 watt xenon lamp (Newport) with an IR filter. The measured photo current was normalized considering two photons per one hydrogen molecule.
3. Results and Discussions
3.1. Crystallographic Growth of TiO2/V2O5 Mixtures
X-ray spectrum studies were performed on TiO2 mixed with 10%, 30%, 50%, 90% V2O5. Samples of these spectra are shown in Figure 1. These spectra indicate that there are 4 strong peaks corresponding to constructive interference between certain scattering planes, and allow for the evaluation of the distance between the scattering planes and their orientation. Analysis of these strong peaks corresponding to 2θ = 25.3, 15, 61, and 63 the following procedure was adopted to calculate DCS (Diffracting Crystallite Size).
• Used XRD plots to locate peaks.
• Fitted a Gaussian curve to each peak using Maple.
• Analyzed curve to calculate FWHM.
• Found the Diffracting Crystallite Size t using equation 4, where λ = 1.540598 Å [Cu-Kα1].
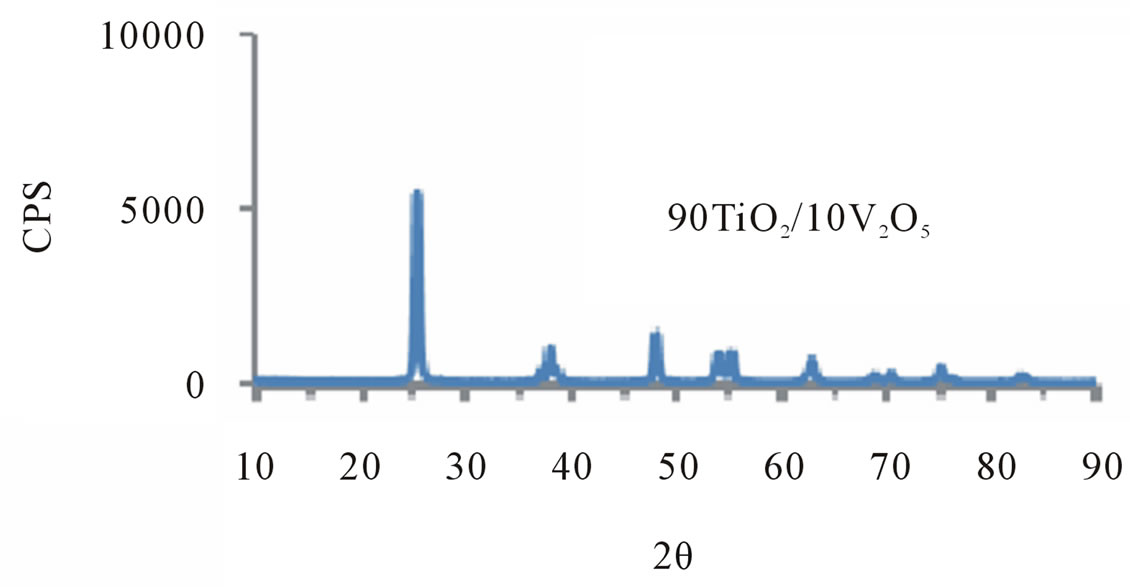

Figure 1. X-ray patterns of TiO2/V2O5 mixtures as titled.
The results displayed in Figure 2 particularly indicate that:
1) For 2θ = 25 TiO2 peak The TiO2 crystallites seem to be growing in the (1 0 1) direction, with increasing concentration of V2O5.
2) For 2θ = 15 V2O5 peak The V2O5 crystallites seem to be shrinking in the (2 0 0) direction, with increasing concentration of V2O5.
3) For 2θ = 61 V2O5 peak The V2O5 crystallites seem to be growing in the (4 2 0) direction, with increasing concentration of V2O5.
4) For 2θ = 63 TiO2 peak The TiO2 crystallites seem to be growing in the (2 0 4) direction, with increasing concentration of V2O5.
The studies generally indicated that:
1) TiO2 DCS grows in multiple orientations with increasing V2O5 concentration.
2) V2O5 DCS grows in certain orientations and shrinks in other orientations with increasing V2O5 concentration.
3.2. Band-Energy Map of the Studied Oxides
Steady state reflectance spectra of the colloidal nanoparticles of TiO2/V2O5 mixturesare shown in Figure 3(A). The approximate values of the band gaps derived from this figure are listed in table 1. However, the following equations were used to determine whether direct or indirect transition band structures exist in these doped oxides [20]:
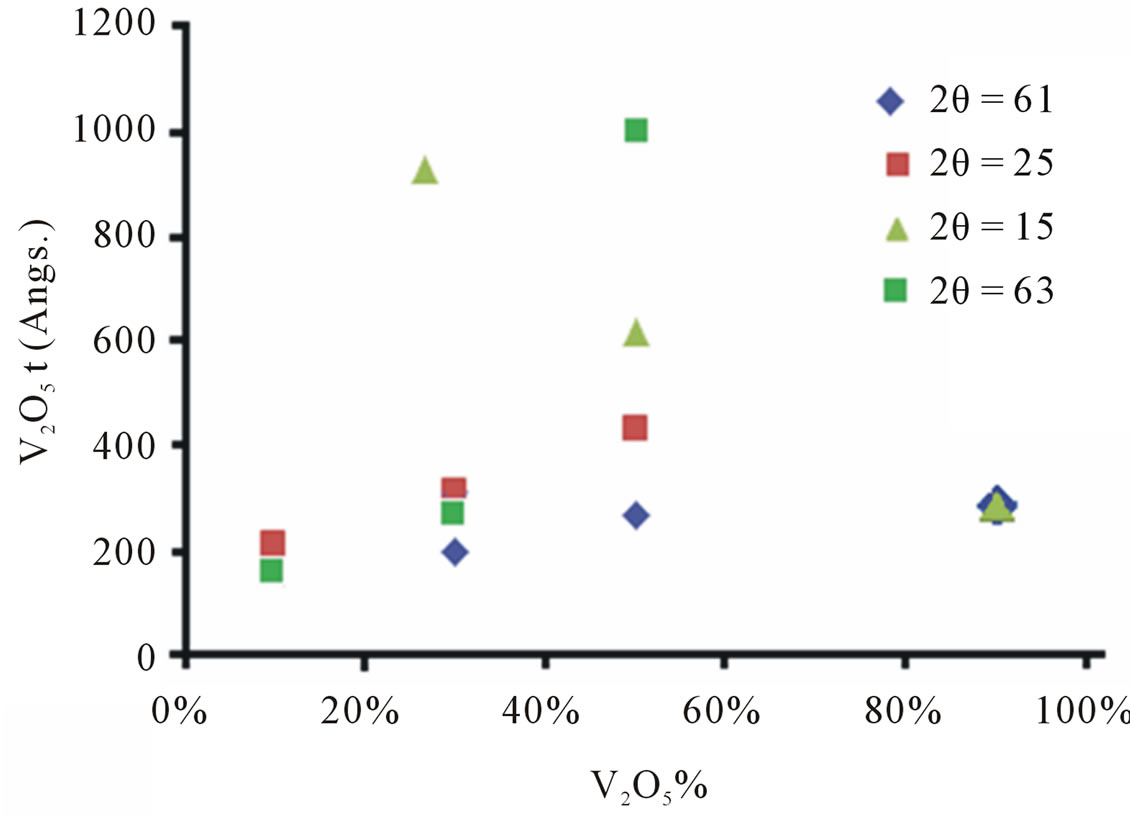
Figure 2. Plot of equation 4 for the studied oxides at different 2θ.
 (5)
(5)
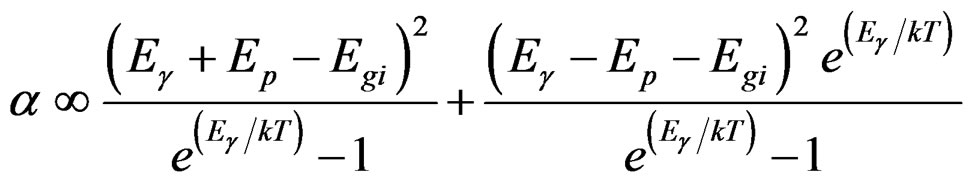 (6)
(6)
where α is absorption coefficient, Eg is the optical band gap.
The plot of α1/2 vs Eg will lead to identification of indirect band transitions, while the plot of (α Eg)2 vs Eg will allow the determination of the direct transitions. These plots are known as Tauc plots. The results of these treatments are displayed in Figures 3(B) and (C) for 10% TiO2/90% V2O5 mixture. The rest of the data listed in table 1 are results of the analysis of Tauc plots.
The data listed in Table 1 indicates that increasing the percentage of V2O5 in the mixture clearly reduces the band gap to lesser values than that with pure TiO2. Furthermore,both direct and indirect band gaps exist for these mixtures. However, the value of indirect band gap was in some cases greater than the direct band gap. Such unusual behavior can be attributed to the crystal growth structure discussed in the previous section. The fact that in all of the studies mixtures were active in photo reduction of [Fe(CN)6]3−, indicates that the change in the value of the band gap resulted from shifting the valance band to less positive potential vs NHE. The data listed in Table 1 also show that at 50% or greater percent of V2O5 in the mixture does not affect the value of the band gap.
Furthermore, TiO2 doped with V2O5 possess an indirect band gap of Eg ≈ 2.8 eV, this is greater than the direct band gap with a value of Eg ≈ 2.5 eV, which is unexpected value of the studied mixture. This result suggests that TiO2 has an indirect band gap transition when doped with V+5. It is known that the depletion layer width decreases with increasing distance of the energy level of the doping material from the conduction band.

Table 1. band gap data for TiO2/V2O5 mixtures.

Figure 3. (A) Steady state reflectance spectra forTiO2/V2O5 mixtures; (B), (C) Tauc plots for indirect and direct band gap TiO2/V2O5(50/50) mixture.
The V2O5, oxides dopants energy levels are not located veryfar further from the conduction band of TiO2. This increases the depletion layer width and consequently enhances charge transfer at the TiO2/electrolyte interface.
3.3. Photolysis of Aqueous Doped Oxide Nano-Particles Colloidal Solutions
The photochemical behavior of these mixtures will be judged by its contribution to the photo-reduction current in total photo-electrochemical reduction current recoded during the photolysis process.
This can be explained using Figure 4 which illustrates this process. Photolysis of [Fe(CN)6]4− according to equation (2) in oxide-free solution, results in formation of [Fe(CN)6]3−. Electrochemical reduction of [Fe(CN)6]3− generates the peak (a), in Figure 4(A). In the presence of metal oxide mixtures, the recorded electrochemical reduction peak (b), is less in height than peak (a). This is attributed to the fact that, in the presence of semiconductor p-type oxides, a portion of [Fe(CN)6]4− will be adsorbed on the surface of the oxide , which makes the recorded electrochemical reduction current of the working electrode is less than in the absence of the oxide particles or I homogeneous > Iheterogeneous.
Where I homogeneous = I (recorded in the absence of oxide particles)
And I heterogeneous = I (recorded in the presence of oxide particles)
The photochemical reduction due to oxides = Ihomogeneous – Iheterogeneous7 It is worth noticing that Figure 4 shows that photolysis of homogenous solutions [Fe(CN)6]4 reaches a peak current with a very short plateau, while the photolysis of heterogeneous suspension of [Fe(CN)6]4 (in presence of metal oxides) reaches smaller peak height with a longer plateau. The longer period of reporting electrochemical
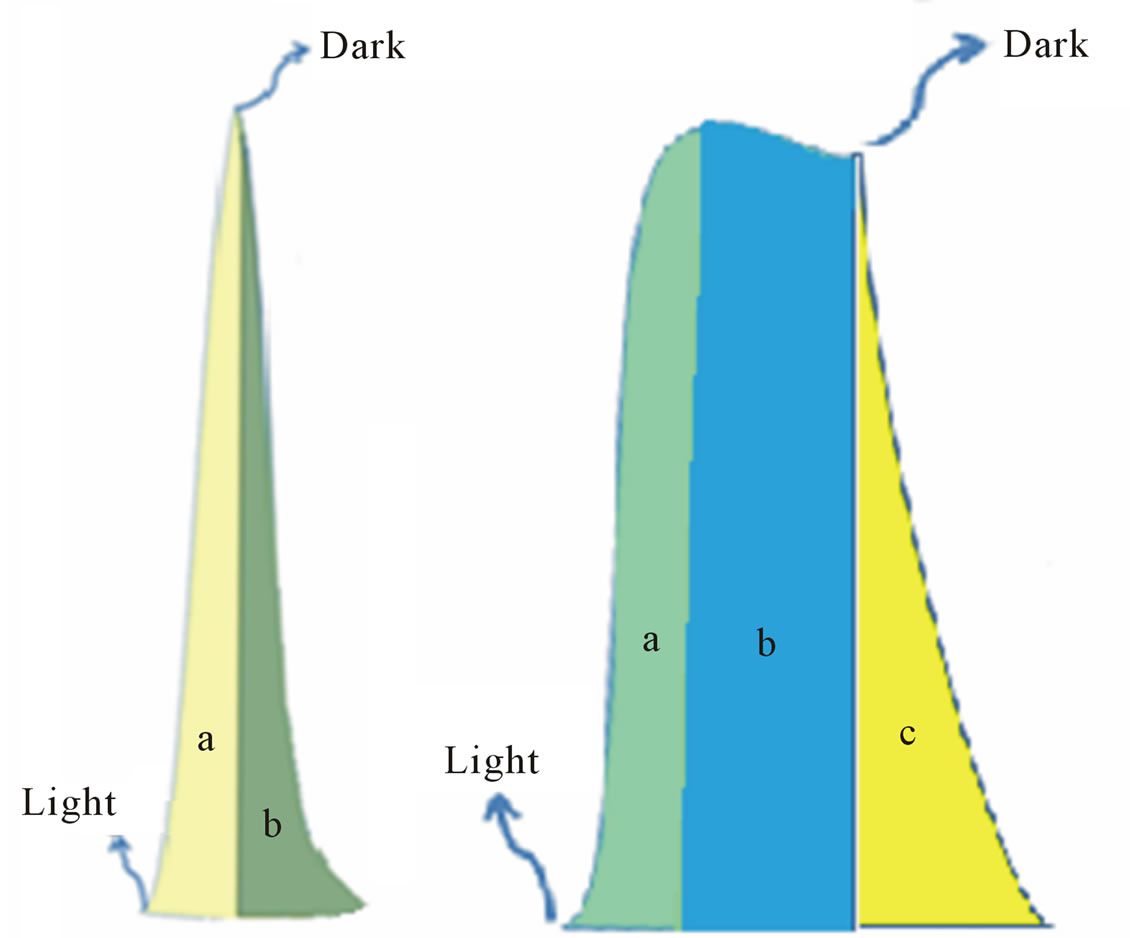
Figure 4. Illustration of dark and illumination current in case of: (A) In homogenous solution; (B) In heterogamous solution (Presence of the oxides).
reduction current in the heterogeneous suspension than in homogenous solutions can be attributed to the extra supply of [Fe(CN)6]3− (as photo oxidation products) that is desorbed from the surfaces of the nanoparticles of the oxides and reached the Pt working electrode in later time. Sections (b) in Figure 4(A) and section (c) in Figure 4(B), represents electrochemical reduction current in darkness. We will refer to it from now on as “dark current”. In both homogenous and heterogeneous systems studied in this work, the electrochemical reduction current is supposed to drop to zero in the dark; however that is not the case as Figure 5 illustrates. The reported electrochemical reduction current in darkness, in the case of a homogeneous solution, can be attributed to the radial diffusion of [Fe(CN)6]3− in the cylindrical zone of the Pt gauze electrode. The shape of the working electrode disrupts the continuity of the stirring effects, and makes the diffusion within the cylindrical shape a major factor for the reduction current. The dark current reported for heterogeneous systems (dashed traces in Figure 5) can be attributed to the desorption of [Fe(CN)6]3− from the surfaces of the oxide particles. The adsorption of [Fe(CN)6]4−, and the desorption of its oxidized form [Fe(CN)6]3− on the surfaces of metal oxide nanoparticles is controlled by the metal oxide mixture composition.
3.4. Role of the Oxide Nanoparticles in Photolysis Process
When oxide nanoparticles are added to [Fe(CN)6]4− solutions, portion of them will be adsorbed on the surface of the particle. Such adsorption will retard reaction 2. This is because of adsorption, the interaction of [Fe(CN)6]4−

Figure 5. Photoelectrochemical response of working electrode during the photolysis of colloidal nano-particles of TiO2 doped with V2O5 in 20 mM of K4[Fe(CN)6] in 0.2 M Phosphate buffer (pH = 6), (A) TiO2doped with 10% V2O5; (B) TiO2doped with 50% V2O5, and (C) V2O5 doped with 10% TiO2; pointsa and b refers to illumination and dark respectively.
with the surface states created during the doping process took place. Upon illumination of the oxide particles, an (e/h) will be formed. The emitted electron will reduce H3O+ ions, while [Fe(CN)6]4− acts as hole scavenger and is oxidized to [Fe(CN)6]3−. Per each H2 molecule is formed, two [Fe(CN)6]4− will be oxidized and still adsorbed on the surface of the oxides particle. As long as [Fe(CN)6]4− is oxidized on the particle surface and reduced in working electrode , the cyclic nature of this reaction will continue.The photo-interaction of the oxide particles with adsorbed [Fe(CN)6]4−/[Fe(CN)6]3− is represented by section (b) in Figure 4(B). This section possesses a plateau and the longer the plateau, the better the photo-chemical efficiency of the metal oxide semiconductor particles. This is because the length of the plateau reflects a steady state reversible oxidation reduction process of [Fe(CN)6]4−/[Fe(CN)6]3−.
3.5. Photolysis of Aqueous Colloidal TiO2/V2O5 Mixtures
Photolysis of aqueous suspensions of TiO2 mixed with 10%, 30%, and 50% V2O5 and V2O5 mixed with 10% TiO2 took place as described in the experimental sections. The results are recorded in Table 2 and Figure 5. Table 2 indicates that the photo-reduction of [Fe(CN)6]3− to [Fe(CN)6]4− caused by the oxide mixture nanoparticle increased by increasing the percentage of V2O5 percent
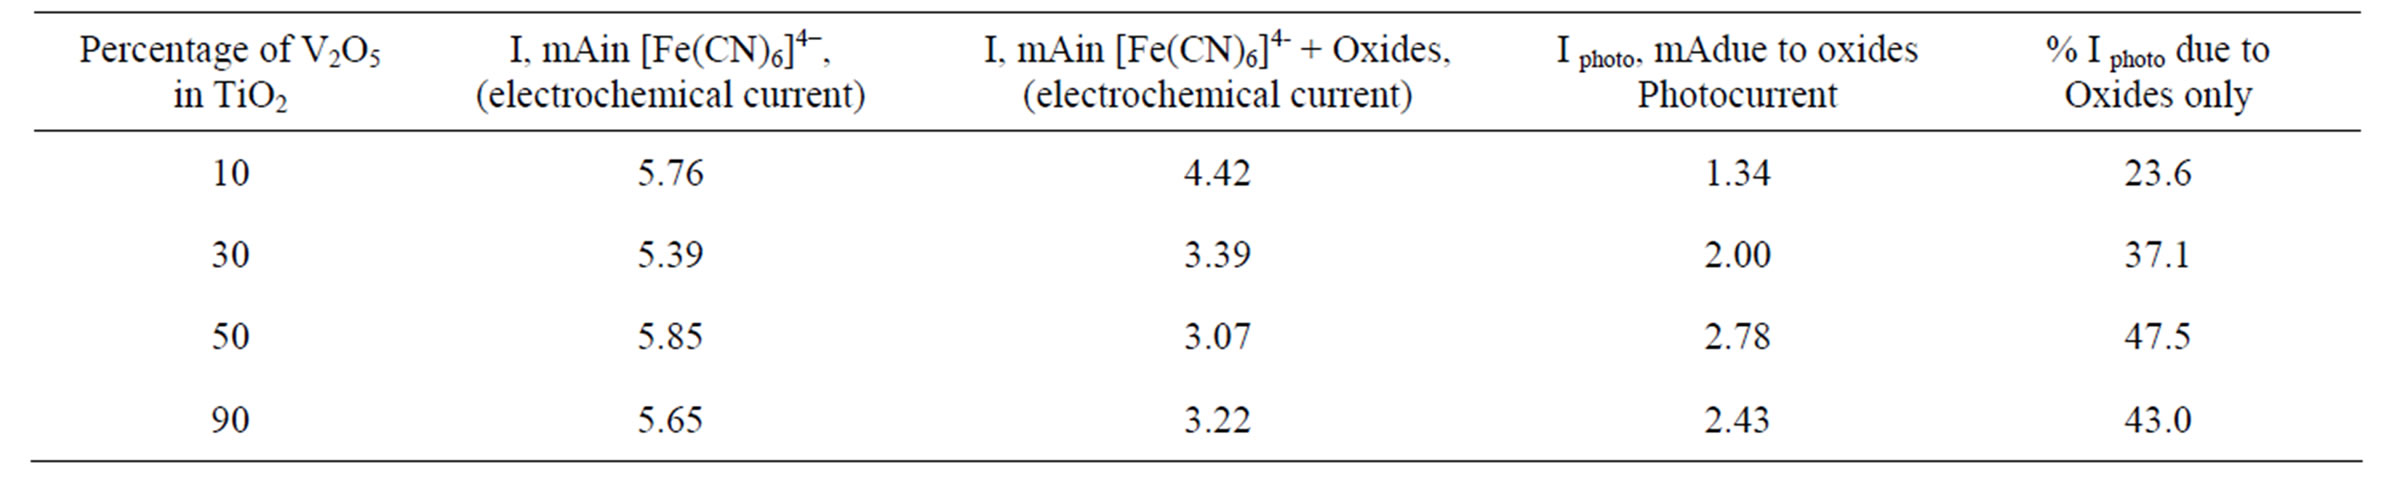
Table 2. Steady state photo-current for studied metal oxides nano-particles at pH = 6 in 20 mM K4[Fe(CN)6] at –100 mV vs Ag/AgCl electrode.
age in the oxide mixture. Such results are consistent with the decrease of the band gap of TiO2 with increasing V2O5 present (table 1). Lowering the band gap increases the absorption in the visible region of the solar spectrum and consequently increases the photo-reduction by the p-type semiconductor. When TiO2 becomes the dopant in V2O5 (10% TiO2 with 90% V2O5) the photo-reduction drops back slightly to lower value than that of 50% V2O5.
3.6. Effect of V2O5
Two important observations that were reportedin this work demonstrate the major effect of V2O5; 1) A more efficient photo-response was reported when nanoparticles of TiO2 doped with V2O5 were suspended in buffered [Fe(CN)6]4−; 2) The reproducible reactivity of these aqueous suspensions for a long time without deactivation which reflects their stability against photo corrosion. Our studies [4] indicated that TiO2 doped with 5% V2O5 gives the greatest effect in phosphate buffer. Vanadium (V+5) facilitates the transfer of charge carriers at the interface because of alteration of the flat-band potential, and increases the absorption of incident light energy as a result of the increase in depletion layer width at the junction [21]. V+5 also supplied a high density of states that lower the band gap of TiO2 and changed its band gap transition from direct to indirect transitions.
4. Conclusions
Increasing the percentage of V2O5 in TiO2, cause noticeable changes in the growth and orientation of each oxide in their common crystal structure as evident from X-ray studies. Such changes create a diverse crystal structure leading to polymorphism solid. The random growth affected the nature and concentration of surface states. The fact that, the photocurrent of the TiO2 doped with V2O5 was greater than that of TiO2 can be attributed to 1) The high surface state density introduced by the diffusion of vanadium ions, and 2) Decreasing the rate of electron-hole recombination due to the change of the band transition mechanism from direct to indirect. The possibility of using these systems in a solar energy based photolysis cell that would achieve the goal of a cyclic, and efficient process for hydrogen production is explored.
5. Acknowledgements
This work was supported by Indiana University Summer faculty fellowship program
REFERENCES
- D. Martel, C. Nguyen, Hoan and J. Weiss, “Process for the production of hydrogen from an aqueous medium,” France Patent No. 2940263, 2010.
- V. M. Aroutiounian, V. M. Arakelyan and G. E. Shahnazaryan, “Metal Oxide Photoelectrodes for Hydrogen Generation Using Solar Radiation-Driven Water Splitting,” Solar Energy, Vol. 78, No. 5, 2005, pp. 581-592. doi:10.1016/j.solener.2004.02.002
- M. Kaneko, H. Ueno, R. Saito, S. Yamaguchi, Y. Fujii and J. Nemoto, “UV Light-Activated Decomposition/ Cleaning of Concentrated Biomass Wastes Involving also Solid Suspensions with Remarkably High Quantum Efficiency,” Applied Catalysis B: Environmental, Vol. 91, No. 1-2, 2009, pp. 254-261. doi:10.1016/j.apcatb.2009.05.033
- K. K. Kasem and M. Dahn, “Photodissociation of Water Using Colloidal Nanoparticles of Doped Titanium (IV) Oxide Semiconductors for Hydrogen Production,” Current Science, Vol. 99, No. 8, 2010, pp. 1068-1073.
- C. E. Jones and L. J. Carpenter, “Solar Photolysis of CH2I2, CH2ICl, and CH2IBr in Water, Saltwater, and Seawater,” Environmental Science and Technology, Vol. 39, No. 16, 2005, pp. 6130-6137. doi:10.1021/es050563g
- V. M. Daskalaki, P. Panagiotopoulou and D. I. Kondarides, “Production of Peroxide Species in Pt/TiO2 suspensions under conditions of Photocatalytic Water splitting and Glycerol Photoreforming,” Chemical Engineering Journal, Vol. 170, No. 2-3, 2011, pp. 433-439. doi:10.1016/j.cej.2010.11.093
- K. K. Kasem, M. Dahn and N. Zia, “Photolysis of Aqueous Colloidal Zinc Oxide Nanoparticles for Hydrogen Production,” CACS Communications, Vol. 4, No. 1, 2010, pp. 13-17.
- A. Patsoura, D. I. Kondarides and X. E. Verykios, “Enhancement of Photoinduced Hydrogen Production from irradiated Pt/TiO2 suspensions with Simultaneous Degradation of Azo-Dyes,” Applied Catalysis B: Environmental, Vol. 64, No. 3-4, 2006, pp. 171-179. doi:10.1016/j.apcatb.2005.11.015
- K. Pechstedt, T. Whittle, J. Baumberg and T. Melvin, “Photoluminescence of Colloidal CdSe/ZnS Quantum Dots: The Critical Effect of Water Molecules,” Journal of Physical Chemistry C, Vol. 114, No. 28, 2010, pp. 12069- 12077. doi:10.1021/jp100415k
- M. Graetzel, “Nanocrystalline electronic junctions,” In: P. V. Kamat and D. Meisel, Eds., Semiconductor Nanoclusters—Physical, Chemical and Catalytic Aspects, Elsevier, Amsterdam, 1997, p. 353.
- K. R. Goidas, M. Bohorques and P. V. Kamat, “Photophysical and Photochemical Aspects of Coupled Semiconductors: Charge-Transfer Processes in Colloidal Cadmium Sulfide-Titania and Cadmium Sulfide-Silver(I) Iodide Systems,” Journal of Physical Chemistry B, Vol. 94, , No. 16, 1990, pp. 6435-6440. doi:10.1021/j100379a051
- R. Vogel, K. Pohl and H. Weller, “Sensitization of Highly Porous, Polycrystalline TiO2 electrodes by Quantum Sized CdS,” Chemical Physics Letters, Vol. 174, No. 3-4, 1990, pp. 241-246. doi:10.1016/0009-2614(90)85339-E
- S. Kohtani, A. Kudo and T. Sakata, “Spectral sanitization of TiO2 Semiconductor Electrode by CdS microcrystals, and Its Photoelectrochemical Properties,” Chemical Physics Letters, Vol. 206, No. 1-4, 1993, pp. 166-170. doi:10.1016/0009-2614(93)85535-V
- R. Vogel, P. Hoyer and H. Weller, “Quantum-Sized PbS, CdS, Ag2S, Sb2S3, and Bi2S3 Particles as Sensitizers for Various Nanoporous Wide-Bandgap Semiconductors,” Journal of Physical Chemistry, Vol. 98, No. 12, 1994, pp. 3183-3188. doi:10.1021/j100063a022
- R. Plass, S. Pelet, J. Krueger, M. Gratzel and U. Bach, “Quantum Dot Sensitization of Organic—Inorganic Hybrid Solar Cells,” Journal of Physical Chemistry B, Vol. 106, No. 31, 2002, pp. 7578-7580. doi:10.1021/jp020453l
- L. M. Peter, K. G. U. Wijayantha, D. J. Riley and J. P. Waggett, “Band-Edge Tuning in Self-Assembled Layers of Bi2S3 Nanoparticles Used to Photosensitize Nanocrystalline TiO2,” Journal of Physical Chemistry B, Vol. 107, No. 33, 2003, pp. 8378-8381. doi:10.1021/jp030334l
- S. Gordon, E. J. Hars, M. S. Matheson, J. Rahani and J. K. Thomas, “Reaction constant of Hydrated Electrons,” Journal of the American Chemical Society, Vol. 85, No. 10, 1963, pp. 1375-1377. doi:10.1021/ja00893a002
- A. Ookubo, E. Kanezaki and K. Ooi and Langmuir, “ESR, XRD, and DRS studies of Paramagnetic Titanium(3+) Ions in a Colloidal Solid of Titanium Oxide Prepared by the hydrolysis of Titanium Trichloride,” Langmuir, Vol. 6, No. 1, 1990, p. 206.
- A. L. Patterson, “The Scherrer Formula for X-ray Particle Size Determination,” Physical Review Letters, Vol. 56, No. 10, 1939, pp. 978-982. doi:10.1103/PhysRev.56.978
- R. A. Van leeuwen, C.-j. Hung, D. R. Kammler and J. A. Switzer, “Optical and Electronic Transport Properties of Electrodeposited Thallium (III) Oxide Films,” Journal of Physical Chemistry, Vol. 99, No. 41, 1995, pp. 15247- 15252. doi:10.1021/j100041a047
- S. Kumari, C. Tripathi, A. P. Singh1, D. Chauhan, R. Shrivastav, S. Dass and V. R. Satsangi, “Characterization of Zn-Doped Hematite Thin Films for Photoelectrochemical Splitting of Water,” Current science, Vol. 91, No. 8, 2006, pp. 1062-1064.
NOTES
*Corresponding author.