Materials Sciences and Applications
Vol.3 No.1(2012), Article ID:16966,12 pages DOI:10.4236/msa.2012.31002
Ferrimagnetism and Ferroelectricity of the Composite Matrix: SrBi2Nb2O9(SBN)X-BaFe12O19(BFO)100–X
![]()
1Laboratório de Telecomunicações e Ciência e Engenharia de Materiais, Fortaleza, Brazil; 2Laboratório de Espalhamento de Luz, Departamento de Física, UFC, Campus do Pici, Fortaleza, Brazil; 3Universidade de Santiago do Chile (USACH), Estación Central, Santiago, Chile; 4Departamento de Engenharia Metalúrgica e de Materiais, UFC, Fortaleza, Brazil; 5Universidade Estadual Paulista Júlio de Mesquita Filho, Faculdade de Engenharia de Ilha Solteira, Departamento de Física e Química, São Paulo, Brazil.
Email: *sombra@ufc.br
Received October 18th, 2011; revised December 2nd, 2011; accepted December 15th, 2011
Keywords: Composites; Magneto-Dielectric Materials
ABSTRACT
A study of the dielectric, magnetic and structural properties of composites based on M-type barium hexaferrite BFO (BaFe12O19) and SBN (SrBi2Nb2O9) is presented. The magneto-dielectric matrix composite (SrBi2Nb2O9)x(BaFe12O19)100–x, (x = 0, 25, 50, 75 and 100 wt%) were prepared by using a new procedure based in the solid state method. X-ray powder diffraction patterns, Raman and Infrared spectroscopy, Mössbauer spectroscopy and scanning electron microscopy (SEM) were carried out for better understanding of the microstructural, dielectric and magnetic properties. Radiofrequency (RF) dielectric permittivity, dielectric loss measurements and magnetic and electric hysteresis loops properties are also discussed throughout this paper. The hysteresis loops showed that composite samples preserve the ferrimagnetism and ferroelectricity for hexaferrite when SBN is added to the composite (BFO25P), although they become less coercive. In addition, the effects of organic binders group (TEOS, PVA and glycerin) on structural properties were also investigated.
1. Introduction
The ceramics composite matrix are uniform, multiphases materials that have been strongly studied in recent works because of the possibility to obtain materials with desirable properties, specially for application in electronics devices. This properties wouldn’t be easily observed for a single phase material, requesting extreme conditions, for example, low temperatures, to its observation thus limiting its applications.
In this work, our main goal is to develop a dielectric material that is able to respond to both electric and magnetic stimulus, i.e. that is ferroelectric and ferromagnetic. To do so, we use the Aurivillius ceramic SrBi2Nb2O9 and the Hexaferrite BaFe12O19. Such a material could be applied in the same way that common dielectrics (as dielectric resonator antennas, for example) but opening a wide range of possibilities to make the application of ceramics to electronic devices, memories and telecommunications more useful and powerful.
The Aurivillius family of compounds that can be represented by the general formula [(Bi2O2)2+(Am–1BmO3m+1)2–]in which A can be a monovalent, divalent or trivalent cation or a combination of those in suitable proportions, B can be a tetravalent or pentavalent cation with m having values of 2, 3, 4… etc. Their structures comprise a stacking of n peroviskite units of normal composition Am–1BmO3m+1 interleaved with Bi2O3 layers along the pseuedotetragonal c-axis known as bismuth layered ceramics (BLFC).
They are potential materials for microelectronic applications when desirable properties are reached such as high dielectric permittivity, high Curie temperature, high fatigue resistance [1-3]. However, dielectric loss is still too high for practical applications for electronic devices. Fortunately, the structure of peroviskite allows easy replacement of cations and combinations among phases as well.
Recently, some researchers reported additions of impurities in bismuth-layered composites [1-3]. This work focused on a new alternative for a composite matrix by using barium hexaferrite.
M-type ferrite has a hexagonal structure and has been largely used for ferrofluids and magnetic devices. It has some interesting properties such as high saturation magnetization and high Curie temperature and has attracted interest for many years. By combining ferroelectric SBN ceramics and M-type ferrite, it was possible to produce the magneto-dielectric composite SrBi2Nb2O9(SBN)X- BaFe12O19(BFO)100–X. By bringing these two materials together, it is expected to develop a bi-phase material, which would be ferroelectric and ferromagnetic. To do so, it would require SBN not to interact with BFO changing their characteristic properties, and the original phases can remain in the composite. The microstructure investigation is able to reveal whether the materials interact with each other forming new phases or not. If there is no undesirable chemical interactions between SBN and BFO, the new bi-phase ceramic will be formed and it will probably be ferroelectric and ferromagnetic.
The behavior of this new class of ceramics is not clearly known so far. Considering such context a precise investigation should be carried out for each composite combination. These matrix composites have interactions with to magnetic and electric fields which are not completely understood because of cumbersome procedures for getting both ferroelectric and ferromagnetic properties under simple physical conditions. By using a composite matrix it is possible to mitigate those drawbacks and two non-interacting ferromagnetic and ferroelectric ceramics would provide magneto-dielectric properties. In this work, we have studied the microstructure, dielectric and magnetic properties of SrBi2Nb2O9(SBN)X-BaFe12O19 (BFO)100–X matrix.
2. Experimental Procedure
SBN (SrBi2Nb2O9) were synthesized from stoichiometric quantities of Bi2O3 (99.99%), Nb2O5 (99.99%), SrCO3 (99.99%) and BFO (BaFe12O19) from BaO (99.99%) and Fe2O3 (99.99%) derived from solid-state reaction method. Both reactions of the uncalcined powders are shown below:
Bi2O3 + Nb2O5 + SrCO3 → SrBi2Nb2O9 + CO2 BaO + 6Fe2O3 → BaFe12O19
Bi2O3, Nb2O5, SrCO3 for SBN have been mixed and ball-milled with zirconium balls in a polyethylene container by using a planetary mill for 8 hours, in order to lower it’s grain size and enlarge it’s surface area aiming to achieve more reactive powders. The same calcination conditions were carried out for ferrite for 2 hours. SBN and BFO samples were calcinated at 800˚C for 5 hours and at 1000˚C for 24 hours, respectively.
SBN and BFO powders were mixed as the following rule SBNxBFO100–x (x = 0, 25, 50, 75 and 100 wt%). Three series of samples were produced for different binders, namely polyvinyl alcohol (PVA), glycerin and tetraethyl orthosilicate (TEOS). The two powders in the defined proportions are mixed with 3 wt% of one of the binders. The powders were used to make cylindrical pellets under an uniaxial pressure of about 0.1 MPa for 5 minutes using a hydraulic press.
The bulks were sinterized at 1050˚C for 5 hours. Samples were named in proportion of BFO and SBN (BFO100 -100% BFO, BFO75-75% BFO + 25% SBN, BFO50- 50% BFO + 50% SBN, BFO25-25% BFO + 75% SBN and SBN100-100% SBN) and also depending on the binder’s name used during their formation (P, T, G, polyvinyl alcohol, tetraethyl orthosilicate and glycerin respectively). The sintered pellets were polished with fine emery paper in order to make both the surfaces flat and parallel and were electroded with high-purity silver paste for dielectric and electrical measurements to ensure a good electrical contact by using an impedance analyzer to cover the frequency range of interest.
The samples powders were analysed using Mössbauer spectroscopy and X-ray diffraction, both at room temperature. The Rietveld analysis was performed by the refinement program DBWS. The bulk samples were analized with Raman and infrared spectroscopy and Scanning electron microscope, for investigation of the structure and radiofrequency measurements, as well as, magnetic and electric hyteresis for investigation of the electromagnetic properties.
2.1. X-Ray Diffraction
The X-ray diffractograms were obtained at room temperature, by using non-sinterized powder samples and a Siemens D501 graphite-monochromator diffractometer using a Cu-K radiation detector (k = 0.1542 nm) with a Bragg-Brentano-geometry scintillation counter operating at 40 kV and 25mA. The ferrite powders were scanned through the 2θ angle ranging from 20˚ to 85˚ and the SBN powder ranging from 20˚ to 70˚ during five seconds for each step of counting time. The Rietveld analysis was performed by the refinement program DBWS. A Modified Thompson-Cox-Hasting pseudo-Voigt profile function was used to fit the calculated curve into the experimental diffraction data. The obtained density with such refinement was used for calculating the relative density (%) of the samples by the Archimedes method.
2.2. Raman and Infrared Spectroscopy
Infrared spectroscopy was obtained with a Mattson 7000 (FTIR) spectrometer, while Raman spectrum was obtained with a FTIR spectrometer VERTEX 70 equipped with RAM II Bruker FT-Raman module adapted for the rough surfaces (diffusion reflection spectroscope EasyDiff), using bulk sintered samples in both cases.
2.3. SEM
Scanning electron microscope (SEM) images for microstructure observation of the sintered pellets were obtained with a scanning electron microscope Vega XMUT/Tescan, Bruker.
2.4. Radiofrequency Measurements
Both surfaces of pellets were painted with silver paste for impedance at radiofrequency measurements. The permittivity and loss tangent were measured by using Agilent E4991A RF impedance/material analyzer connected to a personal computer, for frequency ranging from 1 MHz to 3 GHz, at room temperature.
2.5. Magnetic Hysteresis Measurements
For the measurement of the magnetic moment (M) versus the applied magnetic field (H) a VSM (vibrating sample magnetometer) was used. All measurements were done at room temperature. Magnetization was normalized by the mass of each sample in order to provide M in emu/g. The samples were measured over a maximum applied field of 8000 Oersted.
2.6. Electric Hysteresis Measurements
The electric hysteresis were obtained from a system composed by a Sawyer-Tower circuit connected to a Agilent 54622A digital oscilloscope, a Agilent 33220A function generator and a Trek 610E high-voltage font. All hysteresis loops were done at room temperature with disc shaped samples.
2.7. Mössbauer Spectroscopy
Mössbauer measurements were performed at room temperature by a FAST (ConTec) Mössbauer Systems spectrometer through transmission geometry and radioactive source of 57Co in Rh matrix and isometric shifts are related to metallic iron α-Fe. The NORMOS program was used for adjusting iron sites in Barium hexaferrite structure and for determining hyperfine parameters by using powdered samples.
3. Results and Discussion
3.1. X-Ray Diffraction
The X-ray diffraction patterns for BFO100, BFO50 and SBN100 are shown in Figure 1. The diffraction peaks presented by BFO100 sample were identified by JPCDS (file 78-0133), and powder diffraction patterns of BaFe2O4 located at 33, 16˚ and 46, 61˚ were identified by JPCDS
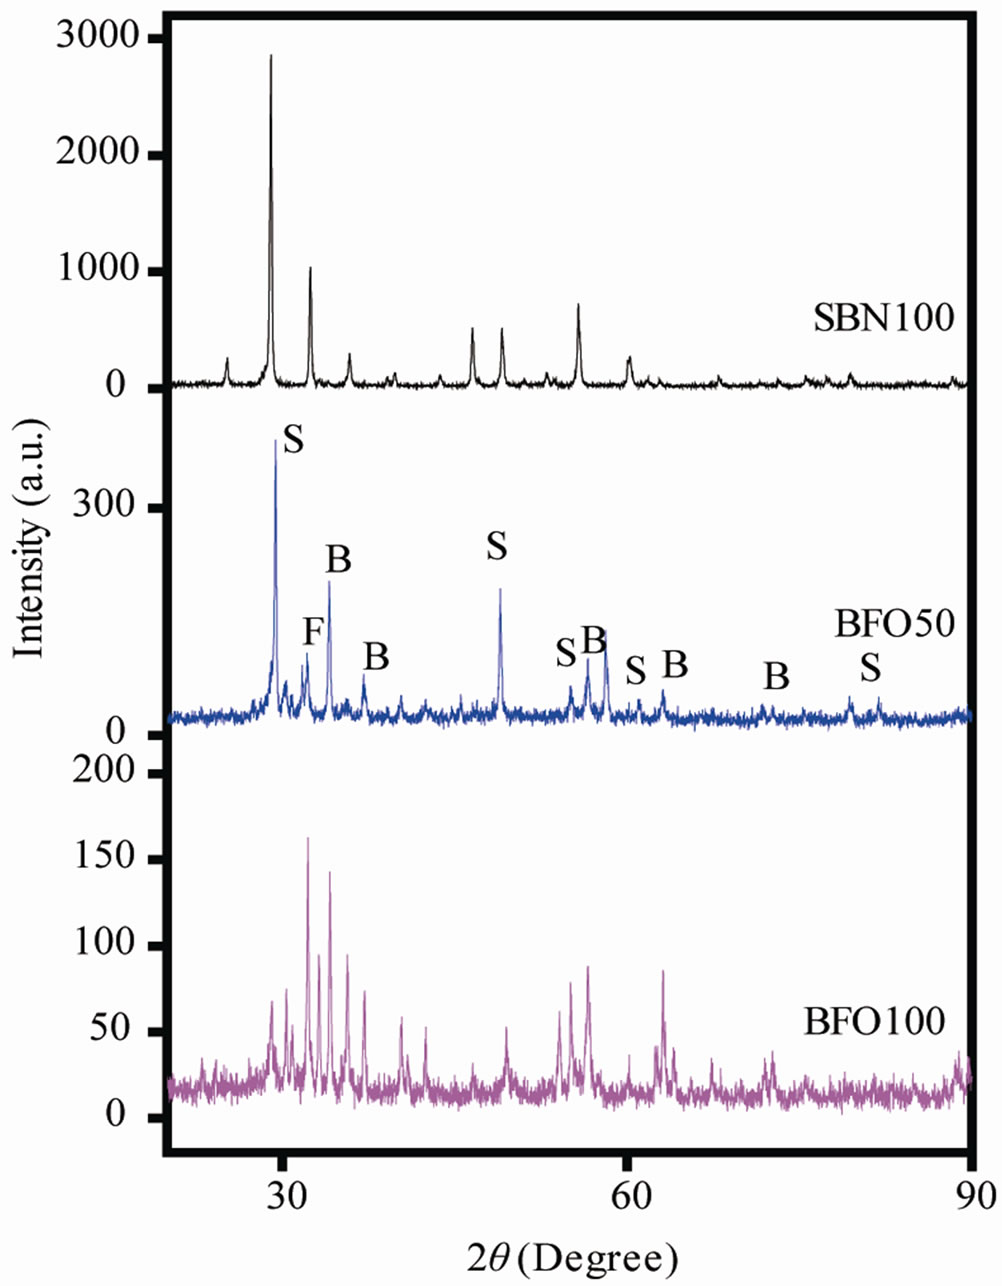
Figure 1. X-ray diffractograms for SBN100, BFO50, BFO100 samples.
(file 20-0132). Some low-intensity peaks observed at 2θ < 30˚ were attributed to magnetite identified by JPCDS (file 76-0958). Mali and Ataie [4] suggest that the formation of barium hexaferrite comes from the reaction of intermediate phases of iron oxide and a spinel monoferite BaFe2O4, and the percentage of crystalline BaFe12O19 grows monotonically as increasing the temperature. This would explain the residual phases and a pure hexaferrite would be obtained for higher calcination temperatures. The presence of residual phases for barium hexaferrite was also reported by other authors [5]. The crystal structure found has hexagonal symmetry belonging to the P63/mmc space group. The average crystallite size was calculated by using the Debye-Scherrer’s equation around 37, 16 nm.
For the SBN100 sample all the diffraction peaks were indexed according to JCPDFS (file 49-0607), without residual phase evidences. The crystal structure found is orthorhombic belonging to the A21am space group with crystalline size estimated about 45 nm.
The diffraction peaks for the present composite shows only a combination of the diffraction of the two base compounds. The representative peaks for SBN100 and BFO100 and spinel monoferrite were indexed by using S, B and F letters respectively.
3.2. Rietveld Refinement
Rietveld Refinement was performed only for the SBN100 and BFO100 samples.
The standard R-factors Rp, Rwp, Rexp, and goodness-offit parameter S, as well as the lattice parameters (a, b, c), the unit cell volume (V) and the density are given in Table 1. A low percentage of Rwp and S value close to unit (<1.3 normally) indicates that the refinement was successful. Better results were obtained to SBN100 refinement. The density and volume of unitary cell were close to values reported [3] and also from PDF database.
To the BFO, the presence of a small amount (~0.04%) of secondary phases was not considered in the refinement which increases the refinement parameters values. The density, unit cell and volume presented here are in good agreement with the expected results (JPCDS file peaks number 78-0133) already reported [6,7].
3.3. Archimedes Method
The relative densities of the present samples were measured by Archimedes method and are shown in Table 2. The expected density was achieved and better densification is related to TEOS binder use. The only difference between using TEOS, Glycerin and PVA as binders is the densification factor of the samples, since the organic
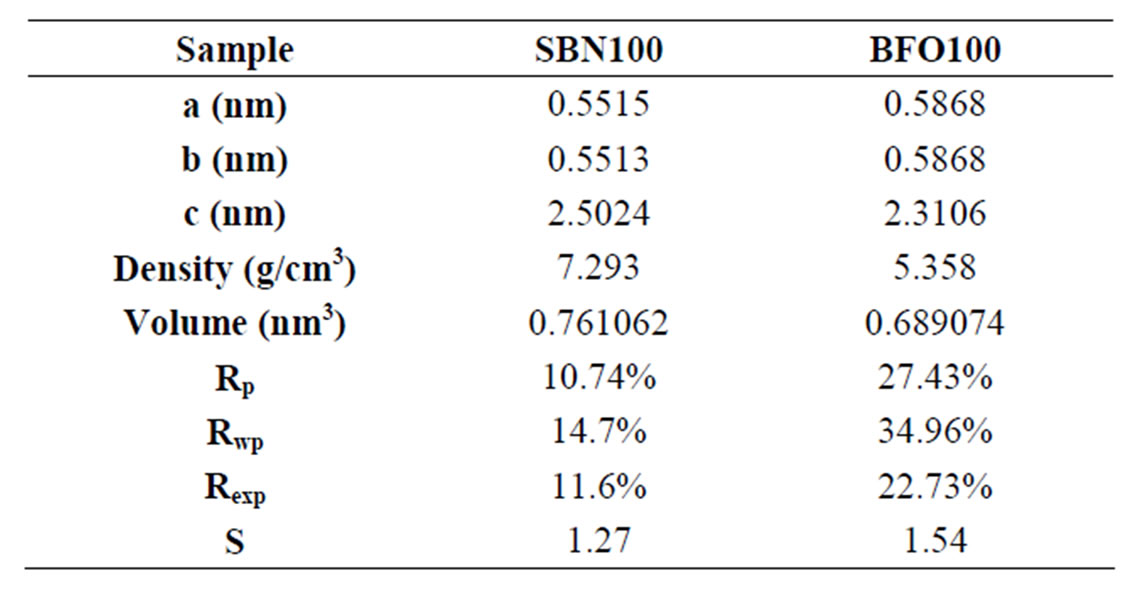
Table 1. Rietveld refinement parameters.
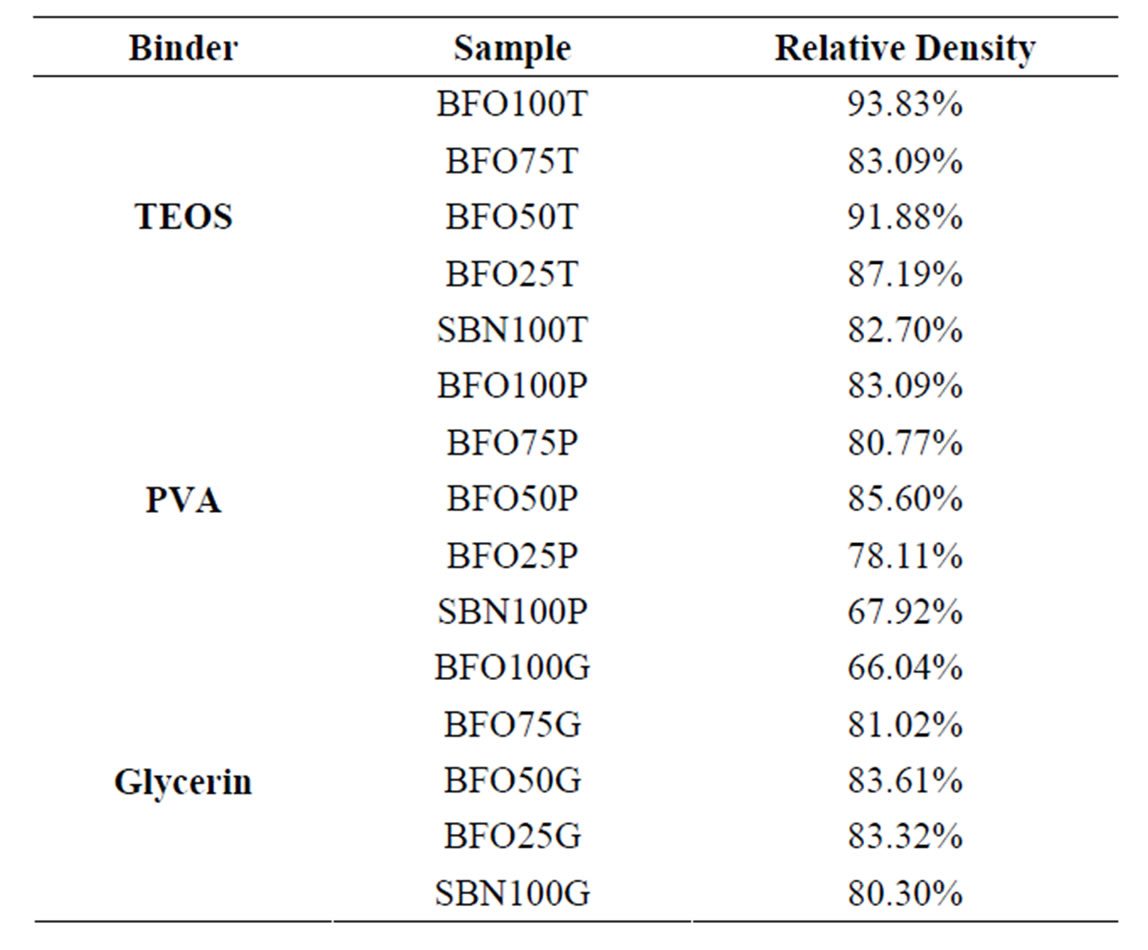
Table 2. Relative density of the samples obtained from the Archimedes method.
material should vanish around 500˚C and it is supposed not to interfere with the material atomic arrangement. Therefore, no structural differences should be observed, even though electrical and magnetic properties are influenced if any consistent change is observed as causing undesirable effects.
3.4. Raman Spectroscopy
Figure 2 shows the Raman spectra for the composites, SBN100T, and BFO25T, BFO50T, BFO75T and BFO100T, respectively. The characteristic bands for SBN were all in agreement with data from the literature [8]. It is usual to all Aurivillius ceramics, once they are peroviskite like materials, a vibration mode over the 800 cm–1 - 900 cm–1 frequency range (associated to an octahedral sub-structure). The 835.95 cm–1 mode was identified to be associated to NbO6 octahedral stretching mode A1g. The 585 cm–1 mode is associated to Eg modes related to the stretching of oxygen bonds in the octahedron. The lower frequency modes are probably related to lattice vibrations or backscattered photons.
A detailed analysis of hexaferrite vibration modes was carried out by Kreisel [9]. According to his work, 683.7 cm–1 mode was clearly observed, which is related to the symmetric stretching of bi-pyramid shaped sub-structure of FeO5. This mode is commonly between 670 - 710 cm–1 for M-type ferrite. This is the strongest band in fer-
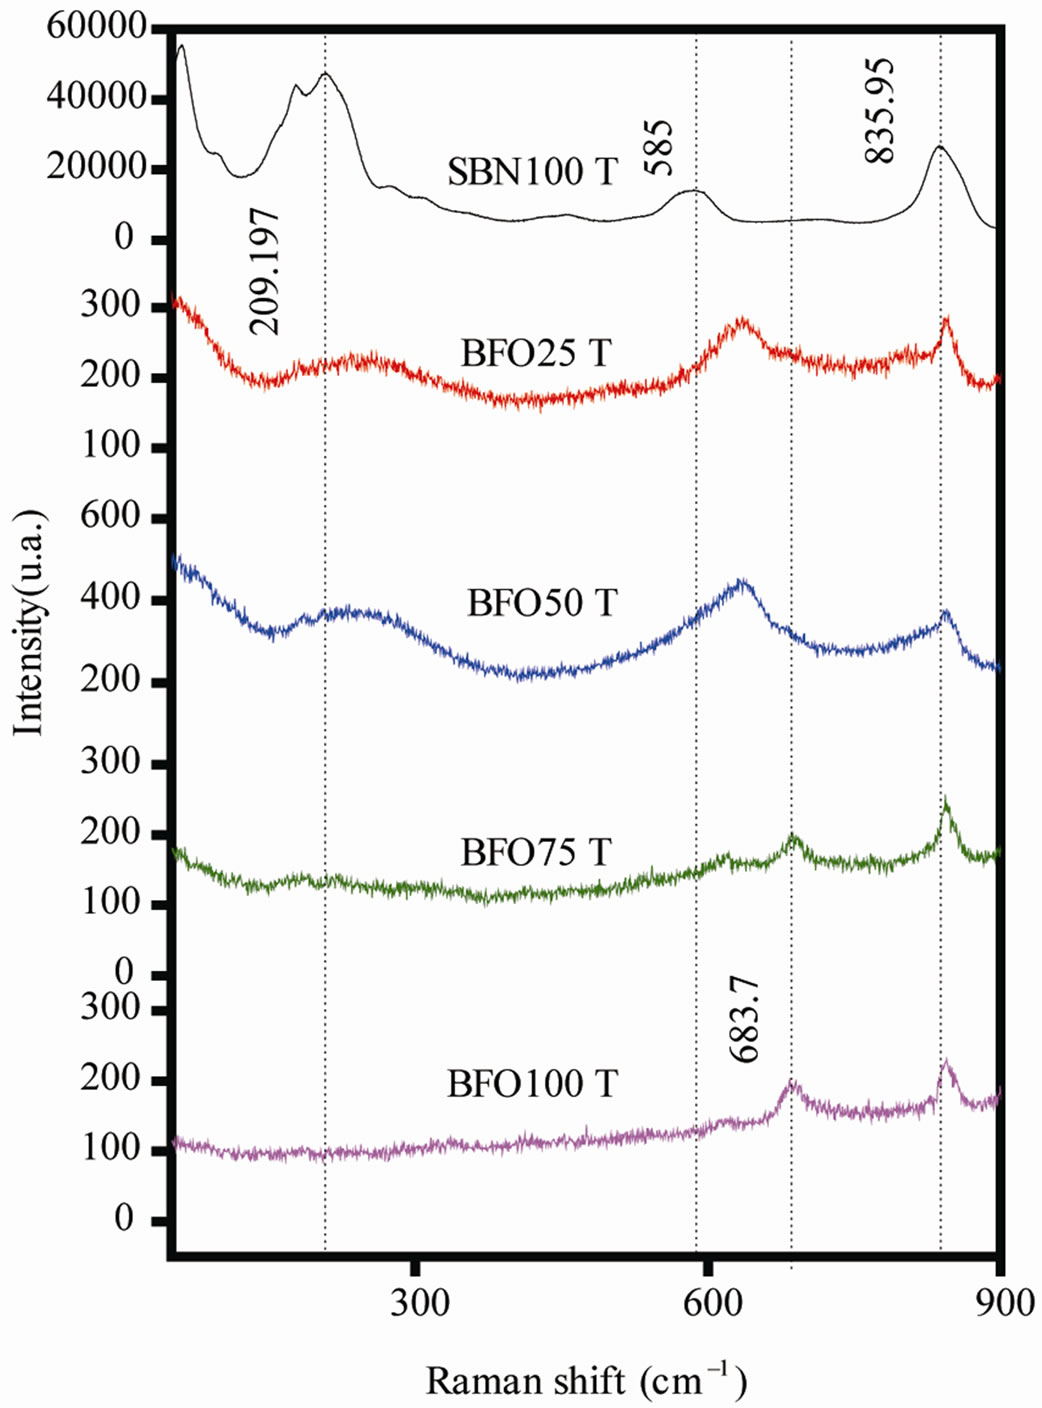
Figure 2. Raman spectra for the SBN100T, BFO75T, BFO50T, BFO25T, BFO100T samples.
rites containing such structure. No other Raman active modes are expected for M-type ferrite above 800 cm–1 frequency, thus 845.3 cm–1 band should be related to BaFe2O4 monoferrite. Some expected bands for BaFe12O19 are not observed in spectrum [9], this fact is a conesquence of strong noise in the spectrum, hiding lower intensity bands. Opaque and dark samples usually show this sort of spectrum in FT-Raman measurements.
The composite spectra show no new band, indicating that the vibration modes remain invariant when the two materials are mixed. An apparent displacement of the 585 cm–1 SBN band in composite samples may be a result of insufficient resolution to identify this band on SBN from 683.7 cm–1 band on BFO. The bands are located at the same frequency, just varying their intensities proportionally to the sample composition, showing that both are non-interacting materials and that they form a bi-phase ceramics.
3.5. Infrared Spectroscopy
Figure 3 shows the IR spectra. The NbO6 structure could be related to the 600 - 640 cm–1 bands which are expected for octahedral stretching. The bismuth layers bands are hidden once they would be located about the same frequency range where NbO6 octahedral stretching bands is found, and are wide enough to hide bismuthlayer bands.
Similar results were already reported for the ferrite spectra [10,11-13]. The small displacement of the bands could be related to different methods of sample preparation [11-13]. The identified bands for barium hexaferrite in this present work are 609.4 cm–1, 430 cm–1 and 543.89 cm–1, which are all in good agreement with the characteristic bands for crystalline BaFe12O19 (552, 434 and 583 cm–1) [11-13]. These bands are related to Fe-O vibration bonds. Again, the composites did not apparently show new bands.
3.6. Mössbauer Spectroscopy
The Mössbauer Spectroscopy was carried out only for BFO100, since there is no iron atoms in SBN and the presence of strontium atoms caused great difficulties to obtain the spectra when this material is added into ferrite.
Figure 4 shows five observed sextets related to a char-
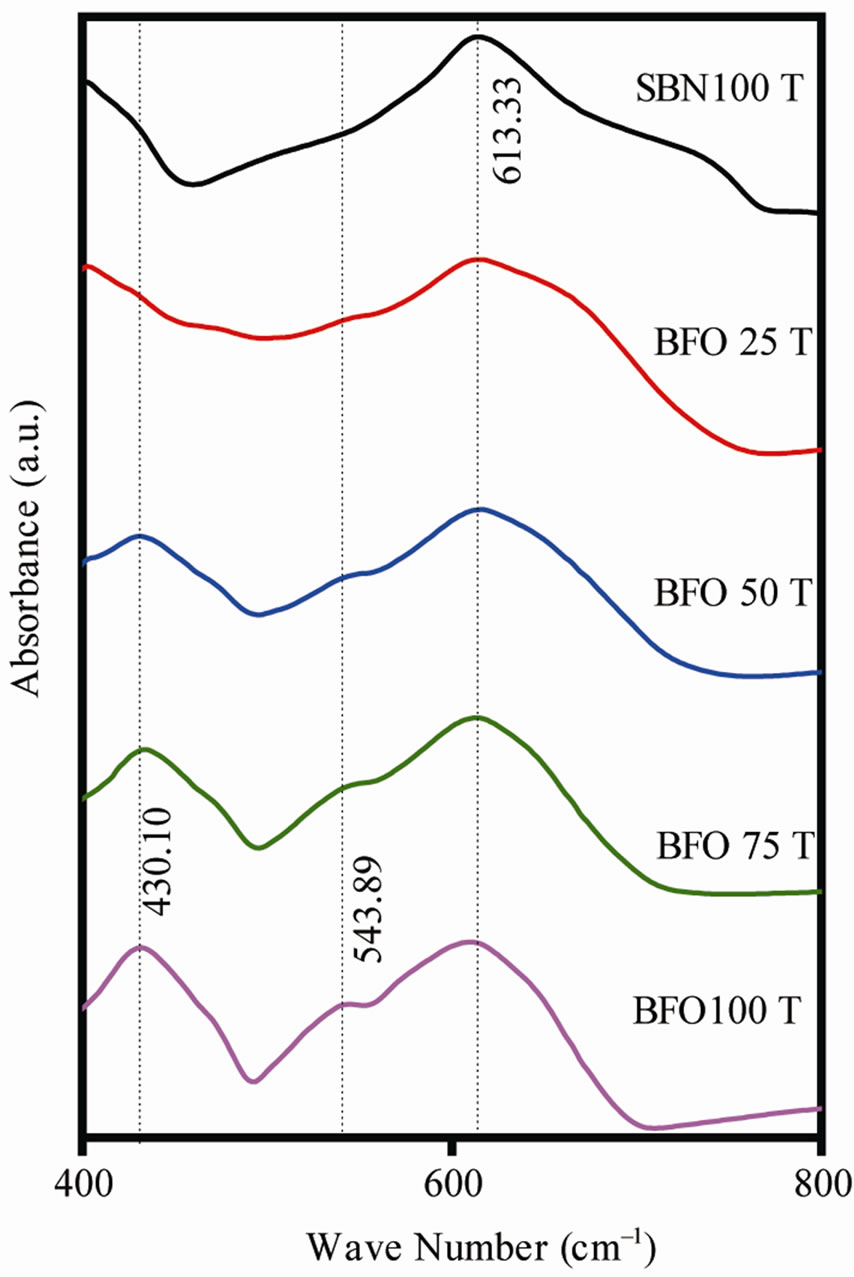
Figure 3. IR spectra for the SBN100T, BFO75T, BFO50T, BFO25T, BFO100T samples.
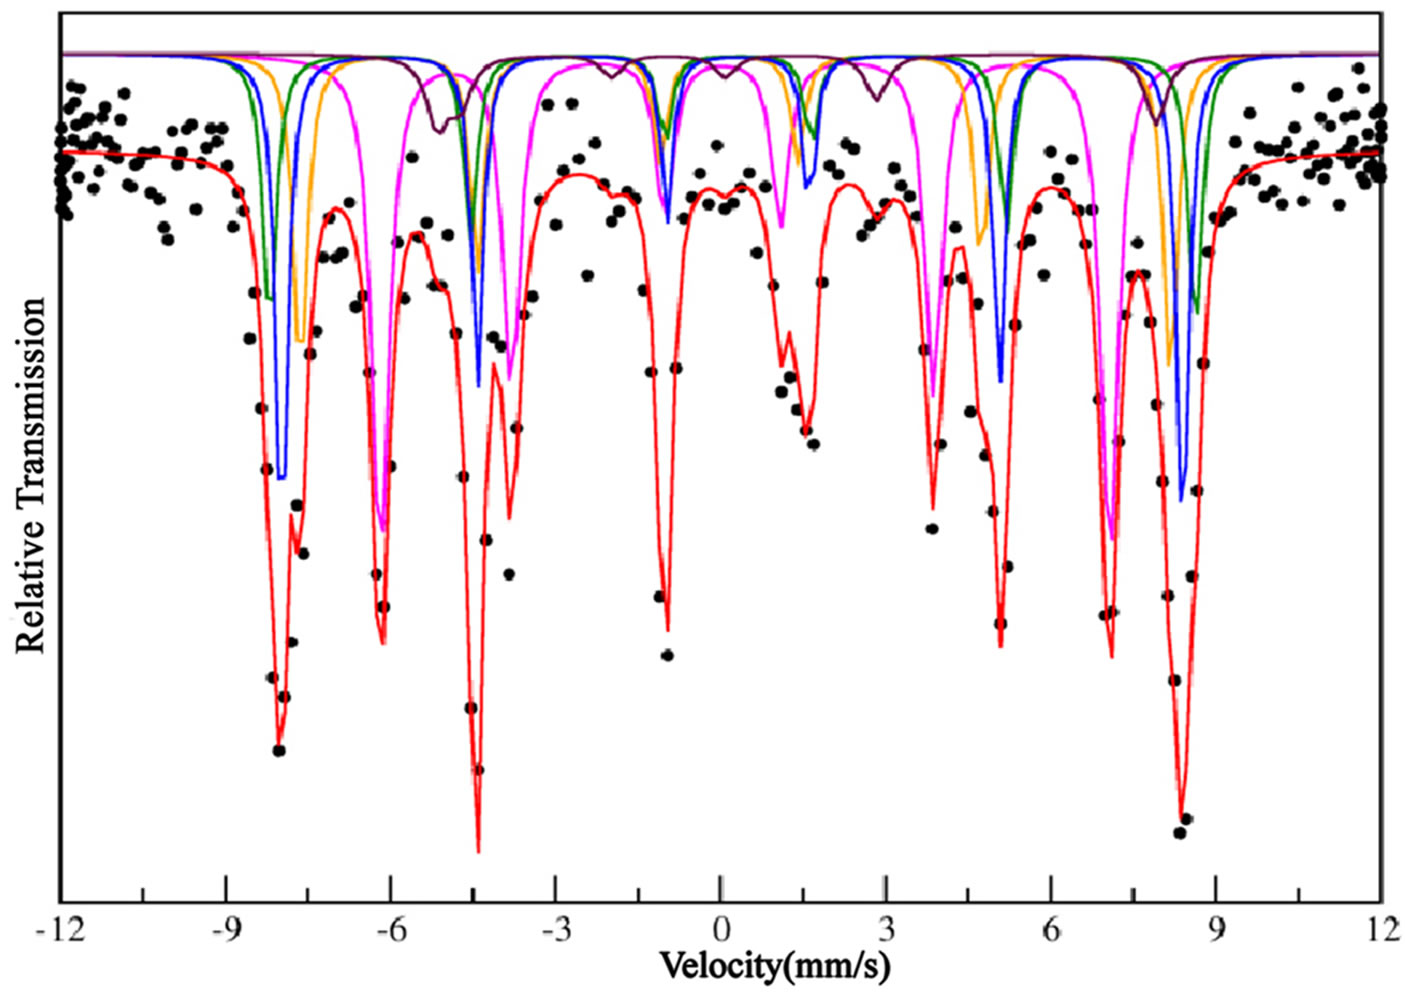
Figure 4. Mössbauer spectrum for the BFO100 sample.
acteristic complex structure of five iron sites. The sites occupied by iron atoms are 12k, 4f1, 4f2, 2a and 2b, located in the spinel (4f1 and 12k) or hexagonal blocks (4f2, 2a and 2b) which were found in the structure. The hyperfine parameters are given in Table 3 and a fitting method was applied to irons sites based on the same arguments used by Sankaranarayanan and Shaman [14] since our spectrum results show all iron sites formed in the same profile.
The strongest hyperfine field sextet (52, 16T) is associated to 4f2-octahedra site of barium hexaferrite, located on the hexagonal block. The hyperfine fields of 2b (40.65T) and 12k (41.09T) do have close values, being the lowest ones. Although the high quadrupolar splitting associated to 2b makes it possible to identify which one is related to the 2b or 12k site, since 2b site, which has a trigonal bipyramidal symmetry, is highly distorted and is expected to show extremely large quadruple-pole spliting values (2.310 mm/s) and relative intensity (6%) lower than 12k site, which has large relative intensity (>35%) for samples treated at high temperatures (>900˚C). Other two sextets have showed high hyperfine fields and they are corresponding to 4f1 (49.00T) tetrahedral and 2a (50.79T) octahedral sites.
Also, the isomer shift is useful for determining valence states, and electron shielding. The oxidation states in which iron form compounds is +3 and +2 and the configuration of the valence electrons is [Ar]3d5 and [Ar]3d6. Due to the screening effect of 3d electrons, this electron density at the nucleus is higher for Fe3+ than in the Fe2+, thus ferrous ions have larger positive isomer shifts than ferric ions. The isomer shift observed in our ferrite is between 0.32 - 0.38 mm/s which is in great accordance with the ferric isomer shifts reported. [13,15].
3.7. SEM
The SEM micrographs are shown in Figures 5(a)-(c). Note that for BFO100 sample a dense ceramic is shown, although some pores can be observed, with heterogeneous distribution of grain sizes and shapes, showing sharp edged grains and also some completely asymmetric agglomerates. The grain size is ranging approximately from 0.8 to 3.0 μm, which allows the existence of single-domain grains, since some of the grains are smaller than typical domain-wall dimensions, to this ferrite (1 μm) [16]. Nevertheless most of the grains exhibit multi-domain morphology. BaFe12O19 has been reported to have non-isometric crystallite size, which would explain such a wide range of size variation [11].
For the SBN100 the micrographs reveal a much more porous sample, but still dense. The grain size distribution is homogenous and the agglomerate shapes are more symmetric than found in BFO100 samples. The grain size varies between 0.4 - 1 μm, which was also observed by Shrivastava and Jah [2]. The composite sample shows good density with few vacancies. The distribution of ferrite and SBN is homogeneous and each grain can be easily identified. The addiction of SBN leads to an increase of the ferrite grain size, which can reach more than 5 μm in composite samples. This change in morphology would probably induce a modification in the magnetic properties.
3.8. Radiofrequency Measurements
As it is shown in Table 4, the values of permittivity (ε’) and loss (tanδ) changes according to different binders. The change in relative density of the sample is related to this effect. The permittivity of BFO samples for different binders is associated to the densification of the sample due to the presence of more vacancies in the lower density samples [17]. The value of the permittivity of this ferrite is slowly decreasing with frequency, because the electronic jump between ferric ions is not able to follow the changes in polarization up to high frequencies [17,18]. SBN is more likely to vary its permittivity as a function of density since the presence of vacancies will induce more significant decreasing in ε’. This is related to the fact that SBN is an insulator, with relative permittivity values going up to 102 [2,19].
The differences in density of samples is an important factor for the composite samples. TEOS shows higher densification for the majority of the samples and so higher permittivity values have been observed for BFO75T and BFO50T samples. Figure 6 shows the frequency dependence of permittivity.
Another factor which influences the values of both permittivity and loss is the grain size. Since the addition of SBN is leading to an increase of the ferrite grain size, thus it leads to an easier polarization [20]. The increase of these parameters is observed for composite samples
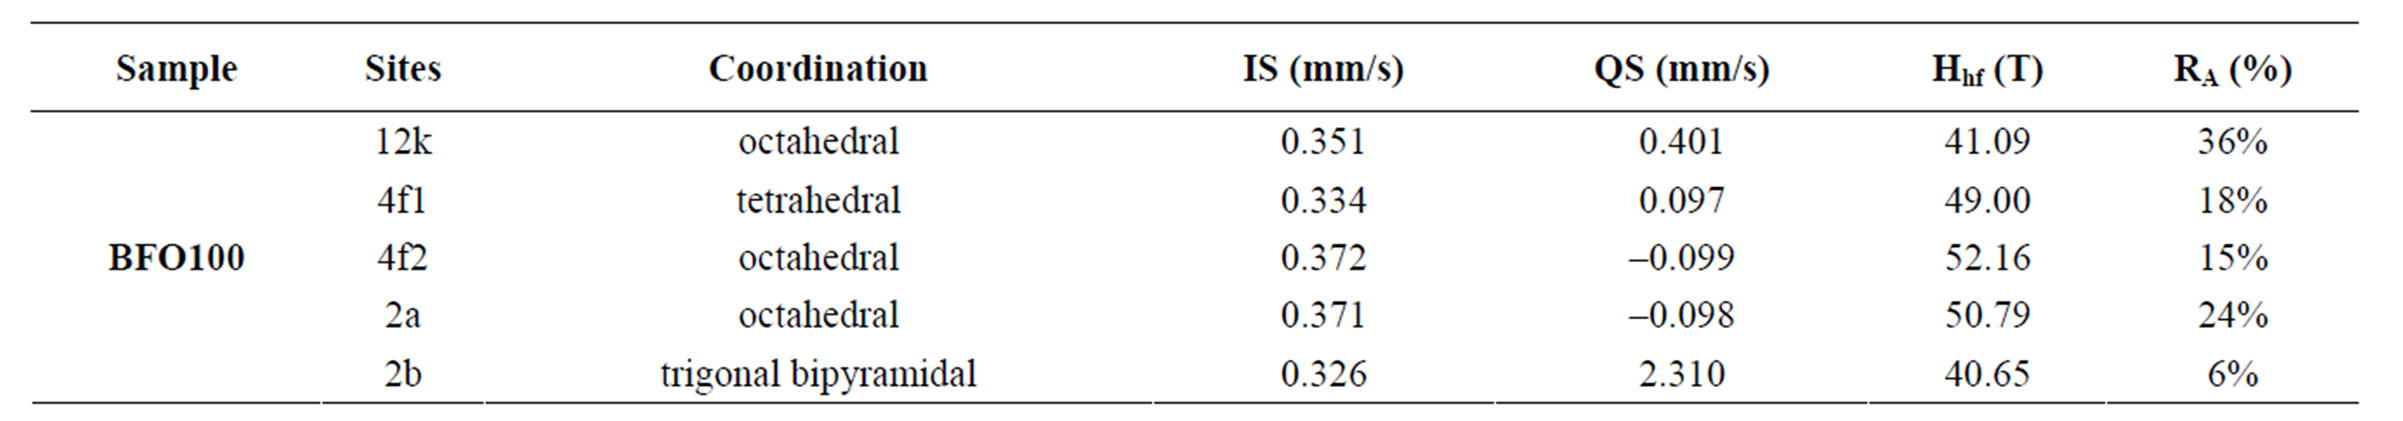
Table 3. Hyperfine parameters of the Mössbauer measurements.
 (a)
(a)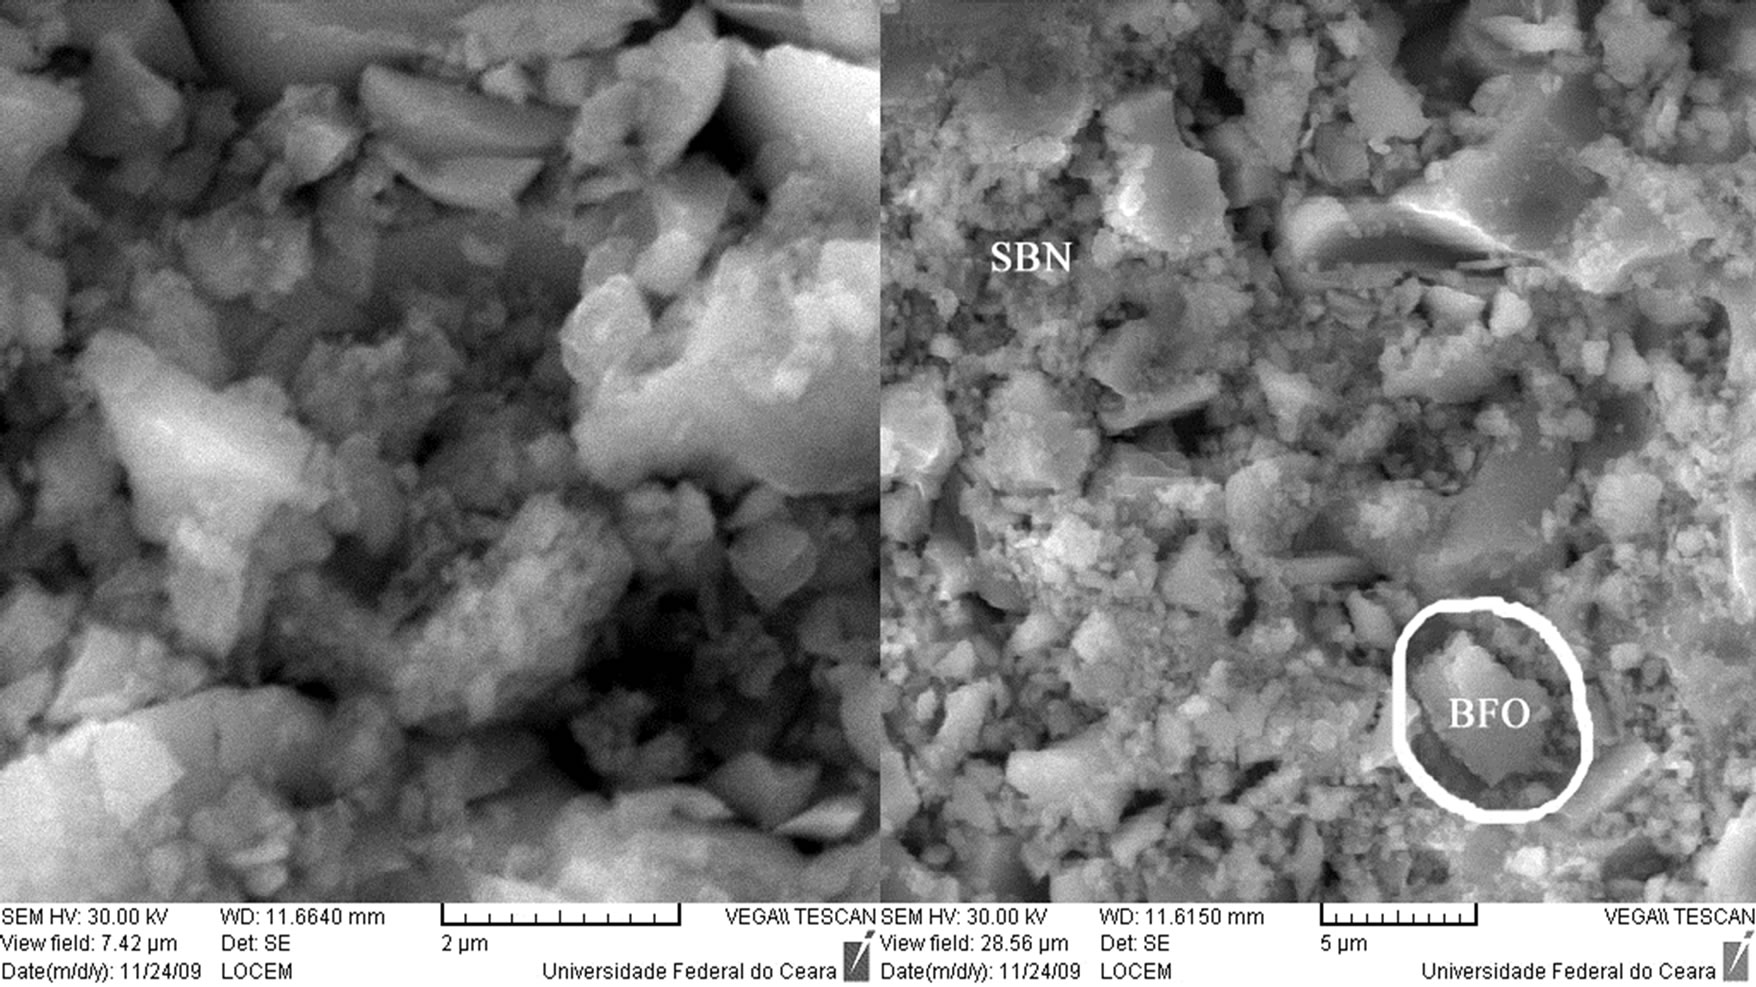 (b)
(b)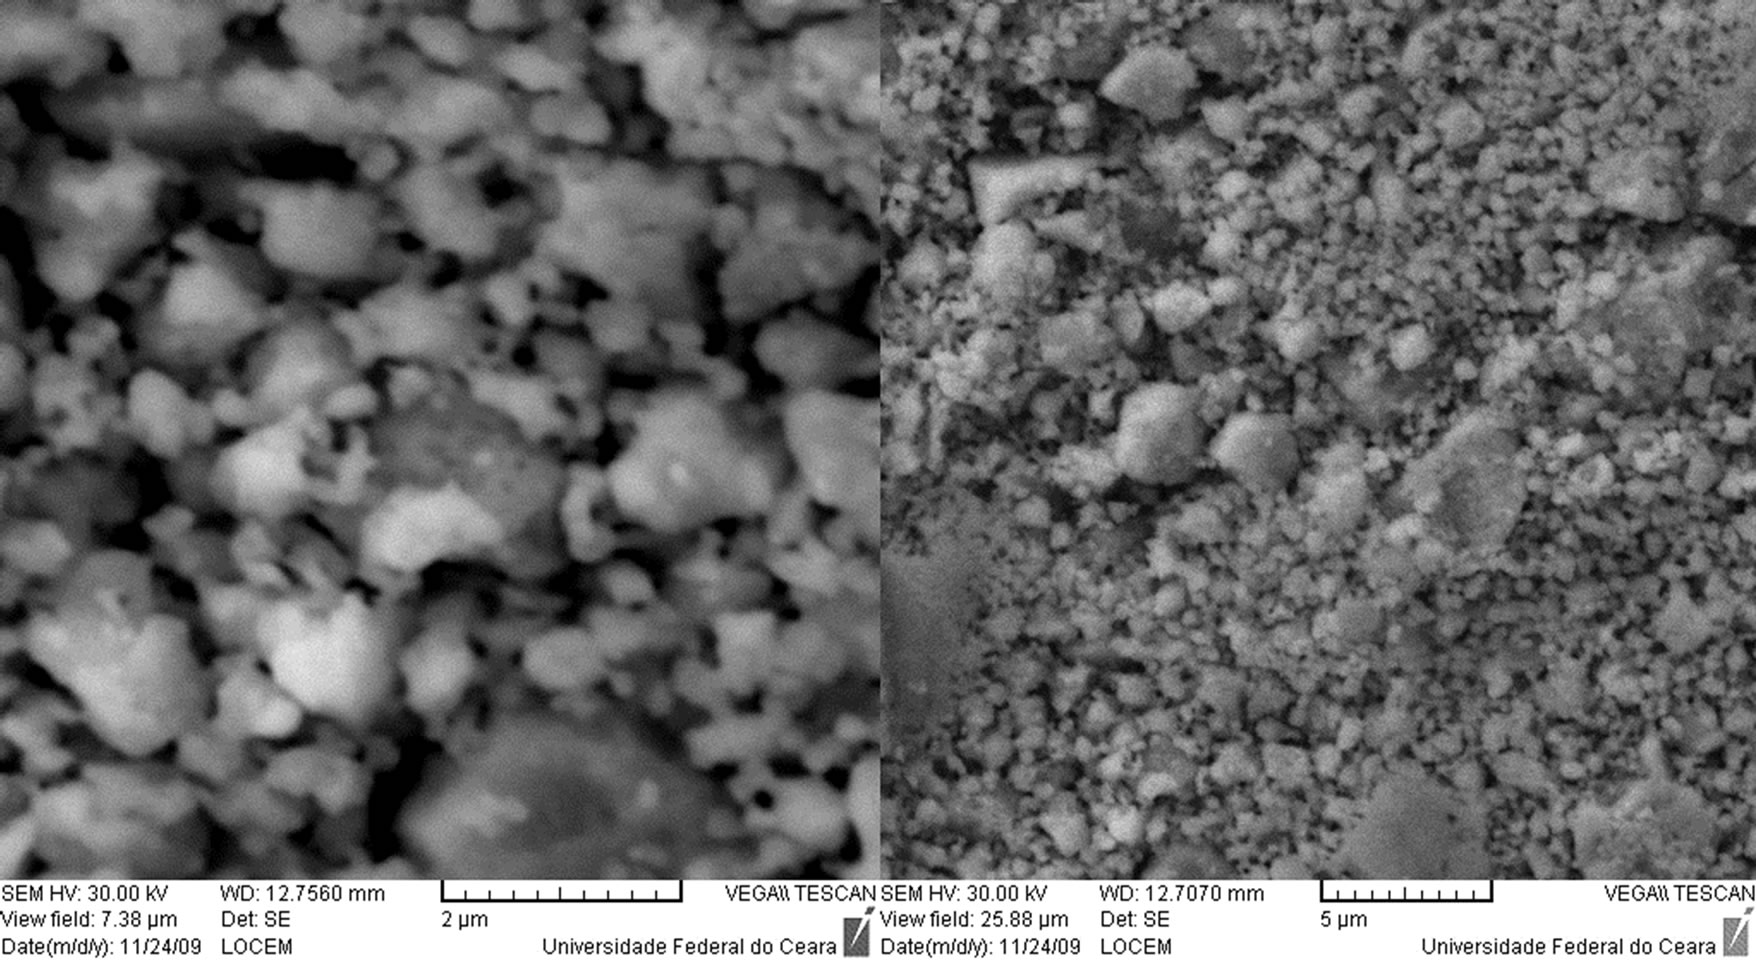 (c)
(c)
Figure 5. SEM micrographs for (a) BFO100; (b) BFO50; (c) SBN100.

Table 4. Values of permittivity and loss in the RF range.
with higher percentage of BFO (BFO50 and BFO75).
The dielectric loss shows similar values to TEOS and PVA series and higher values to Glycerin. Figure 6
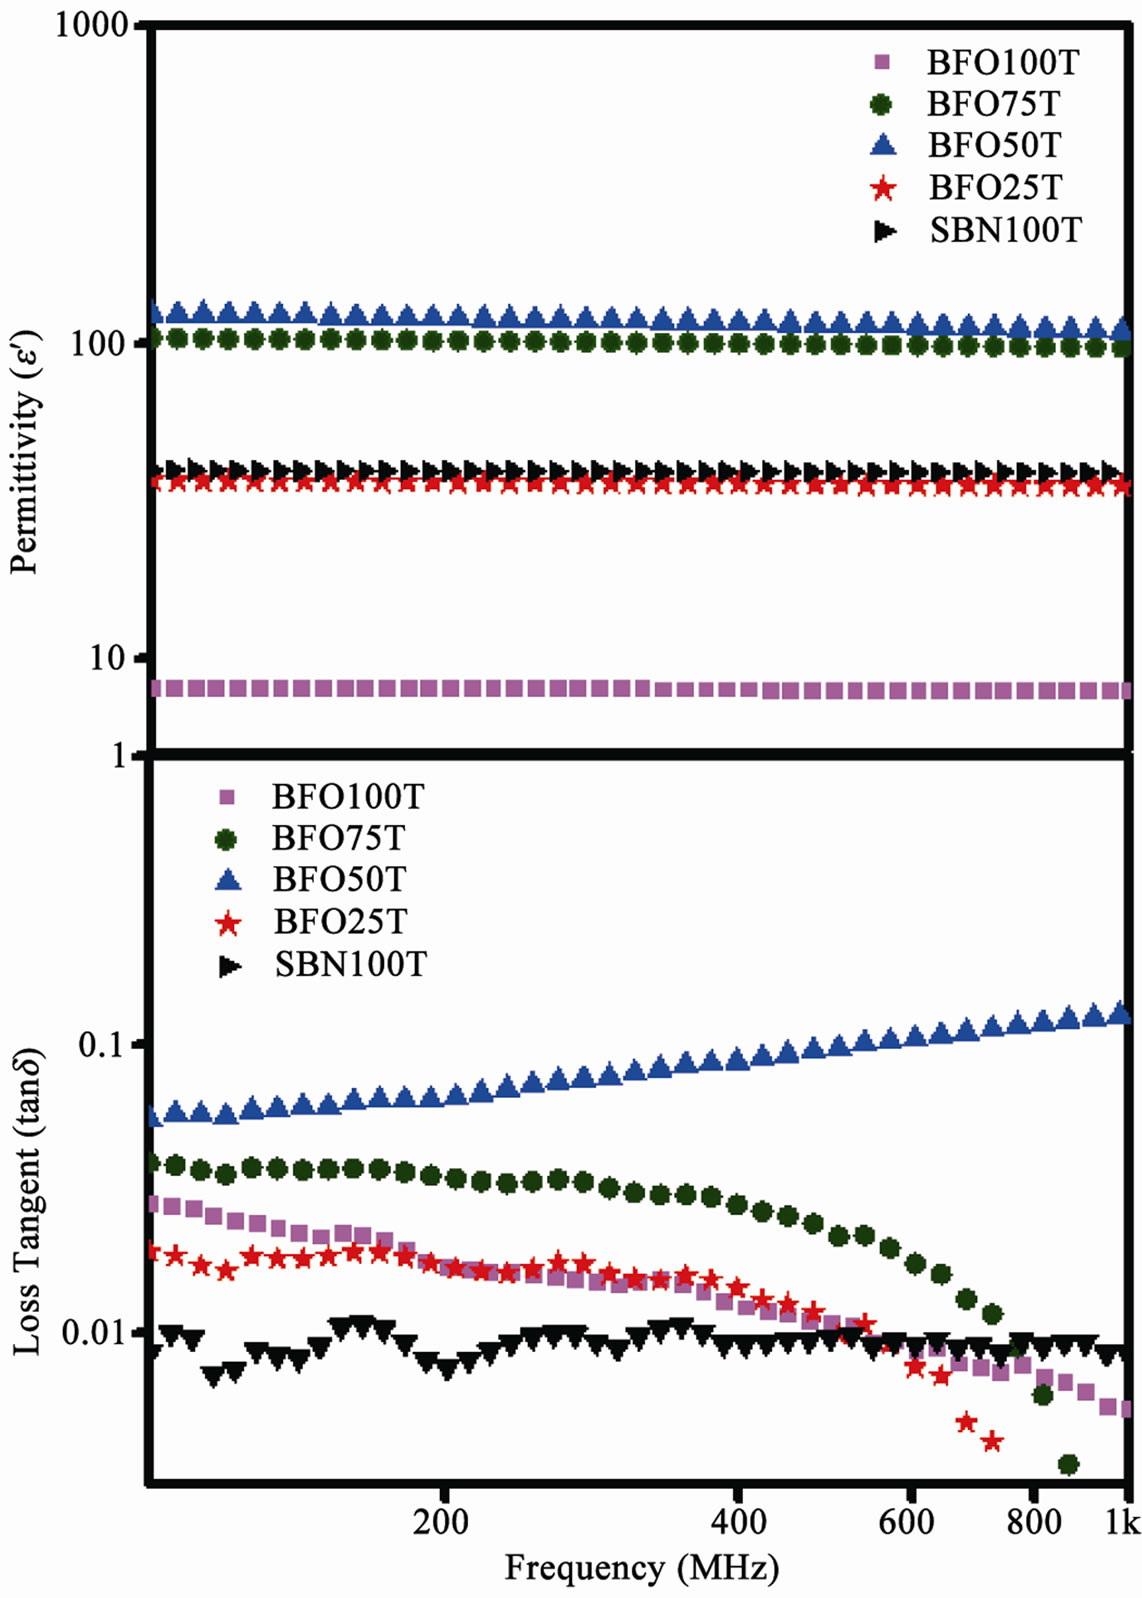
Figure 6. RF measurements of (a) permittivity and (b) loss tangent for TEOS samples.
shows the frequency dependence of loss tangent (tanδ). The observed behavior for composite samples indicates the existence of resonance absorption at higher frequencies [21]. At low frequency, a weak oscillatory behavior is observed for loss values of SBN. This could be explained by the stronger influence of DC conductivity and charge carriers over this frequency range since no loss peak is observed [22]. The ferrite shows a dispersive behavior for the loss tangent, which decreases as frequency increases. This kind of behavior was studied by Koops [23] and is related to the existence of different regions inside the samples with different values of conductivity. The samples with higher losses were BFO50T and BFO75T.
3.9. Magnetic Hysteresis
Figure 7 shows the hysteresis loops for TEOS and glycerin series. A little depression in the hysteresis loop for pure ferrite samples was observed. This behavior is a consequence of coupling between the barium hexaferrite
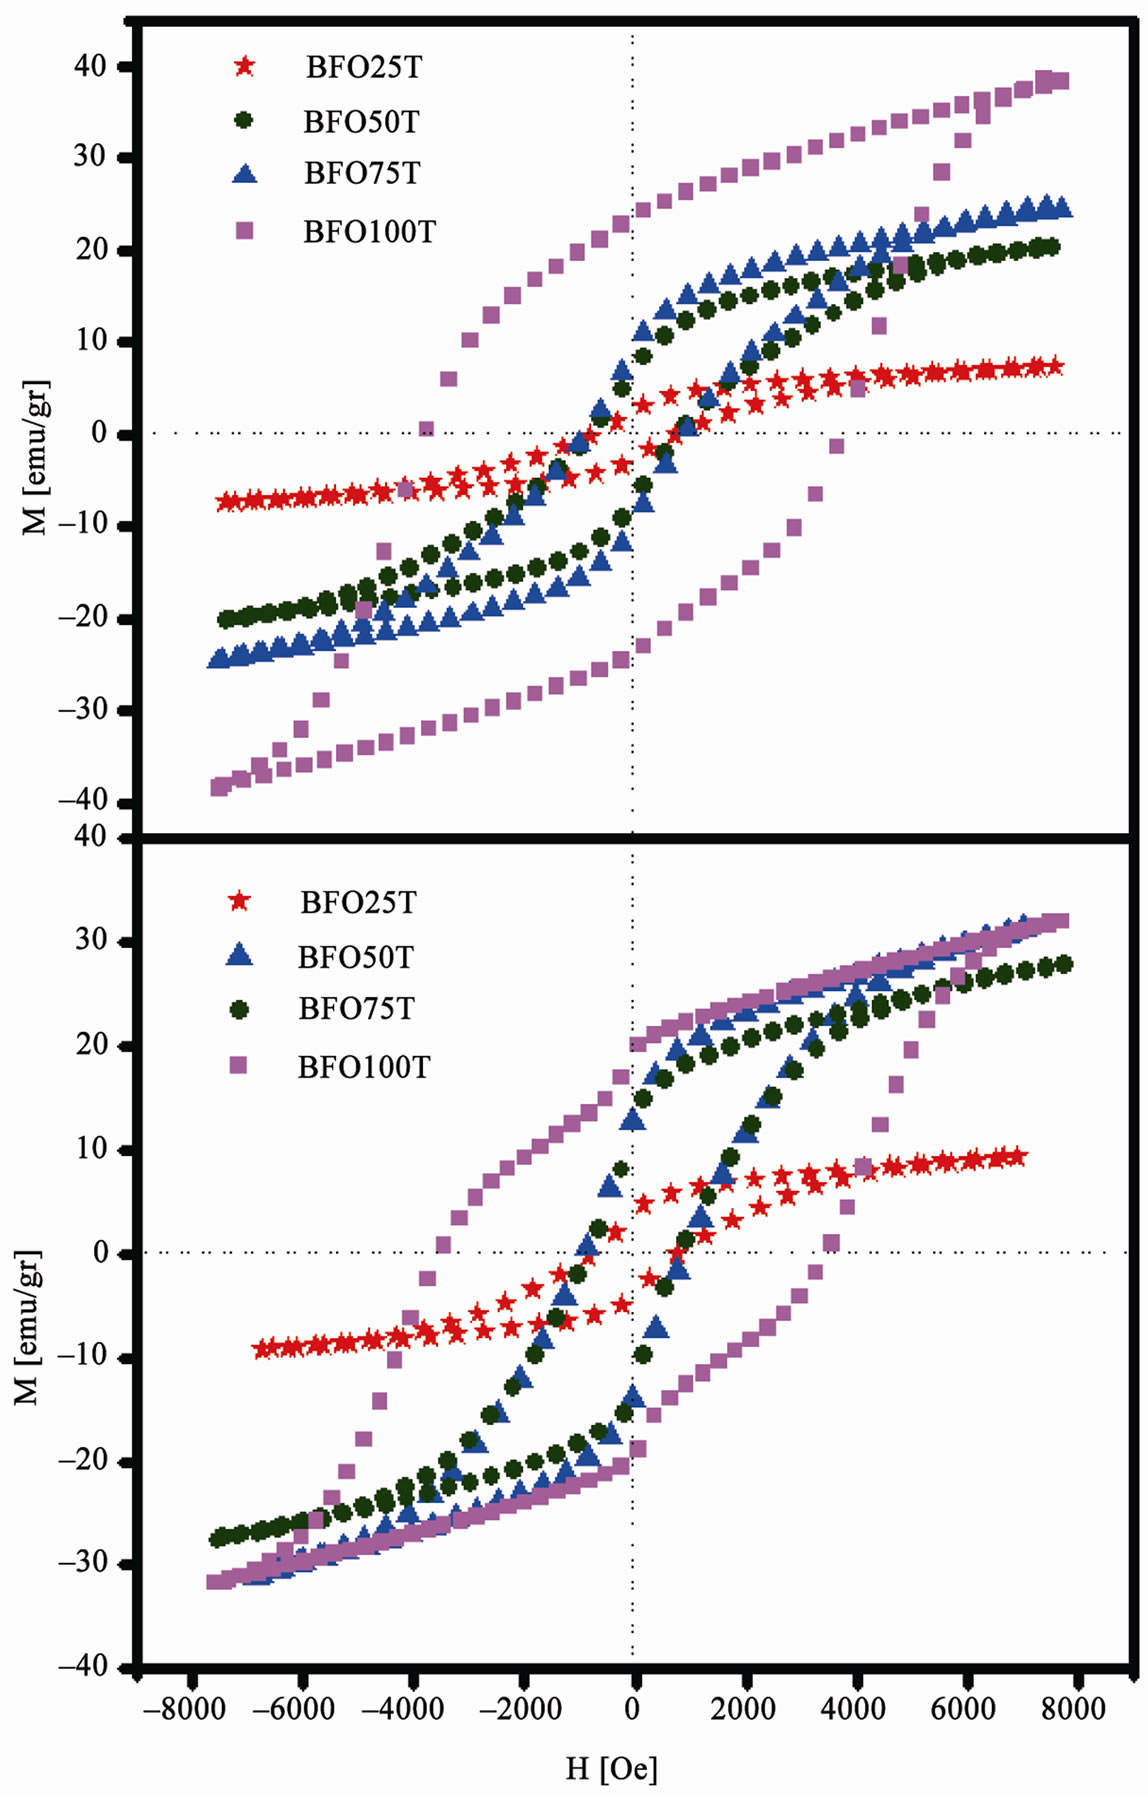
Figure 7. Magnetic hysteresis loops for (a) TEOS and (b) Glycerin samples.
and the spinel ferrite, which is found for a small percentage and is anti-ferromagnetic. The presence of this extra phase can induce a lowering in the coercivity of the material. This anomalous shape is better observed in the glycerin series loops.
The hysteresis loops show a narrowing behavior by adding SBN. The present material coercivity is reduced as a function of SBN in the composite. And this is coherent because SBN is not magnetic, therefore it is not able to respond to any magnetic stimulation. No response by SBN to magnetic fields causes the lowering in all magnetization parameters. Another important fact is the increase of the ferrite grain size for the composite samples. Depending on the size of the grain, only multi-domains microstructure will be formed and this will lead to a decrease in coercivity and coercive fields, due to the easier domain-wall motion in the multi-domain environment [6,24]. The values of reminisce magnetization, saturation magnetization and coercive fields are shown in Table 5. We can see that no strong deviation was observed from TEOS to PVA series. Glycerin series show a little quantitative difference, but follow the same qualitative behavior. Once again, samples density plays an important role of defining the denser samples with higher magnetization parameters and coercive fields. Similar results were reported by Ogasawara and Oliveira [25].
It is known that a good crystalline structure leads to a better magnetization where temperature and dwell time are parameters that strongly influence the enhancement of crystalline structure [6]. Although some works reports high coercicivity and coercive fields (>5 KOe) for barium hexaferrite [16,26], this was not observed in this present work because high synthesis temperature used here allows a growth of crystallite size and the formation of multi-domain structures [25]. For the pure ferrite, the higher coercive field observed was 3.7 KOe and the higher magnetization of saturation was 38.3 emu/g, which is in good agreement with similar works [6,18,25].
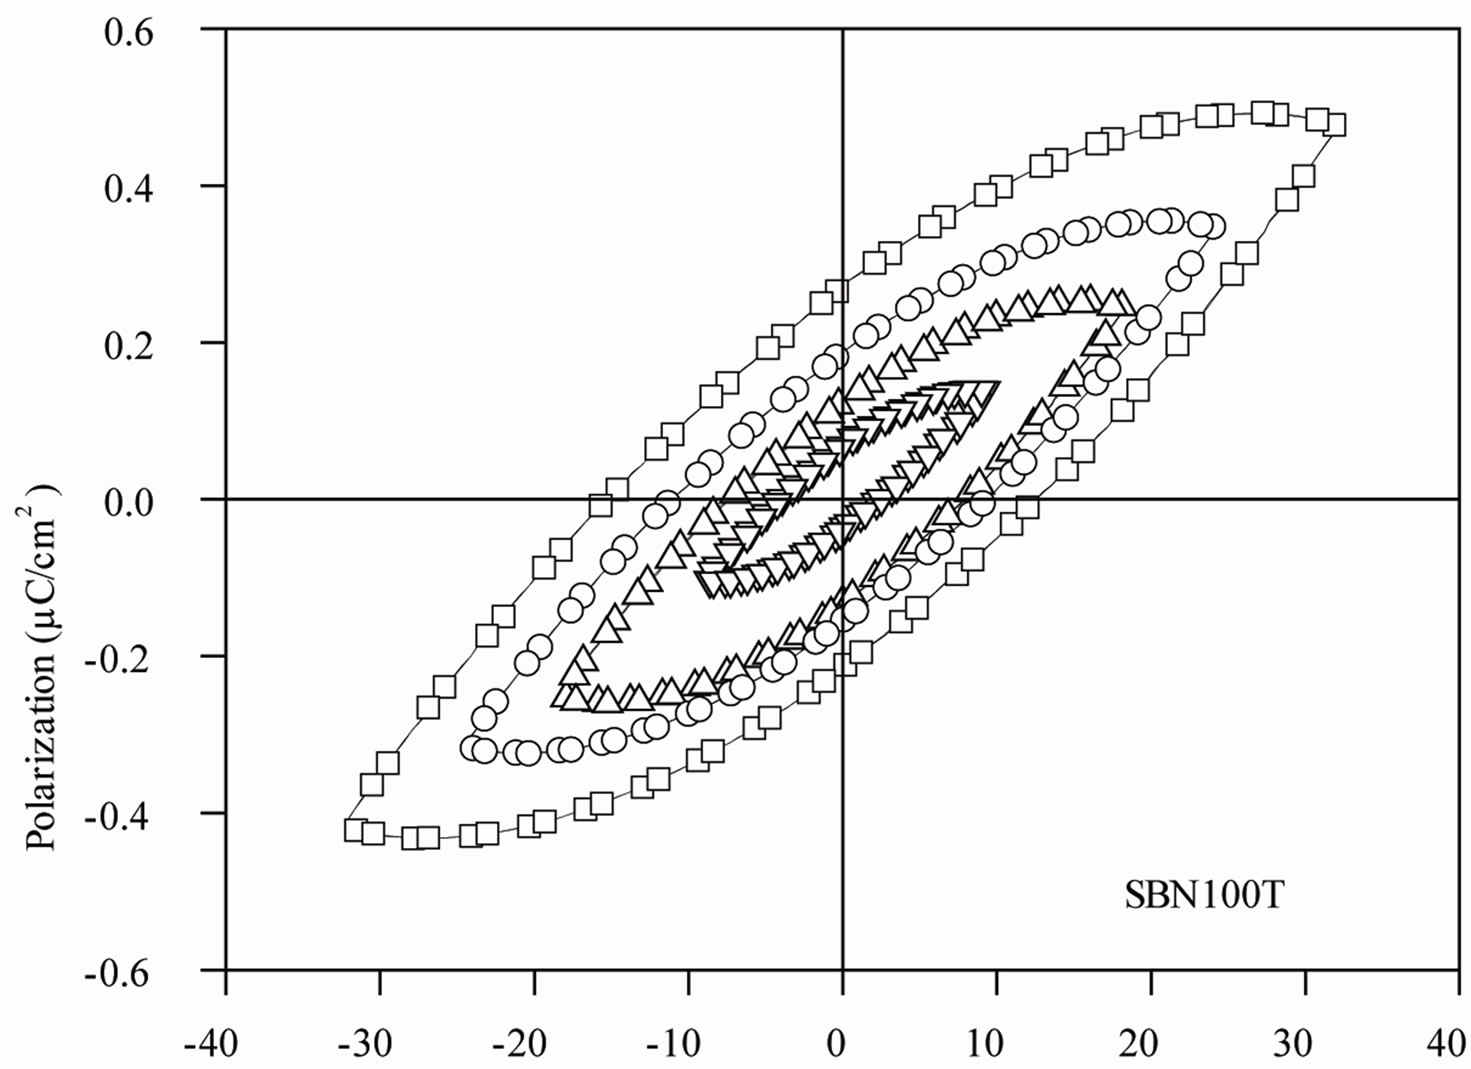
3.10. Electrical Hysteresis
Figure 8 shows P-E hysteresis loops, recorded at room temperature, at 1 Hz frequency, for the selected SBN100P, BFO25P, BFO50P and BFO75P composite samples. The hysteresis loops data are characteristic of a lossy linear capacitor, rather than a ferroelectric material. For the SBN100P the electric field amplitude was gradually increased to show that the polarization saturation tendency is not observed for this sample and as a consequence each hysteresis loop present essentially the same shape, as shown Figure 8(a).
The nonlinear P-E nature of a typical ferroelectric material is characterized by a hysteresis effect, in which the polarization trends to a saturation value for high electric field and the direction of the spontaneous polarization can be reversed by an external applied electric field. On the other hand, a P-E linear behavior is typically observed for normal dielectric or paraelectric materials. As the SBN100P sample was prepared from pressed SBN powders, the P-E behavior observed in Figure 8(a) can be due to typical defects of a non sintered sample. In contrast, the BFO addition at the composite composition is expected to increase the conductivity and consequently a linear P-E behavior could be observed as shown Figure 8(b). Thus, the spontaneous polarization values shown in Figure 8 do not correspond to the absolute values of the studied samples.
4. Conclusions
In this paper a study of the magnetic and dielectric properties of composites based on M-type barium hexaferrite BFO (BaFe12O19) and SBN (SrBi2Nb2O9) is presented. The magneto-dielectric matrix composite (SrBi2Nb2O9)x (BaFe12O19)100–x, (x = 0,25,50,75 and 100 wt%) were prepared by a new procedure using the solid state reaction method.
A study of the effects of an organic group of binders
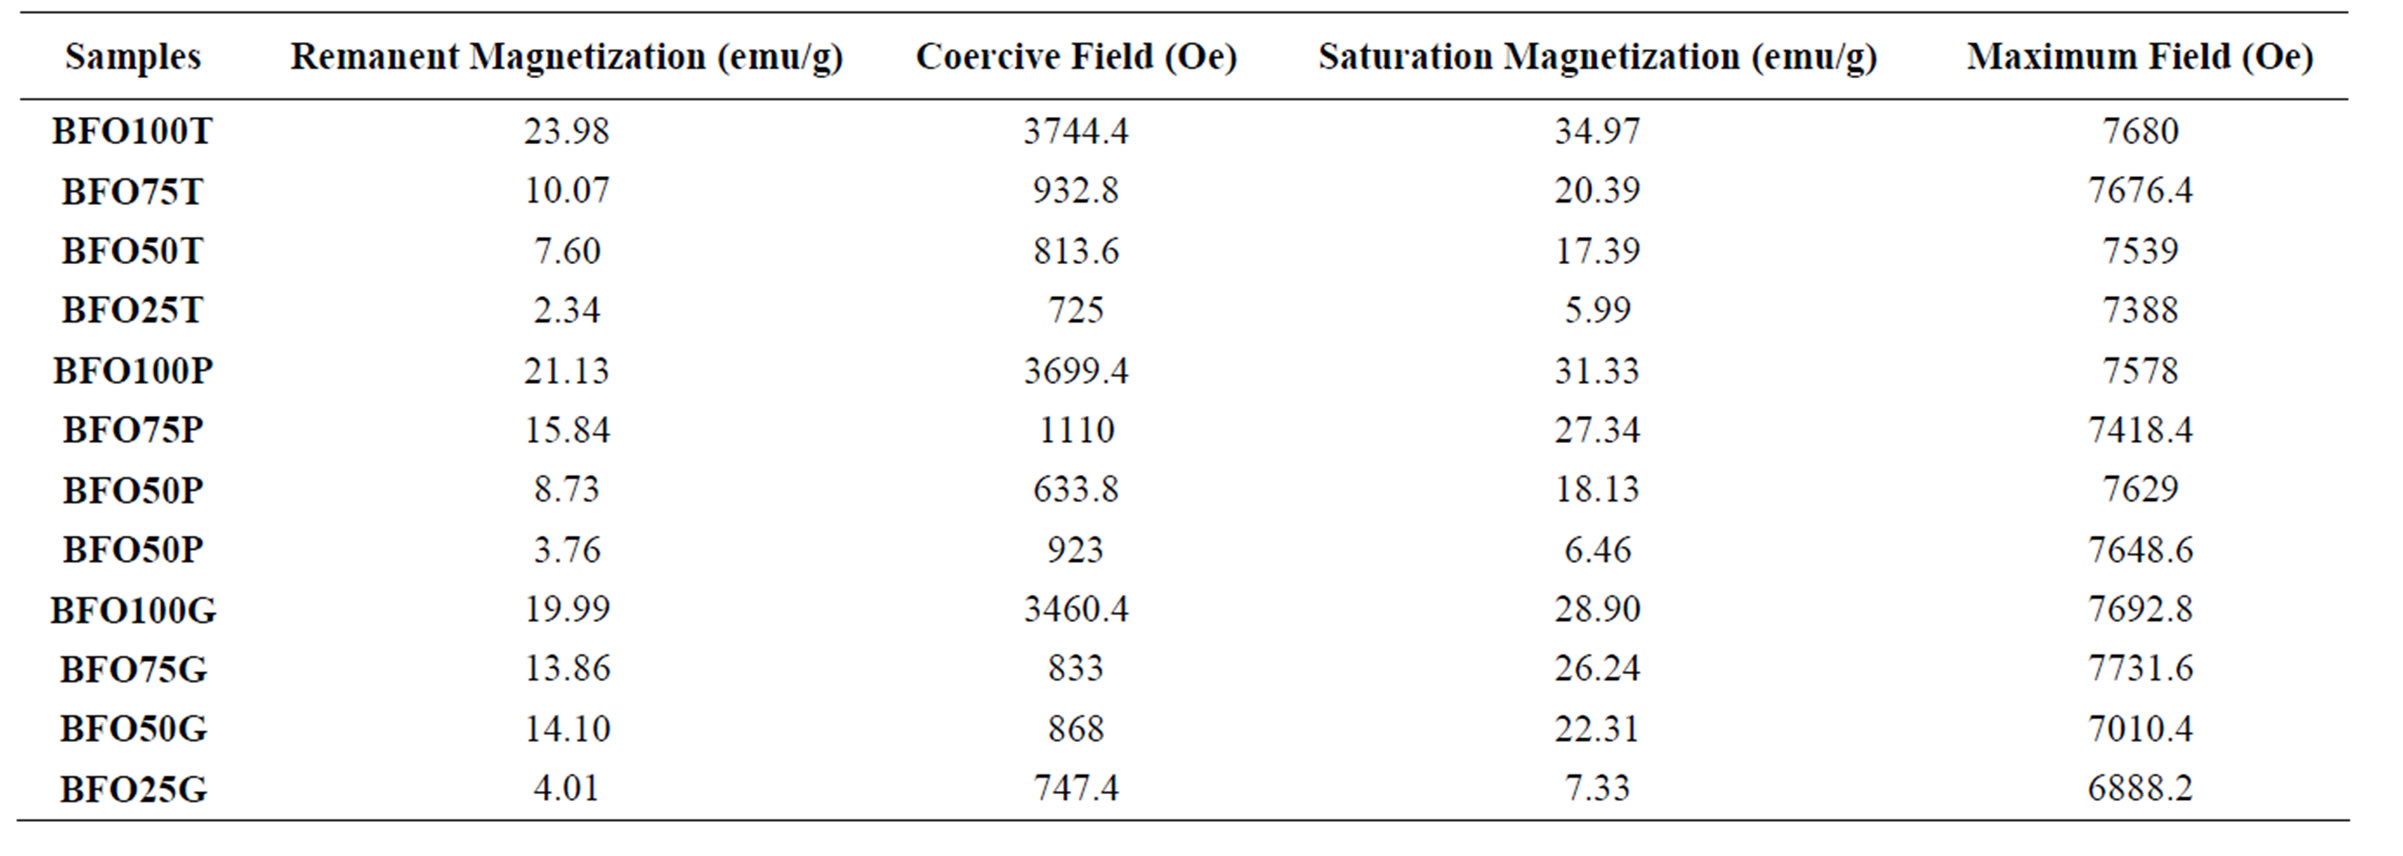
Table 5. Magnetic Hysteresis parameters of the samples.
 (a)
(a)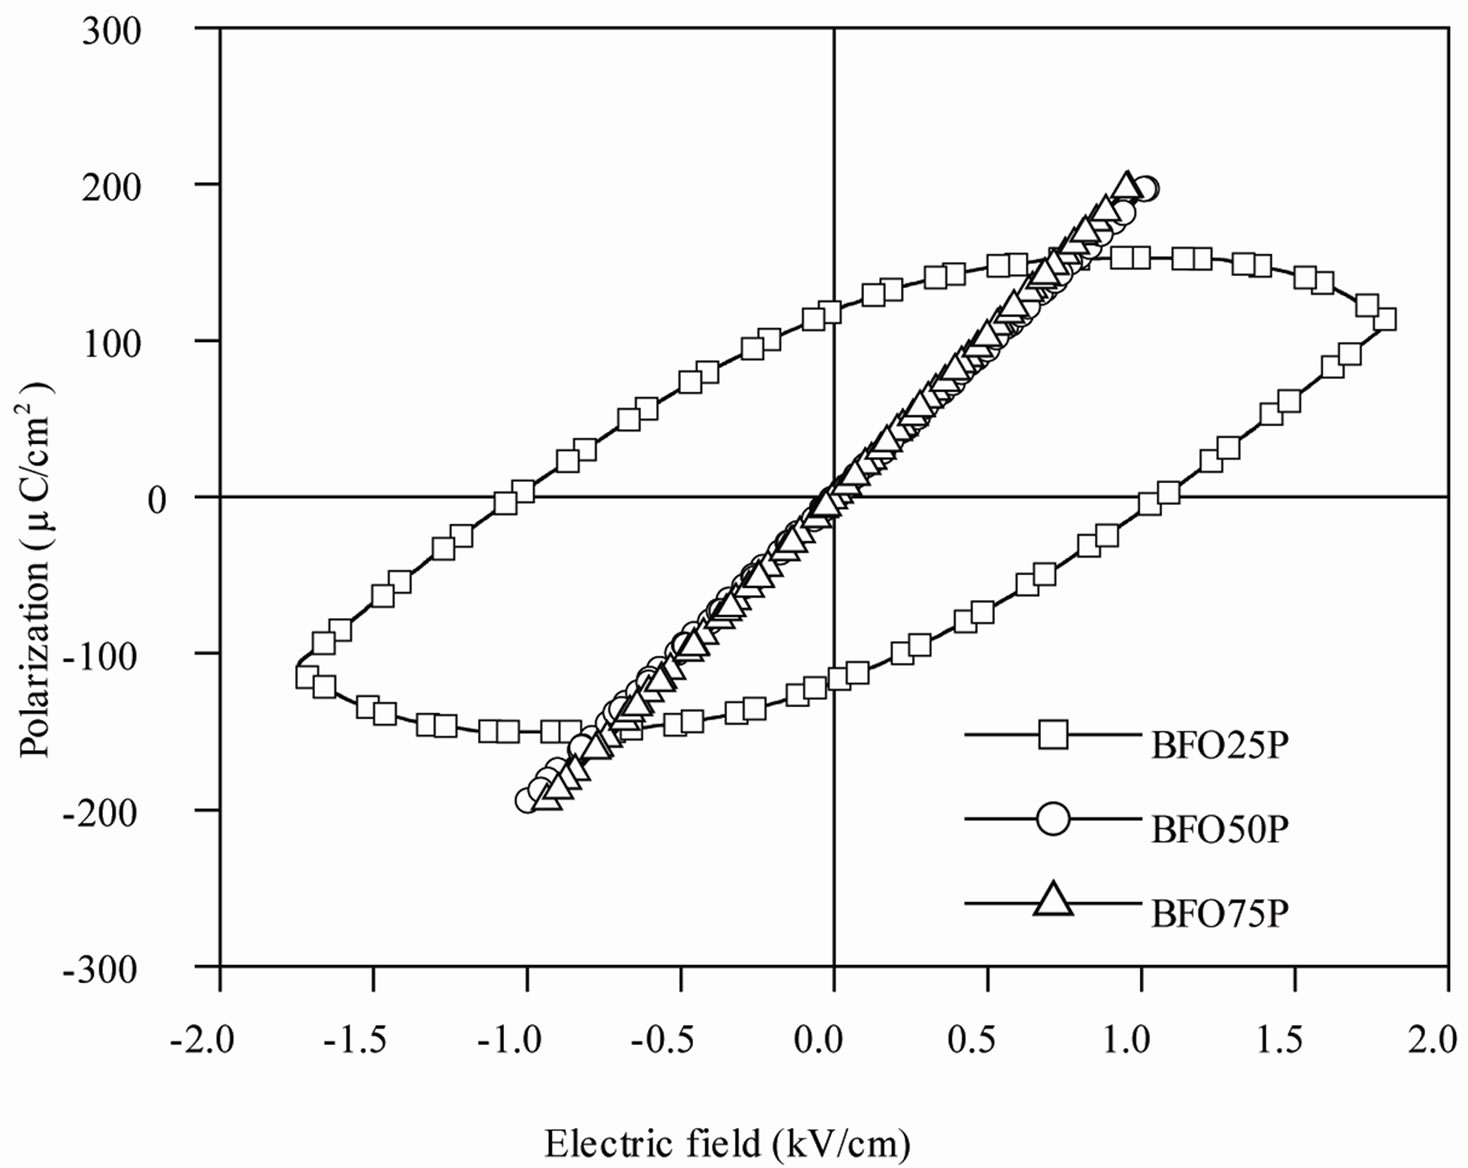 (b)
(b)
Figure 8. Electric hysteresis loops recorded at 1 Hz frequency for (a) SBN100T sample and (b) BFO25P, BFO50P and BFO75P composites.
(TEOS, PVA and glycerin) on the structural properties of the ceramic-matrix composites was also investigated.
SEM micrographics have revealed a good densification and a grain size ordered microns. The relative densities achieved with TEOS as a binder were above 80% for all samples, showing that TEOS is a better binder to this ceramics. It was also observed that density and grain size strongly influences the magnetic and electrical properties, in general, denser samples show better electric and magnetic properties.
A complex behavior was observed for loss tangent over the radiofrequency range, which means that less lossy samples could not help keeping this characteristic over entire frequency range. The magnetic hysteresis loops showed that composite samples preserve the ferrimagnetism for hexaferrite when SBN is added to the composite, although they become less coercive. For electric hysteresis the density of the samples are not high enough to define the true behavior of ferroelectricity in composite samples. For further works, the properties over microwave frequency range, thermal influences on the dielectric properties will be investigated for possible applications of the specimen.
5. Acknowledgements
This work was partly sponsored by CAPES, CNPq, FUNCAP (Brazilian agencies) and the U. S. Air Force Office of Scientific Research (AFOSR) (FA9550-11-1- 0095). The support from Fondecyt 1080164; Núcleo Milenio Magnetismo Básico y Aplicado; and CONICYT under Proyecto BASAL FB0807, is gratefully acknowledged.
REFERENCES
- V. Shrivastava, A. K. Jha and R. G. Mendiratta, “Dielectric Studies of La and Pb Doped SrBi2Nb2O9 Ferroelectric Ceramic,” Materials Letters, Vol. 60, No. 12, 2006, pp. 1459-1462. doi:10.1016/j.matlet.2005.11.045
- V. Shrivastava, A. K. Jha and R. G. Mendiratta, “Structural and Electrical Studies in La-Substituted SrBi2Nb2O9 Ferroelectric Ceramics,” Physica B: Condensed Matter, Vol. 371, No. 2, 2006, pp. 337-342. doi:10.1016/j.physb.2005.10.131
- R. R. Das, P. B., W. Pérez and R. S. Katiyar, “Effect of Ca on Structural and Ferroelectric Properties of SrBi2Ta2- O9 and SrBi2Nb2O9 Thin Films,” Ceramics International, Vol. 30, No. 7, 2004, pp. 1175-1179. doi:10.1016/j.ceramint.2004.03.029
- A. Mali and A. Ataie, “Structural Characterization of NanoCrystalline BaFe12O19 Powders Synthesized by Sol-Gel Combustion Route,” Scripta Materialia, Vol. 53, No. 9, 2005, pp. 1065-1070. doi:10.1016/j.scriptamat.2005.06.037
- S. S. Fortes, J. G. S. Duque and M. A. Macedo, “Nanocrystals of BaFe12O19 Obtained by the Proteic Sol-Gel Process,” Physica B: Condensed Matter, Vol. 384, No. 1-2, 2006, pp. 88-90. doi:10.1016/j.physb.2006.05.158
- U. Topal, H. Ozkan and H. Sozeri, “Synthesis and Characterization of Nanocrystalline BaFe12O19 Obtained at 850˚C by Using Ammonium Nitrate Melt,” Journal of Magnetism and Magnetic Materials, Vol. 284, 2004, pp. 416-422. doi:10.1016/j.jmmm.2004.07.009
- B. S. Zlatkov, M. V. Nikolic, O. Aleksic, H. Danninger and E. Halwax, “A Study of Magneto-Crystalline Alignment in Sintered Barium Hexaferrite Fabricated by Powder Injection Molding,” Journal of Magnetism and Magnetic Materials, Vol. 321, No. 4, 2009, pp. 330-335. doi:10.1016/j.jmmm.2008.09.014
- N. Ortega, P. Bhattacharya and R. S. Katiyar, “Enhanced Ferroelectric Properties of Multilayer SrBi2Ta2O9/SrBi2- Nb2O9 Thin Films for NVRAM Applications,” Materials Science and Engineering B, Vol. 130, No. 1-3, 2006, pp. 36-40. doi:10.1016/j.mseb.2006.02.006
- J. Kreisel, G. Lucazeau and H. Vincent, “Raman Spectra and Vibrational Analysis of BaFe12O19 Hexagonal Ferrite,” Journal of Solid State Chemistry, Vol. 137, No. 1, 1998, pp. 127-137.
- L. B. Kong, T. S. Zhang, J. Ma and F. Boey, “Progress in Synthesis of Ferroelectric Ceramic Materials via HighEnergy Mechanochemical Technique,” Progress in Materials Science, Vol. 53, No. 2, 2008, pp. 207-322. doi:10.1016/j.pmatsci.2007.05.001
- H.-F. Yu and H.-Y. Lin, “Preparation and Thermal Behavior of Aerosol-Derived BaFe12O19 Nanoparticles,” Journal of Magnetism and Magnetic Materials, Vol. 283, No. 2-3, 2004, pp. 190-198. doi:10.1016/j.jmmm.2004.05.020
- T. González-Carreño, M. P. Morales and C. J. Serna, “Barium Ferrite Nanoparticles Prepared Directly by Aerosol Pyrolysis,” Materials Letters, Vol. 43, No. 3, 2000, pp. 97-101. doi:10.1016/S0167-577X(99)00238-4
- F. M. M. Pereira, C. A. R. Junior, M. R. P. Santos, R. S. T. M. Sohn, F. N. A. Freire, J. M. Sasaki, J. A. C. de Paiva and A. S. B. Sombra, “Structural and Dielectric Spectroscopy Studies of the M-Type Barium Strontium Hexaferrite Alloys (Ba x Sr1-x Fe12O19),” Journal of Materials Science: Materials in Electronics, Vol. 19, No. 7, 2008, pp. 627-638. doi:10.1007/s10854-007-9411-5
- V. K. Sankaranarayanan and D. C. Khan, “Mechanism of the Formation of Nanoscale M-Type Barium Hexaferrite in the Citrate Precursor Method,” Journal of Magnetism and Magnetic Materials, Vol. 153, No. 3, 1996, pp. 337- 346. doi:10.1016/0304-8853(95)00537-4
- J. Li, W. Sturhahn, J. M. Jackson, V. V. Struzhkin, J. F. Lin, J. Zhao, H. K. Mao and G. Shen, “Pressure Effect on the Electronic Structure of Iron in (Mg,Fe)(Al,Si)O3 Perovskite: A Combined Synchrotron Mössbauer and XRay Emission Spectroscopy Study up to 100 GPa,” Physics and Chemistry of Minerals, Vol. 33, No. 8-9, 2006, pp. 575-585. doi:10.1007/s00269-006-0105-y
- G. Mendoza-Suárez, J. A. Matutes-Aquino, J. I. EscalanteGarcía, H. Mancha-Molinar, D. Ríos-Jara and K. K. Johal, “Magnetic Properties and Microstructure of Baferrite Powders Prepared by Ball Milling,” Journal of Magnetism and Magnetic Materials, Vol. 223, No. 1, 2001, pp. 55-62. doi:10.1016/S0304-8853(00)00583-7
- K. K. Mallick, P. Shepherd and R. J. Green, “Dielectric Properties of M-Type Barium Hexaferrite Prepared by Co-Precipitation,” Journal of the European Ceramic Society, Vol. 27, No. 4, 2007, pp. 2045-2052. doi:10.1016/j.jeurceramsoc.2006.05.098
- F. M. M. Pereira, M. R. P. Santos, R. S. T. M. Sohn, J. S. Almeida, A. M. L. Medeiros, M. M. Costa and A. S. B. Sombra, “Magnetic and Dielectric Properties of the MType Barium Strontium Hexaferrite (Ba x Sr1-x Fe12O19) in the RF and Microwave (MW) Frequency Range,” Journal of Materials Science: Materials in Electronics, Vol. 20, No. 5, 2009, pp. 408-417. doi:10.1007/s10854-008-9744-8
- B. Harihara Venkataraman and K. B. R. Varma, “Frequency-Dependent Dielectric Characteristics of Ferroelectric SrBi2Nb2O9 Ceramics,” Solid State Ionics, Vol. 167, No. 1-2, 2004, pp. 197-202. doi:10.1016/j.ssi.2003.12.020
- C. Singh, S. B. Narang, I. S. Hudiara, K. Sudheendran and K. C. J. Raju, “Complex Permittivity and Complex Permeability of Sr Ions Substituted Ba Ferrite at X-Band,” Journal of Magnetism and Magnetic Materials, Vol. 320, No. 10, 2008, pp. 1657-1665. doi:10.1016/j.jmmm.2007.11.002
- A. L. Ruoff, “Material Science,” Prentice Hall, Englewood Cliffs, 1973.
- A. K. Jonscher, “Dielectric Relaxation in Solids,” Journal of Physics D: Applied Physics, Vol. 32, No. 14, 1999, pp. 57-70. doi:10.1088/0022-3727/32/14/201
- C. G. Koops, “On the Dispersion of Resistivity and Dielectric Constant of Some Semiconductors at Audiofrequencies,” Physical Review, Vol. 83, No. 1, 1951, pp. 121- 124. doi:10.1103/PhysRev.83.121
- J.-Y. Yu, S.-L. Tang, L. Zhai, Y.-G. Shi and Y.-W. Du, “Synthesis and Magnetic Properties of Single-Crystalline BaFe12O19 Nanoparticles,” Physica B: Condensed Matter, Vol. 404, No. 21, 2009, pp. 4253-4256. doi:10.1016/j.physb.2009.08.043
- T. Ogasawara and M. A. S. Oliveira, “Microstructure and Hysteresis Curves of the Barium Hexaferrite from CoPrecipitation by Organic Agent,” Journal of Magnetism and Magnetic Materials, Vol. 217, No. 1-3, 2000, pp. 147-154. doi:10.1016/S0304-8853(00)00080-9
- J. Ding, D. Maurice, W. F. Miao, P. G. McCormick and R. Street, “Hexaferrite Magnetic Materials Prepared by Mechanical Alloying,” Journal of Magnetism and Magnetic Materials, Vol. 150, No. 3, 1995, pp. 417-420. doi:10.1016/0304-8853(95)00279-0
- Y.-Q. Qu, A.-D. Li, Q.-Y. Shao, Y.-F. Tang, D. Wu, C. L. Mak, K. H. Wong and N.-B. Ming, “Structure and Electrical Properties of Strontium Barium Niobate Ceramics,” Materials Research Bulletin, Vol. 37, No. 3, 2002, pp. 503-513. doi:10.1016/S0025-5408(02)00676-1
NOTES
*Corresponding author.