Journal of Modern Physics
Vol. 2 No. 9 (2011) , Article ID: 7132 , 10 pages DOI:10.4236/jmp.2011.29111
First Principles Studies on the Electronic Structure and Band Structure of Paraelectric SrTiO3 by Different Approximations
Department of Physics, University of Shahid Chamran, Ahvaz, Iran
E-mail: salehi_h@scu.ac.ir
Received April 3, 2011; revised May 29, 2011; accepted June 16, 2011
Keywords: Electronic Structure, SrTiO3, WIEN2k, FP-LAPW, DFT, GGA
ABSTRACT
The electronic structure, energy band structure, total density of states (DOS) and electronic density of perovskite SrTiO3 in the cubic phase are calculated by the using full potential-linearized augmented plane wave (FP-LAPW) method in the framework density functional theory (DFT) with the generalized gradient approximation (GGA) by WIEN2k package. The calculated band structure shows a direct band gap of 2.5 eV at the Γ point in the Brillouin zone.The total DOS is compared with experimental x-ray photoemission spectra. From the DOS analysis, as well as charge-density studies, I have conclude that the bonding between Sr and TiO2 is mainly ionic and that the TiO2 entities bond covalently.The calculated band structure and density of state of SrTiO3 are in good agreement with theoretical and experimental results.
1. Introduction
Ferroelectric and related materials having chemical formula ABO3 have been the subject of extensive investigation, both because of their technical importance and because of the fundamental interest in the physics of their phase transitions [1]. Within this family of materials, one finds transitions to a wide variety of low-symmetry phases, ranging from non-polar antiferrodistortive to polar ferroelectric and antiferroelectric transitions.The ideal structure is cubic perovskite,where the A and B cations are arranged on a simple cubic lattice and the O ions lie on the face centers nearest the (typically transition metal) B cations.Thus the B cations are at the center of O octahedral, while the A cations lie at larger twelvefold-coordinated sites. This ideal structure displays a wide variety of structural instabilities in the various materials. These may involve rotations and distortions of the O octahedra as well as displacements of the cations from their ideal sites. The interplay of these instabilities accounts for the rich variety of ferroelectric and antiferroelectric behaviours. SrTiO3 in this class has been the subject of ongoing theoretical and experimental studies because of its unusual dielectric property which deviates from those of other ABO3 perovskites. While it has the simple cubic structure at high temperature, SrTiO3 goes through an AFD transition at 105 K to a tetragonal phase in which the oxygen octahedra have rotated by a smal angle along the c-axis in opposite senses in neighbouring unit cells. These titanates have recently attracted the attention of many researchers because some titanates are practically used as ferroelectric, electroconductive, photorefractive and photovoltaic materials. It is well known that these applications are based on electrical and optical properties of the materials, and the properties result from their electronic structures. Therefore, an understanding of the electronic structure of the materials is fairly important to improve the electrical or optical functions for their new applications. Investigations have been carried out to study the structural [2], dielectric [3], optical [4,5] and elastic [6] properties, and the infrared [7,8] as well as electron paramagnetic resonance [9] spectra of SrTiO3. Although various properties [10-15] of SrTiO3 have been investigated, a systematic theoretical study of the optical properties based upon first-principles band structure calculations is still lacking. In the present study, the electronic structure, density of state and electronic density of SrTiO3 in the paraelectric phase are calculated by the FPLAPW method with the DFT in GGA [16,17] Recently, king-Smith and Vanderbilt performed a systematic study of structural and dynamical properties and energy surfaces for eight common perovskites, using the first-principles ultrasoft-pseudopotential method and the density approximation (LDA) [18,19]. Finally, the calculated results are compared with available experimental data [5,20].
2. The Calculation Method
The paraelectric phase of SrTiO3 has the ideal cubic pm3m perovskite structure, in which the oxygen octahedron contain a Ti atom at its center. The calculations have been performed considering the origin of the cell to be at the Sr site, Ti at the body-center (0.5,0.5,0.5)a and the three O atoms at the three face centres (0.5,0.5,0.0)a, (0.0,0.5,0.5)a and (0.5,0.0,0.5)a. The lattice constant is 7.38a.u, taken from the experimental results of Wyckoff [21]. Figure 1(a) shows the unit cell and Figure 1(b) the Brilluoin zone of SrTiO3 for this structure.
The electronic structure, band structure, DOS and electronic density in cubic crystal SrTiO3 are studied using the Wien2k package [22]. This employs the FP-LAPW method in the framework of the DFT with the GGA for solving the kohn-Sham equation [16,17]. In this method no shape approximation on either potential or the electronic charge density is made. In this method valence and core states origin energy have been separate, and –6 Ry energy bound separated between valence electrons and
 (a)
(a)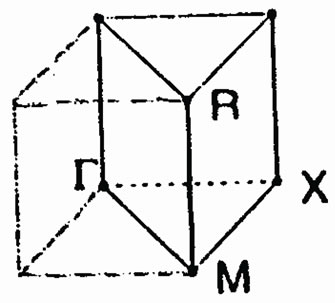 (b)
(b)
Figure 1. (a) The cubic unit cell of SrTiO3. (b) The Brillouin zone for the cubic SrTiO3.
core states was chosen. The convergence parameter Rkmax, which controls the size of the basis sets in these calculations, was set to 7.0. I used  meshes which represent 400 k points in the first Brillouin zone Integrations in reciprocal space Ire performed using the special points method. I used meshes which represent 400 k-points in the first BZ. This corresponds to 20 special k-points in the irreducible idge for the cubic structure.
3. Results
3.1. Electronic Structure
For calculating the lattic constant theoritically, the base—state energy of SrTiO3 is calculated for different volumes around balance valume of each case and partial changees around balance valume and method given. In this program, energy changes in valume are given by mornagone state equation.The total energy as a function of the volume for SrTiO3 is shown in Figure 2. Then, by given mornagone equation in different approximations lattice constant, bulk modulue, condensation, base—state energy of crystall and are calculated with LDA and GGA. The results are compared with other experimental and theoretical datas shown in Table 1.
Electronic structure shows in Figure 2 was calculated by using the lattice constant 7.38 a.u., taken from the experimental results of Wyckoff [21]. The distances between the nearest atoms are shown in Table 2 for cubic SrTiO3. These lengths for experimental and theoretical results, are equal, and do not depend on the exchange correlation potentials. The effective charges on the three Sr, Ti and O atoms are shown in Table 3 and are very close to the value of the ionic charge.
3.2. Band Structure
The crystal structure of SrTiO3 in the paraelectric phase has been studied experimentally using various techniques [3-5,8,19,23]. This provides us with the structural parameters needed in our work and also the basis for comparison of the final results. Here in we calculations my used 400 k-points. The value for the convergence parameter taken to be, Rkmax = 7. This is a parameter in the package that its right choice determines the stability and convergence of the calculations. The value of the parameter Rkmax controls the size of the basis sets in these calculations. The value of Rkmax for the systems studied, was chosen to be 7. Integrations in reciprocal space Ire performed using the special points method. I used kmeshes  which represent 400 k-points in the first BZ. This corresponds to 20 special k-points in the irreducible Idge for the cubic structure. The calculated
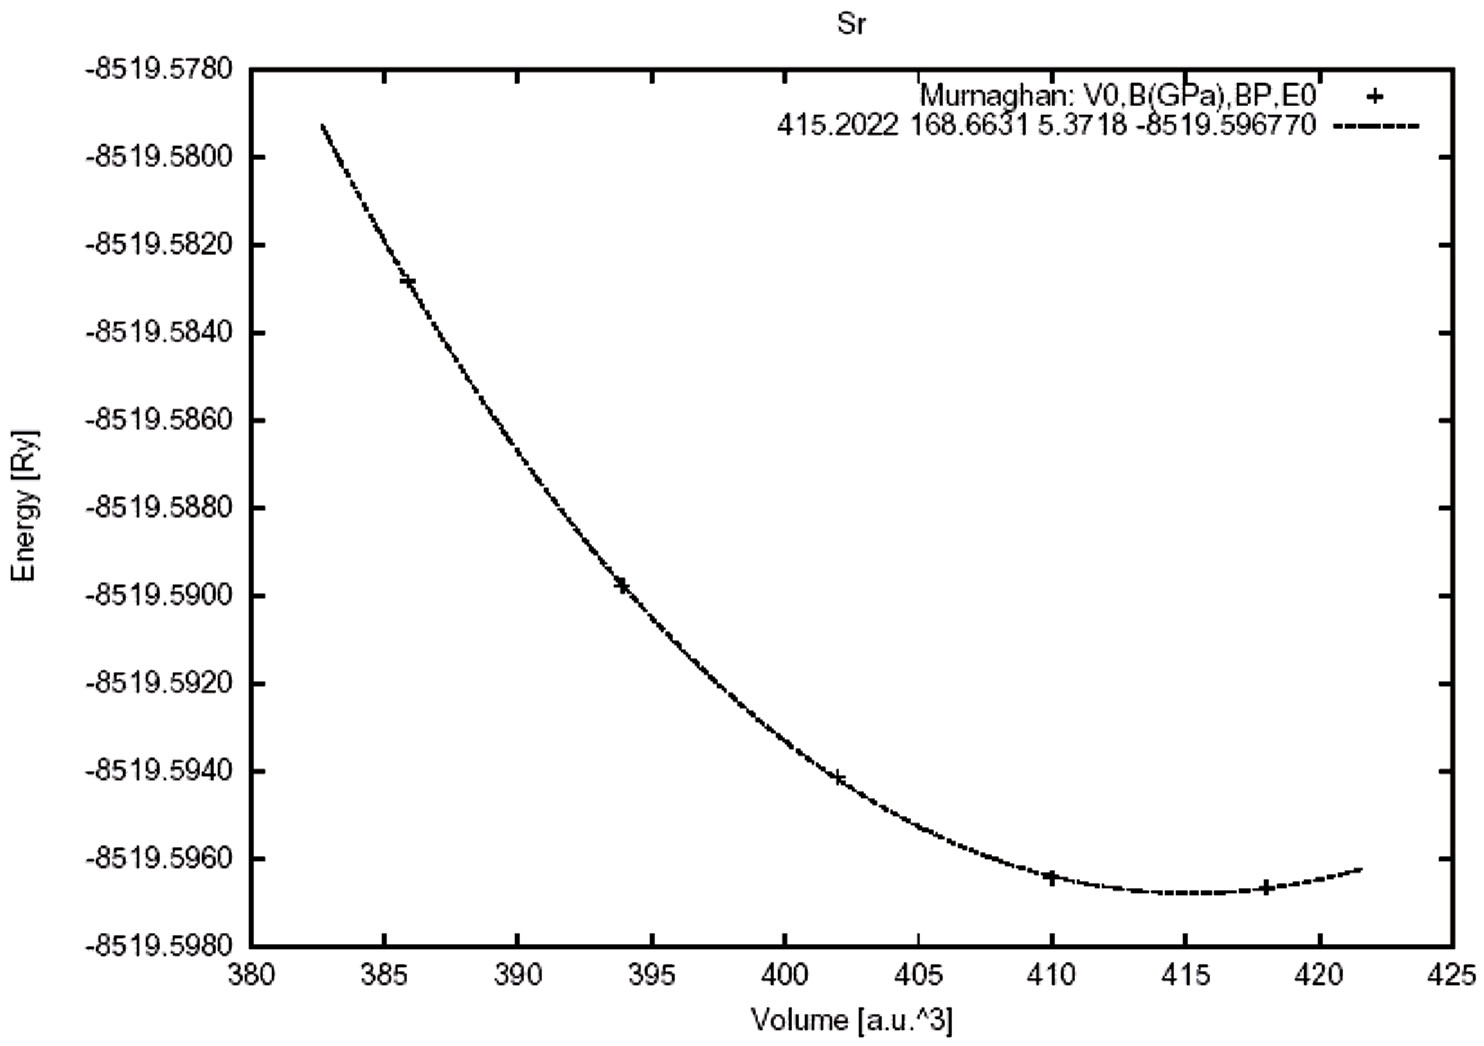
Figure 2. Total energy as a function of the volume for cubic SrTiO3.
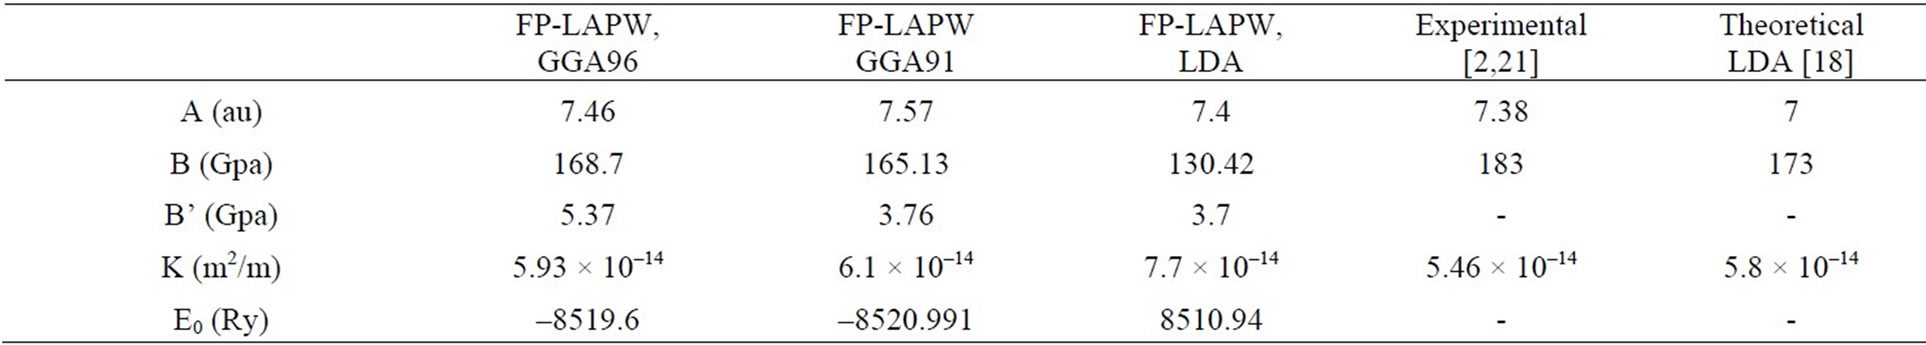
Table 1. Structure parameters calculated in this work compared it with other results for cubic SrTiO3.

Table 2. A compartion of the nearest distant between atoms for cubic SrTiO3.

Table 3. Effective charge calculated in this work compared other results for cubic SrTiO3.
electronic band structure of the cubic phase of SrTiO3 in the high symmetry directions in the Brillouin zone is shown in Figure 2. In the Figure 1 find a large dispersion of the bands. Nine valence bands are derived from O 2p orbitals. These are separated by a direct gap 2.5 eV (at the Γ-point) from the transition metal d-derived conduction band. Figure 3 shows that the FP-LAPW method yielded an direct band gap of 2.5 eV which is lower the experimentally reported value of 3.2 eV for SrTiO3. The origin of this discrepancy may be the GGA. The nine valence bands at the G-point are the three triply degenerate level (Γ15, Γ25 and Γ15) separated by energies of 1 eV (Γ25 - Γ15) and 1.6 eV (Γ15 - Γ25). The crystal field and the electrostatic interaction between oxygen 2p orbital produce these splitting. In the conduction band the triply (Γ25′) and doubly (Γ12) degenerate levels represent t2g and eg states of Ti 3d orbital separated by energy of 2.3 eV. A visual comparison of our band structure results with the result of reference [23] on SrTiO3 shows direct band gap at the Γ point using the first—principles tight-binding linearized muffin-tin orbital (TB-LMTO) method (1.4 eV) lower than by the FP-LAPW method. The zero of the energy was set at the top of the valence band and the energy scale is in eV. The electronic structure in Figure 2 was calculated using the experimental lattice constant (a). The bottom of the valence band is mainley contribution of from Sr 3p orbitals.The bands at around –16 eV originate from O 2s orbitals.Nine valence bands near Fermi level between 0.0 and 4.7 eV are derived from O 2p orbitals. It is to be noted that in the case of BaTiO3 the Ba 5p state and in SrTiO3 the Sr 4p state appear at higher energy than O 2s state whereas in the case of CaTiO3 the O 2s state appears at higher energy than Ca 3p state. The band gap value for SrTiO3 in the cubic phase calculated in this work, and the values obtained by other methods are summarized in Table 4.
3.3. Density of States
The electron distribution in an energy spectrum is described by the density of states (DOS) and can be measured in photoemission experiments [24]. The total DOS spectrum of cubic SrTiO3 is shown in Figure 4, the valence and conduction band edges near the Fermi energy are quite sharp. This is consistent with the experimental
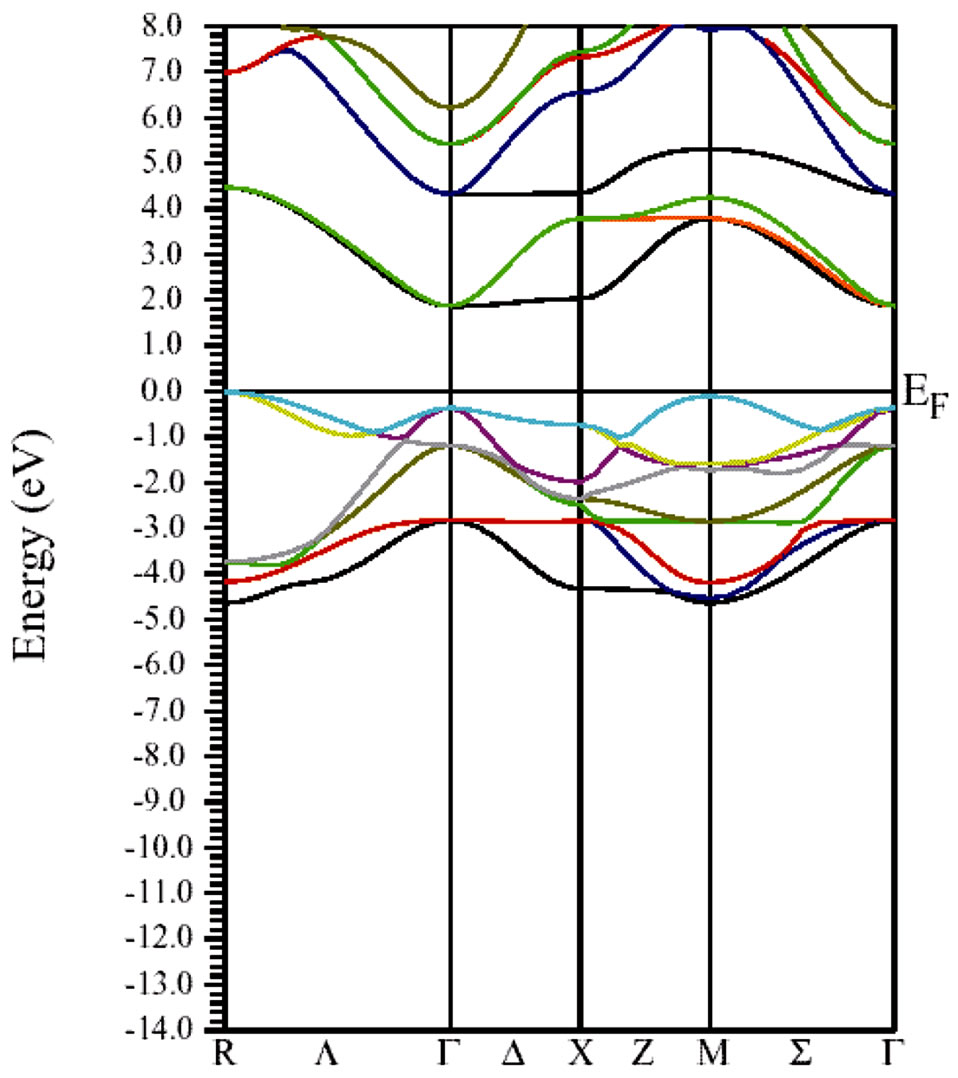
Figure 3. The calculated electronic energy-band structure of the Cubic SrTiO3. The zero of the energy was set at the top of the valence band.
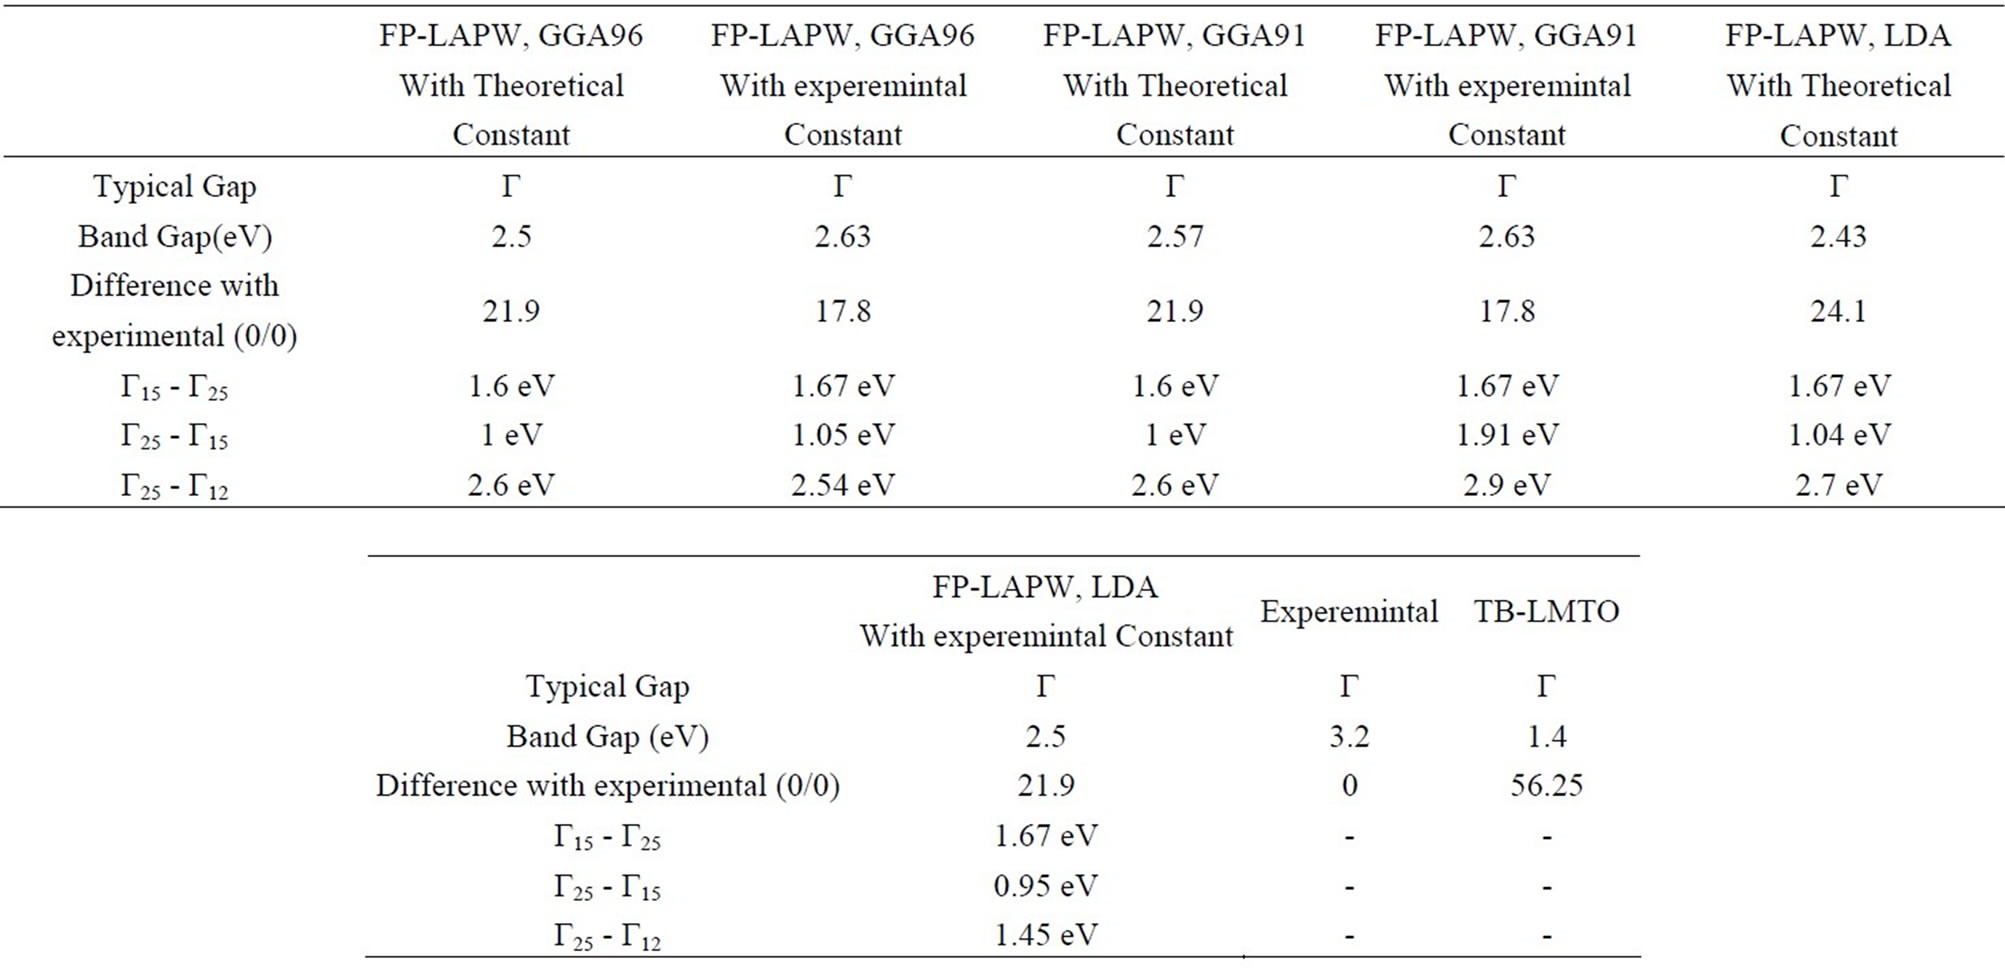
Table 4. The results for the band gap calculated by this method and others.
finding of a relatively sharp absorption edge in optical measurements of SrTiO3. Another very useful piece of information to examine is the hybridization and charge distribution
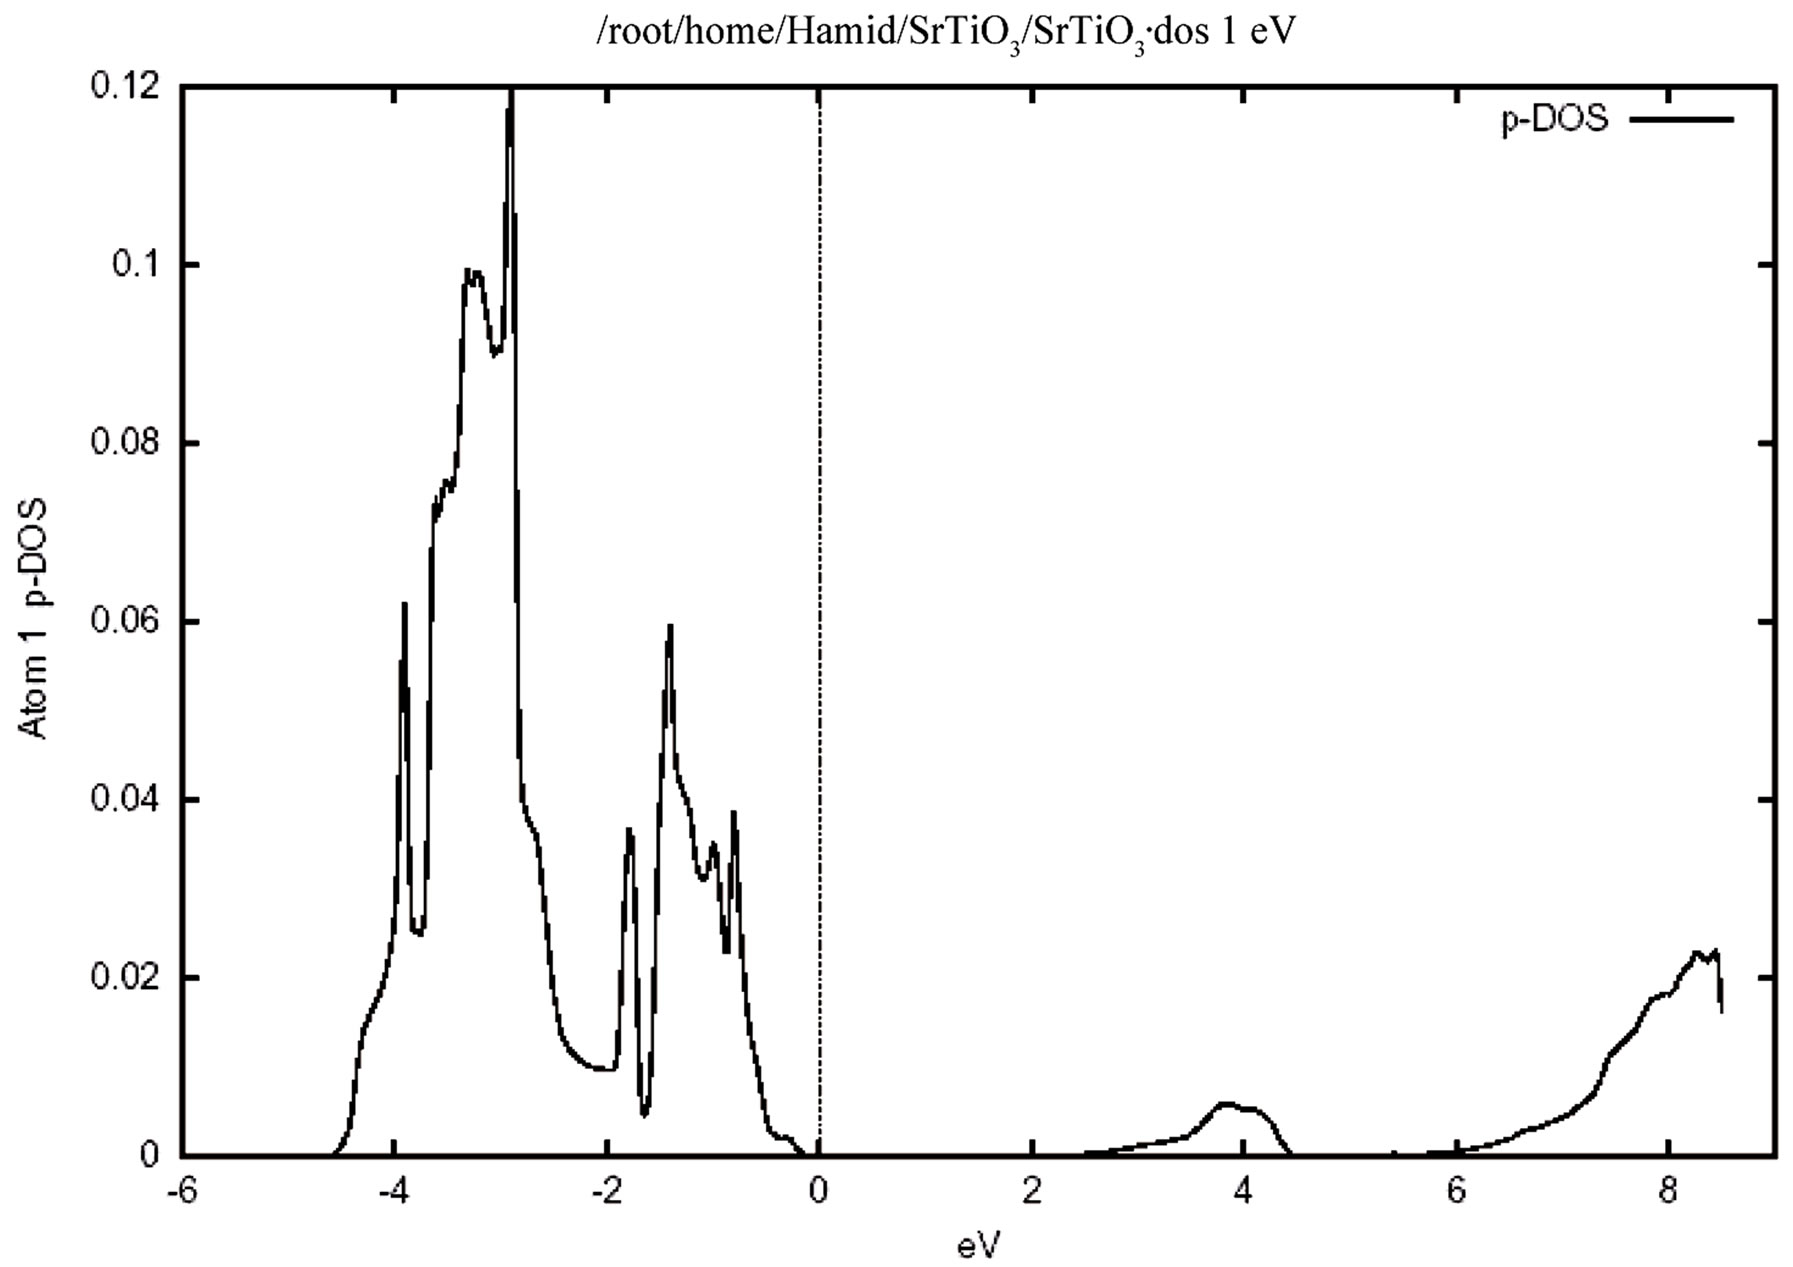
Figure 4 shows the total density of states for the valence and conduction band .In this figure the zero of the energy scale (the top of the valence band) shows the position of the Fermi level. To obtain a measure of the contribution of different atomic states in the band structure and also their possible hybridizations I made a detailed study of the partial density of the states. The study of the partial density of states showed that the hybridization of Ti 3d and oxygen 2p and their contribution to the states on the valence and conduction band. There is, however, only a very weak hybridization of the Sr P state with the O 2p state in the valence band. The major contribution around the conduction band edge is from the Ti 3d states with a small component from the O 2p states. The partial density of states (PDOS) of the Sr, Ti, and O atoms are shown in Figure 5. Where the low-energy peak at around –4 to –1 eV is a contribution mainly from the O 2p states with a small component from Ti p and Sr p orbitals. The valence states from –4.7 eV up to the Fermi energy are dominated by the O 2p states and strongly hybridized with the Ti 3d state. It should be pointed out that the PDOS spectrum in Figure 5 includes one Sr, one Ti atom, and three O atoms. Therefore the height of the O 2p DOS peak is much higher than that of the Ti 3d states.There exists a p-d hybridization as is evident from this figure.
A quick estimate suggest that there is only a very weak hybridization of the Sr p state with the O 2p state, but there is a very strong hybridization betIen Ti 3p and O 2p state in the valence band. This means that this system is not quite an ionic bond but it has rather a large covalency. There exists a p-d hybridization as is evident from this fiogure. The Ti 3d contribution is zero at the valence band maximum but rises with increasing binding energy. Conversely the O 2p contribution rises from zero at the conduction band minimum with increasing energy. This reflects the Ti 3d-O 2p covalency.
3.4. Electronic Charge Density
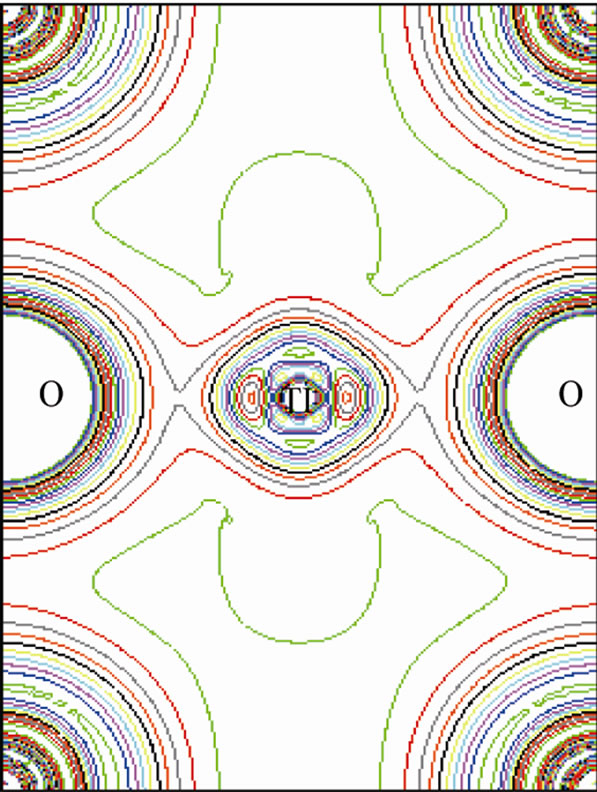
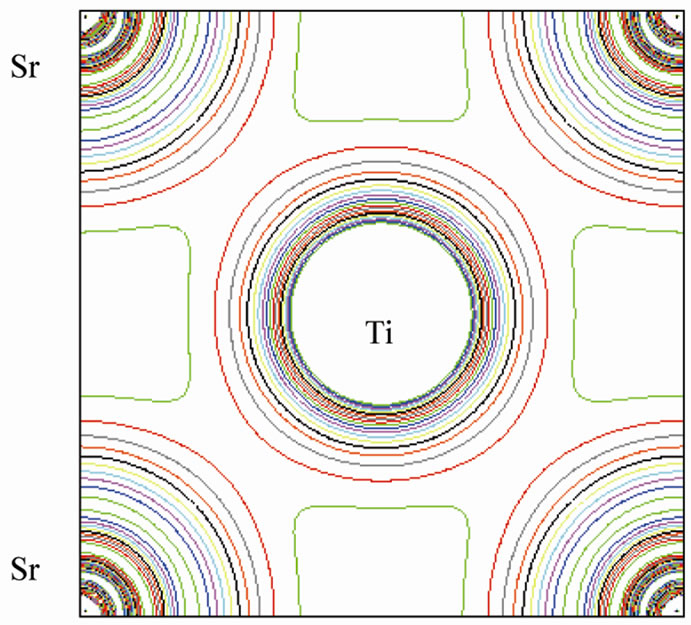
This is shown in Figure 6 for (110) plane. The electron density distribution indicated that the bond between Sr and TiO2 is ionic while between the Ti and O is covalent. To further study the charge distribution and also the nature of the chemical bonding, I calculated the electron charge density for the cubic phase of SrTiO3. The distribution of charge around the Sr site indicates that the bonding between Sr and TiO2 is mainly ionic. Further, the interatomic distance between the Ti and O is only 3.69 au and that between Sr and O is 5.22 au indicating that the bonding between Ti and O is covalent in nature. The effective charge density of cubic SrTiO3 was computed using the calculated electron wave function and density. The results are shown in Figure 6. Figure 6(a) shows the charge density in a (110) plane through Ti, Sr, and O1 atoms. In addition to the electron charge density in real space for the (100) plane that passes through Ti and Sr atoms is shown in Figure 7.
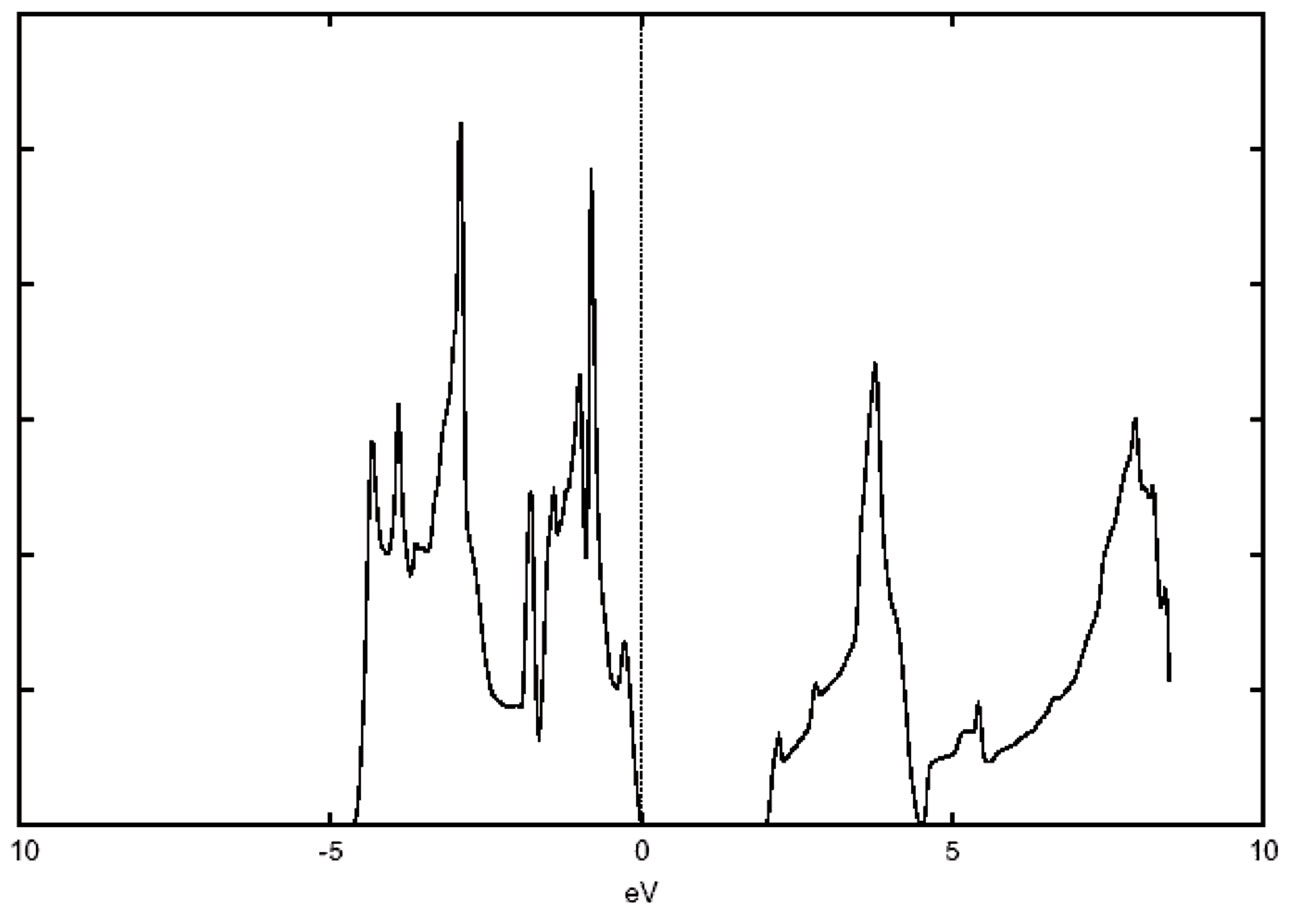
Figure 4. The total density of states (DOS) for Cubic SrTiO3.
 (a)(i)
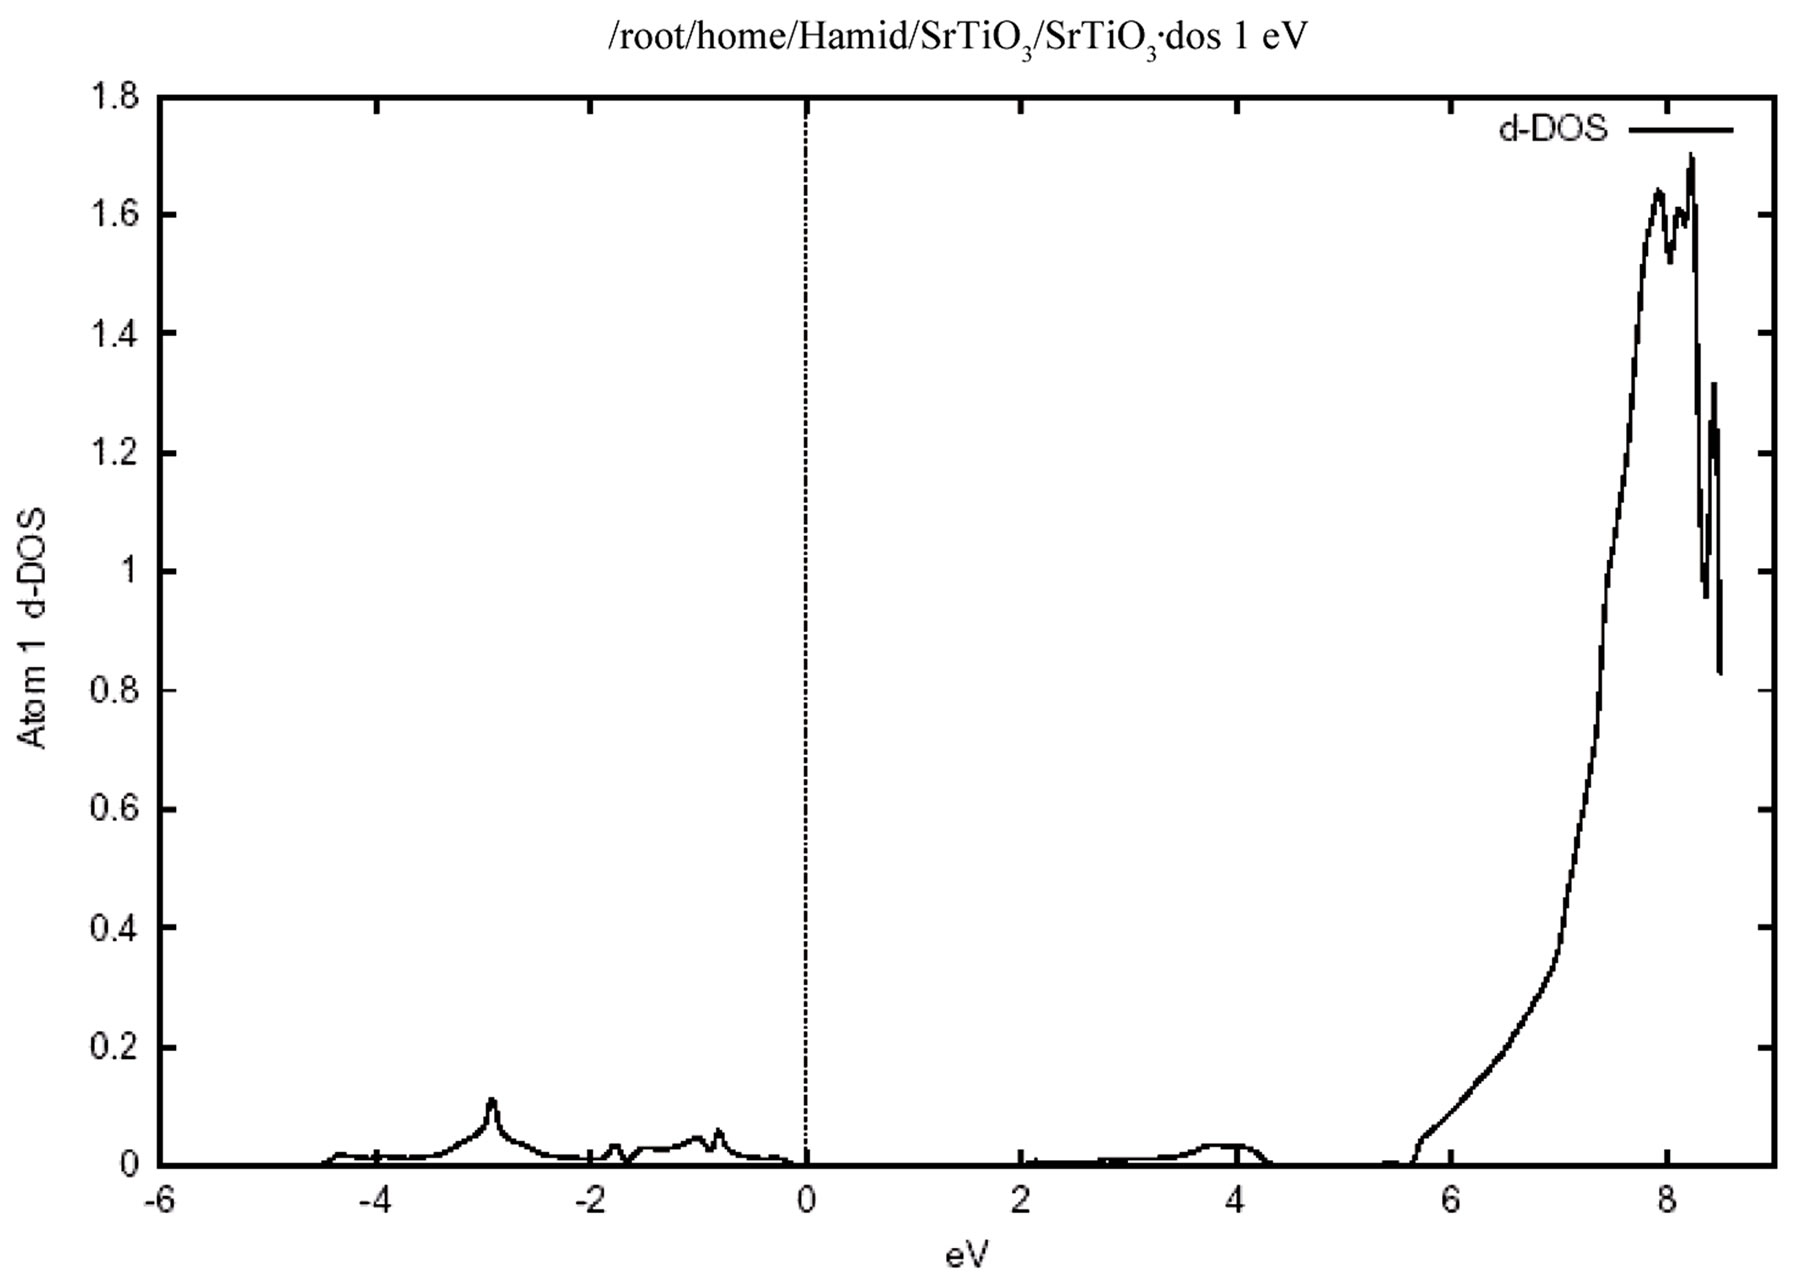 (a)(ii)
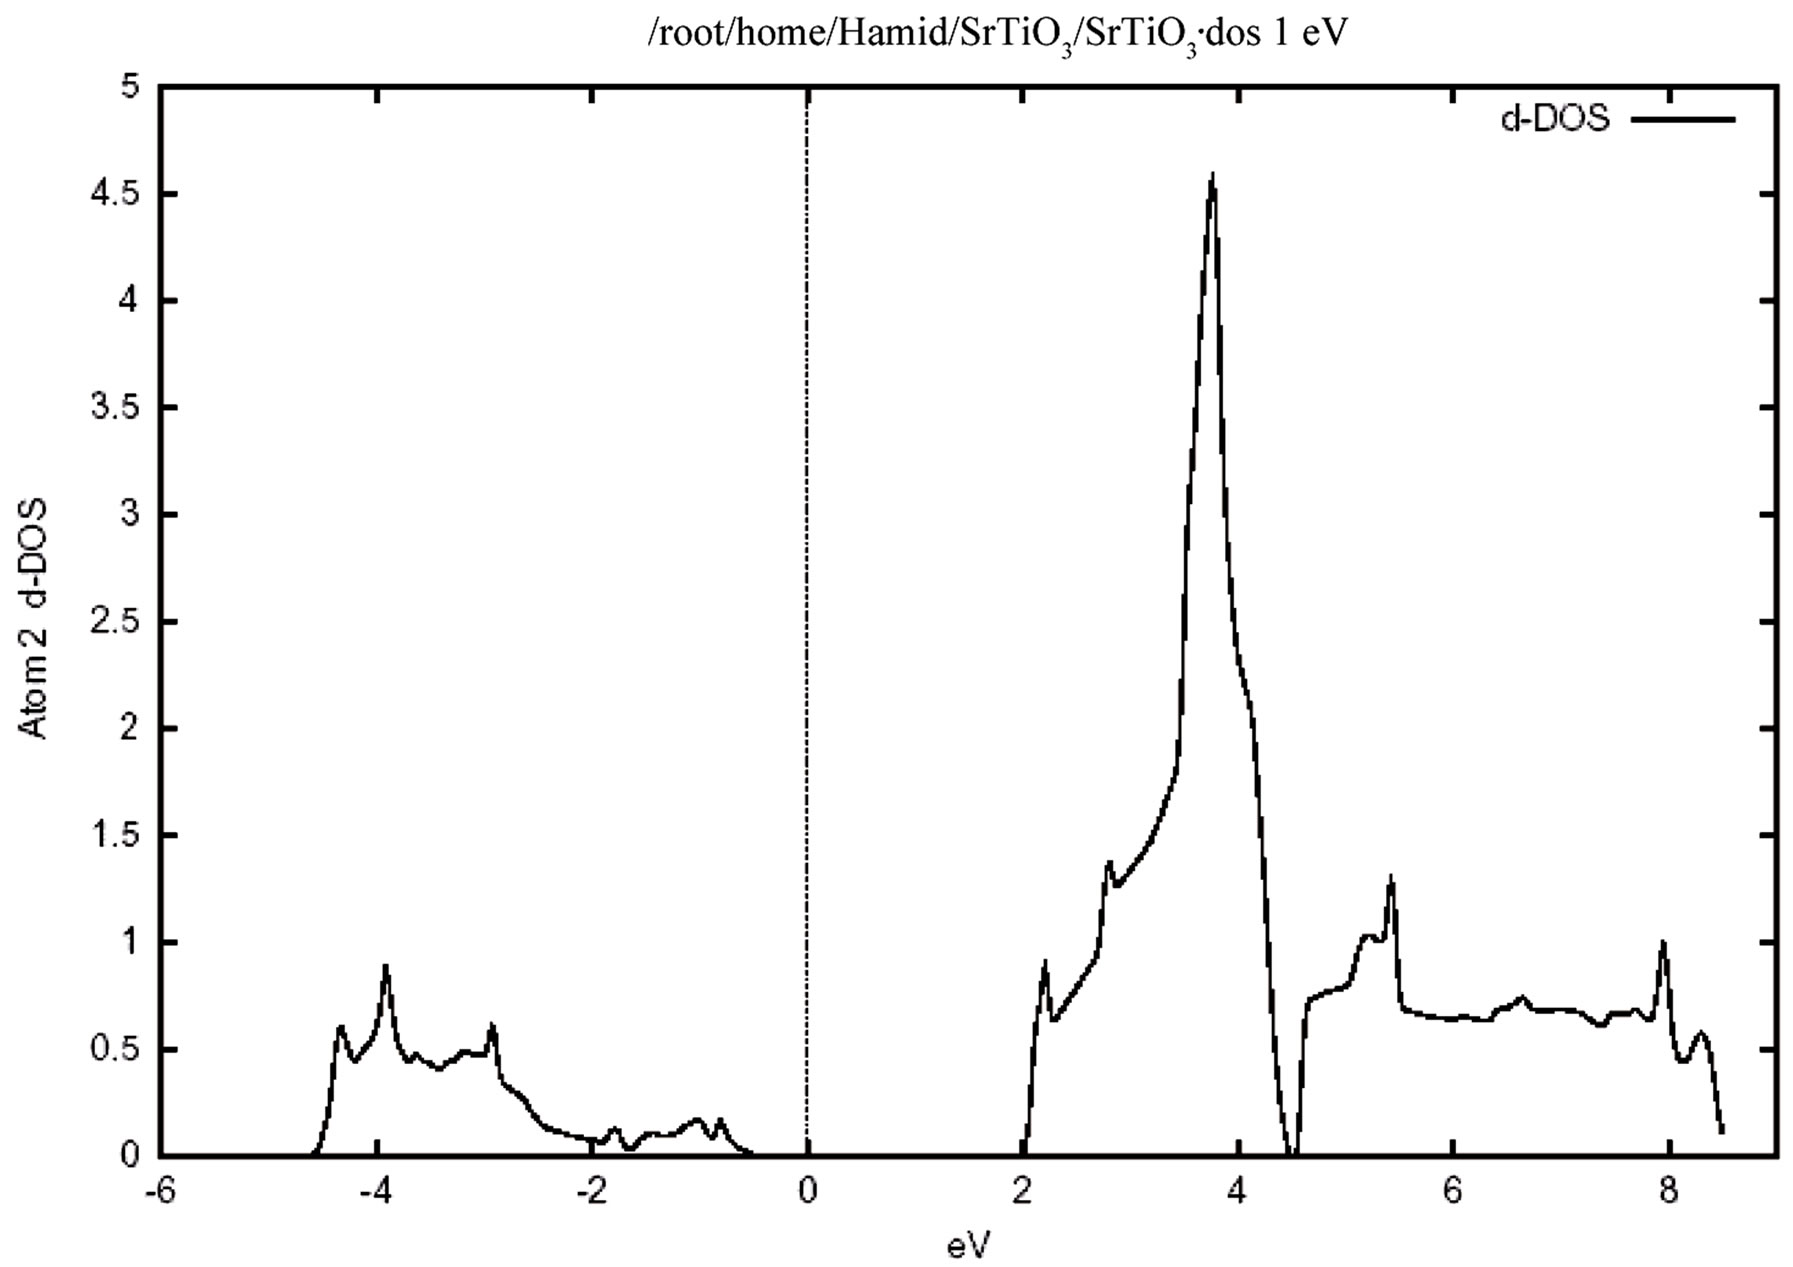 (b)(i)
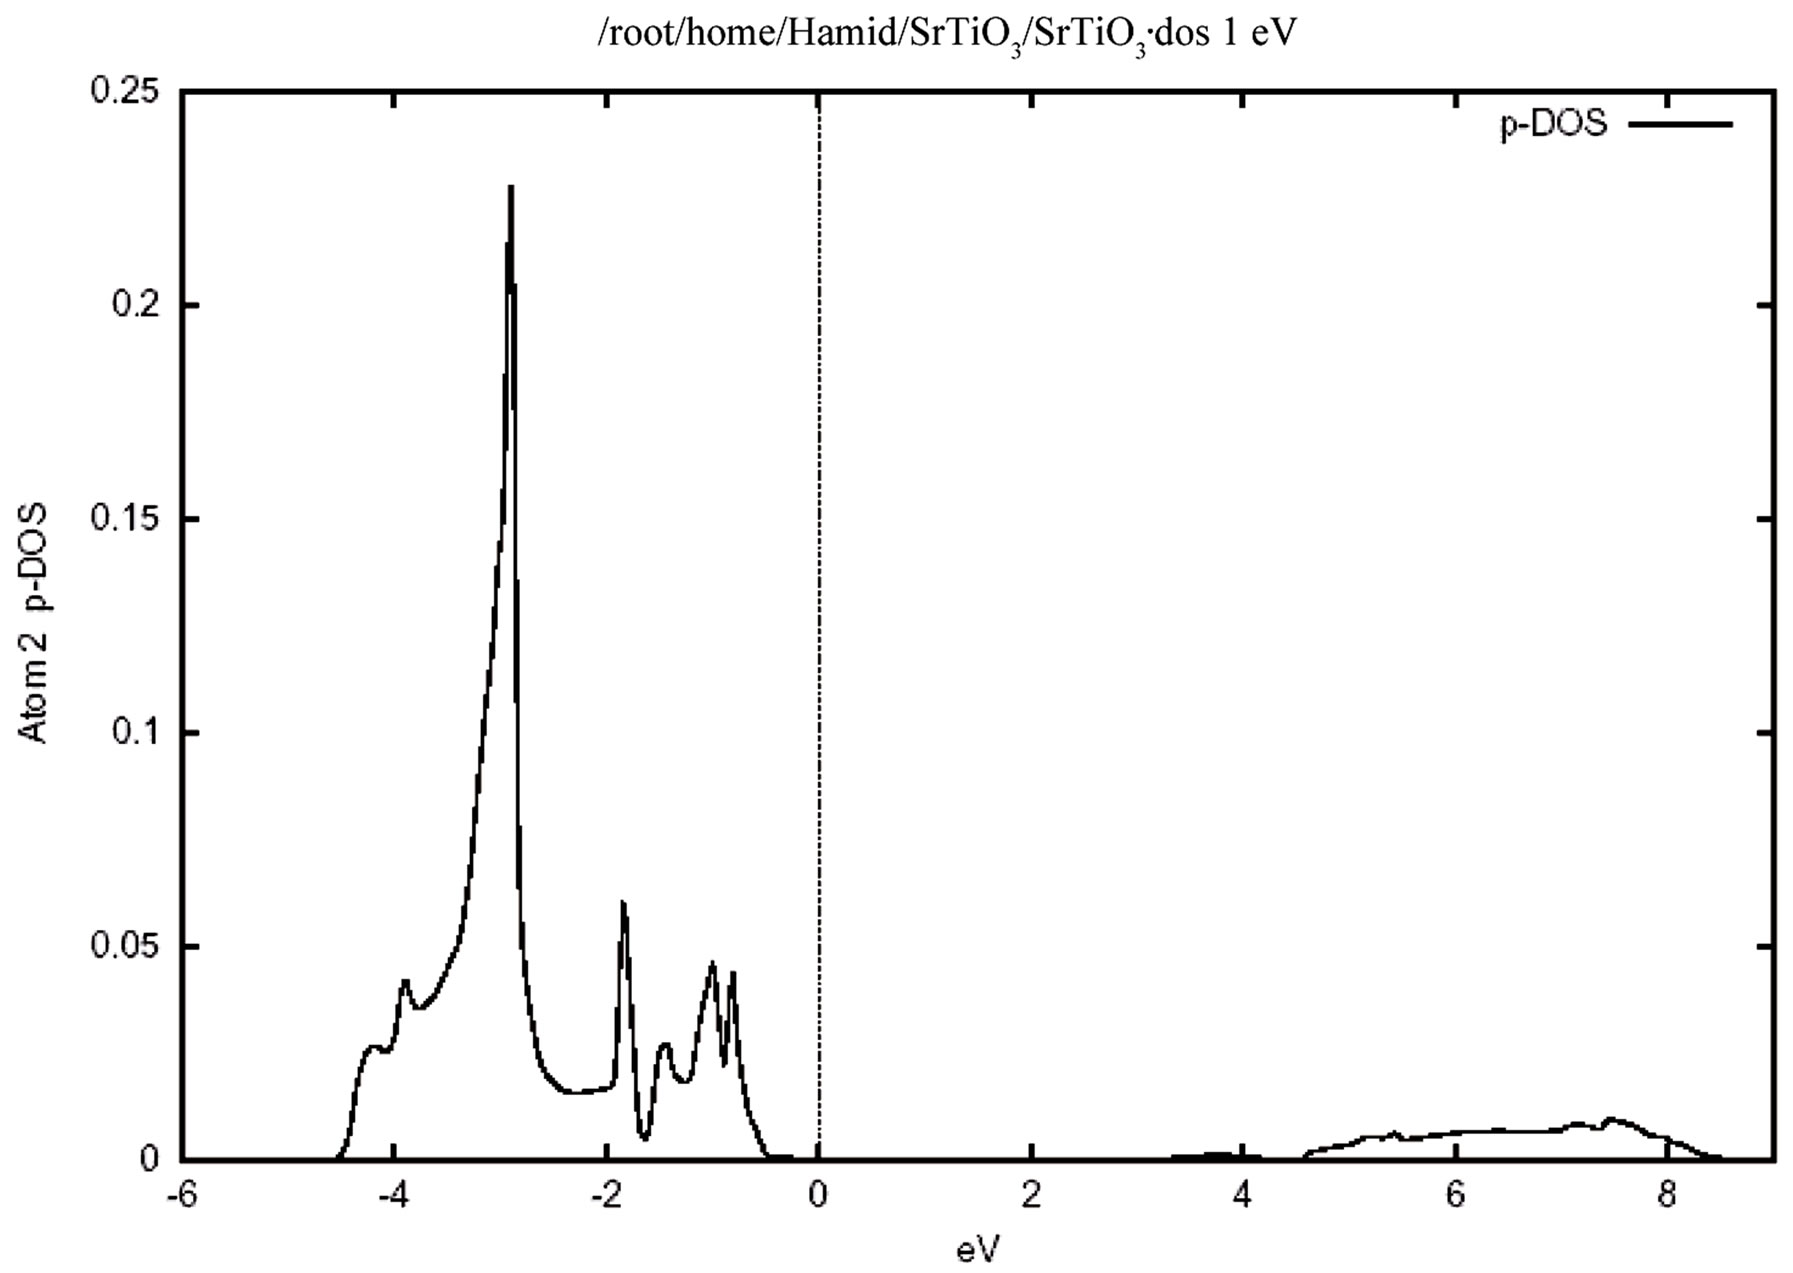 (b)(ii)
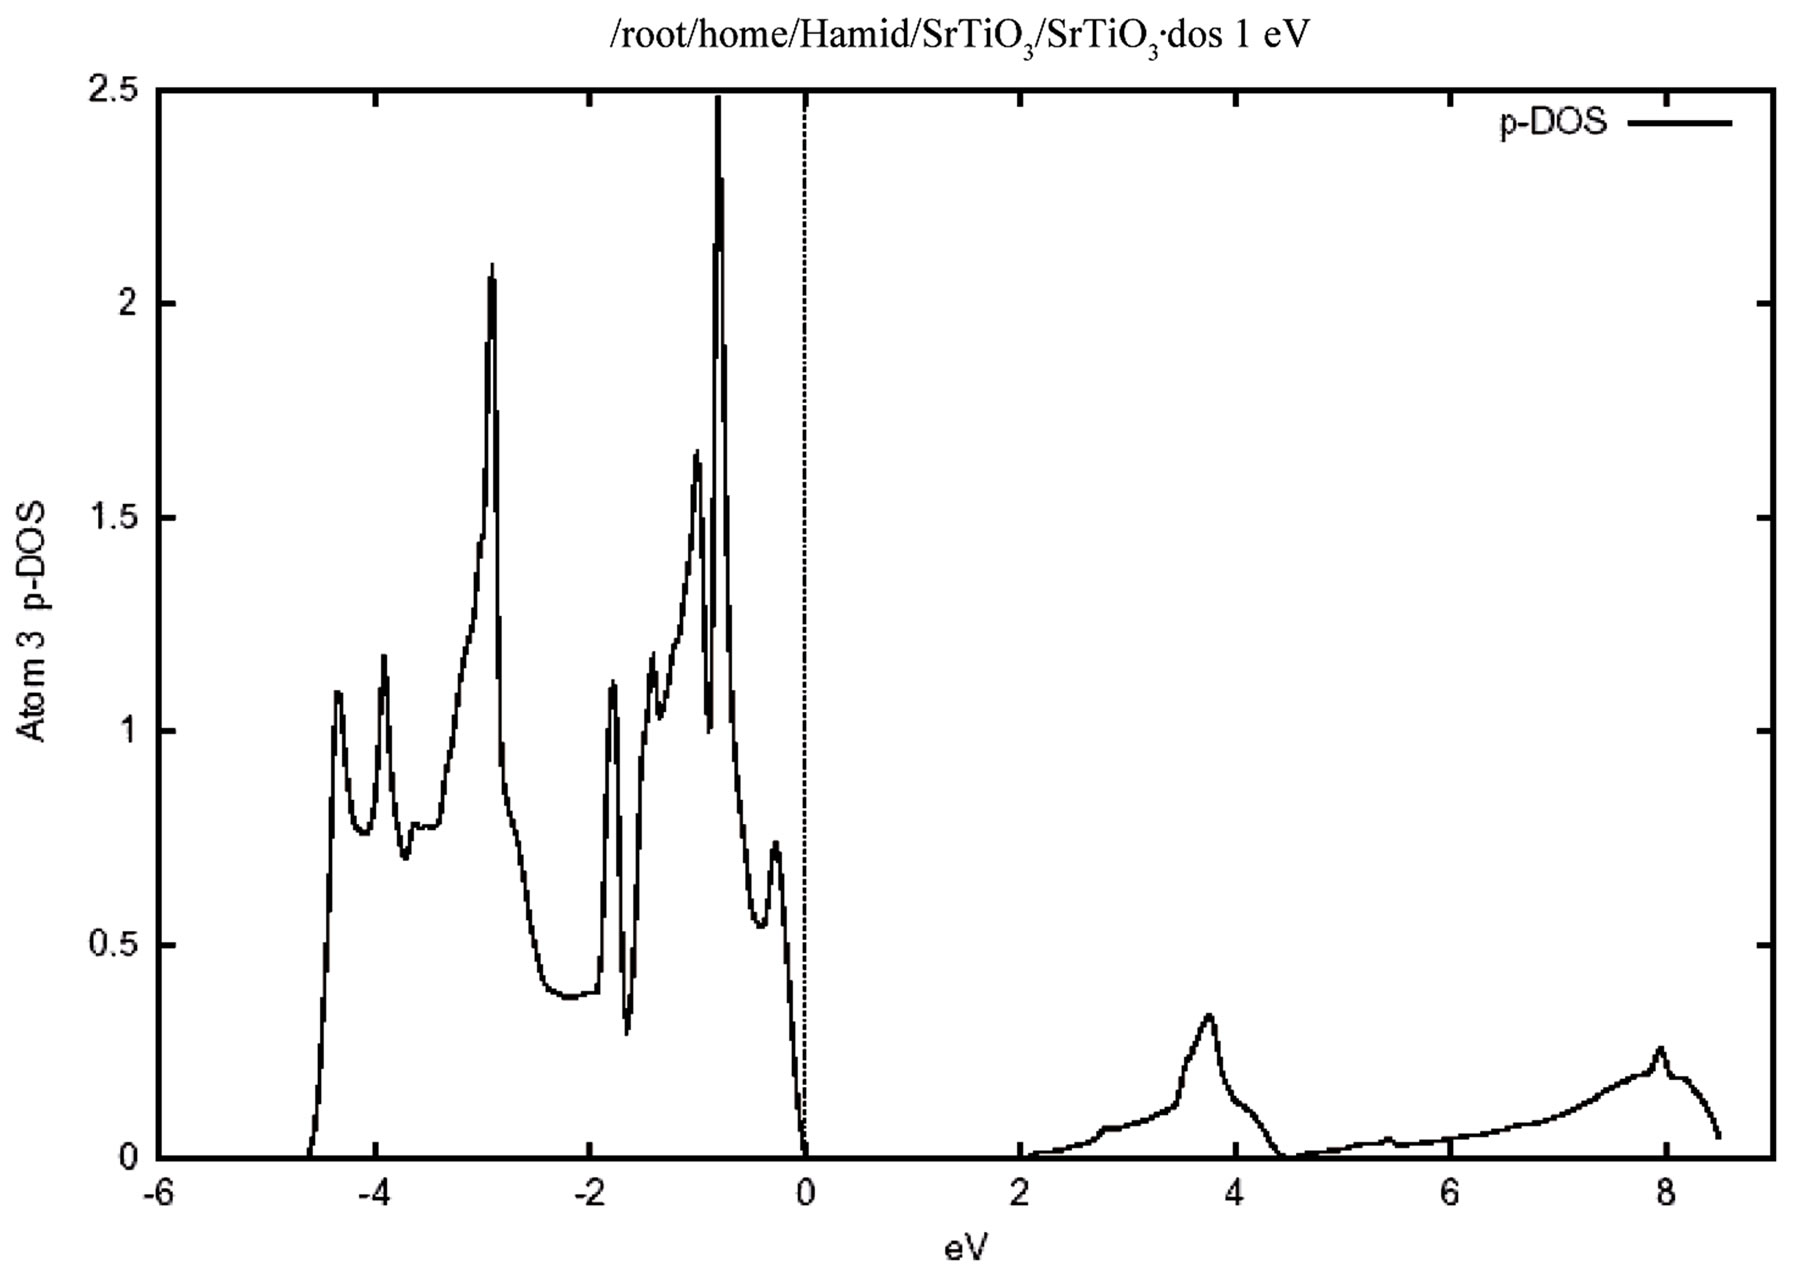 (c)
(c)
Figure 5. The partial densities of states (PDOS) showing the contributions of Sr, Ti and O atoms. One Sr, one Ti and three O atoms from one unit cell of cubic SrTiO3 are included in the calculation. (a) Density of states for (i) p orbital, (ii) d orbital atom Sr. (b) Density of states for (i) d orbital, (ii) p orbital atom Ti. (c) Density of states for p orbital atom O.
 (a)
(a)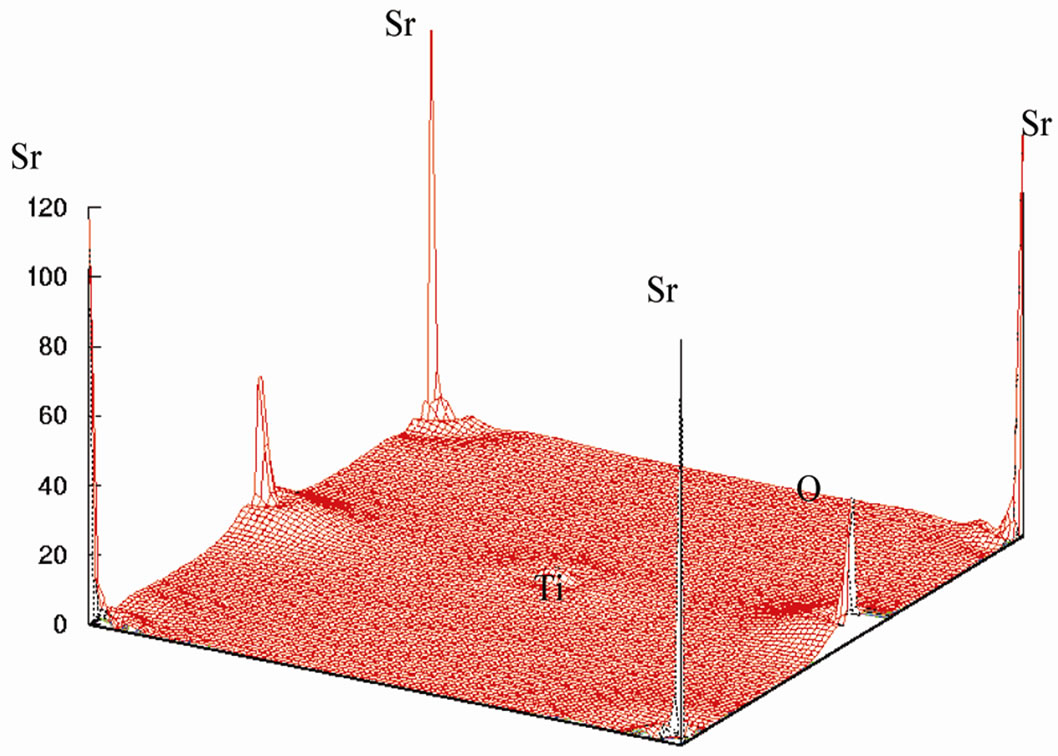 (b)
(b)
Figure 6. (a) The electron-density in (110) plane, (b) in three dimension.
The Ti-O bond, however has covalent character, this is quite apparent from the noticeable and TiO2 is ionic while between the Ti and O is covalent.charge distribution at the middle of the Ti-O bond. The charge distributions in Figure 7(a) are consistent with the reported results of reference [23]. The study of Figures 6 and 7 shows that there is the important hybridization between Ti 3d and O 2p which again emphasizes the large cova-
 (a)
(a)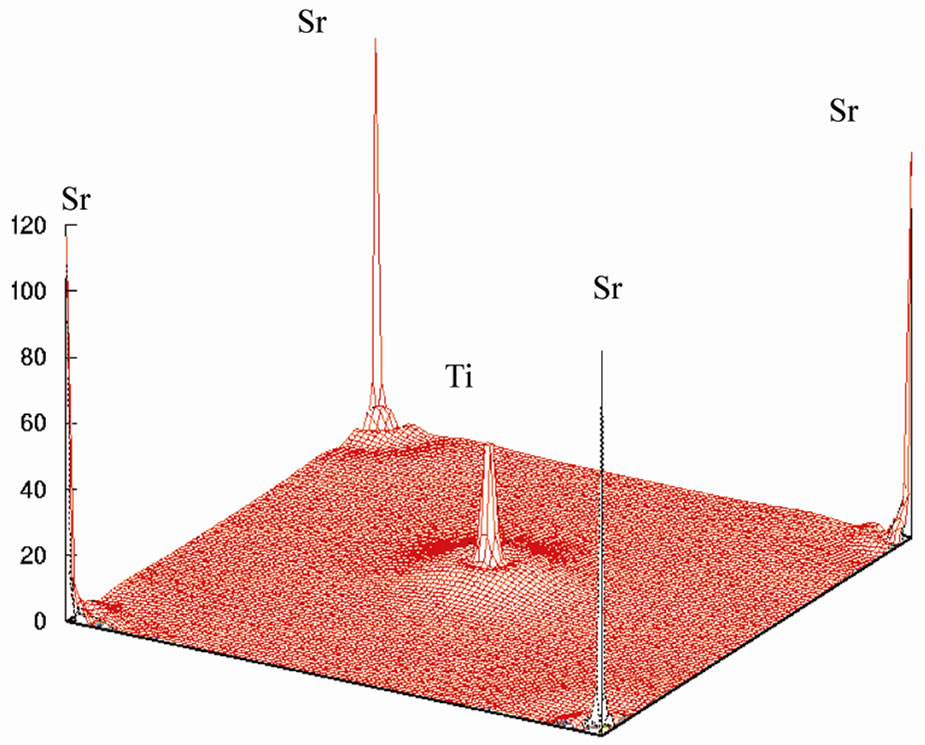 (b)
(b)
Figure 7. Electron density distribution for SrTiO3 (a) in the (100) plane and (b) in three dimension.
lent character of their bond.
4. Conclusions
I have made a detailed investigation of the electronic structure, band structure and DOS of perovskite SrTiO3 using the FP-LAPW method. The total DOS obtained from my first principles calculations are compared with experimental results [20]. It has been concluded that the top of the volence band is mainly composed of the O 2p orbitals in non-bonding states and the lower part of the VB is formed by bonding states between the Ti 3d and O 2p orbitals. The CB mainly consists of 3d, 4sand 4p states of Ti and 3d and 4s state of Sr. The calculations show that the fundamental gap of SrTiO3 is direct at the Γ point. My calculated fundamental gap 2.5 eV is smaller than the experimentally reported value 3.2 eV, which the origin of this discrepancy may be the GGA .The chemical bonding of SrTiO3 is also analyzed. The TiO2 complex is bonded mainly by covalent bonds and the Sr and TiO2 constituents are bonded mainly ionically. The calculated results compared with the experimental results.
REFERENCES
- M. E. Lines and A. M. Glass, “Principles and Applications of Ferroelectrics and Related Materials,” Clarendon, Oxford, 1977.
- F. W. Lytle, “X-Ray Diffractometry of Low-Temperature Phase Transformations in Strontium Titanate,” Journal of Applied Physics, Vol. 35, No. 7, 1964, pp. 2212-2215. doi:10.1063/1.1702820
- R. Viana, P. Lunkenheimer, J. Hemberger, et al., “Dielectric Spectroscopy in SrTiO3,” Physical Review B, Vol. 50, No. 11, 1994, pp. 601-605. doi:10.1103/PhysRevB.50.601
- M. Cardona “Optical Properties and Band Structure of SrTiO3 and BaTiO3,” Physical Review, Vol. 140, No. 2A, 1965, pp. 651-655. doi:10.1103/PhysRev.140.A651
- D. Bauerle, W. Braun, V. Saile and G. Sprüssel, “Vacuum Ultraviolet Reflectivity and Band Structure of SrTiO3 and BaTiO3” Zeitschrift für Physik B, Vol. 29, No. 3, 1978, pp. 179-184.
- O. M. Nes, K. A. Müller and T. Suzuki, “Elastic Anomalies in the Quantum Paraelectric Regime of SrTiO3 This Article Has Been Downloaded from IOPscience,” Europhysics Letters, Vol. 19, 1992, p. 397.
- C. H. Perry, et al., “Infrared Studies of Perovskite Titanates,” Physical Review, Vol. 135, No. 2A, 1964, pp. 408-412. doi:10.1103/PhysRev.135.A408
- J. L. Servoin, et al., “Infrared Dispersion in SrTiO3 at High Temperature,” Physical Review B, Vol. 22, 1980, pp. 5501-5506. doi:10.1103/PhysRevB.22.5501
- K. A. Muller, et al., “Indication for a Novel Phase in the Quantum Paraelectric Regime of SrTiO3,” Zeitschrift für Physik B, Vol. 48, 1991, pp. 277-283.
- K. A. Muller and H. Burkard, “SrTiO3: An Intrinsic Quantum Paraelectric below 4 K,” Physical Review B, Vol. 19, No. 7, 1979, pp. 3593-3602. doi:10.1103/PhysRevB.19.3593
- W. Zhong and D. Vanderbilt, “Effect of Quantum Fluctuations on Structural Phase Transitions in SrTiO3 and BaTiO3,” Physical Review B, Vol. 53, No. 9, 1996, pp. 5047-5050. doi:10.1103/PhysRevB.53.5047
- W. G. Spitzer, R. C. Miller, D. A. Kleinman and L. E. Howarth, “Far Infrared Dielectric Dispersion in BaTiO3, SrTiO3, and TiO2,” Physical Review, Vol. 126, No. 10, 1962, pp. 1710-1721. doi:10.1103/PhysRev.126.1710
- W. Jauch and A. Palmer, “Anomalous Zero-Point Motion in SrTiO3: Results from γ-Ray Diffraction,” Physical Review B, Vol. 60, No. 5, 1999, pp. 2961-2963.
- P. A. Fleury, J. F. Scott and J. M. Worlock, “Soft Phonon Modes and the 110 K Phase Transition in SrTiO3,” Physical Review Letters, Vol. 21, No. 1, 1968, pp. 16-19. doi:10.1103/PhysRevLett.21.16
- G. Shirane and Y. Yamada, “Lattice-Dynamical Study of the 110 K Phase Transition in SrTiO3,” Physical Review, Vol. 177, No. 2, 1969, pp. 858-863. doi:10.1103/PhysRev.177.858
- J. P. Perdew, J. A. Chevary, S. H. Vosko, et al., “Atoms, Molecules, Solids, and Surfaces: Applications of the Generalized Gradient Approximation for Exchange and Correlation,” Physical Review B, Vol. 46, No. 11, 1992, pp. 6671-6687. doi:10.1103/PhysRevB.46.6671
- J. P. Perdew, “Generalized Gradiant Approximation for Exchange and Correlation. A Look Forward and Backward,” Physica B, Vol. 172, No. 1-2, 1991, pp. 1-6. doi:10.1016/0921-4526(91)90409-8
- R. D. King-Smith and D. Vanderbilt, “First-Principles Investigation of Ferroelectricity in Perovskite Compounds,” Physical Review B, Vol. 49, No. 9, 1994, pp. 5828-5844. doi:10.1103/PhysRevB.49.5828
- R. D. King-Smith and D. vanderbilt, “A First-Principles Pseudopotential Investigation of Ferroelectricity in Barium Titanate,” Ferroelectrics, Vol. 136, 1992, pp. 85-94.
- P. G. Perkins and D. M. Winter, “Calculation of Band Structures and Electronic Properties from Models of SrTiO3,” Journal of Physics C: Solid State Physics, Vol. 16, No. 18, 1983, pp. 3481-3492. doi:10.1088/0022-3719/16/18/018
- R. W. G. Wyckoff, “Crystal Structures,” 2nd Edition, Chemical Catalog Company Incorporated, New York, Vol. 2, 1964.
- P. Blaha and K. Schwarz, “WIEN2k,” Vienna University of Technology, Vienna, 2004.
- S. Sonali, T. P. Sinha and M. Abhijit, “Structural and Optical Properties of Paraelectric SrTiO3,” Journal of Physics: Condensed Matter, Vol. 12, No. 14, 2000, p. 3325. doi:10.1088/0953-8984/12/14/309
- D. Bagayoko, G. L. Zhao, J. D. Fan and J. T. Wang, “Ab Initio Calculations of the Electronic Structure and Optical Properties of Ferroelectric Tetragonal BaTiO3,” Journal of Physics: Condensed Matter, Vol. 10, No. 25, 1998, pp. 5645-5655. doi:10.1088/0953-8984/10/25/014