Advances in Bioscience and Biotechnology
Vol.4 No.4(2013), Article ID:29787,9 pages DOI:10.4236/abb.2013.44067
A distribution pattern assisted method of transcription factor binding site discovery for both yeast and filamentous fungi
![]()
1Department of Plant Pathology, The Ohio State University, Columbus, USA
2Department of Biomedical Informatics, The Ohio State University, Columbus, USA
Email: *Mitchell.815@osu.edu
Copyright © 2013 Jinnan Hu et al. This is an open access article distributed under the Creative Commons Attribution License, which permits unrestricted use, distribution, and reproduction in any medium, provided the original work is properly cited.
Received 17 January 2013; revised 23 February 2013; accepted 28 March 2013
Keywords: Transcription Factor Binding Site Discover; Distribution Pattern; Saccharomyces cerevisiae; Magnaporthe oryzae; MoCRZ1
ABSTRACT
Transcription factors (TFs) are the core sentinels of gene regulation functioning by binding to highly specific DNA sequences to activate or repress the recruitment of RNA polymerase. The ability to identify transcription factor binding sites (TFBSs) is necessary to understand gene regulation and infer regulatory networks. Despite the fact that bioinformatics tools have been developed for years to improve computational identification of TFBSs, the accurate prediction still remains changeling as DNA motifs recognized by TFs are typically short and often lack obvious patterns. In this study we introduced a new attribute-motif distribution pattern (MDP) to assist in TFBS prediction. MDP was developed using a TF distribution pattern curve generated by analyzing 25 yeast TFs and 37 of their experimentally validated binding motifs, followed by calculating a scoring value to quantify the reliability of each motif prediction. Finally, MDP was tested using another set of 7 TFs with known binding sites to in silico validate the approach. The method was further tested in a non-yeast system using the filamentous fungus Magnaporthe oryzae transcription factor MoCRZ1. We demonstrate superior prediction reranking results using MDP over the commonly used program MEME and the other four predictors. The data showed significant improvements in the ranking of validated TFBS and provides a more sensitive statistics based approach for motif discovery.
1. INTRODUCTION
Transcription factors (TFs) are proteins containing one or more DNA-binding domains, which bind to specific DNA sequences to activate or repress the recruitment of RNA polymerase, thereby up or down regulate transcription of downstream genes [1,2]. In fungi, TFs bind to either enhancer or promoter regions, usually 1 - 1500 bp upstream to the ORFs they regulate [3-5].
Understanding networks of transcriptional regulation is one of the most challenging yet important tasks in genome analysis. Transcription factors function by binding to recognition sites in gene regulatory regions, which are generally degenerate motifs of 5 - 15 base pairs [6]. Extensive research has focused on identifying transcription factor binding sites (TFBSs) by biological validation. Nevertheless, experiments identifying TFBSs are usually time-consuming and laborious, which made it difficult to de novo discover TFBSs without any candidate motifs and thus left the binding sites of most transcription factors unclear [7]. Therefore, prediction of potential TFBSs utilizing bioinformatics approaches has become an essential tool to explore gene regulation networking.
Different approaches have been tried and applied to discover novel TFBSs over years, which could be put into two categories. Prediction tools in the first category search for the over-represented motifs in a given set of sequences—usually promoter regions of co-regulated genes or ChIP-chip/ChIP-seq identified binding regions. This strategy has been used widely since it does not require additional information other than the sequences. In the searching process, TFBSs could be treated as either a Position Weight Matrix as in MEME [8] and GLAM [9], or consensuses as in SMILE [10] or Weeder [11], when heuristic approach was applied and exhaustive enumeration was avoided. Top candidates after scoring and sorting are then represented in the form of a position frequency matrix (PFM) [12], or a position weight matrix (PWM). However, application of this approach was limited by the computational speed and scale of input data, thus could hardly be applied on the thousands of sequences generated by ChIP-seq. As a result, new tools such as DREME [13] and WordSeeker [14] were designed specifically for large input dataset, which utilize new mapping algorithms and multi-nodes computation platform to significantly increase speed. Another way to search TFBSs focuses on biological information such as evolutionary conservation. This strategy is based on the assumption that the conserved non-coding regions across related species are likely to be under negative selection force and thus contain functional motifs. Due to the fast increase of available genome sequences, this method has been developed quickly in recent years, and generate lower rate of false-positive compared to other methods. [15,16]. To date, various software have been developed to analyze possible binding motifs, however, the multifaceted biochemical interactions between proteins and DNA may easily lead to false-positive results and make theoretical predictions of TFBSs error prone [17].
Yeast transcription factors were used in this study as training and testing data sets. Saccharomyces cerevisiae is the most widely used and most well studied yeast species, whose genome serves as one of the most thoroughly analyzed to date [18]. Recently, multiple yeast databases have been built and published, including two transcription factor databases used in this study [19,20].
To expand this method to filamentous fungi, the MoCRZ1 transcription factor from Magnaporthe oryzae, a fungal pathogen that cause severe rice blast disease worldwide, was included [21]. MoCRZ1 is a C2H2 zincfinger type transcription factor activated by calcineurin dephosphorylation and functions as a mediator of calcineurin signaling [22]. In 2010, Kim et al. identified the binding sequences of MoCRZ1 by applying both ChIPchip and microarray approaches, reporting three binding motifs predicted from the bound sequences [23].
In this study, we developed a strategy to improve the predictions made by MEME, using the transcription factor binding motif distribution pattern (MDP) information. Twenty-five well-studied TFs with their previously validated binding motifs were selected to form a training dataset. Although similar spatial distribution of yeast TFBSs has been reported [24], we focused on TFBS prediction improvement by using a novel MDP approach.
2. RESULTS AND DISCUSSIONS
2.1. General Distribution Frequency Curve
As showed in the analysis pipeline (Figure 1), we checked all the 113 TFs with their 301 documented
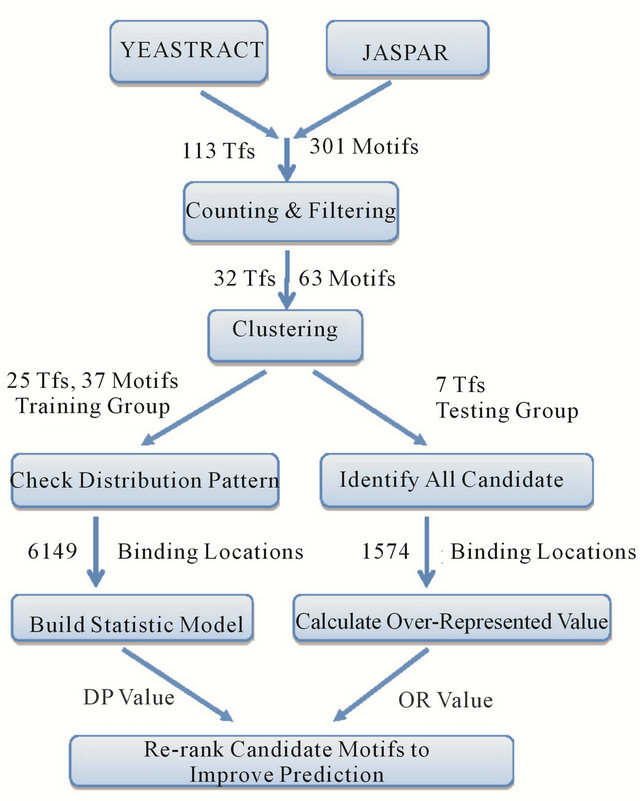
Figure 1. Analysis pipeline.
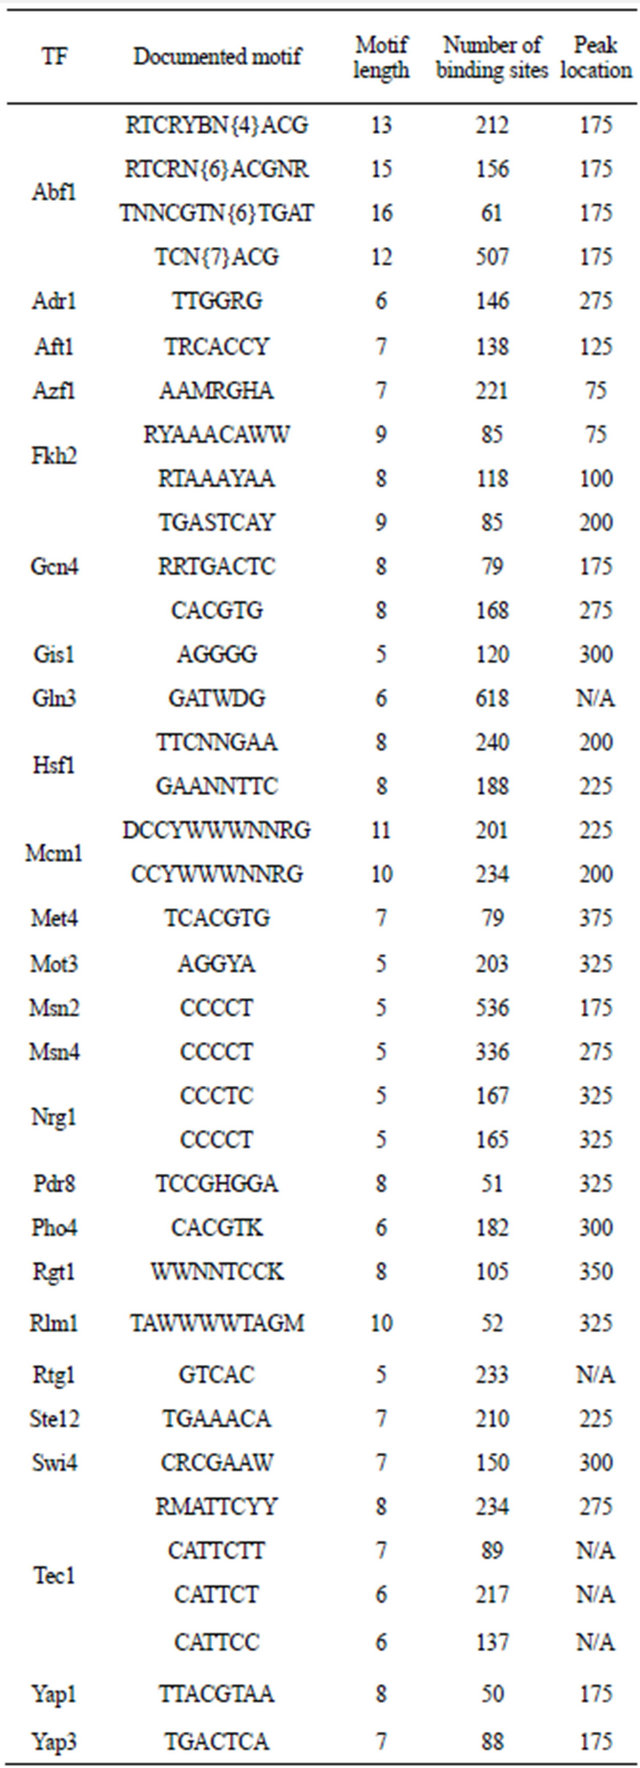
binding motifs from the yeast transcription factor databases “YEASTRACT” [19].Then in the filtering step 32 TFs which have more than 50 documented regulated genes were chosen. Some TFs had multiple binding motifs but similar to each other, so we referred to the positional-weight matrix provided by the database “JASPAR” [20] and merged those similar motifs to generate a consensus motif sequence (details in methods). In total, 32 TFs with 63 target motifs were included in the analysis dataset (Table 1). 25 TFs with 37 validated binding motifs were randomly chosen to build the training dataset (Table 2), and the other 7 TFs formed the testing dataset. For each motif, their occurrence locations in the validated regulated gene models were scanned in 1000 bp upstream of transcription start site (TSS). Next, a general distribution curve was drawn from the average distribution of all motifs (Figure 2). It was observed from the curve that the lowest frequency was 2.3% at a region −50 bp to 0 bp, while the highest frequency was 9.2% at a region −200 bp to −150 bp. A peak was observed from the region −275 bp to −100 bp, with center at about −200 bp. This distribution pattern was similar to those from previous studies in yeast [24,25] and human [26].
2.2. Estimating Reliability of Motif Prediction
It was assumed from the pattern of the distribution curve, that majority of transcription factors worked as short
Table 1. List of yeast TFs involved in training and testing groups.
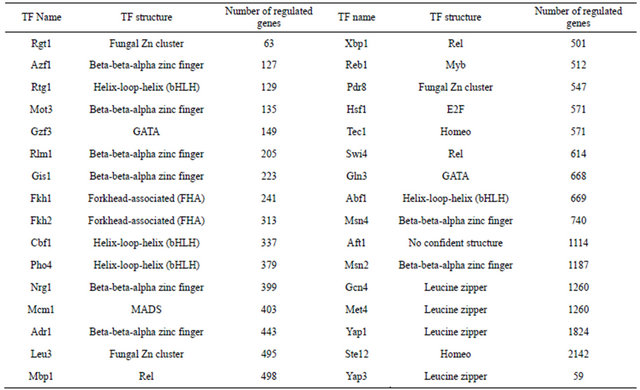
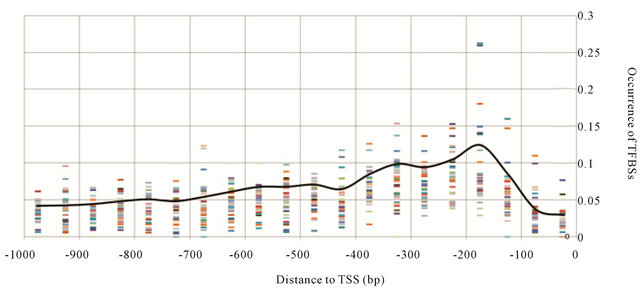
Figure 2. Distribution frequency curve of training group. Each block coded by colors represents the frequency of one training motif in each scanning window. The curve was generated as average of all blocks.
distance cis-elements binding specifically at −300 bp to −100 bp—a region referred to as the “PR” (peak region), but not at the other two regions: −150 bp to 0 bp regarded as the “NBR” (non-binding region) where most transcription initiation complexes bind; and −1000 bp to −250 bp regarded as the “DR” (distal region). To quantify pattern fitness, a DP (distribution pattern) value was introduced to estimate fitness of any TF binding motif to the general frequency curve. The DP value was generated from shape of the general distribution curve and an assumption: a “true” binding motif should occur more often in the PR, but not NBR or DR, while a random over-represented motif sequences may not have any specific distribution preference in the 1 KB upstream region. So if you compare the average occurrence/frequency of PR and that of NBR and DR, the former should be higher
Table 2. TFs in training group.
in a “true” binding motif and a larger difference represents a more reliable prediction. We thus proposed a formula to calculate the DP value which was expected to be close to zero in a random motif. A motif with DP value zero or negative then has lower possibility to be the biologically “true” TF binding motif. The DP value was calculated as the following formula:
DP value = (Average PR Occurrence × 2) − (Average NBR Occurrence) − (Average DR Occurrence).
2.3. Testing
Seven TFs were involved to test if the utilization of DP value could assist in improving TFBS predictions. Four public motif finding tools were included in the performance comparison: MEME (published in 1994), MDscan (published in 2002), WordSeeker (published in 2010), and DREME (published in 2011). These four tools all search for statistically over-represented motifs in a given sequences set. MEME uses the expectation maximization to fit a two-component finite mixture model to the input sequences, and multiple motifs are found by probabilistically erasing the occurrences of the top motif and then repeating the process [8]. MDscan combines the advantages of two motif search strategies: position-specific weight matrix updating and word enumeration to enhance the success rate [27]. DREME [13] and WordSeeker [14] were developed in recent years and specifically designed to process large size of ChIP-chip/ChIPSeq datasets on scalable analysis platforms.
For each TF, the 1000 bp upstream sequences of their documented regulated genes were firstly selected as input into MEME for consensus motif search with the target motif length parameter set from 5 bp to 9 bp. The top ten consensus motifs in the results were then processed to calculate their OR and DP value.
The OR (over-represent) value, or the observed: expected frequency ratios (O/E) descripted and utilized in a previous study [28] reflects the statistical over-represent of these consensus motifs. OR value was calculated as following formula, where O refers to the overall occurrence of a motif across the 1KB upstream sequences set, “ln” is the natural logarithm, and Eo represents the expected occurrence of that motif:
OR value = O × ln (O/Eo)
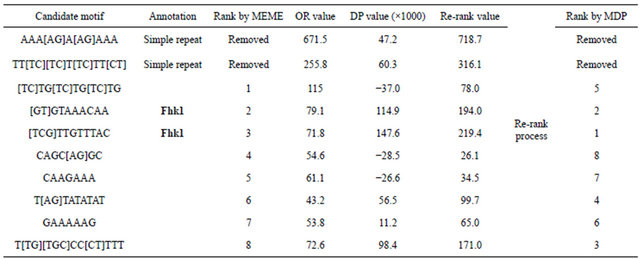
Taking transcription factor “Fkh1” for example, the top ten consensus motifs from MEME were originally ranked by P-value which represents the possibility of obtaining this motif solely by chance. The first two motifs AAA[AG]A[AG]AAA and TT[TC][TC]T[TC]TT [CT], were likely to be simple sequence repeats and thus being removed from the ranked results. The 2nd motif [GT]GTAAACAA and the 3rd motif [TCG]TTGTTTAC were reverse complimentary to each other and matched documented Fkh1 motifs [AG][CT]AAACA[AT][AT] [29] and [AG]TAAA[CT]AA [30]. The remaining 6 consensus motifs were not Fkh1 documented binding motifs (Figure 3, Table 3).
The MDP approach utilize both the over-representation information-measured by OR value, and the distribution pattern information-measured by DP value. Since both values represent the reliability of the motif prediction-higher value represents higher reliability—a re-rank value was introduced to combine both values so the “true” motifs with over-represented occurrence and distribution pattern fitting the general curve will obtain higher value and thus be picked up from all the candidates. To even the contribution of the two values, we checked the OR and DP value in all the training dataset, and decide to amplify DP value by 1000 times so the average and standard deviation of both value is close to each other. The Re-rank value was calculated as following formula:
Re-rank value = OR value + DP value × 1000 After re-ranking based on the Re-rank value, the motif originally in the 1st place ranked by MEME showed a negative DP value and thus dropped to 5th in the MDP rank, since its distribution pattern showed little similarity to the general TF frequency curve, while the two documented Fkh1 target motifs were raised from 2nd/3rd to 1st/2nd. Since these two target motifs are reverse complimentary to each other, we recorded the rank change as 2nd in MEME and 1st in MDP.
Same as descripted in “Fkh1”, the upstream sequences of the 7 TFs were input into MDscan, WordSeeker and
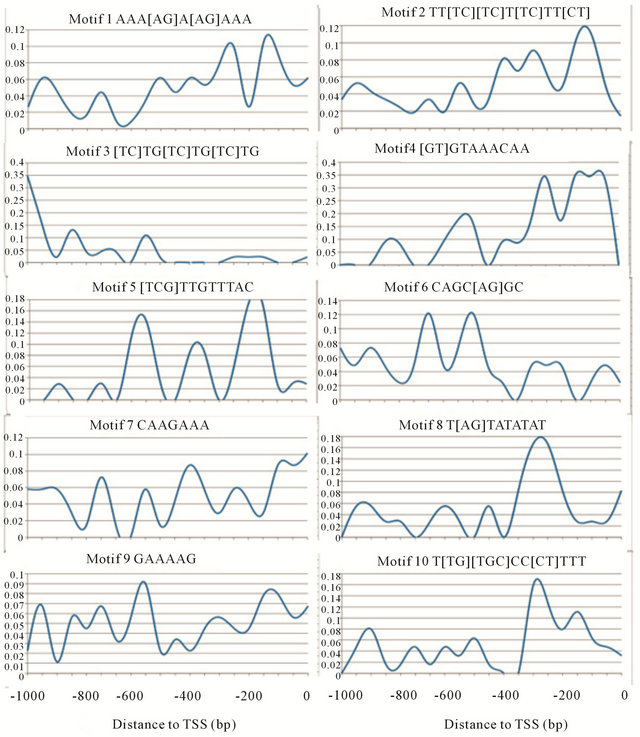
Figure 3. Fkh1 candidate motifs frequency curve.
Table 3. Fkh1 consensus motifs testing result. The two motifs in bold type represent two documented Fhk1 binding motifs.
DREME, seeking for motifs with expected length around 8 bp and other parameters were left as default. Out of 7 tested TFs, 2 motifs (Xbp1 and Gzf3) failed to find validated target binding motifs in the top 10 consensus motifs predicted by MEME or other predictors. Summary of the remaining 5 TFs were showed in Table 4. Among the 5 target motifs, MDP predicted four motifs as the 1st and one motif as the 2nd in rank. While MEME and DREME only predicted two target motifs as the 1st in rank; MDscan and WordSeeker each failed to predict two target motifs in the top ten results. Some repeat-like sequences were noticed in MDscan and WordSeeker results, indicating their detections were somehow disturbed. Overall, MDP generated a better rank for the target motifs compared to other four tools.
MoCRZ1, a transcription factor involved in Ca2+/Calcineurin signaling in Magnaporthe oryzae, was also used to estimate this MDP approach. Recently, three binding motifs (TTGNTTG, CAC[AT]GCC, TAC[AC]GTA) of MoCRZ1 in M. oryzae were predicted from 106 binding sequences discovered by ChIP-chip and microarray methods [23]. We tested if the MDP approach could identify the “true” MoCRZ1 binding motifs without the need of ChIP-chip data. From published microarray data [23], 190 genes were picked as predicted MoCRZ1 regulated genes as they all showed a 2 fold or greater expression change between the control and libraries of Ca2+ deficiency, MoCRZ1 inhibitor added, and the MoCRZ1 deletion. Results of the top ten consensus motifs predicted by MEME from 1000 bp upstream of MoCRZ1 regulated genes with their distribution pattern curves were shown in Figure 4 and Table 5. Three target motifs were originally ranked by MEME as the 1st, 5th, and 6th, after two simple repeats being removed. After re-ranking, these three target motifs went up to 2nd, 4th, and 5th. It was observed that another two motifs ([GT]CTTGGC and TGCCAAG ) which originally ranked at the 3rd and 8th moved up to the 1st and 3rd, also showed a significant rank improvement. These two motifs were next searched in the TOMTOM [31] database and identified as “Rim101” binding motifs, which was reported as a transcription factor involved in a pathway acting in parallel to Crz1 via calcineurin [32].
3. CONCLUSIONS
In this study, we developed the MDP approach to improve TFBS prediction. Genome-wide TFBS identification is generally challenging with both experimental validation and computational analysis required to refine TFBS predictions. The use of TFBS distribution profiles improves the accuracy of predictions by estimating both the over-representative level of the candidate motifs and their distribution pattern as well. The major originality here is that we are focusing on improving TFBS prediction by utilizing distribution pattern.
4. METHODS
To select transcription factors, all the 113 TFs from the yeast transcription factor database “YEASTRACT” were checked and the number of their documented regulated genes was counted. Those TFs having less than 50 documented regulated genes were filtered out. We noticed that some TFs recorded in “YEASTRACT” had multiple documented binding motifs, however, regular expression sequences of some binding motifs from the same TF showed high similarity, and thus could be clustered into a single motif. In those cases, the position weight matrix was checked from the “JASPAR” database. If the clustering was supported by the PWM, then the different motifs were merged into a new one. For example, TF “Aft1” had 4 recorded binding motifs in “YESTRACT” database:
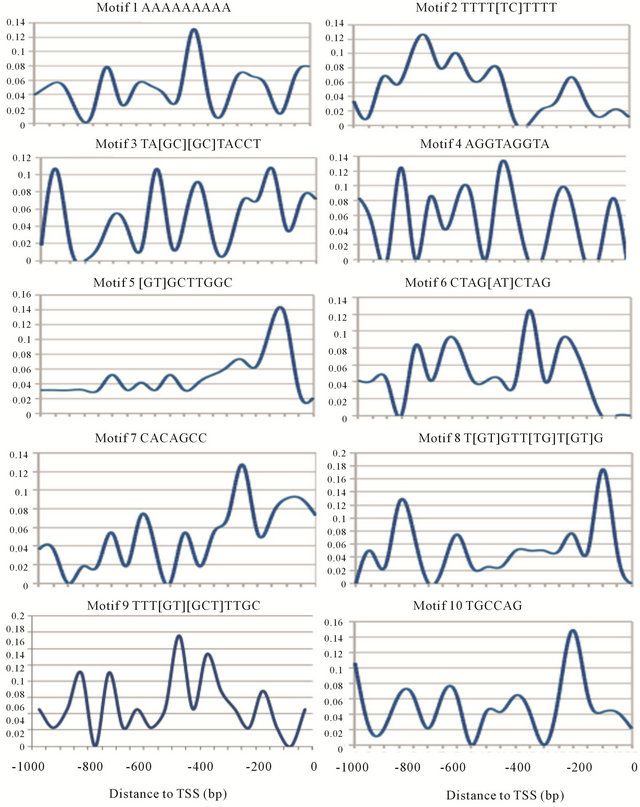
Figure 4. MoCRZ1 candidate motifs frequency curve.
Table 4. Test results of all testing group. “N/A” means the target motif was not found in the top ten candidate motifs returned.
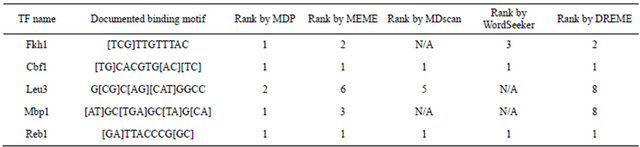
Table 5. MoCrz1 consensus motifs testing result. The five motifs in bold type are three MoCRZ1 binding motifs and two Rim101 binding motifs.

YRCACCCR, TGCACCC, GGCACCC, and TGCACCCA, while only one matrix is recorded in “JASPAR”. So in the clustering process, consensus binding motif sequences of Aft1 were generated as “TRCACCY”. After clustering, each of the target motifs was scanned in the 1 KB upstream TSS region of all genes in the yeast genome to check for number of occurrence. Any motif with less than 100 or more than 2000 occurrence were removed. The remaining 32 TFs were randomly divided into two groups: 25 TFs in training group and 7 in testing group.
List of documented regulated genes of the 32 TFs was downloaded from “YEASTRACT” database. Their 1 KB upstream sequences were extracted from the yeast genome sequence and were used to scan for the binding motif sequences. The 1 KB upstream region was divided into twenty 50 bp windows and motif occurrence in each window was counted. Then the average occurrence of each window was calculated and a general frequency curve was generated.
For each TF in the testing group, the 1 KB upstream sequences of their regulated genes were input into MEME running on a local cluster, to search for consensus motifs with their expected length around 8 bp, as well as into MDscan, WordSeeker, and DREME. Then the top ten consensus motifs reported from MEME were used as queries to define the MDP.
5. ACKNOWLEDGEMENTS
We are grateful to Hui-Wen Liu at The Ohio State University (OSU) for providing valuable ideas in discussion. We thank Dr. Hideaki Kikuchi at the OSU Department of Biomedical Informatics for providing access to their high performance computing cluster.
REFERENCES
- Latchman, D.S. (1997) Transcription factors: An overview. International Journal of Biochemistry Cell B, 29, 1305-1312. doi:10.1016/S1357-2725(97)00085-X
- Karin, M. (1990) Too many transcription factors: Positive and negative interactions. New Biology, 2, 126-131.
- Roeder, R.G. (1996) The role of general initiation factors in transcription by RNA polymerase II. Trends Biochemistry Science, 21, 327-335. doi:10.1016/0968-0004(96)10050-5
- Nikolov, D.B. and Burley, S.K. (1997) RNA polymerase II transcription initiation: A structural view. PNAS, 94, 15-22. doi:10.1073/pnas.94.1.15
- Lee, T.I. and Young, R.A. (2000) Transcription of eukaryotic protein-coding genes. Annual Review of Genetics, 34, 77-137. doi:10.1146/annurev.genet.34.1.77
- Biggin, M.D. (2001) To bind or not to bind. Nat Genet, 28, 303-304. doi:10.1038/91045
- Ben-Gal, I., Shani, A., Gohr, A., Grau, J., Arviv, S., Shmi- lovici, A., Posch, S. and Grosse, I. (2005) Identification of transcription factor binding sites with variable-order Bayesian networks. Bioinformatics, 21, 2657-2666. doi:10.1093/bioinformatics/bti410
- Bailey, T.L. and Elkan, C. (1994) Fitting a mixture model by expectation maximization to discover motifs in biopolymers. Proceedings of International Conference of Intelligence and Systematic Molecular Biology, 2, 28-36.
- Frith, M.C., Hansen, U., Spouge, J.L. and Weng, Z. (2004) Finding functional sequence elements by multiple local alignment. Nucleic Acids Research, 32, 189-200. doi:10.1093/nar/gkh169
- Marsan, L. and Sagot, M.F. (2000) Algorithms for extract- ing structured motifs using a suffix tree with an application to promoter and regulatory site consensus identification. Journal of Computing Biology, 7, 345-362. doi:10.1089/106652700750050826
- Pavesi, G., Mauri, G. and Pesole, G. (2001) An algorithm for finding signals of unknown length in DNA sequences. Bioinformatics, 17, S207-S214. doi:10.1093/bioinformatics/17.suppl_1.S207
- Stormo, G.D. (1990) Consensus patterns in DNA. Methods Enzymol, 183, 211-221. doi:10.1016/0076-6879(90)83015-2
- Bailey, T.L. (2011) DREME: Motif discovery in transcrip- tion factor ChIP-seq data. Bioinformatics, 27, 1653-1659. doi:10.1093/bioinformatics/btr261
- Lichtenberg, J., Kurz, K., Liang, X., Al-ouran, R., Neiman, L., Nau, L.J., Welch, J.D., Jacox, E., Bitterman, T., Ecker, K., et al. (2010) WordSeeker: Concurrent bioinformatics software for discovering genome-wide patterns and word-based genomic signatures. BMC Bioinformatics, 11, S6. doi:10.1186/1471-2105-11-S12-S6
- Levy, S. and Hannenhalli, S. (2002) Identification of tran- scription factor binding sites in the human genome sequence. Mammalian Genome, 13, 510-514. doi:10.1007/s00335-002-2175-6
- Xie, X., Lu, J., Kulbokas, E.J., Golub, T.R., Mootha, V., Lindblad-Toh, K., Lander, E.S. and Kellis, M. (2005) Systematic discovery of regulatory motifs in human promoters and 3’UTRs by comparison of several mammals. Nature, 434, 338-345. doi:10.1038/nature03441
- Bulyk, M.L. (2003) Computational prediction of transcription-factor binding site locations. Genome Biology, 5, 201. doi:10.1186/gb-2003-5-1-201
- Goffeau, A., Barrell, B.G., Bussey, H., Davis, R.W., Dujon, B., Feldmann, H., Galibert, F., Hoheisel, J.D., Jacq, C., Johnston, M., et al. (1996) Life with 6000 genes. Science, 274, 546-567. doi:10.1126/science.274.5287.546
- Abdulrehman, D., Monteiro, P.T., Teixeira, M.C., Mira, N.P., Lourenco, A.B., dos Santos, S.C., Cabrito, T.R., Francisco, A.P., Madeira, S.C., Aires, R.S., et al. (2011) YEASTRACT: Providing a programmatic access to curated transcriptional regulatory associations in Saccharomyces cerevisiae through a web services interface. Nucleic Acids Research, 39, D136-D140. doi:10.1093/nar/gkq964
- Sandelin, A., Alkema, W., Engstrom, P., Wasserman, W.W. and Lenhard, B. (2004) JASPAR: An open-access database for eukaryotic transcription factor binding profiles. Nucleic Acids Research, 32, D91-D94. doi:10.1093/nar/gkh012
- Ebbole, D.J. (2007) Magnaporthe as a model for understanding host-pathogen interactions. Annual Review of Phytopathology, 45, 437-456. doi:10.1146/annurev.phyto.45.062806.094346
- Choi, J., Kim, Y., Kim, S., Park, J. and Lee, Y.H. (2009) MoCRZ1, a gene encoding a calcineurin-responsive transcription factor, regulates fungal growth and pathogenicity of Magnaporthe oryzae. Fungal Genetic Biology, 46, 243-254. doi:10.1016/j.fgb.2008.11.010
- Kim, S., Hu, J., Oh, Y., Park, J., Choi, J., Lee, Y.H., Dean, R.A. and Mitchell, T.K. (2010) Combining ChIP-chip and expression profiling to model the MoCRZ1 mediated circuit for Ca/calcineurin signaling in the rice blast fungus. PLoS Pathogens, 6, e1000909. doi:10.1371/journal.ppat.1000909
- Lin, Z., Wu, W.S., Liang, H., Woo, Y. and Li, W.H. (2010) The spatial distribution of cis regulatory elements in yeast promoters and its implications for transcriptional regulation. BMC Genomics, 11, 581. doi:10.1186/1471-2164-11-581
- Harbison, C.T., Gordon, D.B., Lee, T.I., Rinaldi, N.J., Macisaac, K.D., Danford, T.W., Hannett, N.M., Tagne, J.B., Reynolds, D.B., Yoo, J., et al. (2004) Transcriptional regulatory code of a eukaryotic genome. Nature, 431, 99-104. doi:10.1038/nature02800
- Koudritsky, M. and Domany, E. (2008) Positional distribution of human transcription factor binding sites. Nucleic Acids Research, 36, 6795-6805. doi:10.1093/nar/gkn752
- Liu, X.S., Brutlag, D.L. and Liu, J.S. (2002) An algorithm for finding protein-DNA binding sites with applications to chromatin-immunoprecipitation microarray experiments. Natural Biotechnology, 20, 835-839.
- Lichtenberg, J., Yilmaz, A., Welch, J.D., Kurz, K., Liang, X.Y., Drews, F., Ecker, K., Lee, S.S., Geisler, M., Grotewold, E., et al. (2009) The word landscape of the noncoding segments of the Arabidopsis thaliana genome. BMC Genomics, 10, 463. doi:10.1186/1471-2164-10-463
- Zhu, G., Spellman, P.T., Volpe, T., Brown, P.O., Botstein, D., Davis, T.N. and Futcher, B. (2000) Two yeast forkhead genes regulate the cell cycle and pseudohyphal growth. Nature, 406, 90-94. doi:10.1038/35017581
- Spellman, P.T., Sherlock, G., Zhang, M.Q., Iyer, V.R., An- ders, K., Eisen, M.B., Brown, P.O., Botstein, D. and Futcher, B. (1998) Comprehensive identification of cell cycle-regulated genes of the yeast Saccharomyces cerevisiae by microarray hybridization. Molecular Biological Cell, 9, 3273-3297.
- Gupta, S., Stamatoyannopoulos, J.A., Bailey, T.L. and No- ble, W.S. (2007) Quantifying similarity between motifs. Genome Biology, 8, R24. doi:10.1186/gb-2007-8-2-r24
- Kullas, A.L., Martin, S.J. and Davis, D. (2007) Adaptation to environmental pH: Integrating the Rim101 and calcineurin signal transduction pathways. Molecular Microbiology, 66, 858-871. doi:10.1111/j.1365-2958.2007.05929.x
NOTES
*Corresponding author.