Modern Economy
Vol. 4 No. 6 (2013) , Article ID: 33130 , 17 pages DOI:10.4236/me.2013.46046
Demand Growth versus Market Share Gains: Decomposing World Manufacturing Import Growth
1International Trade Department, World Bank, Washington DC, USA
2Trade and International Integration Team (DECTI), Development Research Group, World Bank, Washington DC, USA
Email: ataman.aksoy@gmail.com, fng@worldbank.org
Copyright © 2013 M. Ataman Aksoy, Francis Ng. This is an open access article distributed under the Creative Commons Attribution License, which permits unrestricted use, distribution, and reproduction in any medium, provided the original work is properly cited.
Received January 18, 2013; revised February 18, 2013; accepted March 18, 2013
Keywords: Global Manufacturing Export Growth; Industrial and Developing Country Import Growth; Decomposition of Growth; Demand Growth; World Market Share Changes; Market Penetration; Gross Manufacturing Production and Outputs; Trade Pattern and Growth
ABSTRACT
This paper decomposes manufacturing import growth rates in a selected set of large industrial and developing countries (five industrial and eight developing) and measures the relative contributions of domestic demand and market share changes for two separate periods 1991/92-2001/02 and 2001/02-2007/08. It also shows the shares of imports both from the rest of the world and from developing countries for aggregate and three digit manufacturing sectors. Import growth is much higher during the 2000s driven by higher demand growth rates. While market share changes explain most of the growth during the 1990s, its contribution is relatively smaller during the 2000s. Imports from developing countries have grown much faster both in industrial and developing country markets driven primarily by market share changes. However, more than half of market share gains by developing countries are caused by the exports of China which accounts for more than 70 percent of market share gains of developing countries in our sample countries during the 2000s. Despite rapid growth, developing country’s share in the gross absorption of the sample countries is still very low and can expand substantially even if demand growth is much lower in the near future.
1. Introduction
Within the last few decades, global manufactured goods trade has grown very fast. This growth has been driven both by liberalization of trade regimes across the globe and high demand growth rates especially among developing countries and especially during the 2000s. Trade liberalization has also contributed to global trade expansion. As trade barriers have fallen, increased production sharing and specialization have led to expansion of both exports and imports. These developments have led to increased import shares in almost all countries. While much of liberalization has been unilateral, there are also greater uses of regional agreements.
Recent developments suggest world demand decreases (or slower demand growth) for the near future and it would be difficult to recreate the rapid demand growth of 2000s. Yet the import penetration and growth of both imports and exports should continue if the liberalized trade regimes are maintained and improved. Thus it is important to have some understanding about the relative contribution of market share changes (created because of more liberal trade regimes) and import increases caused by the increases in demand. It is also important to separate 1990s when demand growth was lower from the 2000s when demand growth was much higher.
This paper decomposes import growth rates for a set of large industrial and developing countries (five industrial and eight developing) and measures the relative contributions of domestic demand and market share changes for two separate periods 1991/92-2001/02 and 2001/02- 2007/08 (using 2-year averages to minimize the annual fluctuations in trade and output production). It also shows the changes in the shares of imports both from the rest of the world and from developing countries for aggregate and three digit manufacturing sectors. Import shares and their changes show the relative magnitude of the openness in key industrial and developing countries and its change over the last two decades. Canada, France, Germany, Japan, and United States were selected as the industrial countries, and China, Brazil, India, Korea Republic, Malaysia, Mexico, South Africa, and Turkey were selected as the developing countries1.
Most of the market share analyses have been carried out using only exports, and testing whether the exports of a specific country have expanded at the same rate as world exports [1-6] etc. These exercises take the world trade growth as given and estimate the relative performance of counties against this trend, and not what determines that trend. The contribution of market share changes versus demand increases in explaining trade growth has not received much attention2. One simple way of analyzing this issue is to see whether the growth of imports in selected markets are driven by the demand increases or they have expanded by gaining market shares in the importing countries. This can be done by estimating the shares of imports in domestic absorption and then measuring the changes in these shares. These changes in shares show the contributions of share changes while import increases under constant market shares show the contribution of demand increases. This decomposition can also shed light on the likely outcomes for world trade growth under different global demand growth scenarios [7,8].
A related issue involves the role of developing (especially emerging market) countries in world manufacturing trade. Many have also argued that developing country exports are taking a big share of the markets in industrial countries and that within manufacturing a significant portion of production is moving from industrial to developing countries. Some have even argued that this development is leading to deindustrialization of many industrial countries. Along with the decomposition exercise, this paper also estimates the magnitude of developing country exports (aggregate and 3 digit) within the domestic absorption and production in these selected countries (both industrial and developing) and their evolution over the last two decades.
Finally, the study analyzes two periods with very different trade growth rates. World trade growth in current US dollars accelerated for all countries during 2001/02-2007/08 period but the acceleration of export growth of developing countries was greater and reached 18.2 percent per annum during this period. As a result developing countries have increased their market share of global manufactured exports and imports from about 20 and 35 percent in 1991/92 to 44 and 46 percent in 2007/ 08 respectively.
Section B explains the methodology and the data. In Section C, the shares of total imports from the rest of the world and their decomposition are analyzed separately for the selected industrial and developing countries. Section D focuses on exports from developing countries to industrial and other developing countries, and extends the analysis to 3-digit ISIC sectors. Very rapid growth of China, especially during the 2000s distorts most of the conclusions and analyses in the previous sections. The impact of China is discussed throughout the text in but given its importance, Section E summarizes its impact on world trade. Section F provides the main results and implications from this empirical analysis. Conclusions are presented in Section G.
The main findings in this paper show that world demand growth is very different during 1990s and 2000s. Demand growth has accelerated during the 2000s. While market share changes explain most of the growth during the 1990s, its contribution is relatively smaller during the 2000s. Even without demand growth, continued liberal trade regimes could generate 3 - 5 percent per annum manufacturing trade growth caused by market share changes.
Imports from developing countries have grown much faster both in industrial and developing country markets. Despite the rapid growth, their share in the absorption of the sample countries is still very low and can expand substantially even if demand growth is much lower in the near future. However, most of this share increase is driven by China. Furthermore, China is among few countries which have reduced its share of imports from other developing countries. Future manufacturing trade growth will depend on the evolution of trade patterns of China as much as other economic developments.
2. Methodology and Data
The total gross absorption (demand) in each country is estimated as gross production in manufacturing, minus exports plus imports, for the beginning and end years. Gross production is taken from UNIDO database [9] and checked against other sources for consistency3. All gross production data is converted to US dollars at the current average exchange rates, to make them consistent with trade data from UNSD COMTRADE [10] which is denominated in US dollars (see [11]). These are nominal US dollar values which include US dollar inflation and changes in the real exchange rates of local currencies against the US dollar4. Canada, France, Germany, Japan, and United States were selected as the industrial countries, and China, Brazil, India, Korea Republic, Malaysia, Mexico, South Africa, and Turkey were selected as the developing countries.
Import growth in these countries is decomposed into changes due to demand increases and changes due to market share changes. The contribution of demand changes is estimated assuming a constant share of imports in gross domestic demand between the two time periods, i.e. the market shares do not change. The market share changes are then estimated as the difference between the actual import growth rate and the import growth rate under a constant market share assumption. The periods of 1991/ 92, 2000/01, and 2007/08 are used as benchmarks to estimate the growth rates and import shares. Two year averages are used to minimize the annual fluctuations in output and trade. 2007/08 is used as the final year both due to data availability, and more importantly, it is the last year before the global financial crisis. The analysis of the impacts of the crisis on trade values requires a separate study.
This simple method has some limitations. First, it assumes that the income elasticity of demand for specific products exported by a group of countries is identical to the average income elasticity for the sectors as a whole. This bias decreases as the number of products exported increases and as product categories get narrower. Second, it assumes that market share changes are independent of demand growth. Normally, one would expect that when the rate of growth of demand accelerates, there would be spillovers to imports that will increase the import shares. This relationship was tested using the both the detailed 3-digit subsector information using imports and exports from developing countries and aggregate global imports for the selected 13 countries. The relationship between the market share changes and demand changes were not significant across industries and countries5. (See Annex Table 1).
The developments in our sample countries (key players in world trade) do not exactly mimic total world trade developments but are quite close. In Table 1, key growth rates for world trade and the sample countries are presented. Major difference between all countries and our sample is that our sample of developing countries had a lower share of total imports in 1991/92 than total developing countries (at 24.3 percent versus 34.6 percent) and had much higher rate of import growth than total developing countries (11.5 percent p.a. versus 6.2) during the 1991/92-2001/02 period. The rest of the growth rates are not identical but not sufficiently different to create major differences of interpretation.
3. Aggregate Import Growth Decomposition
3.1. Industrial Countries
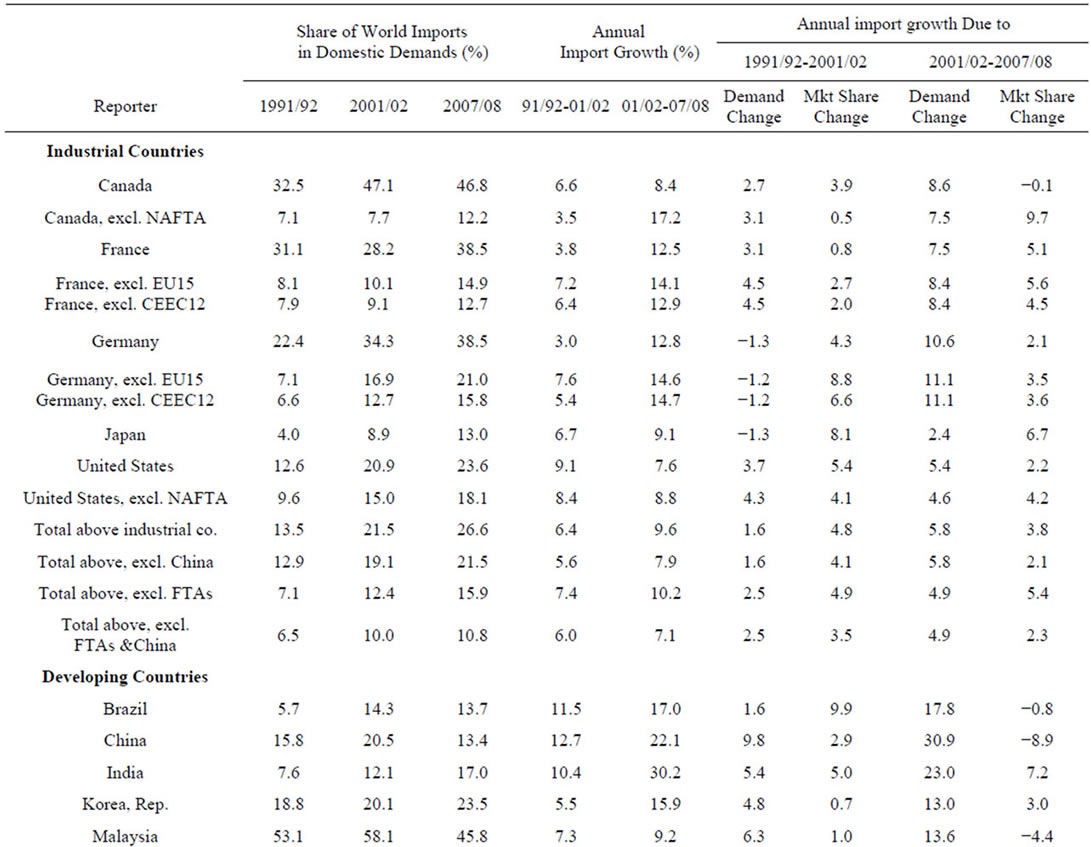
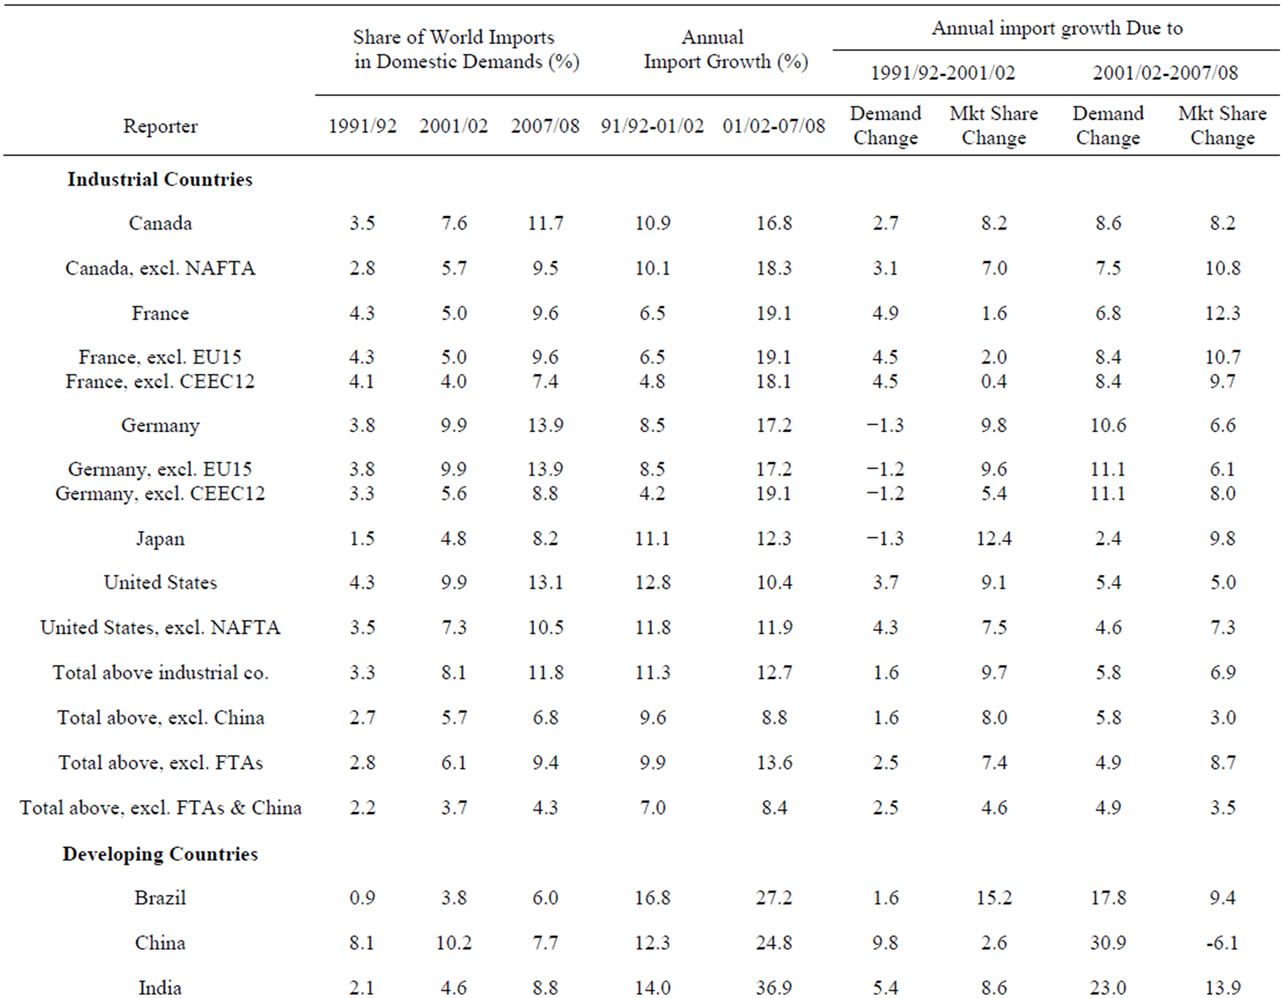
Tables 2 and 3 show the share of imports, import growth rates and their decomposition for the selected industrial and developing countries respectively6. Totals are weighted averages.
There is one important difference between the first period 1991/92-2001/02 and the second one 2001/02- 2007/08. Industrial countries’ demand growth almost quadrupled from 1.6 percent p.a. to 5.8 percent p.a. Market share changes moved in the opposite direction but only declined to 3.8 percent p.a. from 4.8 percent p.a. Average import growth, which is the sum of demand and market share changes, accelerated from 6.4 percent to 9.6 percent per annum.
Along with the acceleration of demand growth during the second period, relative contribution of demand and market share changes to import growth got reversed. During the first period, except for France, the contribution of market share changes to import growth is much larger than the contribution of demand growth. France has actually import substituted during this period and reduced its share of imports. During the second period, demand increase rate has almost quadrupled and, except for Japan, the contribution of demand growth has been higher then market share changes. But even with higher contribution from demand growth, the role played by market share changes is highly significant and explains almost forty percent of total import growth even during the second period. Market share changes for Japan during both periods, and Germany during the first period, explain bulk of import growth. So if the market shares had stayed the same, and imports only grew at the same rate as domestic demand, the import growth rate in these five countries would have been only 1.6 percent p.a. during the first period and about 6 percent p.a. during the second. Conversely, even in the absence of any demand growth, imports would have increased 4.8 percent p.a. during the first and 3.8 percent p.a. during the second period; very respectable trade growth rates for rich countries.
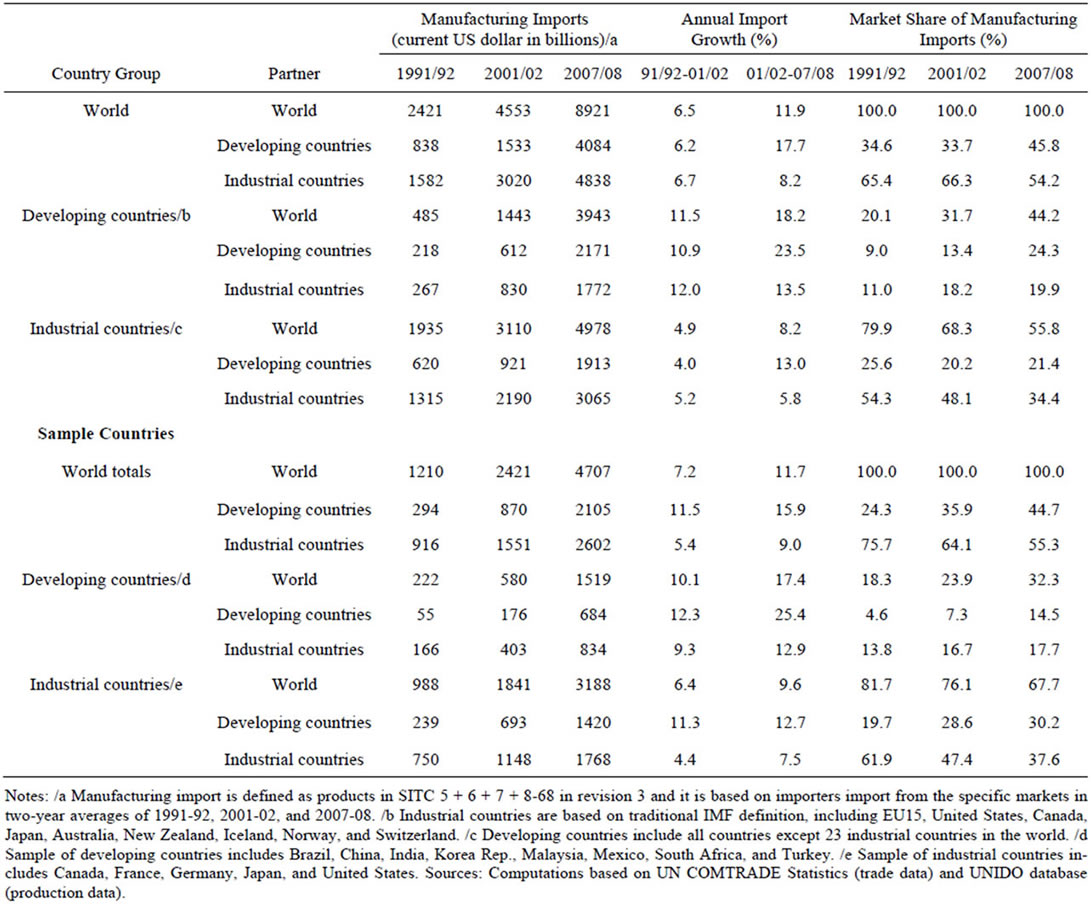
Table 1. Growth of manufacturing imports and their market shares in world and sample countries.
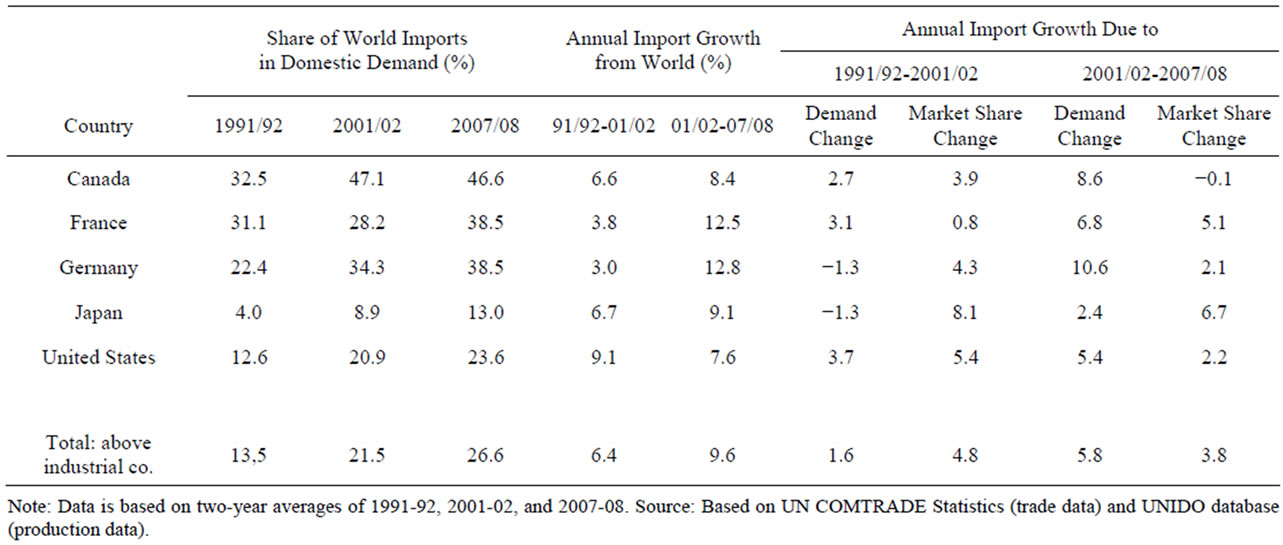
Table 2. Global manufacturing imports of industrial countries from 1991/92 to 2001/02 and 2001/02 to 2007/08.
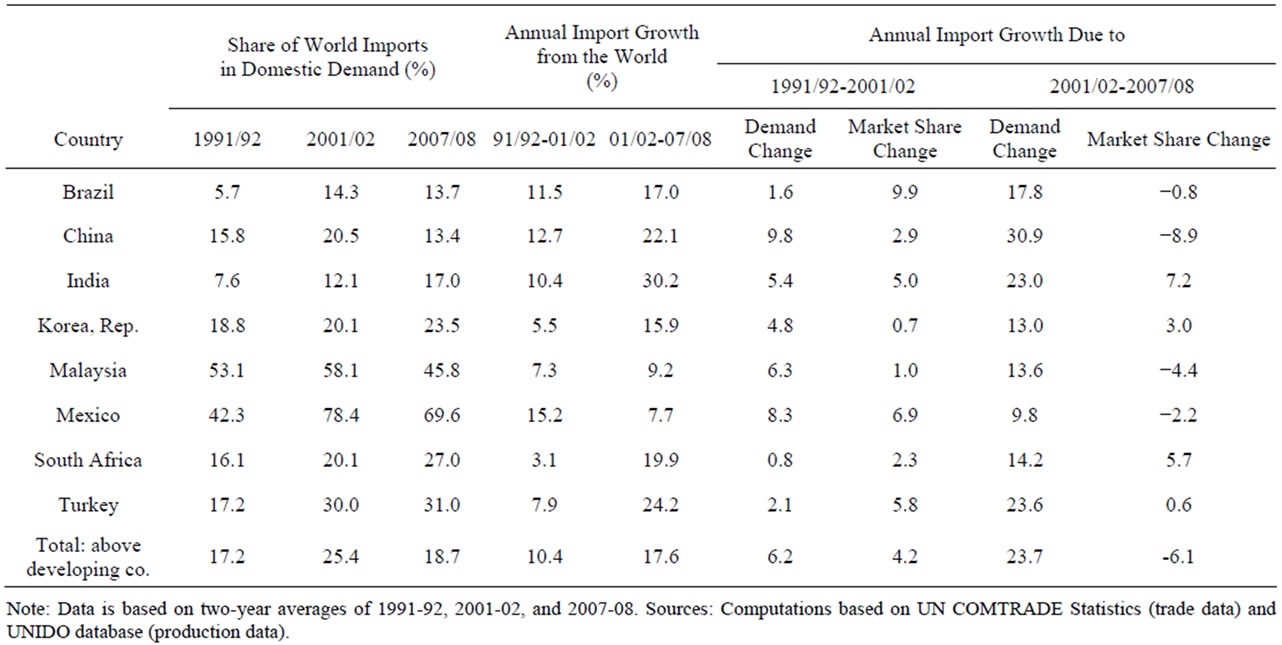
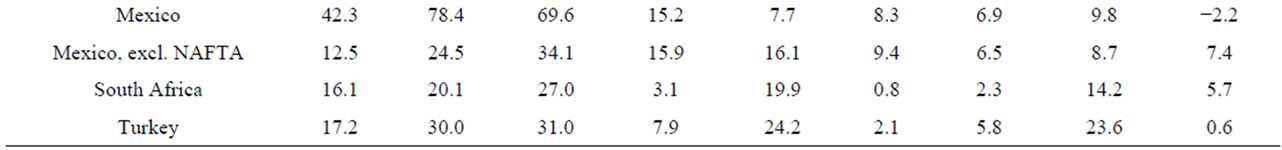
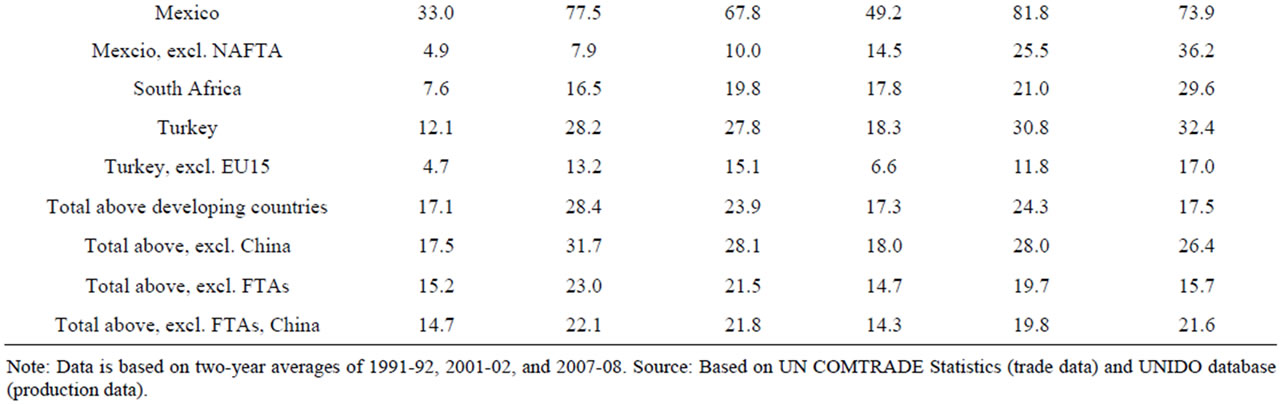
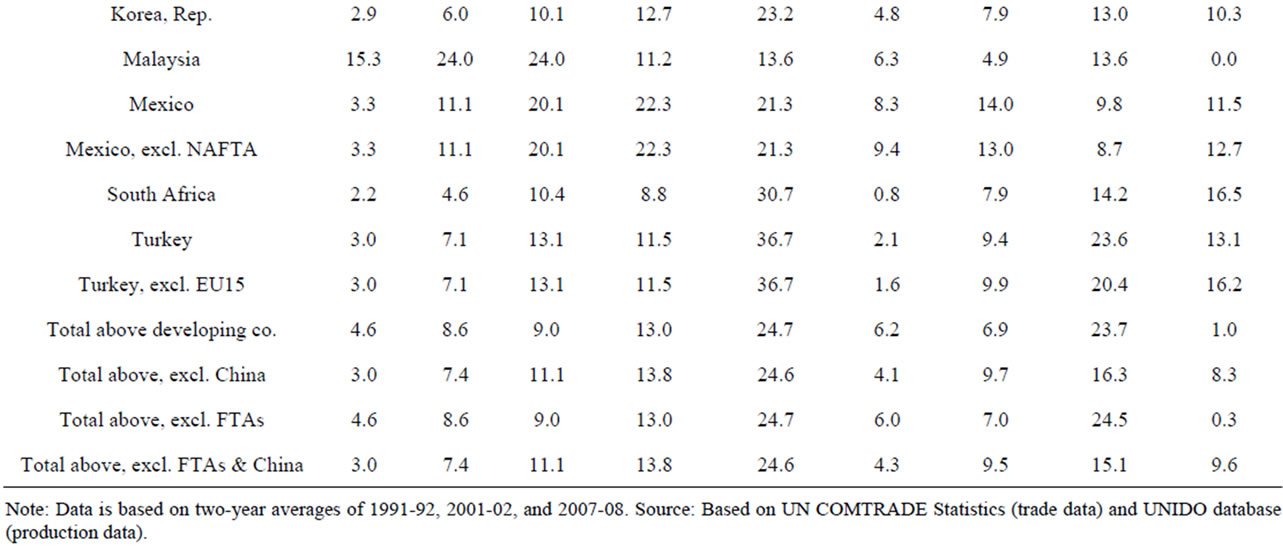
Table 3. Global manufacturing imports of developing countries from 1991/92 to 2001/02 and 2001/02 to 2007/08.
The share of imports in domestic demand varies by country. In 2007/08, Canada had the highest share at about 47 percent followed by Germany and France at above 39 percent. Japan had the lowest at 13 percent. Despite two decades of increasing import shares for these five countries, their average import share in domestic demand have only increased to about 27 percent by 2007/08. Of this 27 percent, about 11 percent is attributable to imports from countries with preferential agreements (Annex Table 2). Thus, after a period of very rapid growth and liberal trade regime, import shares of the industrial countries, excluding imports from countries with preferential agreements, was only 16 percent. On the other hand, all five countries have experienced significant import share increases during the last two decades.
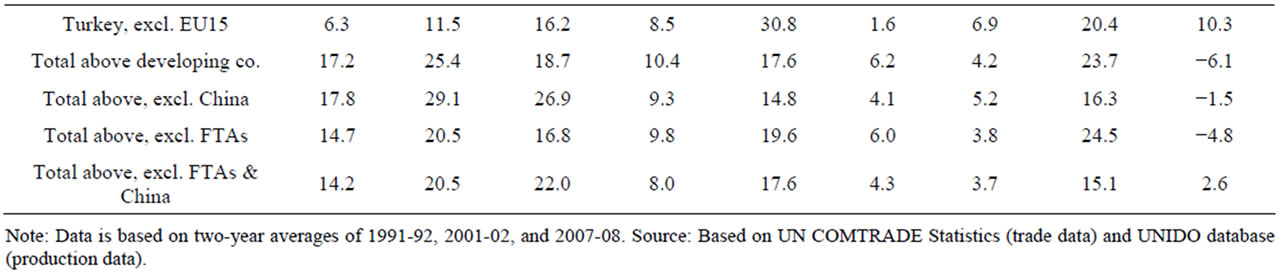
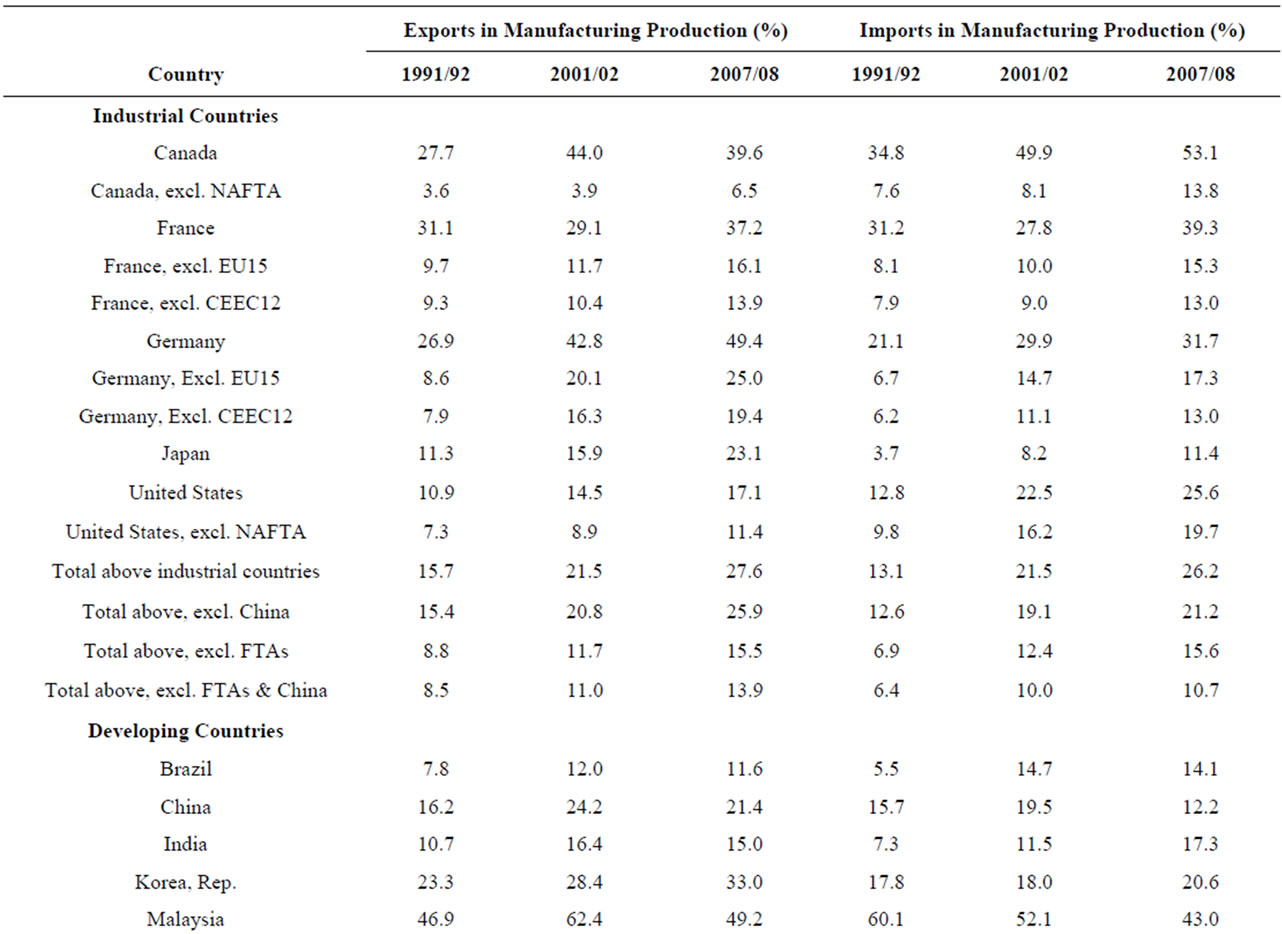
The definition of gross absorption used in this paper is not a very common concept. Annex Table 3 shows the import and exports as a share of gross domestic production which as a measure is more familiar. In this table there are few anomalies. Japan, which had a reputation of a major exporter during the pre-1990 period, had only 12 percent of its output exported and only imported 4 percent of its output equivalent in 1991/92. After two decades of very low domestic demand growth and export led expansion, its exports only reached 23 percent of output by 2007/08, which is less than a quarter of its output. Its imports only reached 11 percent of its output leading to larger trade surpluses as a percentage of its manufacturing output. Germany shows even a greater export orienttation during the 2000s. Both its import and output shares in output increased but the increase in its export shares are much greater and leading to large trade surpluses7. By 2007/8, Germany exported almost half of its output, highest among large industrial countries.
3.2. Developing Countries
Developing country import behavior in some ways is similar to that of the industrial countries. Import growth rates accelerate from already high rates of 10 percent p.a. during the first period to almost 18 percent p.a. during the second. The acceleration of demand growth is much more dramatic; from an average of 6.2 percent growth per annum during to first period to almost 24 percent p.a. during the second, much higher than that of industrial countries. During the first period, demand growth is high in Mexico and China and low in Brazil, Turkey and South Africa. During the second period, demand growth accelerates in almost every country, reaching 31 and 23 percent per annum respectively in China and India.
During the first period, import shares increase in all our sample countries. Some are very dramatic, such as Turkey and Mexico caused by joining NAFTA for Mexico and EU for Turkey. Other developing countries such as and Brazil also have high rates of import share increases.
The second period is different from the first beyond the rapid acceleration in demand growth. The average contribution of market share changes for developing countries are negative, suggesting that there has been import substitution within the manufacturing sector despite trade liberalizations. While China accounts for most the import substitution8, even without China, the net markets share changes in Malaysia, and Mexico are also negative and large9. The differences between other developing countries that have increasing import shares, and China, Mexico and Malaysia that have decreasing import shares, suggest further differentiation.
Mexico and Malaysia had manufacturing sectors that had significant assembly operations using mostly imported components and thus had very high import shares. Malaysia had these industries starting in the 1980s. Mexico expanded the “Maquiladores” after it joined NAFTA in 1994. In 2001/02, Malaysia had an import share of 58 percent while for Mexico this share reached 78 percent. While Chinese manufacturing does not fit this definition fully, it also had a large export sector that was based on imported components with relatively lower value added [12-16]. During the 2000s, these three countries must have increased domestic supply of components and reduced the share of imports. Many of the imported components and intermediaries might have started to be produced domestically because of larger domestic demand for them and larger scale suppliers might have invested in these countries to be close to their markets. Or alternatively some goods for final demand might have started to be locally produced.
If these three countries, China, Mexico, and Malaysia are excluded from our developing country list; market share changes in the remaining developing countries are quite similar to developments in industrial countries. Figure 1 shows average market share changes and demand increases for the three groups of countries. First group is the five industrial countries. The second group is the three import substituting countries of China, Mexico and Malaysia. The third group is the other five large developing countries (India, Brazil, Korea Republic, South Africa, and Turkey).
Import substituting countries (including China, Mexico, and Malaysia) have much higher import growth rates during the first period with little market share changes and during the second period a faster demand growth rate with reductions in import shares. Other developing countries group (Brazil, India, Korea Republic, South Africa, and Turkey) has higher demand increases than industrial countries (much higher during the second period) but rather similar market share change rates. Industrial countries have market share changes of 4.8 and 3.8 percent p.a. during the first and second period respectively and the other developing country group has an average market share changes of 3.6 and 2.6 percent p.a. It is possible to argue that for most large countries, ceteris paribus, one can expect 3 - 5 percent trade expansion even if there are no increases in demand. The role of increases in import shares can be seen more clearly in Figure 2.
While the import substituting group shows large fluctuations driven primarily by China, the other two groups show steady increases in import shares. Other developing country group was slightly less open than industrial countries in 1991/92; this difference has continued during the second period and industrial countries continue to be more open. Again, one can assume that the other developing countries will continue to increase their import shares rates along with the industrial countries generating some trade growth even in the absence of demand growth.
4. Market Shares of Developing Country Exports
4.1. Industrial Countries
One of the important developments during the last few decades has been the rapid expansion of exports from developing countries both to the industrial countries and to other developing countries (see [17,18]). This has led to fears that industrial countries were being de-industrialized and most of manufacturing production would be taken over by the developing countries. There are also arguments that recent deceleration of growth in industrial
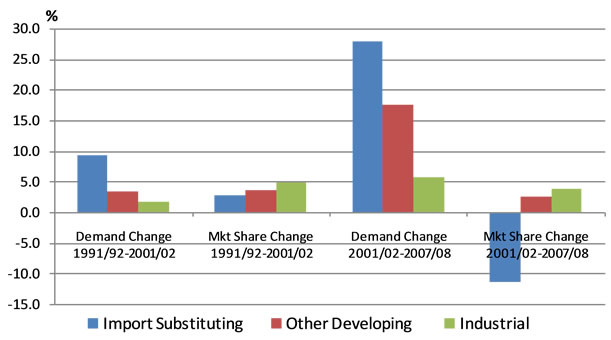
Figure 1. Import growth decomposition.
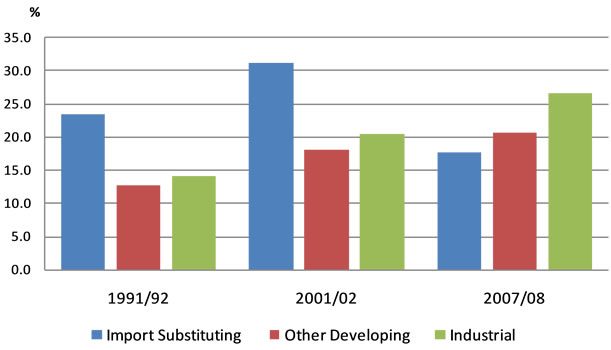
Figure 2. Import shares.
countries would lower the export and output growth of developing countries and the developments of last two decades might not be replicated. Tables 4 and 5 show behavior of manufacturing imports from developing countries for our sample of industrial and developing countries.
Table 4 shows the shares of imports from developing countries in the total gross absorption (demand) of the five industrial countries, growth rate of these imports, and the decomposition of the import growth between demand and market share changes. Import growth rates from developing counties (about 11 and 13 percent p.a.) are much higher than their import growth rates from the rest of the world shown in Table 2. Import growth rates from developing countries are almost identical for the two periods while world trade growth has doubled during this time. Especially during the first period when the demand increases in industrial countries amounted to only 1.6 percent per annum, imports from developing countries increased by more than 11 percent p.a. Most of the import growth was caused by market share changes rather than demand increases. During the second period, despite higher demand growth, market share changes are still greater than demand changes. For this group of industrial countries, market share changes explain the bulk of the growth of imports from developing countries10. Of course, market penetration of almost 10 percent p.a. is much more disruptive and politically more sensitive.
Despite the rapid import growth caused by market penetration, by the end of the second period, the share of imports from developing countries in domestic absorption of this set of industrial countries was only about 12 percent. This 12 percent also includes the 12 countries that joined EU after 199211. Of the remaining 88 percent, 14 percent came from exports of other industrial countries; while the rest (74 percent) came from domestic production. If China is excluded, the share of developed country imports goes down to 6.8 percent. Excluding China and developing countries included in regional trade arrangements such as EU and NAFTA reduces the share of all other developing countries to only 4.3 percent. The share of imports from developing countries is lower in Japan and France compared to the other three countries (see Annex Table 4).
It is possible to interpret the changes in market shares of developing countries in two ways. One is to highlight the fast growth and argue that market shares have tripled over two decades, which is a very dramatic increase which cannot be sustained. Furthermore, developing countries have expanded their exports through primarily replacing domestic production.
On the other hand, the shares of developing country exports (including China and EU 12 countries) in total demand of these industrial countries were less than 12 percent at the end of almost two decades of very rapid import growth. So small changes in market shares of developing countries in the markets of industrial countries over the next decades can drive the export growth from developing countries at very high rates even if their absolute absorption growth rates decline significantly over the next decades. The shares are still small enough so that fast growth of exports can be accomplished without significant production losses by the industrial countries.
This aggregate picture masks large differences in market penetration in different sub-sectors. Table 5 shows the market shares and the decomposition of import growth from all developing countries into the five Industrial countries by selected 22 3-digit sub-sectors. These 3- digit ISIC in Revision 3 sub-sectors range from very capital intensive, such as rubber and glass, to very labor intensive such as garments and footwear.
There are significant differences in market shares among different industries, arising from comparative advantage as well as differences in protection. There are two sets of subsectors that have reached high import penetration rates in 2007/08. First set includes the traditional labor intensive subsectors such as wearing apparel (70.3 percent), leather (71.4 percent), and textiles (40.2 percent). The second are the more recent labor intensive sectors such as office machinery (53.9 percent) and radio, television etc (36.5 percent). These are mostly classified as high technology products but their nominal growth rates have also been very low. These are the sectors where developing countries have gained significant market shares. On the other extreme sectors such as, tobacco (1.1 percent), paper (3.5 percent), publishing (2.7 percent), and food processing (5.3 percent) have low import shares.
In this set of subsectors, market share increases dominate import growth. In both periods and for almost all the subsectors, contribution of market share changes is greater than the contribution of demand growth. That is the reason for rapid import growth despite very low demand increases for many of the labor intensive subsectors. For example, for garments and footwear, despite negative and very low demand increases, imports have increased substantially purely on the basis of market share increases.
Market share gains are significant in almost all sectors including many of the high technology sectors such as machinery, medical precision equipment, and the like. This suggests that the rise of South in gaining competitiveness in sectors have the domain of industrial countries is significant and is continuing (Akyuz, 2012).
Finally, while the growing competitiveness of developing countries is impressive, a significant portion of the increases in market shares are driven by the exports from China (see details in Section E). This is especially prevalent in the 2000s where more than 70 percent of market share gains are due to increases in imports from China.
4.2. Developing Countries
One of the most important developments of the last two decades is the growth of south-south trade (see [19-25]). All developing country imports from all developing counties increased at a slower rate than their imports from industrial countries during the 1990s but these were reversed during the 2000s where their imports from developing countries grew at almost 25 percent versus 14 percent per annum growth for their imports from industrial countries. By 2007/08 they were importing more from other developing countries than they were from industrial countries (see figures on Table 1).
Narrowing the data to our sample of seven developing countries the results are slightly different. Their import growth rates from other developing countries are higher than their import growth rates from industrial countries in both periods. However, they still import more from industrial countries than they do from other developing countries (see Table 1). Their imports from industrial countries were 16.8 percent of their total absorption in 2001/02 while their imports from other developing countries were only 8.8 percent (see Tables 3 and 6). By 2007/08, these ratios were only 9.7 and 9.0 percent respectively. Our sample of developing countries have significantly reduced relative share of their imports from industrial countries and maintained their imports from developing countries. Thus, the sample developing countries’ import structure has become more balanced between industrial and other developing countries.
Acceleration of import growth from other developing countries to about 25 percent p.a. during the second period is especially dramatic. In all countries excluding China, share of imports from developing countries increased substantially along with higher import growth rates. In China also, import growth has increased to 25 percent per annum but the demand increase has been much higher than the import growth rates leading to declining shares of imports from developing countries in domestic demand. During the first period, excluding China and Malaysia, the contribution of market share changes are greater than demand increases. Even in the second period when demand increases dominate, absolute contributions of market share changes reach almost double digit levels in six out of eight countries. Thus China and to less extent Malaysia are an exception to the general trend of increasing share of imports from developing countries. While it has reduced its share of imports from other developing countries it has increased the share its exports in other developing countries and a significant part of the increase in the share of imports from developing countries is driven by the exports of China (see details in the next Section E). Without China, the increase in the shares of developing countries in out sample countries have also increased but at much slower rates.
Table 7 shows the disaggregated imports of our developing country sample from all developing countries by three digit industries. Again in many of the sectors the share of imports from developing countries is very low. For industrial countries the significant market shares are concentrated in two distinct sets of industries, traditional
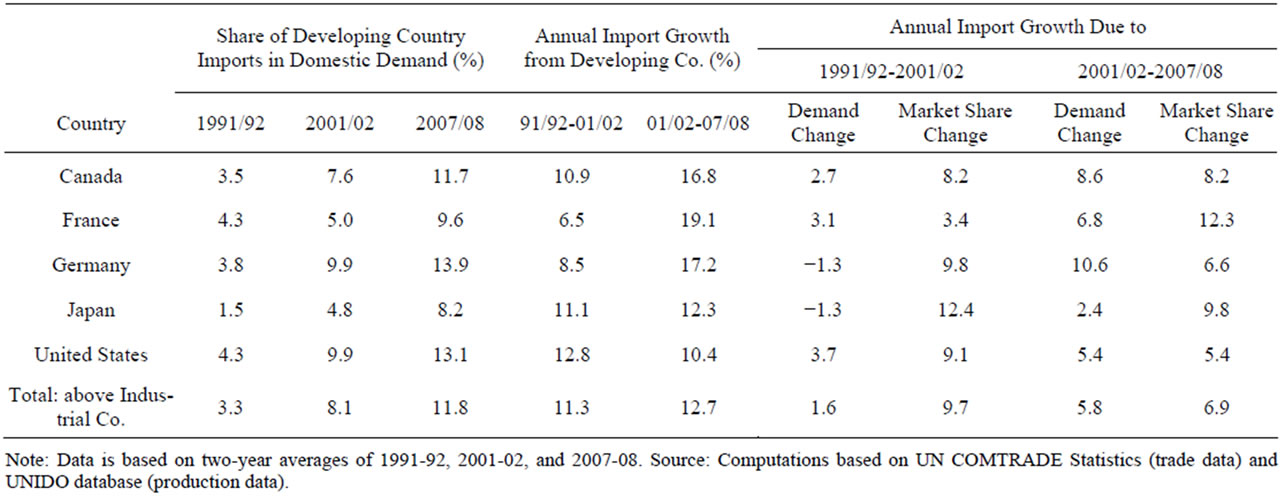
Table 4. Industrial country imports of manufacturing goods from developing countries during 1991/92 to 2001/02 and 2001/02 to 2007/08.
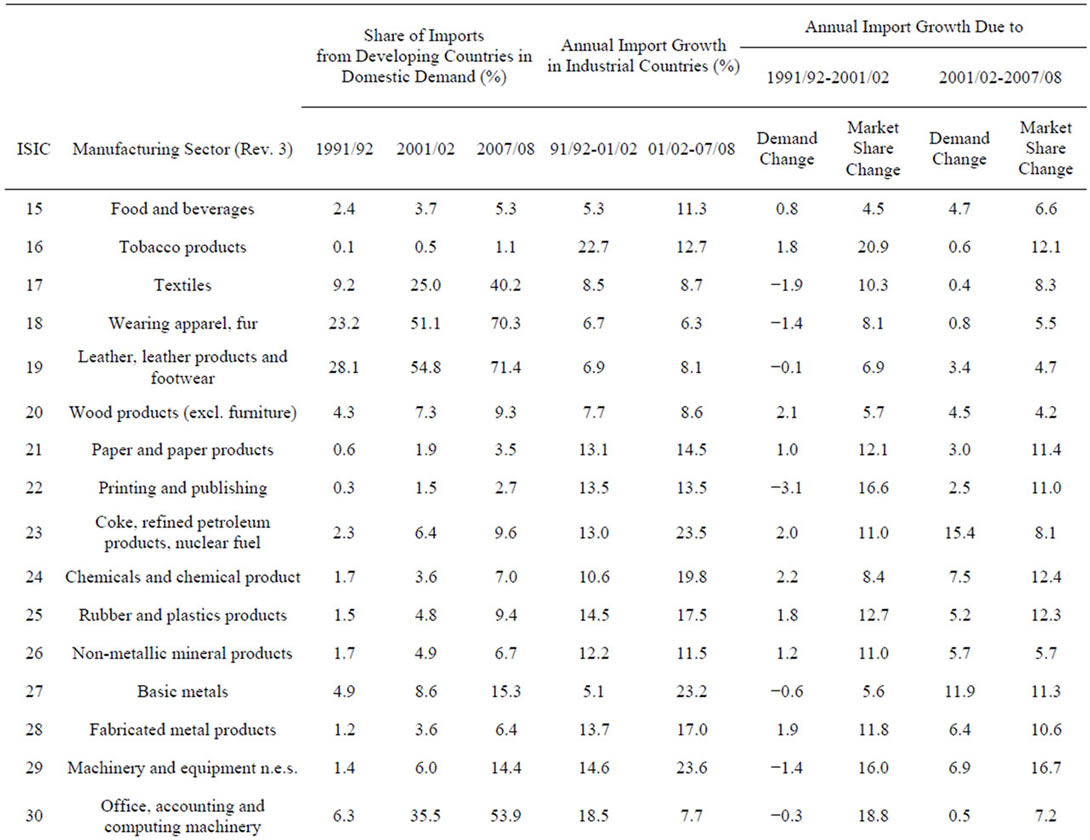
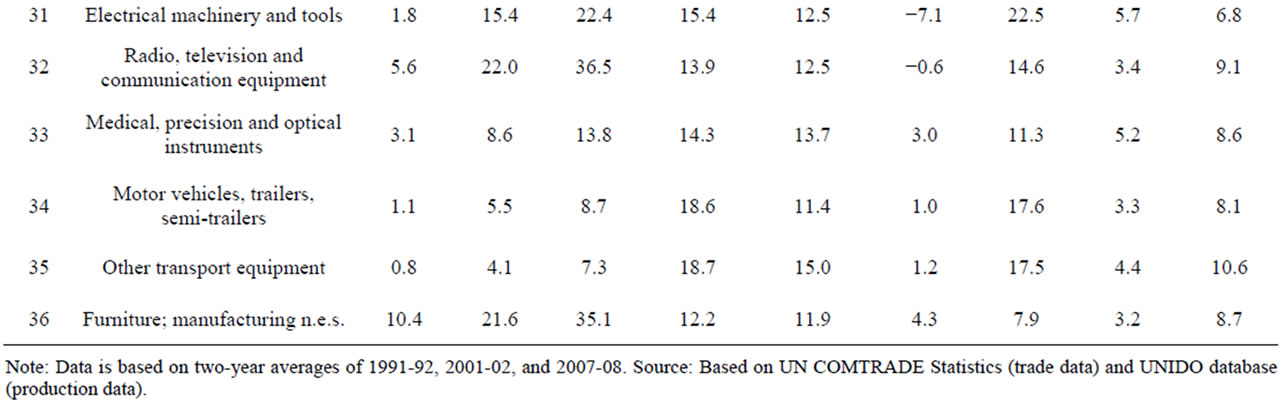
Table 5. Industrial countries’ manufacturing imports from developing countries by sector during 1991/92 to 2001/02 and 2001/02 to 2007/08.
and new labor intensive activities. But unlike the imports of industrial countries, the shares of imports in total demand are quite low in traditional labor intensive sectors of textiles, garments and leather products. In developing countries share of imports are high only the new labor intensive subsectors such as office machinery, and radio and television; similar to industrial countries.
The contribution of market share changes is much higher during the first period where demand increases are lower. During the second period, demand increases overwhelm the market share changes and very high import growth rates are achieved by mostly by demand increases. In machinery related (29 to 34) subsectors, market share changes has played a more important role.
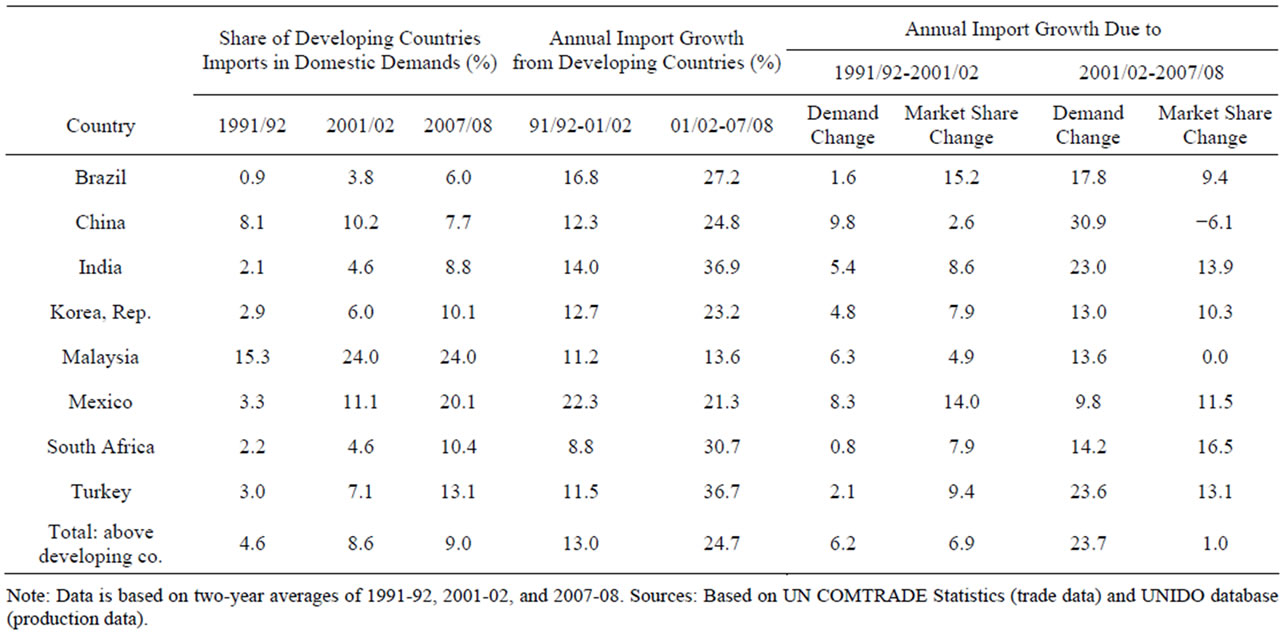
Table 6. Developing country’s manufacturing imports from developing countries during 1991/92 to 2001/02 and 2001/02 to 2007/08.
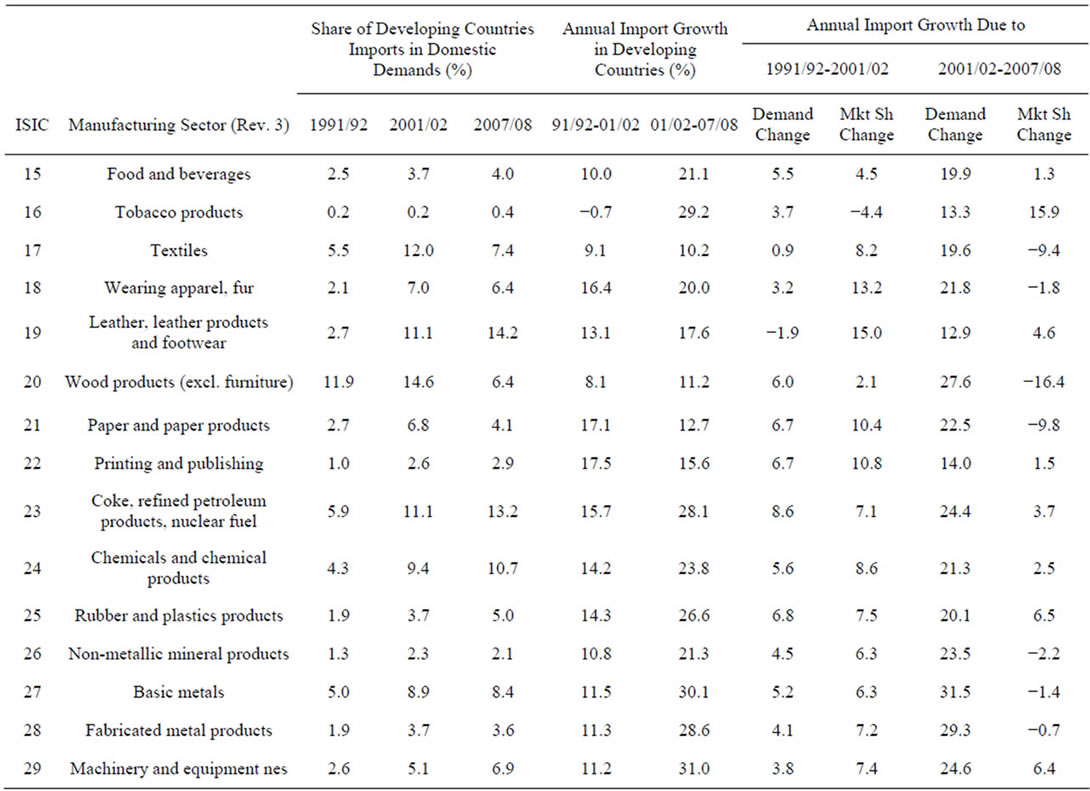

Table 7. Developing country’s manufacturing imports from developing countries by sector during 1991/92 to 2001/02 and 2001/02 to 2007/08.
5. Impact of China
China is one of the outliers in out sample of countries. It has the highest rate of demand growth throughout the two periods reaching 31 percent per annum during the second period. Its trade has also increased at very high rates. For our sample of countries, it has become the world’s largest manufacturing goods exporter and third largest importer. It accounted for almost 31 percent of exports from all developing countries (14 percent of world exports) in 2007/08. This ratio was 18 percent in 2001/02 and only 14 percent in 1991/02. China has an even bigger share of 44 percent in 2007/8 of all developing country exports to industrial countries. Without China, the share of developing country exports in total absorption of our sample of industrial countries is only 6.8 percent (see Table 8).
China’s production has increased at rates even higher than its trade growth; about 31 percent p.a. during the second period. Thus the shares of both exports and imports have decreased as a share of output during this period. Its share of exports as a percentage of gross output increased from 16.2 in 1991/2 to 24.2 percent 2001/02, and then decreased to 21.4 percent in 2007/08. Its share of imports in total production has increased from 15.7 percent in 1991/92 to 19.5 percent in 2001/02, but decreased to 12.2 percent in 2007/08 (see Annex Table 3). Thus the dramatic increase in production was not led by international trade but by domestic demand and import substitution. Its imports and exports are distributed equally between the industrial and developing countries.
Table 8 shows the performance of developing countries with and without China for our sample countries. This table revises two important conclusions reached in this paper. First, most of market share gains attained by the developing countries in the markets of industrial countries are driven by exports from China where, China accounts for 72 percent of market share gains during the 2000s. In terms of annual markets share gains, all developing countries excluding China increased their market shares in the markets of industrial countries only at 3 percent p.a. The ratio for China for the same period was 14 percent p.a.
Second, China also accounts for the bulk of the increases in South-South trade during the 2000s. China accounts for 82 percent of the market share gains of developing countries in the markets of our 7 large developing countries. Without China, market share gains of all developing countries in our sample would be 2.4 percent p.a. versus 20.5 p.a. for China. This relationship holds true for all countries in our sample. Thus, these generalizations about south-south trade need to be reanalyzed and China has to be treated separately.
6. Results and Implications
In this study we analyzed the pattern of manufacturing trade for a group of large industrial and emerging market countries. Our basic hypothesis that a significant portion of import growth have been caused by increases in the market penetration of imports holds true for most countries and products. In the slower growth period between 1991/92 and 2001/02, most of the import growth is caused by market share changes. During the second period (2001/02-2007/08) where demand growth accelerates, contribution of market share changes decreases relatively but is still quite high for industrial countries. For the developing countries, the average contribution of market share changes becomes negative driven primarily by the substantial import substitution undertaken by China, and to a lesser degree, by Malaysia and Mexico.
For the industrial countries, share of imports in domestic demand has increased consistently, reaching an average of 27 percent in 2007/08. Their imports from developing countries have increased at a faster rate throughout this period but only reached 12 percent in 2007/08. And if the imports from China are excluded, the
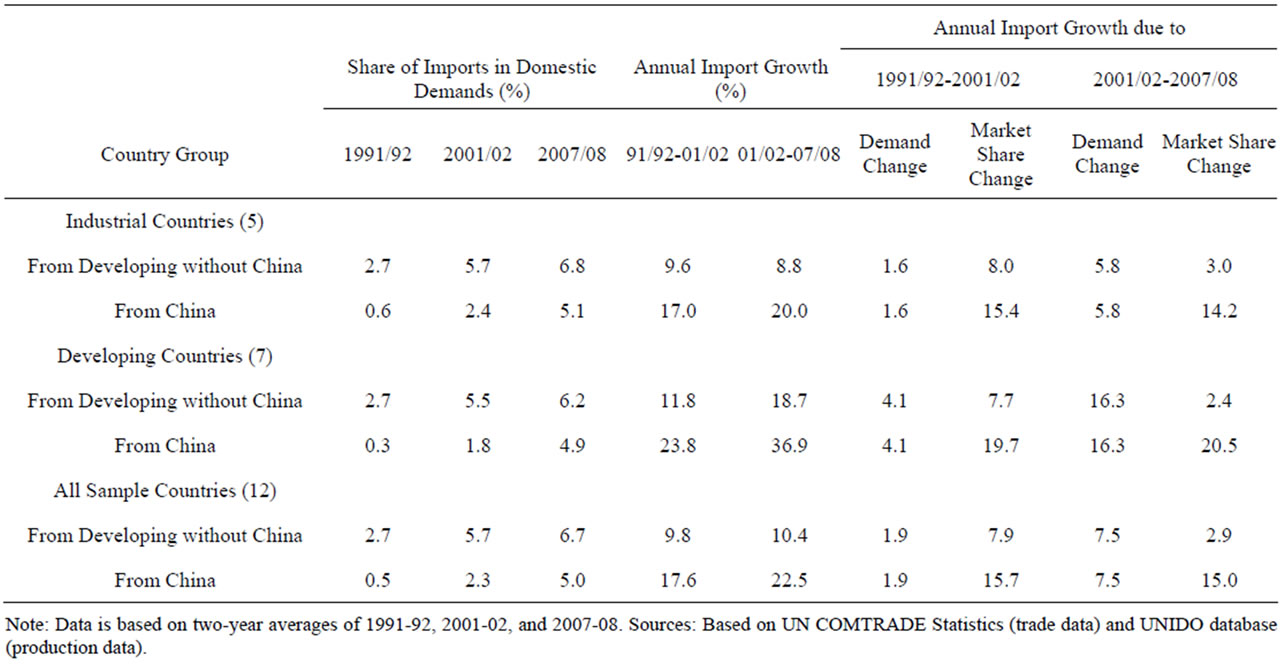
Table 8. Manufacturing imports of industrial and developing countries with and without China from 1991/92 to 2001/02 and 2001/02 to 2007/08.
share of imports from developing countries was only 6.8 percent. This suggests that there is ample capacity to for the imports to increase even if demand in industrial countries does not increase significantly.
Trade penetration in the developing country sample behaves somewhat differently. Import shares go up during the first period where most countries adopt trade liberalization programs. Average share of imports increases from about 17 percent of domestic absorption to 25 percent. During the second period, there is a large decrease in average import shares to about 19 percent and if China is excluded, the shares still decline but much less. Significant production increases and import substitution explain this difference.
The shares of imports of developing countries from developing countries are much lower but the import growth rates are much higher, double digits for both periods. The contribution of market share changes is much larger during the first period and much greater than the contributions of demand except for China and Malaysia. During the second period, the results are mixed but, except for China and Malaysia, the contribution of market share changes to import growth is in double digits per annum. Despite these high growth rates, the share of imports from developing countries in total demands of these selected developing countries reached only 9 percent in 2007/08. Very low import shares in China explain part of low shares but given the much higher overall import shares in many of these countries, there is a significant potential for developing countries to increase the share of their exports going to other developing countries.
Furthermore, the share of production going to exports and imports have changed somewhat for all these countries. In this context, it is important to note some of the differences among similar countries. In 1991/92 Germany had a lower share of imports and exports (27 and 21 percent) than France (31 percent for both). But by 2007/08 Germany had restructured its manufacturing sector in such a way that its export and import to output ratio had increased to 49 and 32 percent while these ratios had become 37 and 39 percent respectively for France. Japan has also increased its export and import ratios from 11 and 4 percent in 1991/02 to 23 and 11 percent in 2007/08. As explained in Section E, China is the only economy where trade to output ratios had declined during the 2000s. India also had seen declines in its export to output ratio but its import share has increased significantly.
Relative sizes of the value of gross production have also changed during this period. USA had the by far the largest value of manufacturing output in 1991/92 and was followed by Japan and Germany whose outputs were 84 and 43 percent of the United States level. By 2007/08, output in Japan had come down to 51 percent of the USA level and Germany’s output had stayed at about 44 percent. Germany’s apparent export success is not caused by faster increases in its output but by restructuring its output for exports. The absolute value of its exports was almost 25 percent more than the exports from USA despite its value of output being only 44 percent of the USA level.
All other countries have increased their output as compared to United States. Of course China has had the greatest output increase. The value of its manufacturing output was only 13 percent of the USA level in 1991/02 and increased to 109 percent in 2007/08. India’s output increased threefold to reach 12 percent; Korea twofold to 18 percent of the US level. It is important to note that Korea’s manufacturing sector was 30 percent bigger than India’s. Finally, France has seen its manufacturing sector grow faster than other industrial countries in our sample.
Finally, the success of developing countries in increasing their shares in the markets of both industrial and developing countries are driven primarily by China. Without China, the market share gains of other developing countries are much less significant. Similarly, China accounts for more than 80 percent of market share changes of developing countries in the markets of other developing countries.
7. Conclusion
These findings and developments suggest the following. First, world demand growth is very different during 1990s and 2000s. Demand growth has accelerated during the 2000s. A significant portion of trade growth for the sample countries has been caused by market share changes in 1990s. While demand increases are very important in explaining the acceleration of trade growth during the 2000s, market share changes still play an important role. Second, imports from developing countries have grown much faster both in industrial and developing country markets. Despite the rapid growth, their shares in the absorption of the sample countries are still very low and can expand substantially even if demand growth is much lower in the near future. Future trade growth from developing countries would still be high due to very low existing shares both in the markets of industrial and other developing countries. Finally, a significant part of the future developments would be driven by China. If China continues to reduce its import shares and increase its export shares, the result would affect all the countries negatively and would, in the long run, creating an environment where liberal trade regimes becomes to be threatened. So the most important question would be whether, China would continue with its declining trade shares or follow the other countries in having greater import shares. Future manufacturing trade growth will depend on the evolution of trade patterns of China as much as other economic developments.
8. Acknowledgements
We would like to thank Baris Sivri and Zeynep Ersel for their contributions to an earlier version of this paper. Yilmaz Akyuz made useful comments/questions of our numbers which led to significant revisions. The findings, interpretations, and conclusions expressed in this paper are entirely those of the authors. They do not necessarily represent the views of the World Bank, its Executive Directors, or the countries it represents.
REFERENCES
- B. Balassa, “Trade between Developed and Developing Countries: The Decade Ahead,” OECD Economics Studies, No. 3, Autumn 1984.
- A. K. Fosu, “Export Composition and the Impact of Exports on Economic Growth of Developing Countries,” Economics Letters (Netherlands), Vol. 34, No. 1, 1990, pp. 67-71. doi:10.1016/0165-1765(90)90183-2
- F. Ng and Y. Alexander, “Major Trade Trends in East Asia: What Are their Implications for Regional Cooperation and Growth?” Policy Research Working Paper, No. 3084, World Bank, Washington DC, 2003.
- F. Ng and Y. Alexander, “Open Economies Work Better: Did Africa’s Protectionist Policies Cause Its Marginalization in World Trade?” World Development, Vol. 25, No. 6, 1997, pp. 889-904. doi:10.1016/S0305-750X(97)00011-9
- J. Mayer, “Export Dynamism and Market Access,” Journal of Economic Integration, Vol. 19, No. 2, 2004, pp. 289-316. doi:10.11130/jei.2004.19.2.289
- G. Hanson and R. Raymond, “China and the Recent Evolution of Latin America’s Manufacturing Exports,” In: D. Laderman, M. Olarreaga and E. Perry, Eds., Chapter 5 in China’s and India’s Challenge to Latin America: Opportunity or Threat? World Bank, Washington DC, 2009.
- M. A. Aksoy, Z. Ersel and B. Sivri, “Demand Growth versus Market Share Gains: Decomposing Export Growth in the 1990s,” Mimeo, World Bank, Washington DC, 2003.
- M. A. Aksoy, “The Evolution of Agricultural Trade Flows,” In: A. Aksoy and J. Beghin, Eds., Chapter 2 in Global Agricultural Trade and Developing Countries, World Bank, Washington DC, 2005.
- United Nations Industrial Development Organization, “UNIDO INDSTAT3 Industrial Statistics Database,” UNIDO, Vienna, 2011.
- UNSD, “Commodity Trade Database (COMTRADE through WITS),” United Nations Statistical Office, New York, 2011.
- A. Nicita and O. Marcelo, “Trade, Production and Protection Database: 1976-2004,” World Bank Economic Review, Vol. 21, No. 1, 2007, pp. 165-171. doi:10.1093/wber/lhl012
- Y. Akyuz “Export Dependence and Sustainability of Growth in China,” China and World Economy, Vol. 19, No. 1, 2011, pp. 1-23. doi:10.1111/j.1749-124X.2011.01224.x
- H. L. Kee and H. Tang, “Domestic Value-Added in Chinese Exports,” World Bank Development Research Group, Internal Paper, World Bank, Washington DC, 2011.
- R. Koopman, Z. Wang and S.-J. Wei, “How Much of Chinese Exports Is Really Made in China? Assessing Domestic Value-Added When Processing Trade Is Pervasive,” The National Bureau of Economic Research Working Paper, No. 14109, NBER, Cambridge, 2008.
- J. Dean, K. C. Fung and Z. Wang, “How Vertically Specialized Is Chinese Trade?” US ITC Economics Working Paper, No. 2008-09-D, US International Trade Commission, Washington DC, 2008.
- X. Chen, L. Cheng, K. C. Fung and L. Lau, et al., “Domestic Value-Added and Employment Generated by Chinese Exports: A Quantitative Estimation,” Munich Personal RePEc Archive (MPRA) Paper, No. 15663, 2008.
- D. Herzer, “What Does Export Diversification Do for Growth? An Econometric Analysis,” Applied Economics (UK), Vol. 38, No. 15, 2006, pp. 1825-1838. doi:10.1080/00036840500426983
- J. Madsen, “Innovation and Manufacturing Export Performance in the OECD Countries,” Oxford Economic Papers, Vol. 60, No. 1, 2008, pp. 143-167. doi:10.1093/oep/gpm014
- World Bank, “Global Economic Prospects,” World Bank publication, World Bank, Washington DC, 2004, 2005 and 2007.
- Y. Akyuz, “The Staggering Rise of the South?” Research Papers 44, South Centre, Geneva, 2012.
- P.-C. Athukorala, “South-South Trade: An Asian Perspective,” ADB Economics Working Paper, No. 265, Asian Development Bank, Manila, 2011.
- R. M. Stern, “Comparative Advantage, Growth, and the Gains from Trade and Globalization (World Scientific Studies in International Economics),” 1st Edition, World Scientific Publishing Company, Singapore City, 2011.
- IMF, “New Growth Drivers for Low-Income Countries: The Role of BRICs,” IMF Strategy, Policy and Review Department, International Monetary Fund, Washington DC, 2011.
- Organisation for Economic Co-operation and Development, “South-South Trade: Vital for Development,” Policy Brief, OECD Observer, 2006.
- United Nations Conference on Trade and Development, “Trade and Development Report,” UNCTAD, Geneva, 2002 and 2005.
Annexes
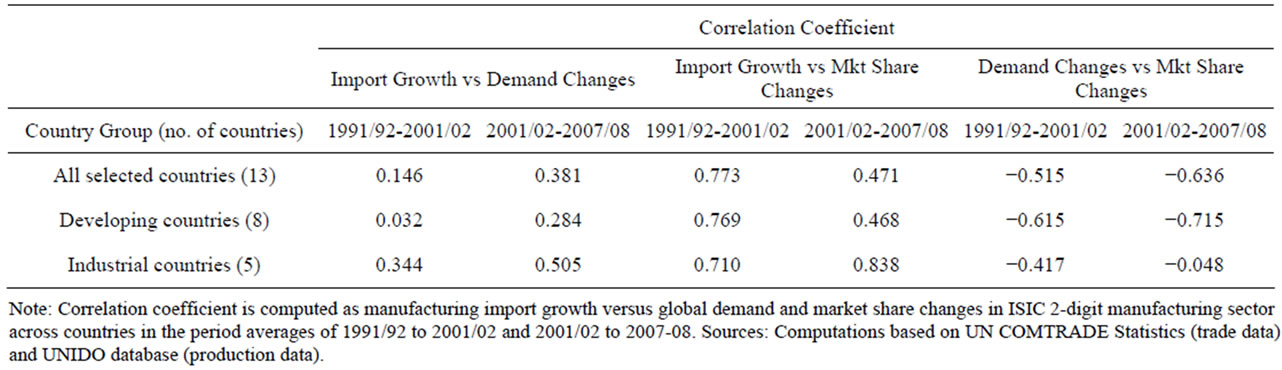
Annex Table 1. Correlation coefficients of manufacturing growth and demand/market share changes between 1991/92 to 2001/02 and 2001/02 to 2007/08.
Annex Table 2. Global manufacturing imports of industrial and developing countries (with and without China & FTAs).
Annex Table 3. Exports and imports as a percentage of gross value of manufacturing production.
Annex Table 4. Manufacturing imports of industrial and developing countries from developing countries (with and without China & FTAs).
NOTES
1It would be desirable to undertake this analysis for aggregate developing and industrial countries but manufacturing production data is not available in the same format and definitions for many countries. Sample countries account for more than 50 percent of world trade (Table 1).
2This decomposition was undertaken for selected industrial countries for the 1990s (World Bank 2005).
3UNIDO is the only agency that publishes manufacturing gross output series. In many cases, these numbers were compared to other national sources to ascertain the similarity of movements.
4There is a significant appreciation of the US dollar against the currencies of most the other countries during the late 1990s and depreciation during the 2000s. This appreciation underestimates the domestic production and demand growth in US dollars and overestimates the share of imports, which are denominated in US dollars. Opposite takes place during US dollar depreciations. Thus, nominal US dollar measurement would underestimate real growth during the 1990s and overestimate it during the 2000s.
5The disaggregated estimation was done at the 3-digit ISIC level correlating the 22 sub-sector import growth rates and corresponding import growth rates due to market share changes, with country dummies. At the aggregate level the relationship was negative but not significant (Annex Table 1). Market share changes are negative correlated with demand increases across countries and periods.
6Annex Table 2 also shows the impact of exports from partners that had a special trading arrangement during the 1990s and 2000s. For the US and Canada imports from NAFTA countries are presented separately to see the impact of NAFTA and for France and Germany the imports from EU are separated. In the annex tables, EU is further separated into the first 15 and 12 countries that joined later. For the developing countries, imports from EU for Turkey, and from US and Canada for Mexico, are also presented separately.
7Its trade surplus originates primarily with the EU-27 partners. They import 30 percent of Germany’s manufacturing output but export only 19 percent of Germany’s output equivalent.
8Developments in China will be analyzed in Section E in greater detail.
9Brazil also has a very slight decrease in its import shares but the decrease is very small.
10EU-12, the countries which joined European Union after 1990 and Mexico for US and Canada are included in the developing country numbers. They do not change the general picture as shown in Annex Table 4.
11If they are excluded the shares of other developing countries are only 10 percent.