Journal of Biophysical Chemistry
Vol.07 No.01(2016), Article ID:63325,21 pages
10.4236/jbpc.2016.71002
Effects of Selective Biotinylation on the Thermodynamic Stability of Human Serum Albumin
Huyen Hoang1,2, Fidelis Manyanga1,2,3, Moshood K. Morakinyo1,2,4, Vincent Pinkert1, Ferdous Sarwary1, Daniel J. Fish1,2,5, Greg P. Brewood1,2, Albert S. Benight1,2,6*
1Department of Chemistry, Portland State University, Portland, USA
2Louisville Bioscience, Inc., Louisville, USA
3Department of Chemistry and Physics, Salem State University, Salem, USA
4Portland Technology Development, Intel Corporation, Hillsboro, USA
5Department of Mathematics, Portland State University, Portland, USA
6Department of Physics, Portland State University, Portland, USA

Copyright © 2016 by authors and Scientific Research Publishing Inc.
This work is licensed under the Creative Commons Attribution International License (CC BY).
http://creativecommons.org/licenses/by/4.0/


Received 24 November 2015; accepted 1 February 2016; published 4 February 2016
ABSTRACT
Thermal denaturation and stability of two commercially available preparations of Human Serum Albumin (HSA), differing in their advertised level of purity, were investigated by differential scanning calorimetry (DSC). These protein samples were 99% pure HSA (termed HSA99) and 96% pure HSA (termed HSA96). According to the supplier, the 3% difference in purity between HSA96 and HSA99 is primarily attributed to the presence of globulins and fatty acids. Our primary aim was to investigate the utility of DSC in discerning changes in HSA that occur when the protein is specifically adducted, and determine how adduct formation manifests itself in HSA denaturation curves, or thermograms, measured by DSC. Effects of site specific covalent attachment of biotin (the adduct) on the thermodynamic stability of HSA were investigated. Each of the HSA preparations was modified by biotinylation targeting a single site, or multiple sites on the protein structure. Thermograms of both modified and unmodified HSA samples successfully demonstrated the ability of DSC to clearly discern the two HSA preparations and the presence or absence of covalent modifications. DSC thermogram analysis also provided thermodynamic characterization of the different HSA samples of the study, which provided insight into how the two forms of HSA respond to covalent modification with biotin. Consistent with published studies [1] HSA96, the preparation with contaminants that contain globulins and fatty acids seems to be comprised of two forms, HSA96-L and HSA96-H, with HSA96-L more stable than HSA99. The effect of multisite biotinylation is to stabilize HSA96-L and destabilize HSA96-H. Thermodynamic analysis suggests that the binding of ligands comprising the fatty acid and globulin-like contaminant contributes approximately 6.7 kcal/mol to the stability HSA96-L.
Keywords:
Human Serum Albumin (HSA), Differential Scanning Calorimetryl (DSC), Protein Thermodynamic Stability and Thermal Denaturation

1. Introduction
Human serum albumin (HSA) is the most prominent protein in plasma. Of the over 3000 different proteins that make up the plasma proteome, HSA has the highest relative concentration and comprises greater than 65% of the total protein by mass [2] [3] . In vivo, HSA plays a major role as the principal cellular transporter in blood, and in doing so binds, both reversibly and covalently, to a broad spectrum of ligands of endogenous and exogenous origins. Binding and resulting modifications can be covalent, ionic or hydrophobic in nature [4] [5] . Examinations of HSA samples derived from diseased blood have divulged a variety of chemical modifications, or adducts, of HSA that accompany human disease [6] . Levels and types of covalent modifications of HSA can vary depending on the specific disease state(s) [7] .
Because of the central role it serves in biochemistry, much is known about the structure, stability and function of HSA [2] . HSA has served as a model for studies of protein folding and investigations of protein-ligand binding interactions [8] . A number of studies have investigated the structure and thermal stability of HSA [1] [9] -[16] . In these investigations a variety of spectroscopic techniques including Circular Dichroism, Infrared, and Fluorescence spectroscopy were employed. More recently (over the past 20 years) results of using Differential Scanning Calorimetry (DSC) to analyze the thermal stability of HSA have been reported [1] [9] [15] [17] - [20] .
The primary structure of HSA is comprised of 585 amino acids residing on a single polypeptide chain. There are no tryptophan or methionine residues, but there is an abundance of charged residues such as lysine, arginine, glutamic acid and aspartic acid [2] [21] [22] . HSA protein monomer has a molecular weight of ~66.5 kD and its 3-dimensional structure is a heart-shaped molecule composed of three domains, each with two sub-domains denoted A and B. The structure contains 17 disulfide bridges and one free sulfhydryl on cysteine residue 34 [2] . The first 3-dimensional structure of HSA determined by X-ray crystallography was reported in 1992 [23] [24] followed by the higher resolution crystal structure [25] . These and other studies have indicated that sites for ligand binding, and particularly binding sites of fatty acids, reside in the clefts between domains of the tertiary structure where there is an abundance of charged and polar residues such as lysine and arginine [26] [27] .
A primary function of HSA is to transport fatty acid (FA). Consequently, a number of studies have investigated interactions and structural consequences of FA binding to HSA. These have identified the FA binding sites and, not surprisingly, some of these are associated with lysine residues [26] [27] . Many of the same sites bound by FA are also likely targets for adduct formation or binding of other important ligands (i.e. therapeutic agents or diagnostic metabolites). It has been shown that FA binding can be allosteric and results in a conformational change of HSA. The FA bound conformation is apparently locked in by FA binding and conversion from the bound structure occurs with dissociation of FA [5] .
Effects of FA on HSA thermodynamics were studied by one particular group [1] [15] who proposed, based on the observation of a bi-phasic thermal denaturation profile, the existence of two forms of HSA in the presence of long chain fatty acids. These were coined the defatted and un-defatted forms of HSA [1] . Since our HSA96 preparation also displayed a bi-phasic melting curve and contains 3% impurity specified by the supplier as “fatty acid and globulin”, the possibility that our HSA96 was analogous to the reported un-defatted form of HSA [1] is considered in our interpretation of the results.
In the current study our focus was on performing DSC analysis of HSA and quantitatively determining how the thermodynamic stability of HSA, an indirect measure of HSA structural integrity, is affected by covalent attachment of biotin to different sites on HSA99 and HSA96. Through the choice of attachment chemistries, it was possible to selectively attach biotin to either a single site, or different multiple sites, and then make DSC measurements to assess the effects of specific site biotinylation on HSA thermodynamic stability. Biotinylation naturally occurs in several metabolic processes and it has been previously employed as a probe of conformational changes in proteins [28] . Successful biotinylation of plasma has also been reported [29] . For these reasons site- specific biotinylation of HSA was conveniently chosen as the attachment moiety for investigating effects of covalent adduct formation on thermodynamic stability of HSA.
2. Materials and Methods
2.1. Protein Samples
Human serum albumin (HSA) was purchased from Sigma Aldrich (St. Louis, MO). Two different preparations of HSA with differing advertised purity were received as lyophilized powder. They were fatty acid and globulin free, ≥99% pure HSA (product number: A3872, lot number: SLBD740V) and ≥96% pure HSA (product number: A1653, lot number: SLBG2676V). The former was advertised as purified from the latter, but not necessarily the same batch. According to the supplier the 3% greater purity of the HSA99 sample is due to the absence of slight amounts of FA and globulins purified away from HSA96. Hereafter, the 99%-pure and 96%-pure preparations of HSA are referred to as HSA99 and HSA96, respectively. The latter is the well-known HSA fraction V isolated by the method of Cohn et al. [30] . Although fraction V yields a large relative percentage of HSA, the preparation has been shown to be contaminated by ~2% globulins, primarily α1-globulins such as orosomucoid and long chain FA present at a Mole/Mole ratio of FA/HSA < 1. A typical value of this ratio = 0.51 was reported [2] . Although an independent analysis of the specific contaminants in our HSA96 preparation was not performed, the Certificate of Analysis of HSA96 for our lot provided by the supplier reported not more than 2% of protein contaminant (as expected for fraction V). Thus, the majority of the remaining contaminant is nominally attributed to FA. Still the overall composition of the 3% contaminant of HSA96 is not precisely known. To convey this fact, henceforth, the 3% impurity of HSA96 is referred to as the “FA- and globulin-like contaminant” (FA/G-LC), with the belief that by mass the FA/G-LC is roughly comprised of 2% globulins and not more than 1% FA. In analogy several authors reported FA-free and FA-containing HSA species that have been referred to as defatted and un-defatted HSA [1] [15] [18] .
2.2. Solvents and Reagents
Standard buffer solutions contained 10 mM potassium phosphate and 150 mM NaCl, pH = 7.4. Total ionic concentrations of buffers were verified by electrical conductivity measurements. After preparation and prior to use, buffer solutions were stored at 4˚C. All solutions and buffers were prepared with Nanopure deionized water. All chemicals and reagents were molecular biology grade or higher.
2.3. Solutions of HSA
Stock solutions of HSA were prepared at 1.0 mM by dissolving 0.067 g of HSA (67 kDa) in 1 mL buffer. Generally, reconstituted protein solutions were stored at 4˚C for at least 24 hrs before use. In the case of HSA96, samples that were somewhat unstable under storage were examined within 48 hrs after preparation. For DSC melting experiments, a portion of the HSA stock solution was diluted in buffer to a final concentration of 1.5 - 2.0 mg/mL.
2.4. Biotin Attachment to Multiple Sites on HSA
Biotin was attached to multiple sites on HSA by targeting the primary amines of lysine residues. Of the 59 lysine residues in the primary structure it is believed that nearly 20 of these are likely to be sufficiently exposed, and therefore accessible for covalent attachment of Biotin in the 3-D structure of HSA [26] . Biotin was attached to HSA using the EZ-Link Sulfo-NHS-Biotin kit (product number 21217 from Thermal Fisher Scientific) according to the supplier’s instructions. For the attachment reactions, a 10 mM stock solution of Biotin was prepared by dissolving 3.2 mg Biotin in 500 µL of ddH2O. A solution containing a 1:1 molar ratio of HSA:Biotin was prepared by adding 3.02 µL Biotin stock solution per mL of a HSA solution at 2 mg/mL. In this manner HSA was incubated with various amounts of Biotin at a variety of molar ratios, HSA:Biotin, up to 1:50. For these reactions appropriate amounts of the Biotin stock solutions were added to HSA in the presence of the Biotin linking reagent and incubated for four hours at 20˚C. Generally, HSA samples prepared with different levels of attached Biotin were stored at 4˚C for at least 24 hours before removal of unattached free biotin. In this way Biotin was attached to both HSA99 and HSA96 preparations at a variety of HSA:Biotin ratios from 1:1 to 1:50.
2.5. Biotin Attachment to Single Sites on HSA
Biotin was covalently attached to HSA targeting the disulfides of cysteine residues. Presumably, under neutral conditions, only one reduced sulfhydryl is available for biotin attachment at cysteine-34 of the HSA structure [2] , [31] . In targeting the single reduced sulfhydryl at cysteine 34 of the HSA primary structure in these reactions, biotin was assumed to attach to only a single site on HSA. In attachment reactions HSA was incubated at 21˚C for four hours in the presence of increasing amounts of attachment reagent according to instructions provided by the supplier. For these reactions the EZ-Link Maleimide-PEG2-Biotin kit (product number 21902 from Thermal Fisher Scientific) was employed according to the supplier’s instructions. Sample preparations were incubated at increasing molar ratios of HSA:Biotin, from 1:1 to 1:10. Attachment reactions were performed in 4 mL at a concentration of HSA = 1.6 mg/mL in the presence of increasing amounts of attachment reagent. In this way, Biotin was attached to both HSA99 and HSA96 preparations.
2.6. Removal of Unattached Biotin
When attachment reactions were complete, free (unattached) Biotin was removed using a Zebra spin column (product #A9892 from Thermal Fisher Scientific). In this procedure, 1.5 mL of each attachment reaction solution (total volume 3 mL) was added directly to a spin column, and the sample was washed three times with 2 mL buffer. The washed sample was then retrieved and pooled.
2.7. Determination of Protein Concentrations
Protein concentrations were determined at several steps. 1) Prior to performing attachment reactions and; 2) After application of the Biotin removal kit, at each attachment ratio, prior to measuring DSC thermograms. Protein concentrations were determined using the BCA Protein Assay Kit (product #23225, Thermal Fisher Scientific).
2.8. Gel Electrophoresis
Samples were analyzed by electrophoresis on SDS polyacrylamide gels prior to, and after measurement of thermograms (not shown). Approximately 5 ug of protein sample was suspended in gel sample buffer (25 mM Tris, 192 mM glycine, 0.1% SDS, 20 mM DTT pH = 8.3) and loaded onto a BioRad Any KD™ Mini- PROTEAN®15 well gradient polyacrylamide gel. Samples were heated at 95˚C for approximately 3 minutes before loading on the gel. Gels were run in gel sample buffer until the marker lane was well separated (35 minutes); then fixed in 50% methanol, 10% glacial acetic acid solution and stained with Coomassie Blue, then de-stained in 50% methanol, 10% glacial acetic acid; further soaked in 5% acetic acid solution, removed and photographed. The gel loading buffer for the samples contained 20 mM DTT to insure samples were in a reducing environment.
2.9. DSC Measurements
All DSC melting experiments were performed using a CSC Model 6100 Nano II-Differential Scanning Calorimeter (formerly Calorimetry Sciences Corporation, Provo UT, now TA Instruments). In a DSC melting experiment the excess heat capacity, ∆Cp, is measured as a function of increasing temperature. Gasket tipped mico- pipettes provided an airtight means for protein/buffer injections and care was exercised in loading both buffer and sample solutions in the DSC to prevent introduction of air bubbles. The average of five buffer scans collected over the temperature range from 0 to 100˚C served as the buffer baseline for analyzing scans of protein samples. For all DSC experiments the temperature scan rate was 1˚C/min and the protein concentration was approximately 2 - 2.5 mg/ml. To prevent degassing of solutions upon heating, all measurements were made at a pressure of 3.0 atm. Following each run, before a fresh buffer and sample were loaded in the DSC, sample and reference cells were carefully cleaned with a 95% ethanol solution.
Results of preliminary experiments (not shown) determined that the melting transition of HSA99 spans the temperature region between 50 and 90˚C, and this is the temperature range for all displayed thermograms. To encompass this region, the temperature range used for measuring DSC thermograms of HSA99 (and HSA96) was from 45 and 95˚C.
2.10. DSC Data Analysis
DSC data was analyzed using the CpCalc 2.1 software package provided by the DSC manufacturer. The standard analysis procedure was comprised of six essential steps. 1) Measured heat in µW was converted to raw molar heat capacity, ΔCp-raw(T) [cal/K∙mol] versus temperature curves. 2) These raw curves were then normalized for protein concentration (2.0 - 2.5 mg/mL), molecular mass (66.5 kDa), partial specific volume of the protein molecules (0.733 cm3/g) [32] and sample cell volume producing normalized ΔCp(T) versus T curves (ΔCp-N(T) versus T). 3) The measured buffer baseline scan (ΔCp-buffer(T) versus T) curve was subtracted from the normalized (ΔCp-N(T) versus T) sample curve producing a buffer corrected, ΔCp-buffer corrected(T) versus T curve. 4) Next, the baseline of the buffer corrected ΔCp-buffer corrected(T) versus T curve was determined using a polynomial function constructed by connecting the lowest and highest temperature points on the buffer corrected ΔCp-buffer corrected(T) versus T curve (generally the range from 45˚C - 90˚C). 5) This fitted baseline was then subtracted from the ΔCp-buffer corrected(T) versus T curve producing finally, a concentration normalized, buffer and baseline corrected ∆Cp-N-buffer-baseline-corrected(T) versus T curve which is the DSC melting curve, or thermogram. 6) The experimentally observed calorimetric transition enthalpy,  , was evaluated from the integrated area under the measured thermogram. The entropy,
  , was evaluated from the integrated area of the ∆Cp-N-buffer-baseline-corrected(T)/T versus T curve. In the analyses that were performed the observed calorimetric free-energy,
  , was determined using the Gibb’s relationship, i.e.

The transition temperature, tm, is the temperature of the peak height maximum on the thermogram. The tm and evaluated measured thermodynamic parameters,  and
and  provided quantitative characterizations of the temperature-induced melting transitions of the HSA samples. Peak heights and peak widths at half height also served as an additional means of semi-quantitative comparison of thermogram shapes.
Analysis of DSC data in this fashion was performed under the simplifying assumptions that the melting transition of HSA occurs in a two-state manner, and that the overall change in the value of ΔCp at the initial and final temperatures is zero [33] . Other than the choice of baseline and assumption that the ∆Cp = 0, no other assumptions governed evaluation of the thermodynamic transition parameters. Results indicated the impact of these assumptions was not very severe, as evaluated parameters were in reasonable agreement with published results; and relative comparisons provided quantitative insight into effects of biotinylation on HSA structure and stability. Thus, we assumed the observed evaluated parameters corresponded to the denaturation transition of the HSA species in their standard state. The standard state thermodynamic parameters evaluated from thermograms of modified and unmodified HSA99 and HSA96, i.e. generally denoted,  ,
,  and
and , were employed to interpret their observed contrasting behaviors in response to covalent attachment of biotin.
More sophisticated models that include the possibility of multi-state transitions and a non-zero ΔCp have been applied to analyze DSC measured denaturation curves of HSA and provided evaluations of thermodynamic transition parameters [1] [13] . Obviously depending on specific features of the particular analytical model employed to analyze DSC thermograms, actual values of the thermodynamic transition parameters obtained from the analysis could differ. However, relative values of the evaluated parameters should provide a more consistent basis for comparisons of results obtained using different models for thermogram analysis.
3. Results
3.1. Melting Transitions of Unmodified HSA
The average of multiple measurements (>10) of the excess heat capacity, ΔCp, versus temperature (thermograms) for 99% pure HSA (HSA99) and 96% pure HSA (HSA96) samples, are shown in Figure 1. The distinctly different shapes of the thermograms for HSA99 and HSA96 in Figure 1 demonstrate the capability of DSC measure-
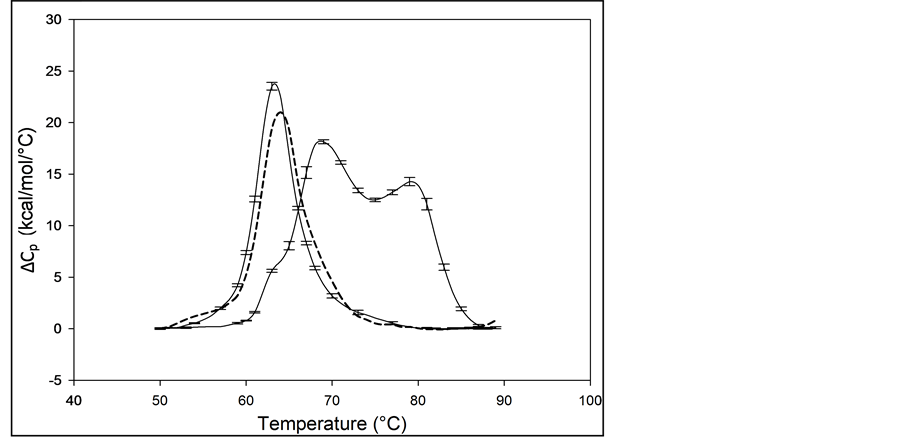
Figure 1. Thermograms for HSA99 and HSA96. The thermogram for HSA99 (left curve, solid line) is single-peaked with tm = 63.3˚C. The curve for HSA96 (right curve) is comprised of two overlapping major transitions with tm’s at 68.8 and 78.8˚C. Note, also a minor shoulder peak at 63.3˚C on the low temperature side of the HSA96 main transition. Vertical error bars depict the variations in curve shape for multiple experiments on the same sample. The tm values vary on average 0.5˚C for multiple experiments. Thermograms of HSA96 and HSA99 (solid lines) were measured for samples prepared fresh and examined within a week of preparation. The dashed line is the thermogram for an HSA96 preparation that was stored for three weeks at 4˚C.
ments to discern effects on HSA of the presence of the FA- and globulin-like contaminant (FA/G-LC), advertised as comprising the 3% impurity in the case of HSA96. Error bars indicate the experimental variation from the average over at least three independent experiments. The curve for HSA99 is the leftmost curve shown in Figure 1. As indicated by the error bars, in multiple DSC experiments the thermogram for HSA99 was highly reproducible, with a nearly symmetric melting transition, a single major peak and slight high temperature asymmetry, and average tm = 63.3˚C ± 0.2˚C. The peak width at half height of the HSA99 thermogram is not more than 7˚C. The tm and curve shape of the HSA99 thermogram are similar to those in published reports for defatted HSA also measured by DSC [1] [12] [17] . These reports have onset of the HSA melting transition at around 50˚C with a span of 35˚C and completed by about 85˚C. Preparations of HSA99 made from freshly diluted concentrated stock solutions (prepared from dry powder) and stored for over a year at 4˚C produced thermograms that were indistinguishable from those obtained from freshly prepared HSA99 concentrated stock solutions. Accordingly, this stability of the HSA99 thermogram confirms the structure of this preparation is quite stable during storage.
The average thermogram measured for HSA96 is also displayed in Figure 1 (right-most curve). When the thermograms for HSA96, and HSA99 are compared, the thermogram for HSA96 is shifted to higher temperature by more than 5˚C and overall the transition seems to be comprised of at least two sub-transitions centered at 68.8 and 78.8˚C. There is also a very minor peak inflection on the low temperature side of the main transition at the same temperature as the tm of HSA99. Thermodynamic transition parameters evaluated from the thermograms of HSA99 and HSA96 are summarized in Table 1 and discussed later.
The bi-phasic melting transition observed for HSA96 is remarkably similar to results of published DSC melting experiments on HSA in the presence of endogenous long chain fatty acid (LCFA) [1] [15] . Measuring under nearly identical conditions (buffer and solvent, scan rate, protein concentration) these authors observed a bi- phasic melting transition attributed to coexistence of two different conformational states of HSA in the presence of LCFA. To indicate their relative affinity for binding LCFA these different forms were dubbed the “fatty acid- poor” or “defatted” and “fatty acid-rich” or “un-defatted” structures of HSA. Reportedly the bi-phasic melting transition resulted from redistribution of LCFA between the two forms, which differed in LCFA binding

Table 1. Thermodynamic transition parameters. Values for the standard state enthalpy , entropy
 , free-energy at 37˚C,
  , and transition temperature, tm, measured and evaluated in DSC experiments for the samples of HSA that were prepared. Values are considered accurate to within 5%. Each transition temperature, tm, is an average value that does not vary more than 0.5˚C in multiple experiments.
affinity and temperature dependent stability, during the denaturation process. The observed similarity between our results and the published results [1] [15] leads to the supposition that the 3% impurity in the HSA96 preparation (FA/G-LC) affects HSA structure and stability in a manner similar to that reported for LCFA [1] . In support of this supposition, the reported relative amounts of LCFA present in the FA-poor (0.084 mole of LCFA per mole HSA) and FA-rich (1.43 mole LCFA per mole HSA) HSA preparations are comparable to ours and span the value of 0.51 mole of FA per mole HSA assumed for the composition of the 3% FA/G-LC in our HSA96 preparation.
Because of the remarkable similarity between the thermogram for HSA96 and published thermograms for defatted and un-defatted HSA measured under very similar solution and experimental conditions, the bi-phasic thermogram of HSA96 in Figure 1 is also attributed to the presence of two protein populations. In analogy with previous reports [1] [15] , and for reference in future discussions, the first peak on the HSA96 thermogram at 68.8˚C is designated HSA96-L; while the second peak at 78.8˚C is referred to as HSA96-H. The former is thought to more resemble the structure and stability of HSA99 (but arguably not precisely the same). This distinction is evidenced by the small shoulder peak on the low temperature side of the HSA96 thermogram attributed to the HSA99 species. This small inflection occurs precisely at the tm of HSA99 (63.3˚C), and likely indicates a slight amount of HSA99 also present in the HSA96 preparation. Presumably, both HSA96-L and HSA96-H bind FA to a lesser or greater extent, respectively [16] . Similarity of the melting characteristics of the HSA99 and HSA96 preparations with published results also provided assurance of the fidelity and initial native state of these HSA preparations prior to covalent attachment of biotin. Before describing results of experiments on biotinylated HSA99 and HSA96, several additional aspects of their behavior are described.
3.2. The Labile State of HSA96 and Conversion of HSA96 to HSA99
The HSA96 preparation was not as stable in storage as HSA99. Examination of the HSA96 thermograms at different times after preparation indicated the average HSA96 thermogram displayed in Figure 1 was reproducible for at least one week (but not for much longer). On multiple occasions over the course of this study we observed the HSA96 thermogram was not always reproducible for samples stored at 4˚C for longer than a week.
According to their thermograms, spontaneous conversion of HSA96 to HSA99 was observed. Accepting that HSA96 contains a mixture of HSA96-L and HSA96-H the thermograms of HSA96 (Figure 1) were found to differ for different preparations, and in particular to be quite sensitive to age of the sample (after those preparations) when the thermograms were measured. With this lability of the HSA96 samples, reported thermograms for HSA96 (displayed in Figure 1) were obtained for protein samples that were made from HSA96 stock solutions prepared fresh from powder and examined within (at most) one week following preparation. Generally the time after preparation when thermograms were measured for HSA96 and its biotinylated derivatives was 24 to 72 hours.
Although a systematic study of the state of the HSA96 preparation at different times after preparation was not performed, typical results are shown in Figure 1. There, the thermogram of HSA99 (freshly prepared and less than a week old, solid line) is compared with that obtained for a preparation of HSA96 stored for three weeks prior to examination by DSC (dotted line). Clearly, the thermogram for the older HSA96 is very similar to that of HSA99, evidencing conversion. Such conversion was observed in as little as one week for some HSA96 samples stored at 4˚C.
Experiments investigating the reversibility of the HSA99 melting transition were also performed (data not shown). For this investigation thermograms were measured for HSA99 samples first heated in separate experiments to temperatures from 30 to 70˚C, cooled at the same rate, and then re-heated from 20 to 100˚C. Results showed when HSA99 was first heated to temperatures up to 60˚C, just at the edge of the melting transition, cooled and re-melted, the thermogram was not different from the thermogram of unheated HSA99; with a single peak, tm = 63.3˚C. This result was taken to indicate that up to about 60˚C, corresponding to early onset of the melting transition, the measured thermogram was unaffected by prior heating and cooling, and was reversible. In contrast, when the HSA99 solution was pre-heated to temperatures above tm, i.e. up to 80˚C, cooled and re-melted, the observed thermograms for the pre-heated samples were very different from those observed for the unheated (or reversible) curves. These results were in concordance with those reported in published studies of HSA, that HSA melting is reversible up to ≈62˚C [12] [13] . From experiments performed under conditions similar to ours these same authors found at temperatures above 75˚C, HSA resides in an irreversibly denatured, predominantly molten globule state. Reportedly, the rate of the irreversible reaction was considerably slower at lower temperatures (below 74˚C) [12] . Under experimental conditions comparable to ours these authors asserted that even up to 74˚C the denaturation reaction is predominantly reversible. This is a major operating assumption.
3.3. Melting Transitions of HSA with Biotin Covalently Attached at a Single Site
Figure 2 shows the thermograms for HSA99 and HSA96 modified by biotinylation at a single site. Protein samples that produced the results shown in Figure 2 were prepared by using the Maleimide-activated reagent targeting the single reduced sufhydryl at cys-35 of the HSA primary structure. Products of the reactions were either HSA99 or HSA96 with biotin attached, denoted HSA99-M(x:1) or HSA96-M(x:1), respectively (M = biotin attached with Maleimide). In Figure 2, thermograms are displayed for HSA99-M(x:1) (a) or HSA96-M(x:1) (b) incubated at molar ratios of biotin:HSA99 = 1:1, 3:1 and 10:1 (x = 1, 3, 10). Error bars show experimental variation from the average curve (symbols) for HSA99-M(x:1) at each incubation ratio. As seen in Figure 2(a), the effect of attachment on the HSA99 thermogram is a peak height reduced by nearly 40% and shift of tm upward in temperature by over 5˚C. At x = 1 the peak width at half height increases by more than a factor of two. After these most dramatic changes initially at a 1:1 ratio, thermograms measured at biotinylation ratios of x = 3 and x = 10 are not greatly different. They have essentially the same tm with only slight increases in peak widths on the high temperature side; and peak heights are the same (within error). Results of these changes associated with biotin attachment also manifest in the measured thermodynamic parameters for HSA99-M(x:1) summarized in Table 1. The evaluated parameters, tm,  and
and  for HSA99:M(x:1) show little variation between the different biotinylation ratios of x = 1, 3, 10.
In the same manner as for HSA99, biotin was covalently attached to HSA96 (prepared fresh) and the thermograms were measured within 48 hours of sample preparation. Thermograms collected for the covalently modified HSA96 are shown in Figure 2(b), and denoted HSA96-M(x:1). Effects of single site attachment of biotin to HSA96 are dramatic, and there is a very clear difference between the HSA96 thermogram and the HSA96-M(x:1)
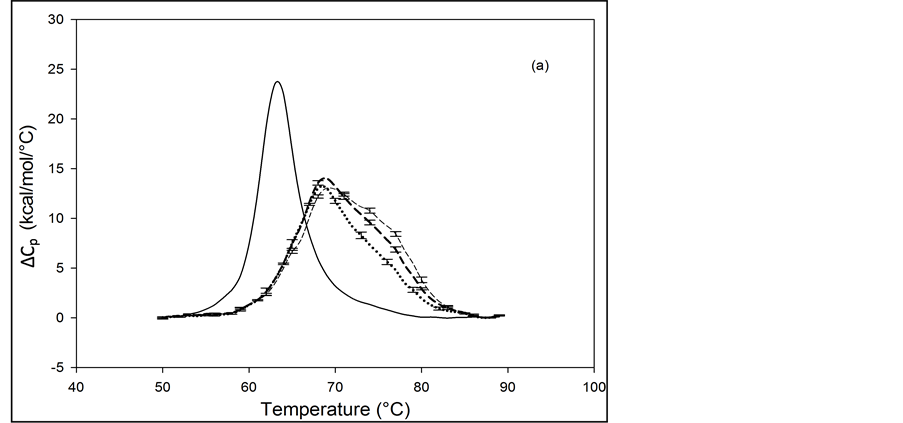
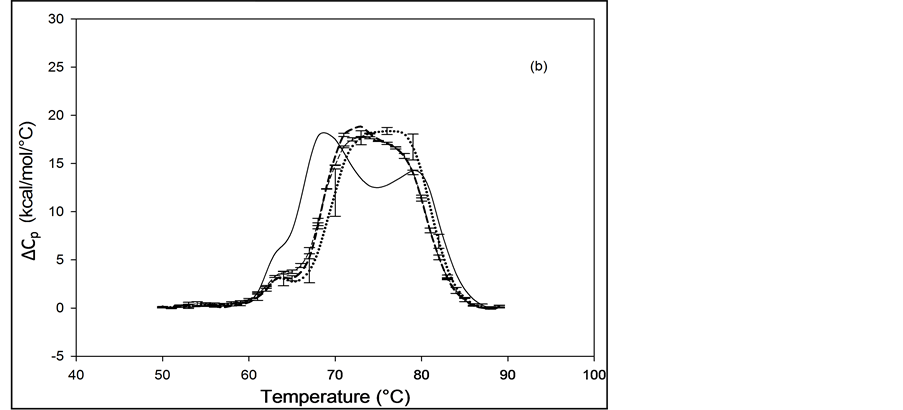
Figure 2. Thermograms of HSA modified by biotinylation at a single site. Samples were prepared as described in the text using the Maleimide-activated reagent. (a) Thermograms for HSA99 (solid line) and samples of HSA99 with biotin attached denoted HSA99-M(x:1). Curves shown are for the HSA99-M(x:1) samples prepared at attachment ratios of x = 1 (bold dash line), x = 3 (dotted line) and x = 10 (light dashed line). (b) Thermograms for HSA96 (solid line) and HSA96 with biotin attached, termed HSA96-M(x:1). Curves shown are for attachment ratios of x =1 (bold dash line), x = 3 (dotted line), and x = 10 (dash line).
thermograms. Responses to biotin attachment at a single site on HSA96 might be unexpected for several reasons. 1) As indicated by the bi-phasic thermogram in Figure 1, the preparation of HSA96 is comprised of two different forms that have been denoted HSA96-H and HSA96-L, present in their respective mole fractions. 2) The effect of the biotinylation reaction on the relative population of these two states of HSA is unknown. 3) The bi-phasic nature of the HSA96 thermogram indicates HSA96-H is more stable against denaturation than HSA96-L.
Presumably, when the attachment reaction is performed using HSA96, both components, HSA96-H and HSA96-L are targeted for biotinylation. At incubation ratios of x ≥ 1, the two-peaked thermogram of HSA96 in Figure 1 with tm’s at 68.8 and 78.8˚C is consolidated into a broad, single-peaked transition with an intermediate tm = 72.3˚C. The peak height is roughly the same as the major peak at 68.8˚C on the thermogram of HSA96 alone (solid line).
Consolidation of the thermogram in Figure 2(b) seems to arise from a shift up in temperature of the major peak attributed to labeled HSA96-L (HSA96-L-M(1:1)). The higher temperature peak corresponding to labeled HSA96-H (HSA96-H-M(1:1)) seems to have shifted down a few degrees and become absorbed into the consolidated peak brought about by the up-shifted HSA96-L-M(1:1) peak. The peak widths at half height of the thermograms for the HSA96-M(x:1) samples in Figure 2(b) are reduced from that of HSA96 (~20˚) to approximately 15˚C. Again as expected for a single biotinylation site, once saturation occurs (at x =1) incubation at increased ratios of biotin has little effect on the thermogram shape, or tm. In effect, there are no significant differences in the thermograms for HSA96-M(x:1) at x ≥ 1. Just as observed for HSA99-M(x:1) thermodynamic transition parameters for HSA96-M(x:1) summarized in Table 1 are essentially the same at all attachment ratios examined. Although they show a similar response to biotinylation the actual thermograms of HSA99-M(x:1) and HSA96-M(x:1) are different. The peaks of the HSA99-M thermograms are sharper with an average tm = 68.5˚C compared to the broader symmetric peaks of the HSA96-M(x:1) thermograms with average tm = 73.8˚C. As shown in Table 1, and discussed in detail later, evaluated thermodynamic parameters for the thermograms of HSA96-M(x:1) and HSA99-M(x:1) also displayed different responses to biotin attachment.
3.4. Melting Transitions of HSA with Biotin Covalently Attached at Multiple Sites
The primary structure of HSA contains 59 lysine residues. Examination of the HSA crystal structure and results of cross linking studies suggested nearly half of the 59 lysine residues in HSA could be adequately exposed and therefore presumably accessible for biotinylation [26] [27] . HSA samples that produced the thermograms shown in Figure 3 and Figure 4 were prepared by using the NHS-activated biotin reagent targeting the primary amines of lysine residues for attachment with increasing amounts of biotin. Thermograms of NHS biotinylated HSA99, denoted HSA99-NS(x:1), are shown in Figure 3. NS corresponds to biotin attached with NHS. Different thermograms shown in Figure 3 are for samples with increasing amounts of attached biotin.
Thermograms in Figure 3(a) are for HSA99:NS(x:1) samples where the attachment ratios varied from x = 1 to 10. Figure 3(b) shows the thermograms obtained for HSA99:NS(x:1) samples for which the incubation ratio varied from x = 10 to 50. Differences in the thermograms of HSA99-NS(x:1) and HSA99 seen in Figure 3 indicate a very clear effect of biotinylation. With increased attachment ratios from x = 1 to 20 there is a corresponding shift of the thermograms to higher temperature with incrementally increased tm. The peak heights of the modified thermograms are all about the same and reduced by about 15% from that of HSA99. Peak widths at half height of the modified thermograms increase by nearly 50% from the thermogram of HSA99 alone. Figure 3(b) shows the thermograms obtained for HSA99-NS(x:1) at incubation ratios from x = 10 to 50. Up to x = 20, the thermogram tm is shifted up in a titratable fashion by more than 9˚C. At higher incubation ratios examined (x = 40, 50) there are no further changes in tm. At incubation ratios greater than x = 10, the peak heights and widths at half height vary somewhat. Even with this variation, evaluated thermodynamic parameters in Table 1 are very consistent.
Thermograms of HSA96 biotinylated at multiple sites are shown in Figure 4, and denoted HSA96-NS(x:1) where again x is the incubation ratio corresponding to the relative amount of biotin attachment. Thermograms were measured for x = 1, 3, 5, 8, 10, 15, 20, 40, 50. A sampling of these is shown in Figure 4. Thermograms shown in Figure 4(a) were measured for HSA96-NS(x:1) samples prepared at incubation ratios varying from x = 1 to 10. Thermograms in Figure 4(b) were obtained for HSA96-NS(x:1) samples prepared at higher incubation ratios from x = 10 to 50. There is a stark difference between the HSA96 thermogram (thin black line) and the HSA96-NS(x:1) thermograms. Most notably, at the lowest attachment ratio (x = 1) the formerly two-peaked HSA96 thermogram (thin black line in Figure 4(a)) becomes single peaked with tm = 66.2˚C (bold dash line Figure 4(a)). For x ≥ 1 the HSA96-NS(x:1) thermograms have the same shape but are shifted up in temperature, with increased tm at higher attachment ratios up to about x = 40, with no changes thereafter (Figure 4(b)).
It is important to recall and consider that the initial preparation of HSA96 from which the HSA96-NS(x:1) samples were prepared was comprised of a mixture of two forms of HSA (referred to earlier as HSA96-H and HSA96-L). Accordingly as seen in Figure 4 for HSA96 the effect of biotinylation at lysine residues is different from that for single site biotinylation at cys-35 (Figure 2(b)). On the thermograms of HSA96:NS(x:1) (Figure 4) there is no sign of the high temperature transition at 78.8˚C, denoted HSA96-H, suggesting the attachment reaction itself must result in conversion of the originally present more stable structure, to a less stable one. The converted less stable form, HSA96-L, when modified at a 1:1 ratio becomes HSA96-NS(1:1) which is quite qualitatively similar to HSA99-NS(1:1), with an identical tm. Similar comparisons can also be made between HSA96-NS(x:1) and HSA99-NS(x:1) at increasing values of x (discussed later).
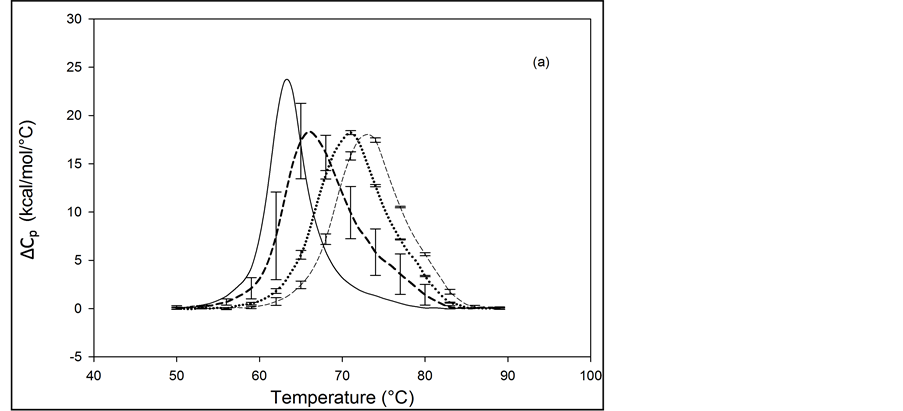
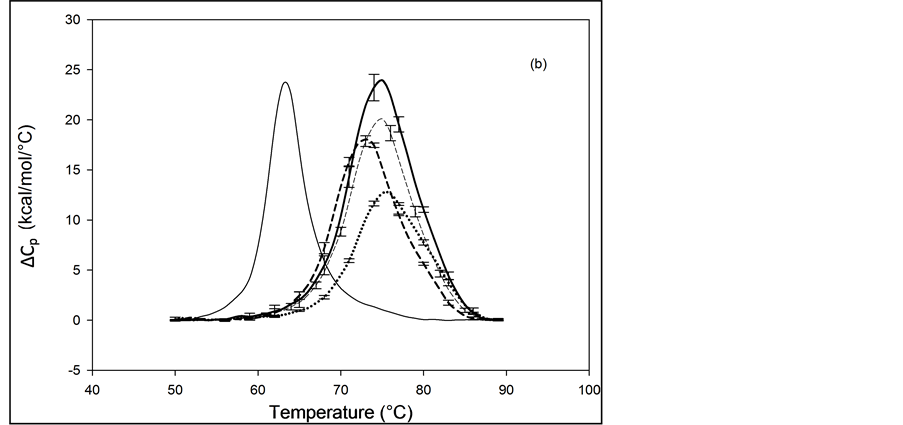
Figure 3. Thermograms for HSA99 modified by biotinylation at multiple sites using the NHS-activated biotin reagent as described in the text. Samples of the NHS biotinylated HSA99 are denoted HSA99-NS(x:1). (a) Thermograms for HSA99:NS(x:1) samples, for attachment ratios, x = 1 (bold dash line), x = 3 (dotted line), x = 10 (thin dashed line). (b) Thermograms for HSA99-NS(x:1) samples at incubation ratios x = 10 (thick dashed line), x = 20 (dottedline), x = 40 (thin dash line) and x = 50 (thick solid line). For comparison the thin solid line in (a) and (b) is the HSA99 thermogram reproduced from Figure 1.
Thermograms of HSA96 samples incubated under the same conditions as the attachment reactions (four hours at 21˚C), without the attachment reagents, were indistinguishable from the thermogram of freshly prepared HSA96 samples (not shown).
In summary, results in Figure 1 through Figure 4 clearly demonstrate the ability of DSC thermograms of HSA to detect the presence or absence of a slight amount of contaminant that contains globulins and FA, denoted earlier as FA/G-LC (Figure 1); detect changing states of HSA samples over time (Figure 1); differentiate covalent modification of HSA at a single site (Figure 2); or at multiple sites (Figure 3 and Figure 4). For both species of HSA, the effect of single site modification is a thermogram reduced in peak height with a small shift up in tm. For multiple site modification the thermogram displays a significant temperature shift up with increasing amounts of biotinylation.
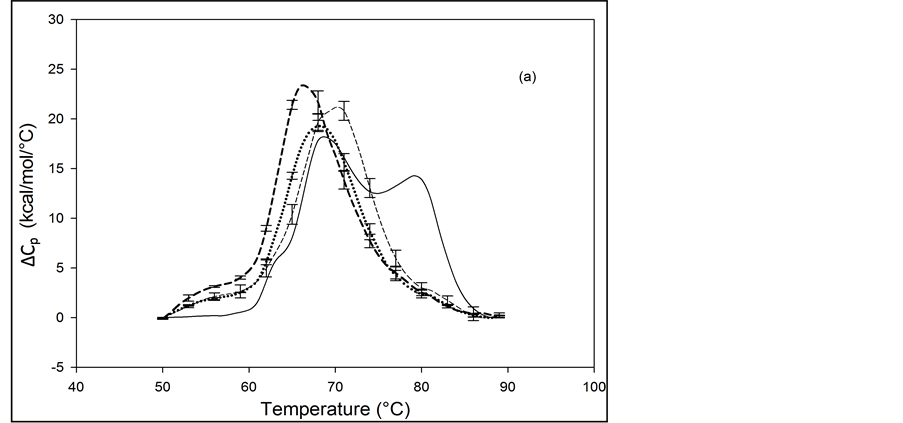
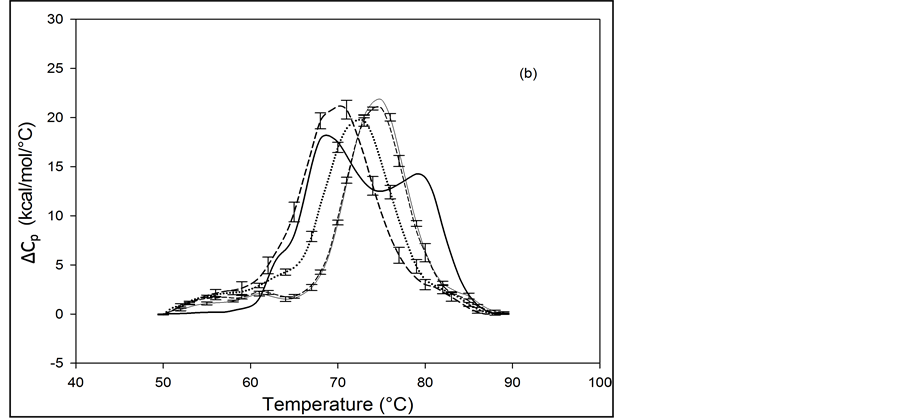
Figure 4. Thermograms for HSA96 biotinylated at multiple sites, denoted HSA96-NS(x:1), are shown at different attachment ratios, x (a) Thermograms measured for HSA96-NS(x:1) samples prepared at incubation ratios of x = 1 (bold dash line); x = 5 (dotted line); x = 10 (thin dash line). (b) Thermograms measured for HSA96-NS(x:1) samples prepared at higher incubation ratios from x = 10 (bold dash line); x = 15 (dotted line), x = 40 (thin dash line); x = 50 (thin solid line).
3.5. Thermodynamic Transition Parameters
DSC measurements provided evaluations of the thermodynamic parameters of HSA melting transitions. The enthalpy,  , entropy,
  , and standard state free-energy at 37˚C,
  , and corresponding tm’s of the melting transitions of the different HSA samples of this study are summarized in Table 1. Comparison of the evaluated thermodynamic parameters in Table 1 reveals differences between HSA96-NS(x:1) and HSA99-NS(x:1). Differences between the two samples at lower attachment ratios up to x = 20 suggest the HSA96-L-NS(x:1) samples at the lower attachment ratios reside in a different state than that of HSA99-NS(x:1). That is, HSA96-L-NS(x:1) can also be bound by components of the FA/G-LC contaminant present in the HSA96 preparation. The measured tm’s of HSA96-NS(x:1) are plotted versus attachment ratio, x, in Figure 5 (open symbols) and compared with the behavior of HSA99-NS(x:1) (filled symbols). At lower attachment ratios, HSA96:NS(x:1) is actually less stable than HSA99-NS(x:1), indicating the proposed HSA96-L-NS(x:1) structure (with the presence of FA-containing ligands) is less stable than
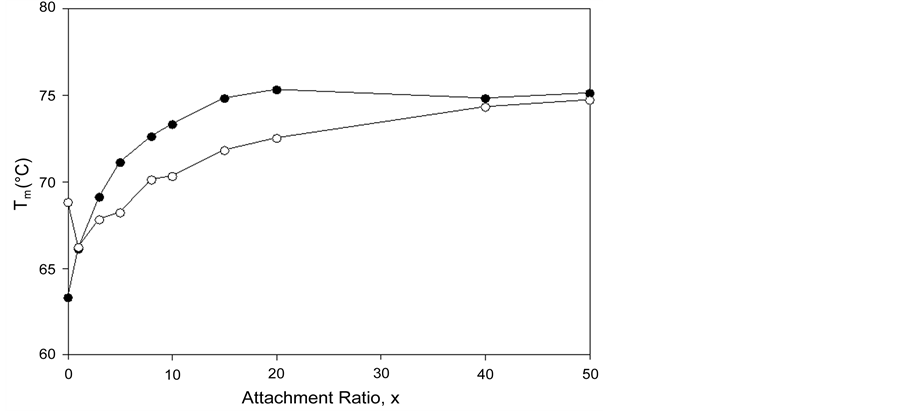
Figure 5. tm versus attachment ratio for HSA96-NS(x:1) (open symbols) and HSA99-NS(x:1) (filled symbols). For HSA96-NS(x:1) tm also approaches 75˚C at higher x values, but does so more slowly than HSA99-NS(x:1).
its HSA99-NS(x:1) counterparts at the same values of x. At higher incubation ratios (≥1:20) tm’s of the thermograms level off to around 75˚C.
Figure 5 shows for HSA96-NS(x:1) that tm also approaches 75˚C at higher x values, but does so more slowly than HSA99-NS(X:1). In Figure 5 the tm’s of the HSA99-NS(1:x) preparation (at least for x ≤ 20) indicate it is apparently more stable against thermal denaturation than HSA96-L-NS(1:x) at the same x. The thermodynamic parameters evaluated for HSA96:NS(x:1) and HSA99:NS(x:1) ( and
and ) versus x displayed the same qualitative behavior as displayed for
  versus x in Figure 6 (not shown). For comparisons that follow values of tm and
  versus x are utilized. Observed trends in tm and
  with covalent attachment of biotin to HSA99 and HSA96 provide an indication of the effects of biotinylation on thermodynamic stability. As shown in Figure 5 and Figure 6, these parameters show very different responses of the two HSA forms to covalent modification by biotin. In Figure 6 the
  values from Table 1 are plotted versus attachment ratio for the HSA99-NS(x:1) and HSA96-NS(x:1) preparations. This plot reveals differences at the lowest attachment ratios, the plots reaching near equivalence around x = 15. Interestingly,
  is greater for the HSA96-NS(1:x) preparation, even though the tm is lower than that for HSA99-NS(x:1) at comparable x. This observation could be due to effects of irreversible aggregation in the denaturation region.
HSA99 (without the FA/G-LC contaminant) aggregates more readily in the denaturation region, i.e. has a higher rate of intermolecular aggregation mediated by the melted state than the populations of HSA96-H and HSA96-L that comprise the HSA96 preparation [1] . FA is known to mediate aggregation in the denaturation region, thus the greater stability of HSA96-H. By the same argument, attachment of biotin to HSA99 to form HSA99-NS(1:x) must also act to decrease irreversible aggregation, as the stability of HSA99-NS(1:x) is increased by more attachment. Then Figure 6 suggests irreversible aggregation in the denaturation region is increasingly discouraged by increased amounts of biotinylation. The result is values of  for HSA99-NS(x:1) that are smaller than for HSA96-NS(x:1) at the lower attachment ratios (as plotted in Figure 6), but equivalent at higher ratios.
Prior to comparison, discussion and interpretation of tabulated thermodynamic parameters it should be noted that parameter evaluations were made under the assumption that HSA melting from the native to the denatured state predominantly occurs in a two-state manner. Several published studies have reported results of measurements on HSA and thermodynamic transition parameters of the HSA melting transition [1] [13] [17] . In these reports different methods of data analysis, baseline treatment, model assumptions and curve fitting were employed. Ours is a standard approach, and arguably one of the least sophisticated that has been applied, with several simplifying assumptions. As discussed below relative comparisons of the parameters within the data set were considered to be quantitatively significant, and provided additional insight into the consequences of biotin attachment on the different HSA samples. Melting transition parameters evaluated by DSC analysis of HSA99,
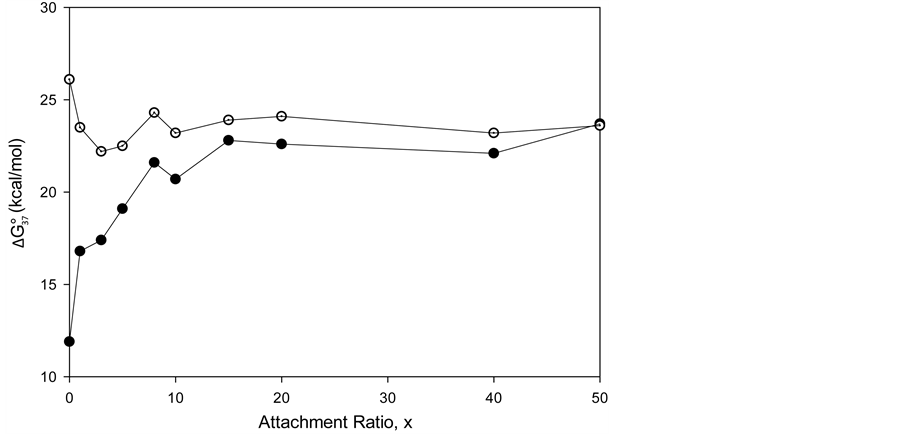
Figure 6.  values from Table 1 plotted versus attachment ratio, x, for the HSA99-NS(x:1) (filled symbols) and HSA96-NS(x:1) preparations (open symbols).
HSA96 and their modified versions with biotin attached, HSA99-M(x:1), HSA99-NS(x:1), HSA96-M(x:1) and HSA96-NS(x:1) are summarized in Table 1.
A few general features of the parameter sets are noteworthy. 1) For both preparations of unmodified HSA alone, HSA99 and HSA96 measured values ( = 163.3 kcal/mole for HSA99), (
 = 279.5 kcal/mole for HSA96) approach, or are within, the range of reported values for defatted and un-defatted HSA [1] [13] [17] . This general agreement indicates our simplifying assumptions of a two-state melting transition with ΔCp = 0, and variations in baseline analysis procedures must have a small effect on the quantitative significance of the evaluated thermodynamic parameters. 2) Response of the tm of HSA to covalent attachment of biotin is different for HSA99 than for HSA96. For HSA99-M(x:1) at (x = 1), the tm increases by over 5˚C, and does not change further at higher attachment ratios. The average (over all attachment ratios) is tm = 68.7 ± 0.4˚C. Response of the thermodynamic parameters
 ,
,  and
and  for HSA99-M(x:1) concurs with that for the tm. For HSA99-M(x:1)
  increases to the same value at ratios of x = 1, 3 and 10 with an average value of 16.8 ± 0.9 kcal/mol. In contrast, under the same conditions for HSA96-M(x:1) samples at attachment ratios of x = 1, 3 and 10 there is a nearly 13% decrease in
  and
and  values, but
  values for modified HSA96-M(x:1) are identical to that of unmodified HSA96 with average
  = 26.1 ± 0.9 kcal/mol. To summarize for the cases of HSA99-M(x:1) and HSA96-M(x:1), both show no difference between the attachment ratios (x = 1, 3, 10), consistent with single site attachment. For HSA99-M(x:1) biotin attachment results in an increase in stability (
 ) while HSA96-M(x:1) displays the same stability as HSA96.
In contrast, opposite responses of  and
and , and in particular
 , to attachment of biotin to amines of lysine residues were found for HSA99-NS(x:1) compared to HSA96-NS(x:1). For HSA99-NS(x:1) the tm increases incrementally with increasing attachment ratios x > 20 for a total increase of nearly 10˚C, and levels off thereafter (see Figure 5). Examination of Table 1 indicates the thermodynamic parameters for HSA99-NS(x:1) and HSA96-NS(x:1) tend in opposite directions. In comparison consider the behavior of
  values versus attachment ratio as plotted in Figure 6. As shown there, for HSA99-NS(x:1) at x = 1,
  increases and continues to do so in an incremental fashion up to an attachment ratio of x = 15 where after it levels off and is constant up to the highest ratios (x = 40, 50). In contrast for HSA96-NS(x:1), at an attachment ratio of x =1,
  decreases from the value for HSA96 and decreases again for x = 3 and 5; dramatically increases at x = 8, then levels off at the higher ratios (see Figure 6). The opposite responses of the
  values for HSA99-NS(x:1) and HSA96-NS(x:1) as a function of increased attachment ratio reveals an effect of the presence of the small amount (3%) of FA/G-LC on modified HSA. The contrasting observations are: 1) Attachment increases stability (
 ) of the HSA99-NS(x:1) samples compared to HSA99 alone. This stability enhancement occurs in an incremental fashion up to 1:15 were presumably saturation of available attachment sites is reached. 2) Attachment dramatically decreases stability (
 ) of the HSA96-NS(x:1) samples at the lowest attachment ratios (x = 1 - 10); thereafter at increased attachment ratios (x ≥ 10)
  converges to a constant value of higher stability, but with less stability than HSA96 alone.
4. Discussion
4.1. Thermodynamic Interpretation of Results
In order to provide an interpretation of the thermodynamic measurements of the two forms of HSA and consequences of biotinylation of them, consider the following simple model of thermal denaturation of HSA written as the following reaction,
 (1)
(1)
where the transition is assumed to occur in a pseudo two-state manner from the native intact structure,  , to the denatured state,
 . This reaction occurs with an observed standard state equilibrium constant,
 . The observed standard state free-energy is given by
 . At temperatures below tm the standard state free-energy,
  and the native structure is favored.
The equilibrium reaction in Equation (1) can be represented in terms of the corresponding chemical potentials as,
 (2)
(2)
where  and
and  are the hypothetical standard state chemical potentials for the native state (N) and the denatured state (D), respectively. The standard state free energy,
  , is given in terms of the differences of the standard state chemical potentials of the native and denatured states, i.e.
 (3)
(3)
The observed standard state equilibrium constant for the reaction is also given by,
 (4)
(4)
 (5)
(5)
At temperatures below tm, . Therefore,
 . The values of
  determined at 37˚C for both HSA99 and HSA96 are given as their
  values in Table 1.
In terms of the specific samples at hand, for HSA99,
 (6)
(6)
Similarly for HSA96,
 (7)
(7)
If the denatured state for both species is arbitrarily assigned as the reference state,  , then
  and
and . Henceforth for convenience we write
  and
and .
.
The general treatment above requires slight modification to properly consider the HSA96 preparation which, as stated earlier and evidenced by Figure 1, is primarily comprised of two different populations of the protein, termed HSA96-H and HSA96-L. To account for this mixture we write,
 (8)
(8)
with  equal to the mole fraction of HSA96-H in the HSA96 preparation. Here it is assumed if a small amount of HSA99 is present, it is so in a negligible amount (<5%). As such, writing Equation (8) in this manner ignores the slight presence of HSA99 (reckoned as the small inflection on the low temperature side of the HSA96 melting transition in Figure 1). Equation (8) assumes that other than HSA96-H the remaining protein is in the HSA96-L form.
As stated previously we assume HSA96-L and HSA96-H that comprise the HSA96 preparation are in many ways analogous to the defatted (HSAL-F) and un-defatted (HSAH-F) forms of HSA previously studied and reported [1] [15] [16] . Their different forms were observed under conditions very similar to ours (heating rate, buffer composition, protein concentration, relative fraction of FA). From their analysis they reported a value of xH in Equation (8) around 0.3 [1] [16] . They also reported measured average values for the transition enthalpies for the HSAL-F and HSAH-F species. These were, ΔHL-F = 4.18 cal/g for the defatted species and ΔHH-F = 5.16 cal/g, for the un-defatted species [1] . The molecular weight of HSA (66,500 g/mol) provides ΔHL-F = 280.06 kcal/mol and ΔHH-F = 345.72 kcal/mol. Reported tm values for HSAL-F and HSAH-F were 65.7˚C and 78.3˚C, respectively. These combined with ΔHL-F and ΔHH-F values provide an estimate on the transition entropies ΔSL-F and ΔSH-F for
the reported defatted and un-defatted species. That is,  and
and
 . If these reported enthalpy and entropy values are assumed for
the standard state, then estimates on the standard state free-energy at 37˚C,  , of 23.9 kcal/mol and 39.6 kcal/mol were obtained for the HSAL-F and HSAH-F structures, respectively. In analogy with Equations (7) and (8) these
  values yield the chemical potentials
  and
and  for the defatted and un-defatted forms of HSA. The difference,
 . In the discussion that follows it is arbitrarily assumed for the example shown that the values for HSA96-L and HSA96-H are approximately 75% of reported values for the presumably analogous forms, HSAL-F and HSAH-F. That is we assume
  and
and , with the same relative difference
 . This is probably not an unrealistic assumption based upon differences in data analysis and reported thermodynamic parameters compared to ours [1] . For both sets of values the relative difference remains the same.
With these assumptions, estimates on the value of x in our experiments can be made by rearranging Equation (8),

Using the values given above for  and
and  and the measured value of
  we find
 .
.
In a separate graphical analysis of the HSA96 thermogram (not shown), it was assumed the composite curve in Figure 1 collected for the HSA96 sample was comprised of just two major components, HSA96-H and HSA96-L. The graphical curve analysis returned an estimate of  which is in agreement with what was calculated assuming the values of
  and
and  above, but about 20% larger than reported [16] for the relative fractions of the analogous forms HSAL-F and HSAH-F. In the remaining development a value of
  is assumed for the initial composition of HSA96.
4.2. Attachment of Biotin to HSA
Consider the following cases. For the HSA99 preparation,

where  represents the generic attachment reaction that depends on the site of attachment, Bio = M or NS. Consider single site attachment first, i.e. Bio = M. In analogy with Equation (6) the observed standard state free-energy of the melting reaction for HSA99-M is given by,
 (9)
(9)
Again, letting  and
and , which is compared to
  . As a result,
  , and the attached biotin increases the chemical potential of the HSA99-M(x:1) structure compared to HSA99. In the above we have used the average value of
  evaluated from the average over the values obtained for the HSA99-M(x:1) samples at x = 1, 3, and 10.
For the HSA96 preparation the thermogram is comprised of two overlapping transitions. The lower temperature transition seems most affected by attachment and is attributed to HSA96-L with biotin attached, i.e. HSA96-L-M(x:1), and assumed to be similar (but not identical) to HSA99-M(x:1)

It is possible that during the attachment reaction some of the labeled HSA96-H molecules (HSA96-H-M) convert to the HSA96-L-M form. To account for these considerations the measured chemical potential of the HSA96-M preparation is written as,
 (10)
(10)
Rearranging Equation (10) and solving for  provides an estimate on the fraction of HSA96-H-M molecules that remain following the attachment reaction, i.e.

We assume that biotinylation of  and
and  has the same effect as biotinylation of
 , and similarly write the analogous chemical potentials, i.e.


and


And the average of the measured values of  evaluated at x = 1, 3 and 10, corresponds to the chemical potential
 . With the values of
 , and
, and  ,
,

This indicates that the fraction of molecules in the HSA96-H-M form decreases from 0.53 to 0.24 when the single site labeling reaction takes place. The result is approximately 50% of the HSA96-H in the original HSA96 preparation being converted in the single site attachment reactions.
Alternatively, consider the fraction of molecules  in the HSA96-H-M state (presumably now labeled) does not change during the attachment reaction, i.e.
 . How does the resulting value of
  change compared to
  due to the attachment reaction? Rearranging Equation (10) and solving for
 ,
,

This is considerably smaller than  So the effect of biotinylation on the HSA96 preparation is either to convert some fraction of the HSA96-H-M molecules to the HSA96-L-M form, or reduce the stability of HSA96-H-M compared to HSA96-H.
Results of the above analysis and behavior of the measured thermograms are consistent with the following scenario. In the process of the attachment reaction a portion of the HSA96-H molecules get biotinylated and convert to HSA96-L-M essentially becoming HSA99-M, which is much less stable than HSA96-H but more stable than HSA99 alone. Thus, there are two opposing effects of biotin attachment on protein stability. Biotin attachment to the HSA96-L and HSA96-H structures to create HSA96-L-M and HSA96-H-M increases their stabilities. But with the attachment reaction a fraction of the more stable, HSA96-H molecules are converted to the less stable HSA96-L form, then subsequently biotinylated to become HSA96-L-M ≈ HSA99-M. In combination, the loss of a fraction of the HSA96-H molecules through conversion results in a decrease in stability and reduces the chemical potential. This destabilization is overcome by attachment of biotin to HSA96-L to create HSA96-L-M resulting in an increase in chemical potential. This reduction and increase offset. As a consequence both the HSA96-M and HSA96 preparations have the same chemical potential.
Evidently, biotinylation increases stability of HSA96-L-M while reducing stability of HSA96-H-M compared to their unlabeled counterparts, HSA96-L and HSA96-H, respectively. It is possible that binding of ligands that comprise the FA/G-LC contributes to enhanced stability of HSA96-H that must exist in a more stable conformation than HSA96-L. HSA96-L may bind to the FA/G-LC ligands and have a structure and stability like HSA99 bound by the FA/G-LC ligands and have a different conformation than HSA96-H. Clearly, the 3% contaminant, FA/G-LC, in the HSA96 preparation has quite a profound effect on the structure and stability of the different forms of HSA that comprise the HSA96 preparation.
For the case of multiple attachment, consider for the HSA99 preparation,

where for multiple attachment Bio(x:1) = NS(x:1). For HSA99-NS(x:1),

Again, letting ,
, . These values of
  are given in Table 1, and plotted versus attachment ratio, x, in Figure 6. Higher x results in increased stability of the HSA99-NS(x:1) structure compared to HSA99. For the HSA99 preparation the effect of biotinylation is to incrementally increase
  (and tm) with increased attachment ratio, x. These results for HSA99-NS(x:1) provide the basis for dissecting the effects of multiple attachment on the HSA96 preparation.
On the HSA96-NS(x:1) thermograms in Figure 4 there is no sign of the high temperature transition attributed to the aforementioned HSA96-H structure. Apparently this would indicate an effect of the attachment reaction is conversion of all molecules to the HSA96-L-NS(x:1) type structure. Based on this observation, we assume the thermograms of the HSA96-NS(x:1) samples are comprised of contributions of the labeled HSA96-L-NS(x:1) which is similar, but not identical (especially at low attachment ratios) to HSA99-NS(x:1); and contributions from binding of the FA/G-LC to that structure, i.e. . In this case the chemical potential for HSA96-NS(x:1) is written as,

or
 (11)
(11)
If we assume in Equation (11) that  then the observed differences,
  are the contributions of binding of the FA/G-LC to the chemical potential of HSA96-NS(1:x), a state believed to be HSA99 with attached biotin
  and bound by the FA/G-LC. Both biotinylation and FA/G-LC binding are stabilizing interactions.
Values of  are plotted versus attachment ratio (x) in Figure 7. As shown there, the value of
  is highest at the lowest attachment ratio where the contribution from FA/G-LC binding is greatest. As attachment ratio increases
  rapidly decreases to essentially zero at the higher biotinylation ratios. This decrease presumably corresponds to occlusion of FA/G-LC binding to HSA96-L-NS(x:1) by increased biotin attachment at the higher ratios. Given the above analysis and interpretation derived therefrom, we can provide an explanation of the apparently contrasting behaviors of the HSA99-NS(1:x) and HSA96-NS(1:x) species. Consider the following scenario for HSA96-NS(1:x). At the lowest attachment ratios, the protein resides as HSA96-L with biotin attached to a few sites and some FA/G-LC bound to other potential binding sites. This results in a structure with a stabilizing component in the biotin label (as indicated for HSA99-NS(x:1)) and a further stabilizing component due to binding of FA/G-LC to HSA96-L-NS(x:1). As the attachment ratio increases more biotin is attached, displacing formerly bound FA/G-LC at new biotinylated attachment sites, and occluding further FA/G-LC-binding there. At higher levels of biotinylation, destabilization brought about by the loss of FA/G-LC binding is more than compensated for by the increase in stability afforded by the increased amount of attached biotin, resulting in a more stable structure with increased tm and greater
  that approaches that of HSA99-NS(x:1) for x > 20. Thus, the behavior of HSA96-NS(x:1) can be summarized as follows. The attachment reaction results in conversion of the HSA96-H species to HSA96-L. At the lowest attachment ratios (x < 20), the HSA96-L-NS(x:1) structure is stabilized by FA/G-LC binding and attachment of biotin. At higher attachment ratios stability of the biotinylated structure increases, but FA/G-LC is released resulting in a conversion of the structure from HSA96-L-NS(x:1) to one more like HSA99-NS(x:1). If this is the case, the difference in the
  values for HSA96-NS(x:1) and HSA99-NS(x:1) in Equation (11),
  at the lowest attachment ratio is a direct gauge of the added stabilization afforded by FA/G-LC binding to the HSA96-L ≈ HSA99 structure.
4.3. Reversibility to HSA Thermograms
As mentioned previously, published melting studies of HSA reported observations, at temperatures approaching tm, of a second reaction attributed to irreversible aggregation of the protein in the denaturation region [1] [12] [13] [15] . They noted the potential existence of a slow irreversible denaturation step(s) but concluded potential contributions to the overall measured thermogram were minimal. Irreversibility occurs due to intermolecular association of denatured HSA polypeptide strands. Such aggregation is not readily reversible in the transition region and can affect reversibility of the HSA melting transition [16] . Influence of irreversible denaturation on the primary melting transition of HSA can be minimized (somewhat) through appropriate choices of experimental parameters [12] [13] [16] . In effect, under optimally designed experimental conditions the temperature scanning rate is such that kinetics of the irreversible denaturation reaction are relatively much slower, and only begin to contribute significantly to the HSA melting transition at temperatures above the tm. Since our experiments of HSA were carried out under similar conditions to those previously reported [1] , it was assumed the measured HSA melting transitions are, for the most part, reversible. Inherent in the analyses that were performed was the choice of the “universal” reference state, i.e. the denatured state. Therefore, the possibility of heterogeneous denatured states, differing in character in addition to their ability to reversibly renature from the denatured state to the native state, is not considered.
Contributions of the irreversible transition to the measured ΔCp values can also manifest in the thermogram baseline and therefore be reduced or subtracted out (somewhat) in the baseline analytical procedure. The irreversible reaction could also manifest in evaluated thermodynamic parameters of the melting transition, which assumes a truly equilibrium (reversible) process with parameters evaluated from the area under the baseline corrected thermogram. This process might influence absolute values of thermodynamic transition parameters, ΔHcal and ΔScal, which may be lower (or higher) than what has been reported previously, depending on how much of the baseline encroaches on the melting of transition of HSA from the native to denatured form, and how much irreversibility affects the transition and choices made as part of the baseline analysis procedure. In our analysis as much as 30% of the total endotherm of HSA can be absorbed in the baseline. Our baseline analysis treatment was performed in a systematic fashion in precisely the same manner for all thermograms. Within the inherent
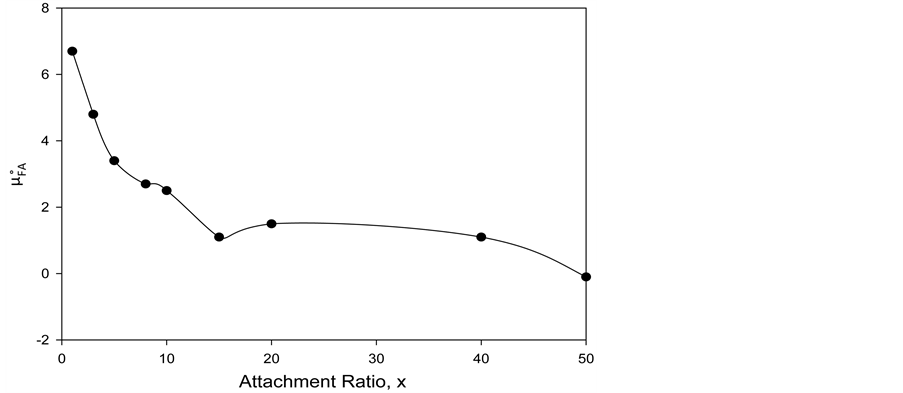
Figure 7. Values of the additional contribution to the chemical potential of HSA due to FA/G-LC binding,  (see text) plotted versus attachment ratio, x.
uncertainties underlying the operative analysis, relative values of the thermodynamic parameters are considered to be more quantitatively significant. Fortunately the analysis that was performed involved relative comparisons of the transition thermodynamic parameters.
5. Conclusion
In summary, results of this study have demonstrated that DSC is a sensitive method for monitoring solution conformation and stability of proteins (HSA). These experimental results and model analysis indicate that HSA can exist in very different thermodynamic states depending on the presence of a very small fraction (3%) of contaminants (likely) containing FA and globulin, termed FA/G-LC. These different states of HSA are also differentially affected by biotinylation. Thus, both biotinylation (adduct formation) and binding of ligands that comprise the FA/G-LC can stabilize the native form of HSA, and the different forms of HSA differentially respond to biotinylation in the presence or absence of FA/G-LC ligands.
Acknowledgements
This work was supported in part by grants IP-0912660 and IP-1026824 from the National Science Foundation. Portions of this work were also supported by a scholarship from the Ronald E. McNair Post-Baccalaureate Achievement Program awarded to Huyen Hoang. We thank Professor Jonathan B. Chaires and Dr. Nicola Garbett (University of Louisville) for helpful discussions and advice; and acknowledge Dr. Alan Ezrin (NX- PharmaGen) for suggesting these experiments. We thank Professor Todd Wimpfheimer (Salem State University) for helpful comments on the manuscript.
Cite this paper
HuyenHoang,FidelisManyanga,Moshood K.Morakinyo,VincentPinkert,FerdousSarwary,Daniel J.Fish,Greg P.Brewood,Albert S.Benight, (2016) Effects of Selective Biotinylation on the Thermodynamic Stability of Human Serum Albumin. Journal of Biophysical Chemistry,07,9-29. doi: 10.4236/jbpc.2016.71002
References
- 1. Ross, P.D. and Shrake, A. (1988) Decrease in Stability of Human Albumin with Increase in Protein Concentration. The Journal of Biological Chemistry, 263, 11196-11202.
- 2. Peters, T. (1996) All about Albumin: Biochemistry, Genetics and Medical Applications. Academic Press, San Diego.
- 3. Millán, F. and Mingo-Castel, A. (2003) A Chloroplast Transgenic Approach to Hyper-Express and Purify Human Serum Albumin: A Protein Highly Susceptible to Proteolytic Degradation. Plant Biotechnology Journal, 1, 71-79.
http://dx.doi.org/10.1046/j.1467-7652.2003.00008.x - 4. Sudlow, G., Birkett, D.J. and Wade, D.N. (1976) Further Characterization of Specific Drug Binding Sites on Human Serum Albumin. Molecular Pharmacology, 12, 1052-1061.
- 5. Fasano, M., Curry, S., Terreno, E., Galliano, M., Fanali, G., Narciso, P., Notari, S. and Ascenzi, P. (2005) The Extraordinary Ligand Binding Properties of Human Serum Albumin. IUBMB Life, 57, 787-796.
http://dx.doi.org/10.1080/15216540500404093 - 6. Anderson, N.L. and Anderson, N.G. (1991) A Two-Dimensional Gel Database of Human Plasma Proteins. Electrophoresis, 12, 883-906.
http://dx.doi.org/10.1002/elps.1150121108 - 7. Anderson, N.L., Polanski, M., Pieper, R., Gatlin, T., Tirumalai, R.S., Conrads, T.P., Veenstra, T.D., Adkins, J.N., Pounds, J.G., Fagan, R. and Lobley, A. (2004) The Human Plasma Proteome: A Nonredundant List Developed by Combination of Four Separate Sources. Molecular & Cellular Proteomics, 3, 311-326.
http://dx.doi.org/10.1074/mcp.M300127-MCP200 - 8. Kragh-Hansen, U. (1981) Molecular Aspects of Ligand Binding to Serum Albumin. Pharmacological Reviews, 33, 17-53.
- 9. Rezaei-Tavirani, M., Moghaddamnia, S.H., Ranjbar, B., Amani, M. and Marashi, S.-A. (2006) Conformational Study of Human Serum Albumin in Pre-Denaturation Temperatures by Differential Scanning Calorimetry, Circular Dichroism and UV Spectroscopy. Journal of Biochemistry and Molecular Biology, 39, 530-536.
http://dx.doi.org/10.5483/BMBRep.2006.39.5.530 - 10. Wetzel, R., Becker, M., Behlke, J., Billwitz, H., Böhm, S., Ebert, B., Hamann, H., Krumbiegel, J. and Lassmann, G. (1980) Temperature Behaviour of Human Serum Albumin. European Journal of Biochemistry, 104, 469-478.
http://dx.doi.org/10.1111/j.1432-1033.1980.tb04449.x - 11. Wallevik, K. (1973) Reversible Denaturation of Human Serum Albumin by pH, Temperature, and Guanidine Hydrochloride Followed by Optical Rotation. Journal of Biological Chemistry, 248, 2650-2655.
- 12. Pico, G.A. (1997) Thermodynamic Features of the Thermal Unfolding of Human Serum Albumin. International Journal of Biological Macromolecules, 20, 63-73.
- 13. Farruggia, B. and Pico, G.A. (1999) Thermodynamic Features of the Chemical and Thermal Denaturation of Human Serum Albumin. International Journal of Biological Macromolecules, 26, 317-323.
http://dx.doi.org/10.1016/S0141-8130(99)00054-9 - 14. Farruggia, B., Rodriguez, F., Rigatuso, R., Fidelio, G. and Picó, G. (2001) The Participation of Human Serum Albumin Domains in Chemical and Thermal Unfolding. Journal of Protein Chemistry, 20, 81-89.
http://dx.doi.org/10.1023/A:1011000317042 - 15. Shrake, A., Finlayson, J.S. and Ross, P.D. (1984) Thermal Stability of Human Albumin Measured by Differential Scanning Calorimetry. I. Effects of Caprylate and N-Acetyltryptophanate. Vox Sanguinis, 47, 7-18.
http://dx.doi.org/10.1111/j.1423-0410.1984.tb01556.x - 16. Shrake, A. and Ross, P.D. (1990) Ligand-Induced Biphasic Protein Denaturation. Journal of Biological Chemistry, 265, 5055-5059.
- 17. Michnik, A., Michalik, K., Kluczewska, A. and Drzazga, Z. (2006) Comparative DSC Study of Human and Bovine Serum Albumin. Journal of Thermal Analysis and Calorimetry, 84, 113-117.
http://dx.doi.org/10.1007/s10973-005-7170-1 - 18. Michnik, A., Michalik, K. and Drzazga, Z. (2006) DSC Study of Human Serum Albumin Ageing Processes in Aqueous and Low Concentration Ethanol Solutions. Polish Journal of Environmental Studies, 15, 81-83.
- 19. Michnik, A. and Drzazga, Z. (2007) Effect of Ethanol on the Thermal Stability of Human Serum Albumin. Journal of Thermal Analysis and Calorimetry, 88, 449-454.
http://dx.doi.org/10.1007/s10973-006-8072-6 - 20. Michnik, A. (2007) DSC Study of the Association of Ethanol with Human Serum Albumin. Journal of Thermal Analysis and Calorimetry, 87, 91-96.
http://dx.doi.org/10.1007/s10973-006-7825-6 - 21. Meloun, B., Morávek, L. and Kostka, V. (1975) Complete Amino Acid Sequence of Human Serum Albumin. FEBS Letters, 58, 134-137.
http://dx.doi.org/10.1016/0014-5793(75)80242-0 - 22. Dugaiczyk, A., Law, S.W. and Dennison, O.E. (1982) Nucleotide Sequence and the Encoded Amino Acids of Human Serum Albumin mRNA. Proceedings of the National Academy of Sciences of the United States of America, 79, 71-75.
http://dx.doi.org/10.1073/pnas.79.1.71 - 23. He, X.M. and Carter, D.C. (1992) Atomic Structure and Chemistry of Human Serum Albumin. Nature, 358, 209-215.
http://dx.doi.org/10.1038/358209a0 - 24. Carter, D.C. and Ho, J.X. (1994) Structure of Serum Albumin. Advances in Protein Chemistry, 45, 153-203.
http://dx.doi.org/10.1016/S0065-3233(08)60640-3 - 25. Sugio, S., Kashima, A. and Mochizuki, S. (1999) Crystal Structure of Human Serum Albumin at 2.5Å Resolution. Protein Engineering, 12, 439-446.
http://dx.doi.org/10.1093/protein/12.6.439 - 26. Huang, B.X., Dass, C. and Kim, H.-Y. (2005) Probing Conformational Changes of Human Serum Albumin Due to Unsaturated Fatty Acid Binding by Chemical Cross-Linking and Mass Spectrometry. Biochemical Journal, 387, 695-702.
http://dx.doi.org/10.1042/BJ20041624 - 27. Curry, S., Brick, P. and Franks, N.P. (1999) Fatty Acid Binding to Human Serum Albumin: New Insights from Crystallographic Studies. Biochimica et Biophysica Acta (BBA)—Molecular and Cell Biology of Lipids, 1441, 131-140.
http://dx.doi.org/10.1016/S1388-1981(99)00148-1 - 28. Azim-Zadeh, O., Hillebrecht, A., Linne, U., Marahiel, M., Klebe, G., Lingelbach, K. and Nyalwidhe, J. (2007) Use of Biotin Derivatives to Probe Conformational Changes in Proteins. Journal of Biological Chemistry, 282, 21609-21617.
http://dx.doi.org/10.1074/jbc.M610921200 - 29. Mock, D.M. and Lankford, G. (1990) Studies of the Reversible Binding of Biotin to Human Plasma. Journal of Nutrition, 120, 375-381.
- 30. Cohn, E.J., Strong, L.E., Hughes, W.L., Mulford, D.J., Ashworth, J.N., Melin, M. and Taylor, H.L. (1946) Preparation and Properties of Serum and Plasma Proteins. IV. A System for the Separation into Fractions of the Protein and Lipoprotein Components of Biological Tissues and Fluids 1a,b,c,d. Journal of the American Chemical Society, 68, 459-475.
http://dx.doi.org/10.1021/ja01207a034 - 31. Quinlan, G.J., Martin, G.S. and Evans, T.W. (2005) Albumin: Biochemical Properties and Therapeutic Potential. Hepatology, 41, 1211-1219.
http://dx.doi.org/10.1002/hep.20720 - 32. Oncley, J.L., Scatchard, G. and Brown, A. (1947) Physical-Chemical Characteristics of Certain of the Proteins of Normal Human Plasma. Journal of Physical and Colloid Chemistry, 51, 184-198.
http://dx.doi.org/10.1021/j150451a014 - 33. Bruylants, G., Wouters, J. and Michaux, C. (2005) Differential Scanning Calorimetry in Life Science: Thermodynamics, Stability, Molecular Recognition and Application in Drug Design. Current Medicinal Chemistry, 12, 2011-2020.
http://dx.doi.org/10.2174/0929867054546564
NOTES

*Corresponding author.