Journal of Biophysical Chemistry
Vol.4 No.4(2013), Article ID:39859,9 pages DOI:10.4236/jbpc.2013.44017
In vitro study of iron doped hydroxyapatite
![]()
1Physics Department, Faculty of Science, Al-Azhar University, Naser City, Egypt; already_a555@yahoo.com, drahmedgamal@yahoo.com
2Physics Department, Faculty of Science, South Valley University, Qena, Egypt; profdrgamal@yahoo.com, alaahassan2010@yahoo.com
Copyright © 2013 Khairy Mohamed Tohamy Ereibab et al. This is an open access article distributed under the Creative Commons Attribution License, which permits unrestricted use, distribution, and reproduction in any medium, provided the original work is properly cited.
Received 29 July 2013; revised 29 August 2013; accepted 5 September 2013
Keywords: Hydroxyapatite; Iron Doped Hydroxyapatite; Bioactivity; Bone-Like Apatite; Solubility
ABSTRACT
The effect of iron substitution on the bioactivity of hydroxyapatite (HAp) under the physiological conditions was investigated. Five samples of iron doped hydroxyapatite (FeHAp) with different iron concentrations (0, 0.05, 0.1, 0.2, and 0.3 mol%) were synthesized by wet chemical method. The formation of bone-like apatite layer on the surface of the samples was detected using X-ray diffraction (XRD), Fourier transforms infrared (FTIR) and scanning electron microscope techniques. The changes of the pH of SBF medium were measured at pre-determined time intervals using a pH meter. The dissolution of calcium, phosphorus and iron ions in SBF medium was determined by single beam scanning spectrophotometer. XRD and FTIR results exhibit the formation of carbonate apatite layer on the surface of the immersed samples, which increase with the increase of iron content. SEM results showed agglomeration of small crystals on the surface of the immersed samples. The solubility and dissolution tests revealed that iron doped HAp samples had a higher solubility and dissolution rate than pure sample, which indicated that iron increased the bioactivity of HAp in vitro.
1. INTRODUCTION
Hydroxyapatite (HAp) which has the chemical formula [Ca10(PO4)6(OH)2] is well known as the mineral component of bones and teeth. Thus, it is commonly used as a filler to replace amputated bone or as a coating to promote bone ingrowth into prosthetic implants. Although many other phases exist with similar or even identical chemical makeup, the body responds much differently to them. Coral skeletons can be transformed into hydroxyapatite at high temperatures; their porous structure allows relatively rapid ingrowth at the expense of initial mechanical strength. The high temperature also burns away any organic molecules such as proteins, preventing an immune response and rejection [1]. Many modern implants, e.g. hip replacements and dental implants, are coated with HAp. It has been suggested that this may promote osseointegration [2]. Porous hydroxyapatite implants are used for local drug delivery in bones [3]. HAp deposits in tendons around joints in the medical condition calcific tendinitis [4].
Bioactivity of HAp is its ability to bond directly to bone and form a new bone after implanted in the living body [5]. The mechanism of bone-like apatite layer formation on the surface of the sample contains two main processes:
- Dissolution process
- Precipitation process According to these processes, the soaked sample should dissolve and with the increase in the immersion time, the dissolution rate decreases and the precipitation rate increases until equilibrium reaches, then Ca and P ions concentrations saturate. The time needed for formation of apatite layer on the surface of the sample can vary from one material to another. The faster of the formation of apatite layer is, the greater the bioactivity of the material will be.
Many substitutions can be introduced to HAp structure to improve its biocompatibility and bioactivity. For example, the presence of strontium (Sr) enhances osteoblast activity and differentiation, while it inhibits osteoclast production and proliferation [3]. Also, Silicon (Si) enhances the formation of a poorly crystalline surface apatite layer of HAp after immersing in simulated body fluids (SBF) [4].
The substitution of iron into the structure of HAp is known to decrease the formation of HAp [5,6], however, little is known about the behaviour of iron doped HAp under the physiological conditions. This work aims to study the effect of iron on the bioactivity and solubility of HAp under the physiological conditions.
2. EXPERIMENTAL PROCEDURE
2.1. Synthesis of HAp and FeHAp
Five samples of hydroxyapatite were synthesized by wet chemical methods. The chemical reagent and starting materials concentrations for the precipitation are listed in Table 1.
2.2. Preparation of SBF
The preparation of SBF was adopted from the protocol developed by Kokubo et al. [7]. In order to prepare 1000 ml of SBF, first of all 700 ml of ion-exchanged and distilled water with a stirring bar into 1000 ml glass beaker is set on a hot plate covering with a watch glass maintaining the temperature at 36.5˚C ± 2˚C under stirring. The first 8 order reagents given in Table 2 are dissolved in water one by one. The 9th and 10th order reagents are dissolved to adjust pH to 7.4. After the pH adjustment, the solution is cooled down to 20˚C and enough ionexchange and distilled water is added to complete the solution to 1000 ml. The test specimens were immersed individually in test tubes in 50 mL of simulated body fluid (SBF), in a thermodynamic incubator (shakingwater bath) at 37˚C. A 3-mL sample of SBF was taken from each test tube after 6, 12, 18, 24 and 28 days from the beginning of the immersion. The test tubes were discarded after the samples had been taken. The 9-mL sample was stored frozen until analyzed for Ca, P and Fe ions concentrations.
3. CHARACTERIZATION
To examine the formation of apatite layer in the surface of the prepared samples, the samples were taken out from the SBF solution and gently washed with pure water. The samples should be dried in a desiccator without heating. The dried discs were crashed by a mortar and tested by XRD, FTIR and SEM techniques.
3.1. X-Ray Diffraction (XRD)
X-ray diffraction (XRD) pattern data were obtained at room temperature using powder samples in an X’Pert PRO-P3AN anlytical difractometer (with Cu-Kα radiation, λ = 1.54056 Å) at 40 kV and 30 mA. Intensity data were collected by the step-counting method (step 0.020 and a time per step of 0.4 s) between 4˚ and 80˚ (2θ).
3.2. Fourier Transform Infrared (FTIR)
Fourier transform infrared (FTIR) spectroscopy was employed to determine the chemical functionality of CHAp. The potassium bromide (KBr) disk technique was
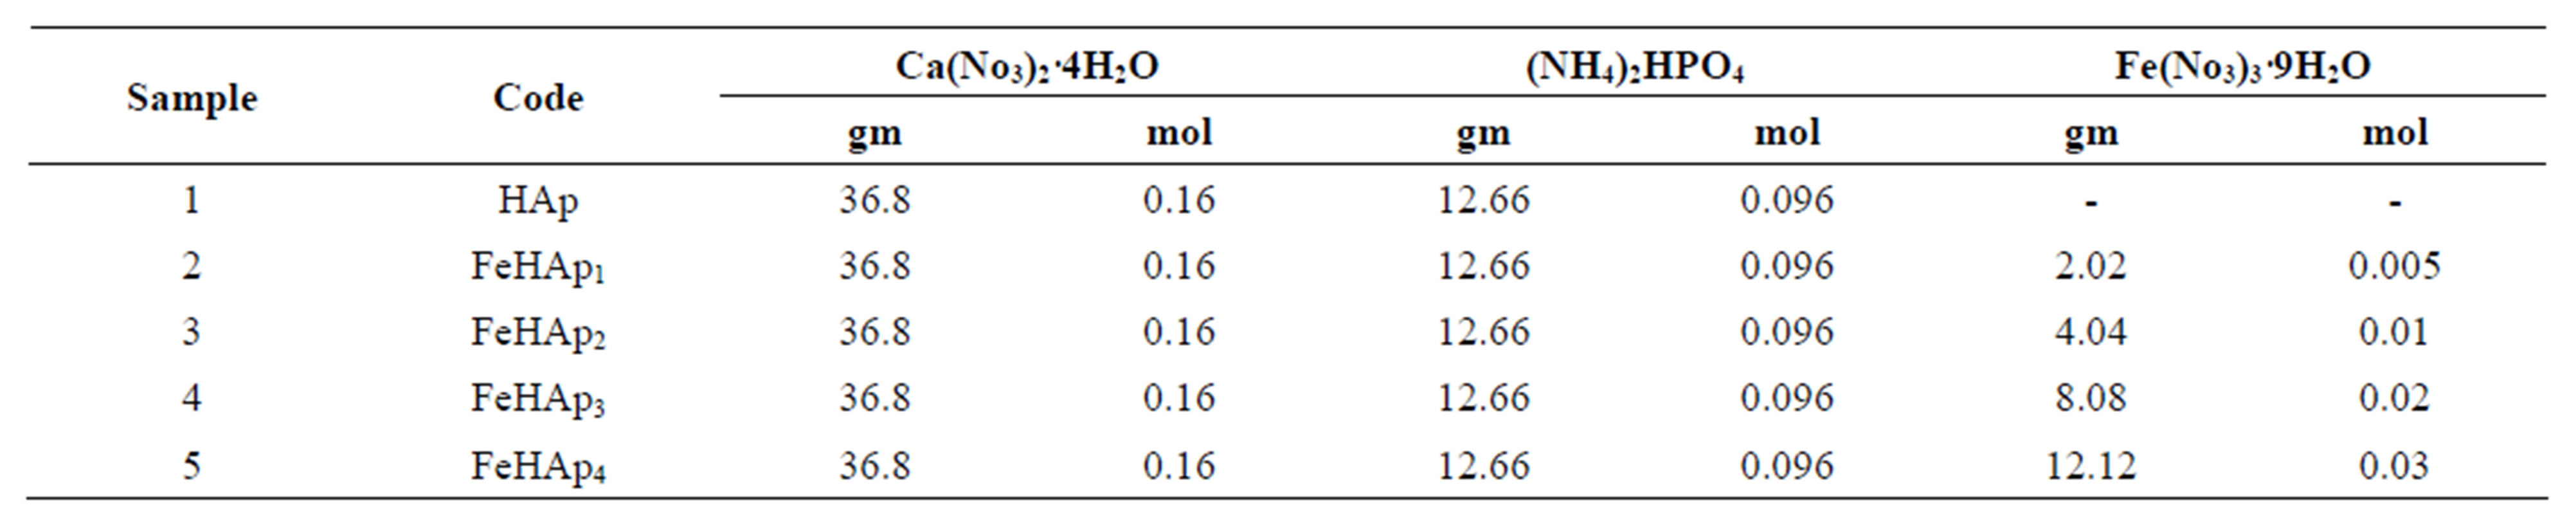
Table 1. The chemical reagent of the prepared samples.
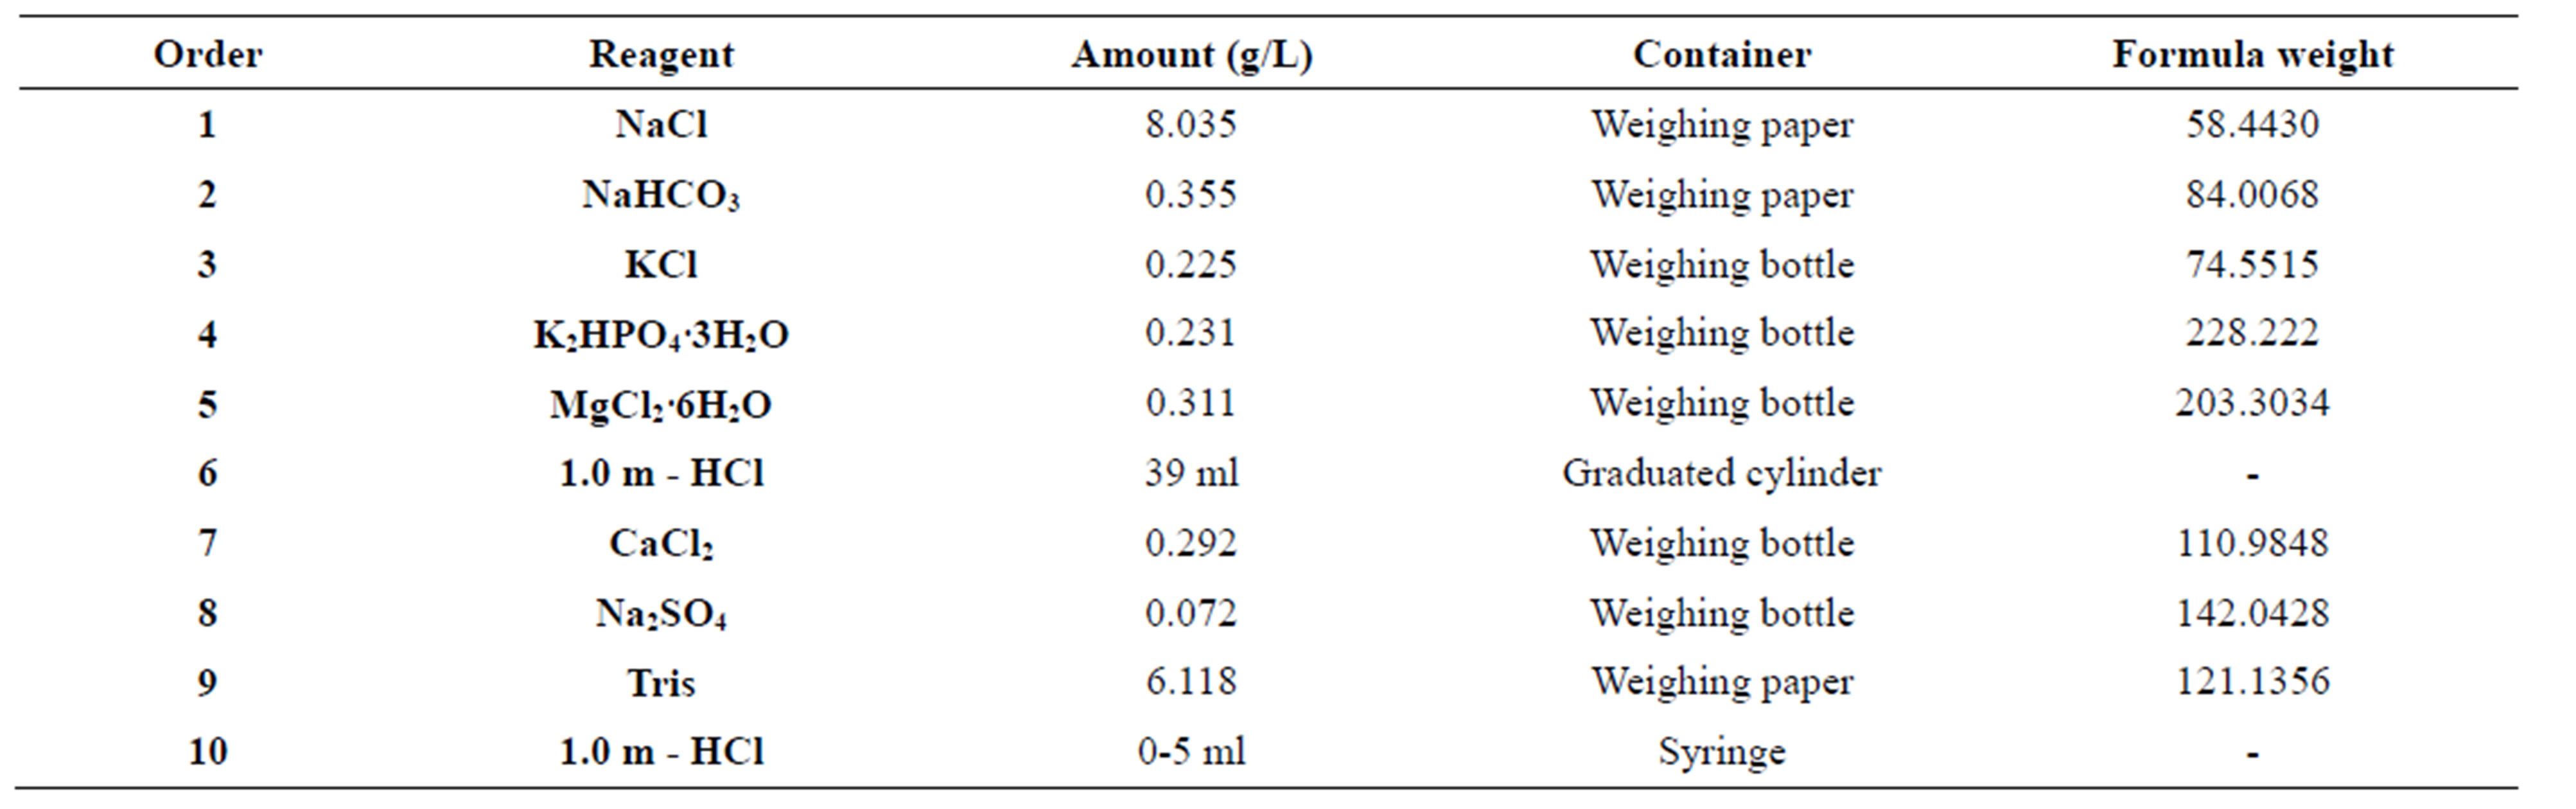
Table 2. Order, amounts, weighing containers, and formula weights of reagents for preparing of SBF.
used for analysis using 2 mg of CHAp powder compacted with 200 mg of KBr under hydraulic pressure.All the spectra were measured by using (Model 6100, JascoJapan) infrared spectrometer with a resolution of 4.00 cm−1 at room temperature, which covers the wave number range of 4000 - 400 cm−1 to evaluate the function group of the samples.
3.3. Scanning Electron Microscope (SEM)
The morphology of the prepared samples was examined using (JEOL SEM model JSM-5500—Japan), with accelerating voltage 5 KV.
3.4. pH Measurement
The change of the pH of the prepared samples was examined in SBF under a physiological condition (pH 7.4 at 37˚C ± 1.5˚C) and the pH was measured with (pH meter model 3510 Jenway—Japan) at pre-determined time intervals.
3.5. Concentrations of Released Ions
The quantitative analysis of released calcium, phosphorus and iron ion concentration after immersion in SBF are determined with single beam scanning spectrophotometer (Jenway 4600 UV-Vis Spectrophotometer —England) over range of 320 - 1100 nm using biological kits. All ions are measured using (Spectrum-diagnostics —Egypt).
4. RESULTS AND DISCUSSIONS
4.1. XRD of the Immersed Samples
XRD patterns of pure HAp and FeHAp samples after soaking in SBF for 24 days are shown in Figure 1. The pure HAp sample doesn’t reflect any phases except HAp as confirmed by the ICSD card no. 76-0694, while all iron doped HAp samples showed a hematite as a secondary phase beside HAp as confirmed by the ICSD card no. 89-0597. The presence of hematite may be attributed to the dissolution process of samples after soaking in SBF. This process introduces free ions to the solution such as Fe, Ca, P and O, which support the formation of hematite. A similar behavior was observed with iron doped HAp after sintering in air [8].
Figure 2 shows the percentage amount of hematite and apatite phases as a function of iron content. It was observed that hematite phase decreased, while apatite phase increased with the increase of iron content. This behavior suggested that iron enhance the formation of HAp, while it reduced the formation of hematite. To interpret this behavior, the condition of HAp nucleation must be considered. Peixin Zhu et al [9] reported that the nucleation of HAp induced by the electrostatic attraction
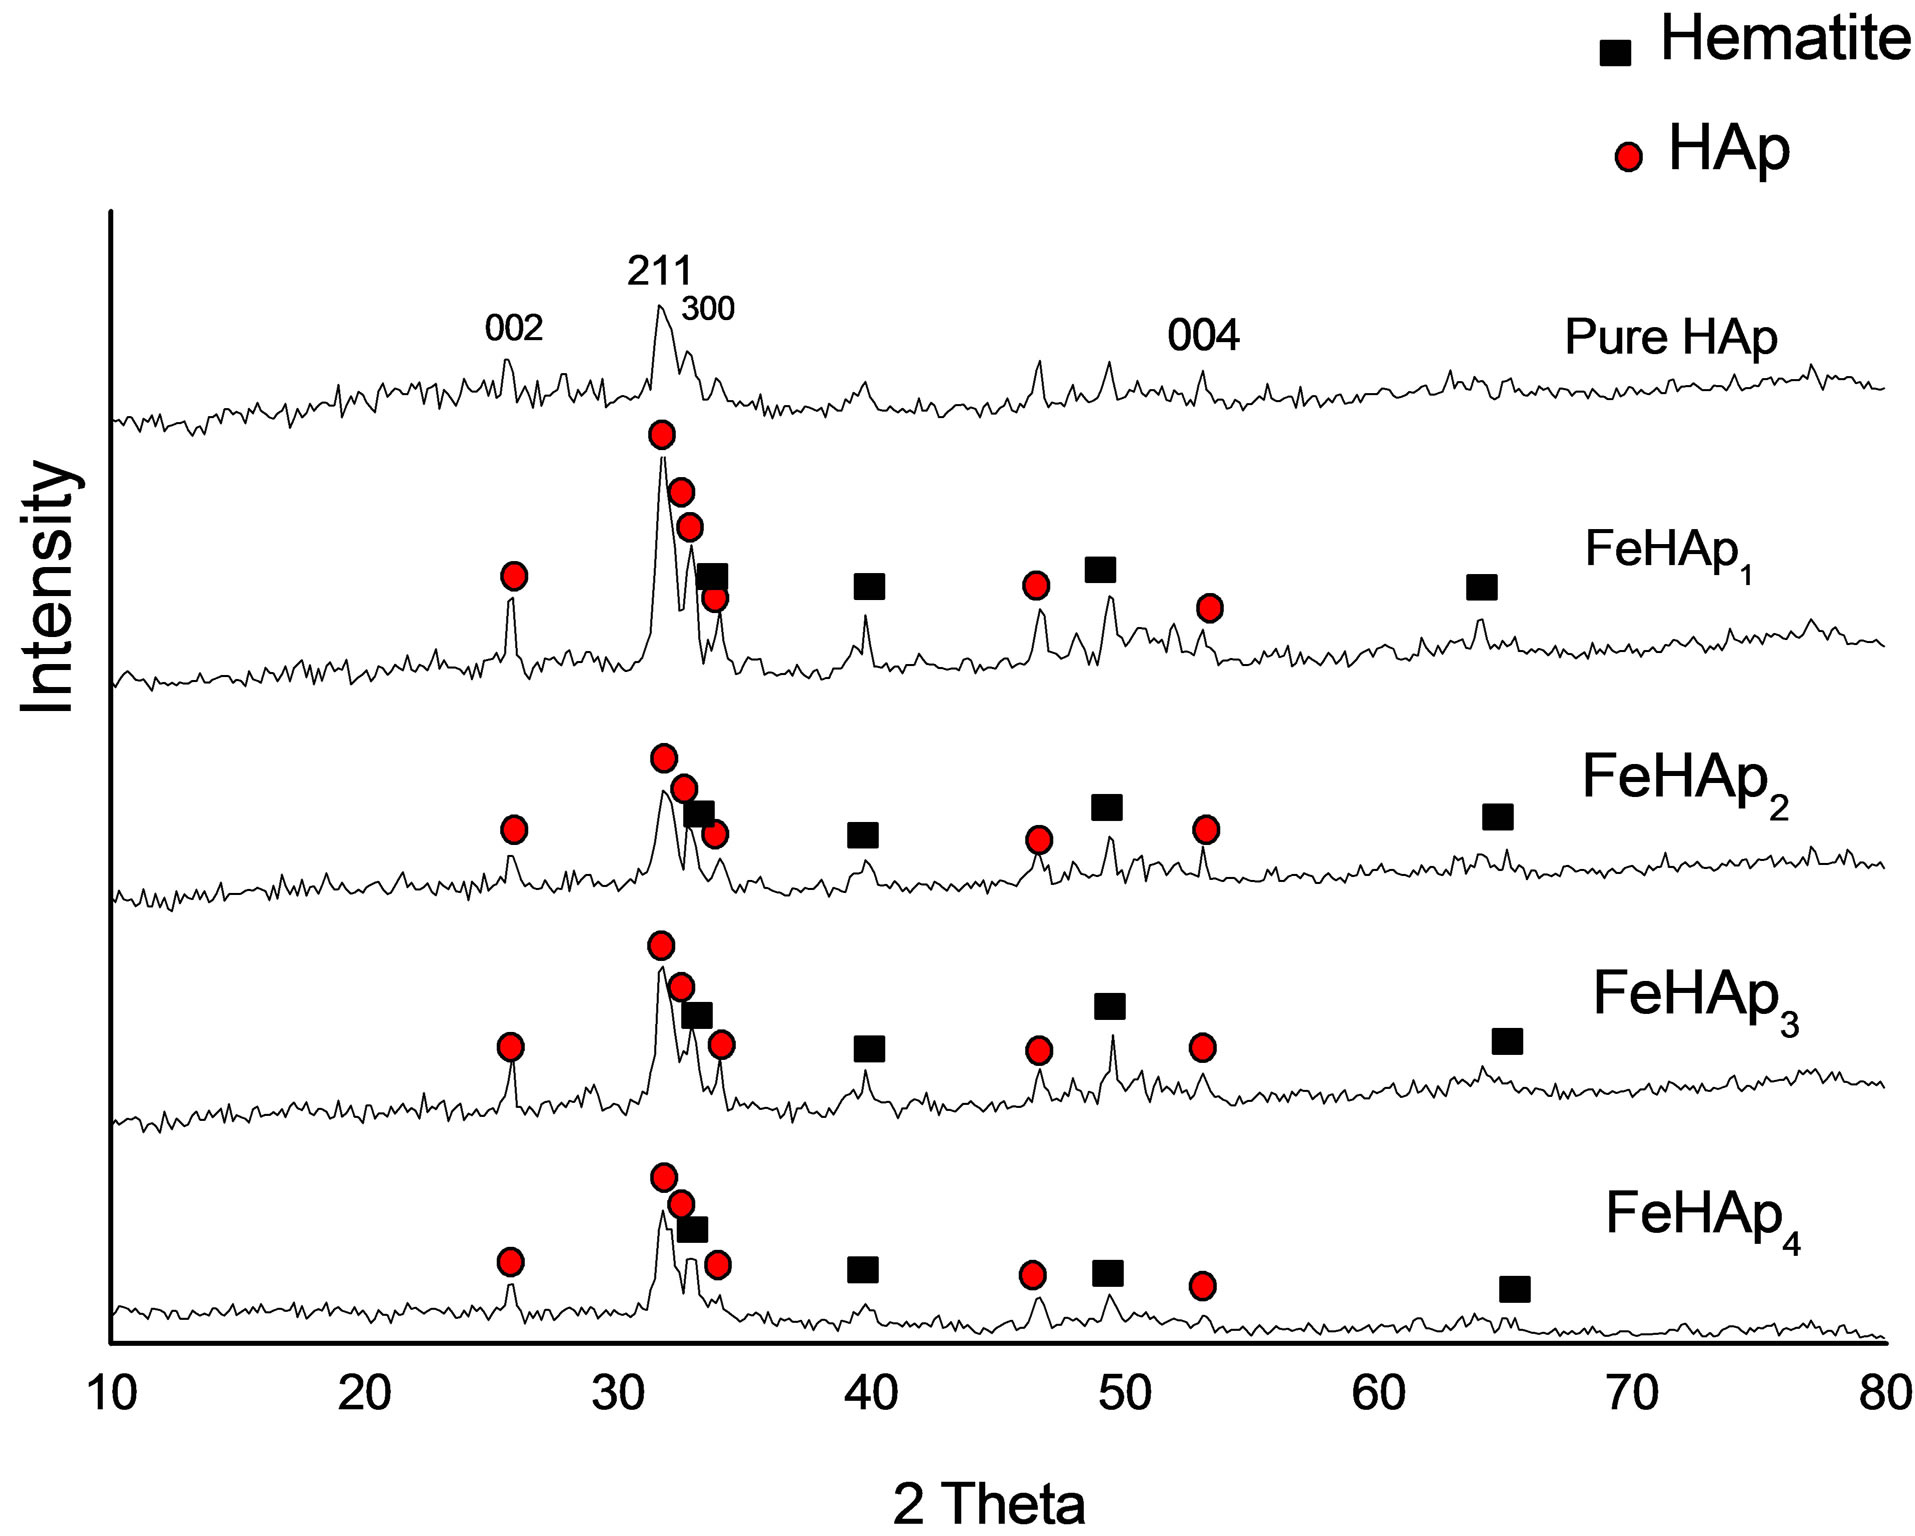
Figure 1. XRD of samples after immersion in SBF for 24 days.
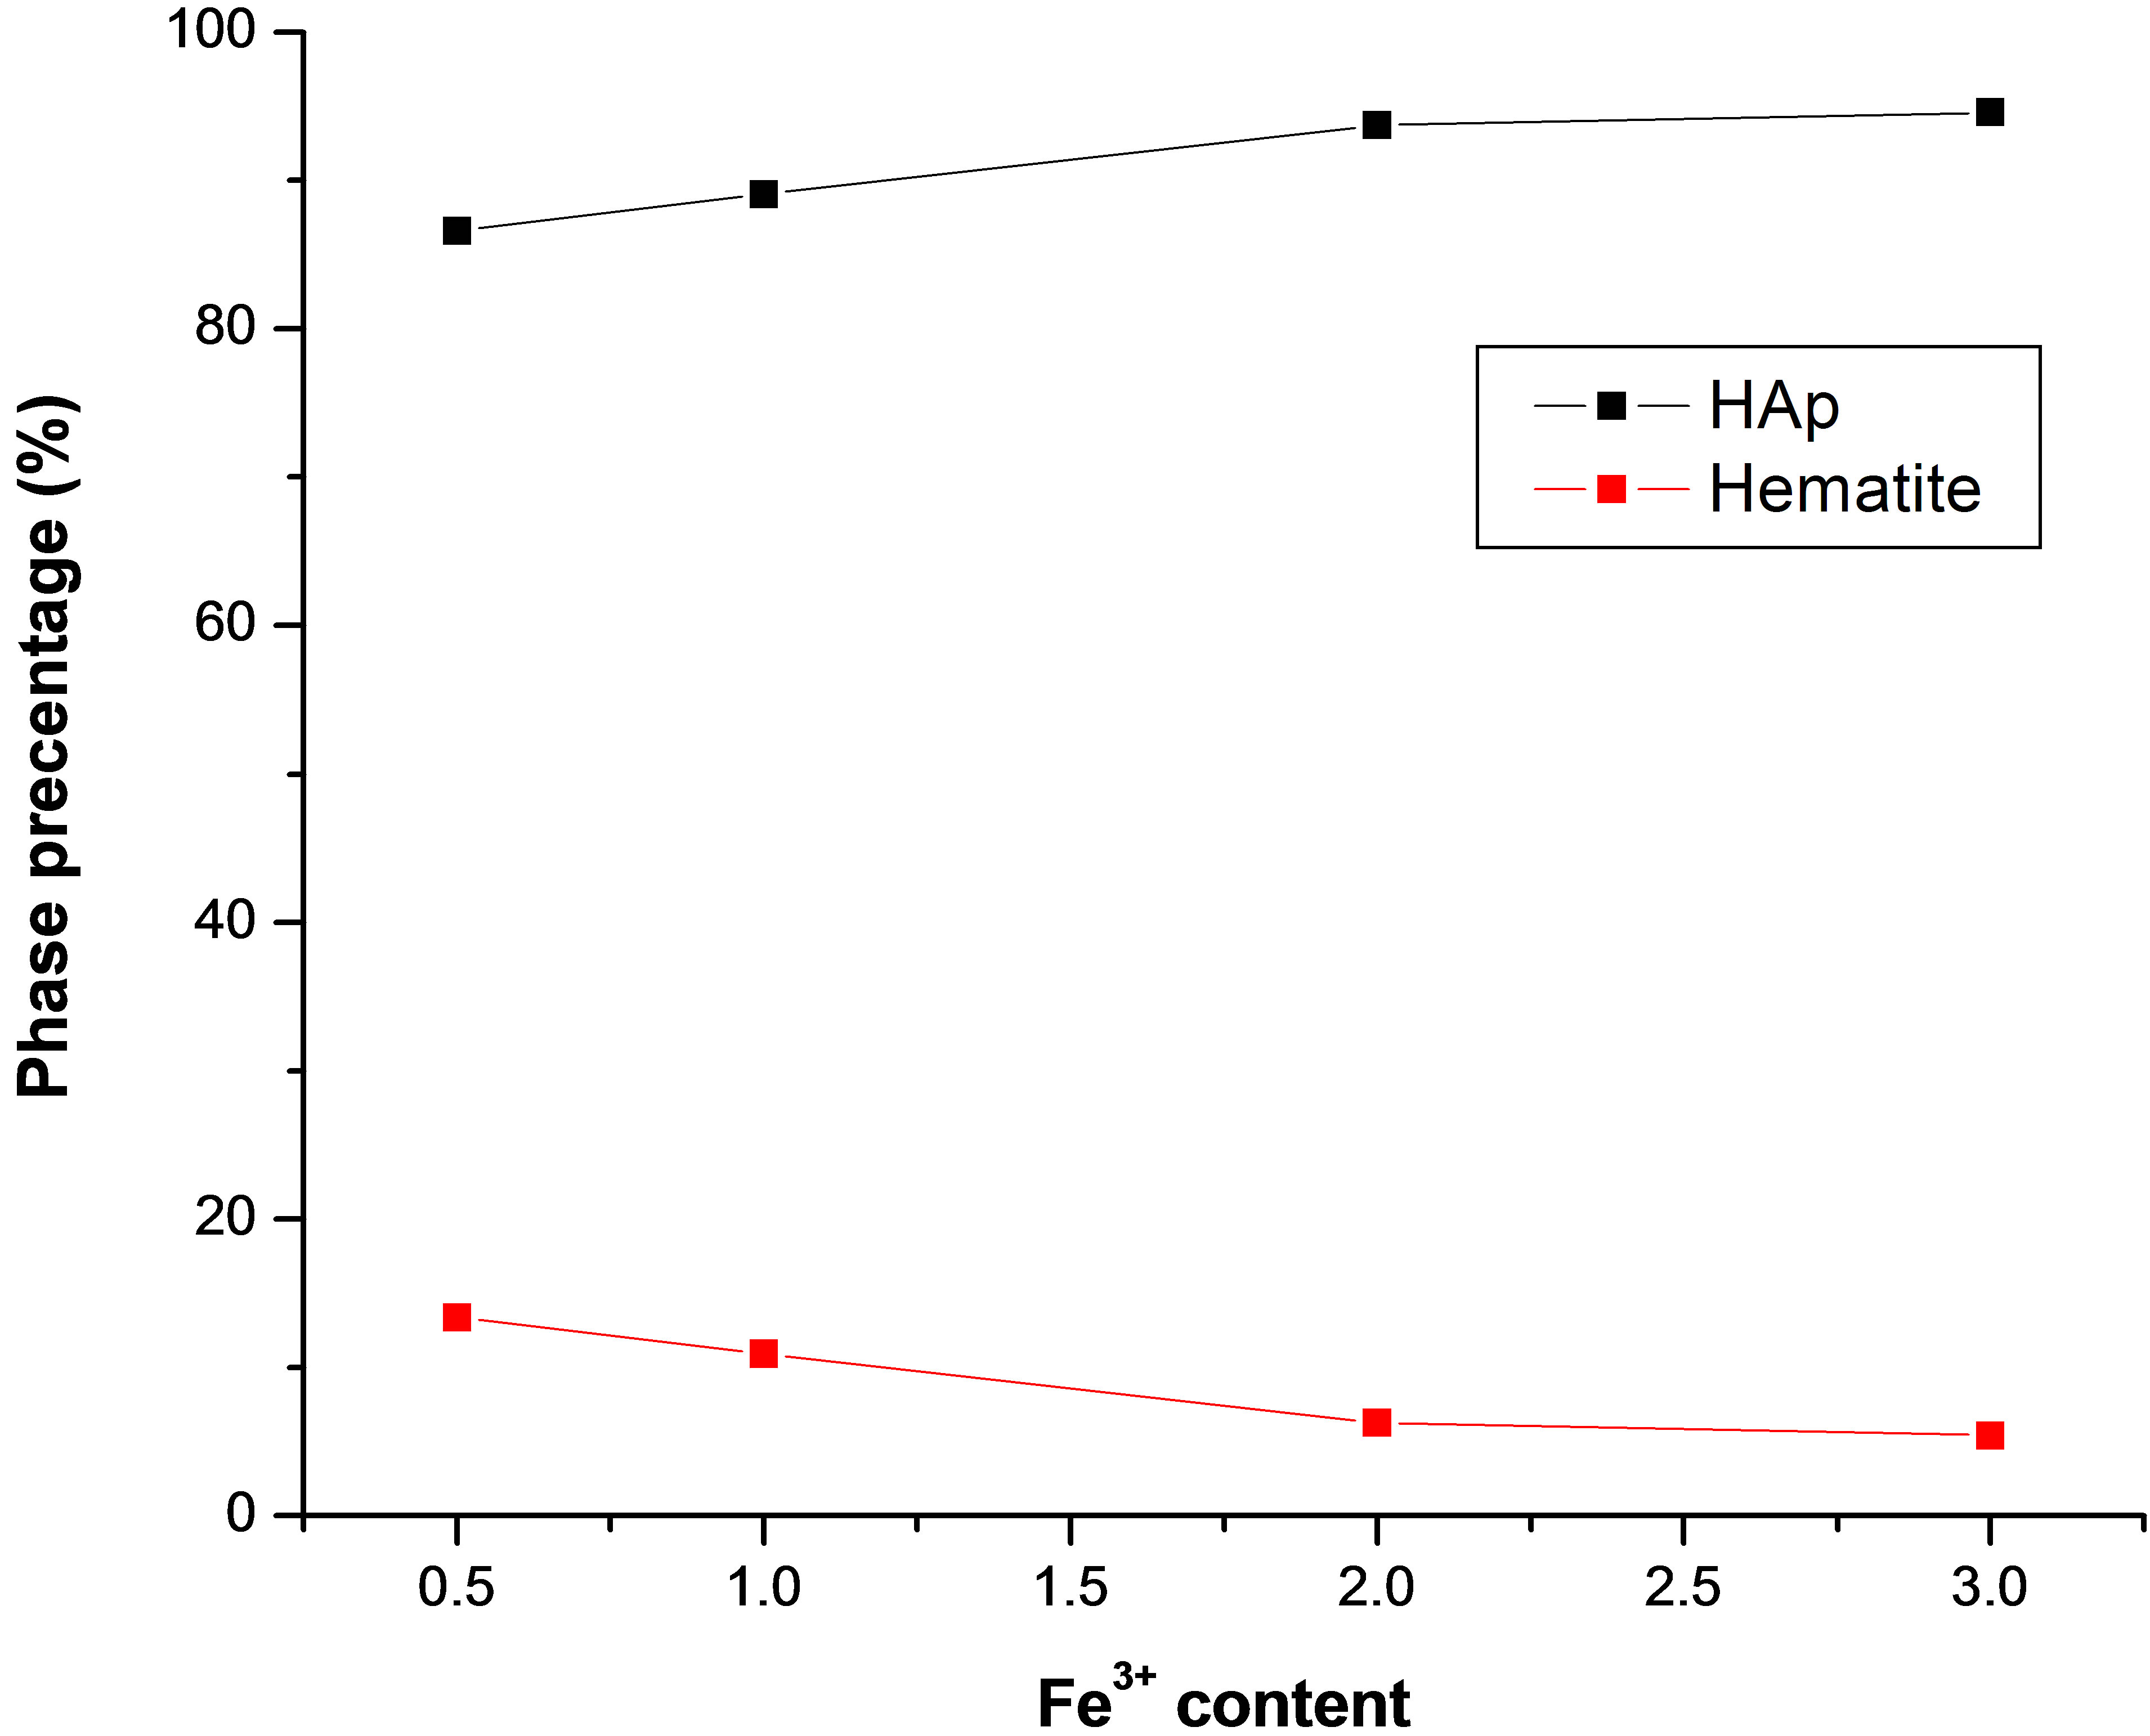
Figure 2. Phase percentage of hematite and HAp of the prepared samples after soaking in SBF as a function of iron content.
force between the sample surface and the cations dissolved in the solution. According to this Fe3+ ions which have three positive charges may be more effective in inducing an electric field than Ca2+ ions, which have two positive charges only. Thus after dissolution, most iron ions accumulated on the sample surface due to the electrostatic force between the negatively charged surface of samples and the positively charged iron ions and hence the more iron ions the more is the nucleation sites for HAp. These result was found in good agreement with the documented result [10,11]. This effect combined with the decrease in the probability of hematite formation.
Figure 3 represents the calculated lattice parameter of the studied samples after soaking in SBF for 28 days. The values of both a axis and unit cell volume of pure HAp are larger than that of all iron doped samples, while the value of c axis of HAp is smaller than that of all iron
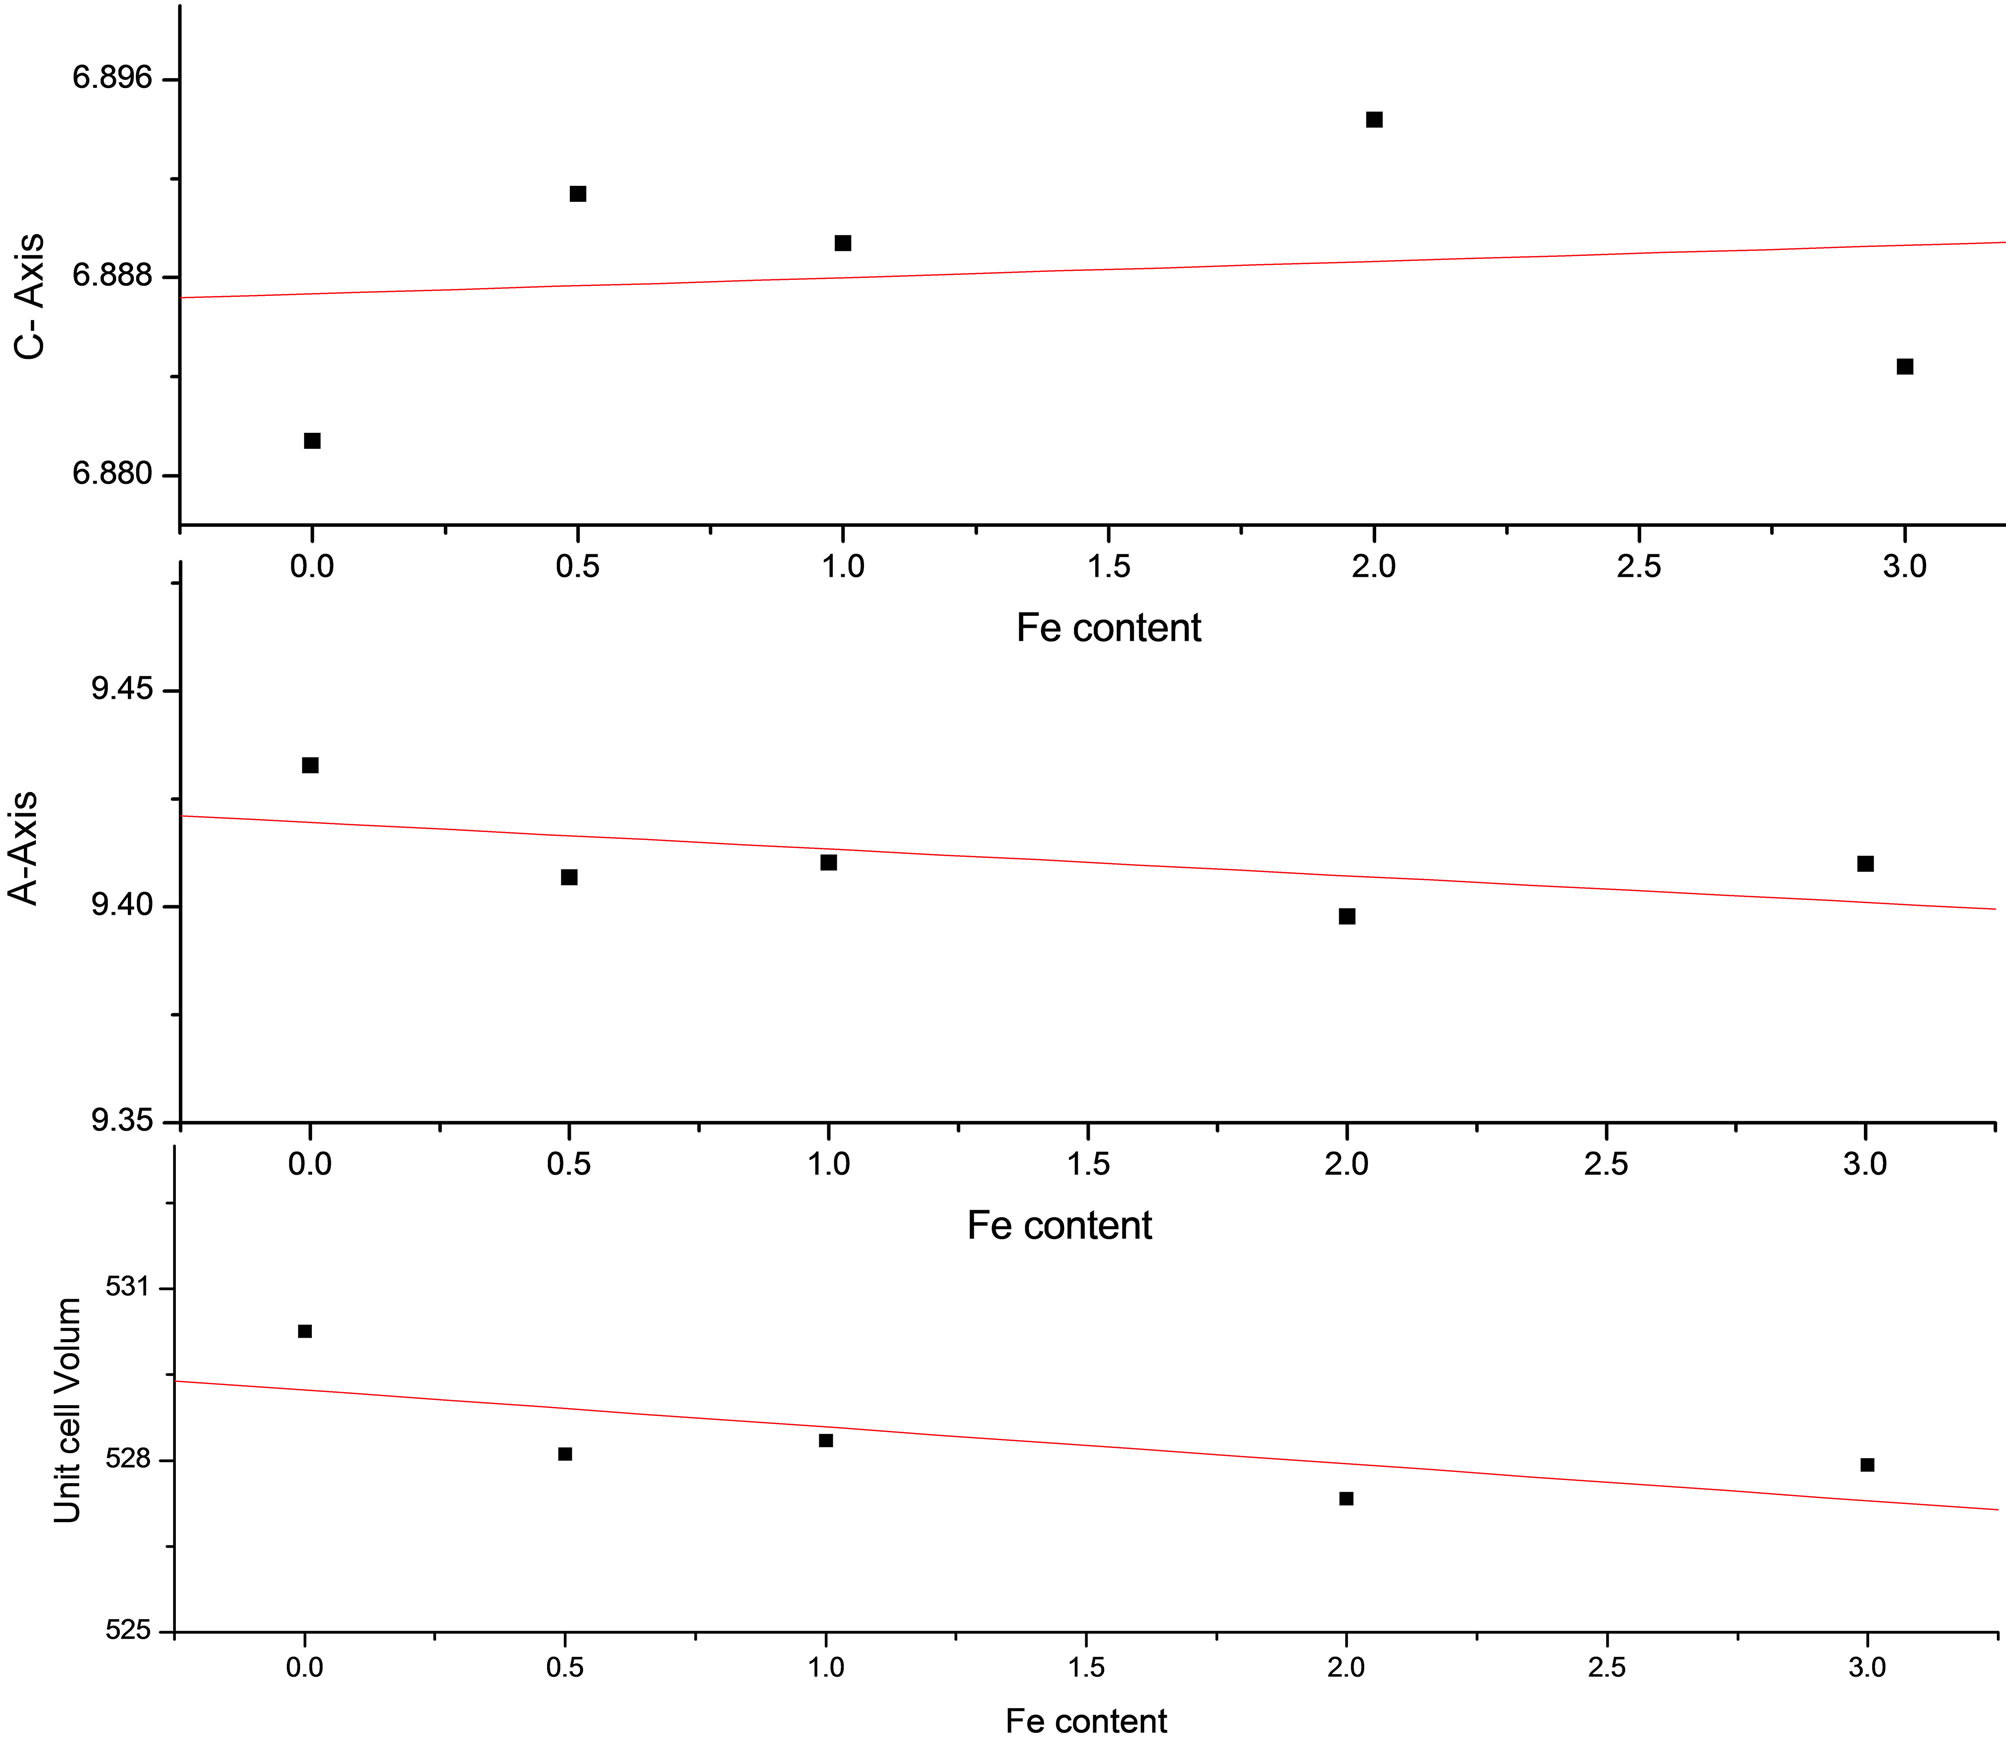
Figure 3. Lattice parameter of the soaked samples in SBF for 24 days.
doped samples. Also the values of both a axis and unit cell volume of iron doped samples tend to decrease with the gradual increase of iron content, while the value of c axis tend to increase with the increase of iron content. This may be attributed to the formation of carbonated HAp layer on the surface of the soaked samples, as its believed that the substitution of carbonate in the phosphate group sites (β-type) can cause an expansion in the unit cell length along the c axis and a contraction along the a axis. Conversely, when carbonate substitutes for the hydroxyl group (A-type) there is an expansion along the a axis and a contraction along the c axis [12]. Thus as we mentioned before that the probability of apatite layer in the samples surface enhanced by increasing iron content in the prepared samples, which can contributed to the increase the observed increase and decrease in the values of lattice parameter of the soaked samples.
The crystal size of the grown apatite layer in the surface of the soaked samples was calculated using sherrer’s equation and listed in Table 3. These values ranged from about 29.1 to 18.9 nm, where the largest value (29.1 nm) is due to pure HAp sample. As the iron content was gradually increased, the crystal size showed gradual decrease to reach its minimum value (18.89 nm) due to the sample FeHAp2, then the crystal size starts to increase again to reach (26.62 nm) due to the sample FeHAP4. These results suggested the formation of carbonate substituted HAp (CHAp) and the observed decrease in the values of the crystal size of the first two samples may be due to the substitution of carbonate in the phosphate sites (β- type) [9-12]. The increase in the values of the last two samples can be attributed to the substitution mechanism as the increase of carbonate content can lead to the replacement of phosphorus ion by more than one carbonate ion and hence enlarge the crystal size.
Table 3 represents the crystallinity of the soaked samples as calculated from XRD data. There are two observations from these data; the first one is the value of the crystallinity of the pure HAp sample, which is smaller than that of iron doped samples. This may be due to the presence of iron since it can enhance the crystallization and growth of HAp in the physiological conditions [10, 11].
The second observation is the gradual decrease in the crystallinity of all iron doped samples with the increase of iron content, except in the case of FeHAp3 sample which showed a remarkable decrease compared with the decrease of all iron doped samples. The observed gradual decrease may be due to the formation of carbonated substituted HAp which prevents the formation of more crystalline layers as well as to prevent the dissolution of ions from the soaked samples. This in turn tends to decrease the crystal growth also. These results were found to agree well with the documented results for carbonate substituted HAp [8-12]. The smallest crystal size value due to
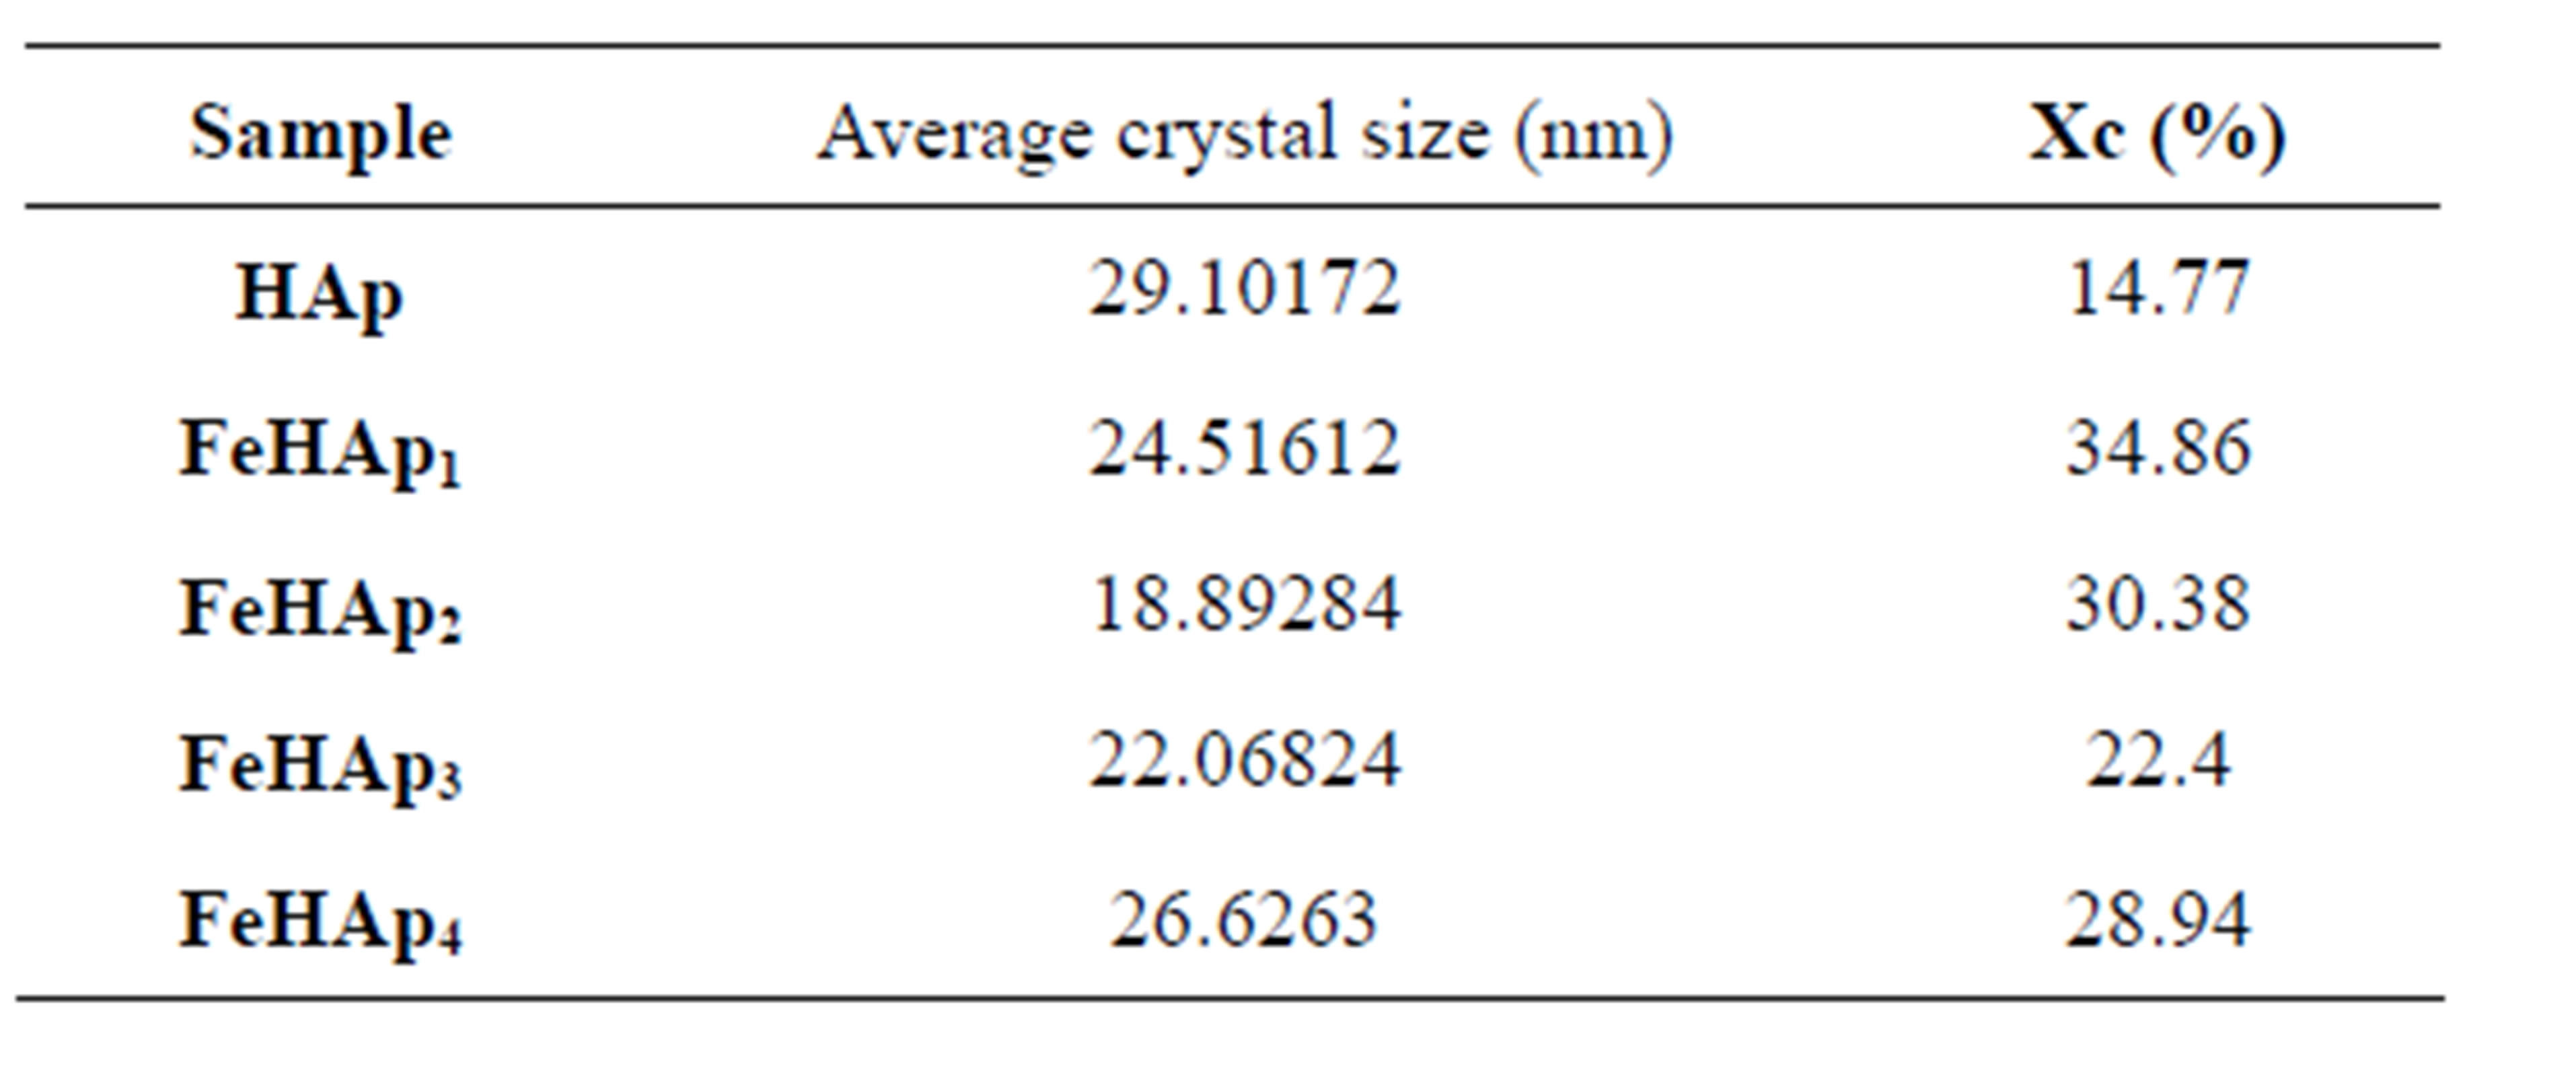
Table 3. The calculated crystal size and crystallinity of soaked samples.
the sample FeHAp3 can be attributed to the highest carbonate content in this sample compared with all iron doped samples as confirmed by IR result (see next section).
4.2. FTIR of the Immersed Samples
The IR spectra of the immersed samples for 24 days are shown in Figure 4. The phosphate group bands appear in all samples at ~962, 471, 1035 and 603, 566 for ν1, ν2, ν3, ν4 respectively. The broad band observed at ~ 1635 and ~3430 in all spectra indicate absorbed H2O in the lattice. Broad bands appear at wave numbers ~875, ~1423 and 1454 indicate that carbonate group partially replace the (PO4)3− group in HAp lattice, which was β- type carbonated HAp. The presence of hydrogen phosphate, such as HPO4 and H2PO4 adsorption band were not visible in all spectra. These results confirm the XRD result.
The formation of apatite layer appears clearly in all samples as all possess the fundamental functional groups of HAp. We can observe that the intensities of all peaks of pure HAp sample are small than that of all iron doped samples, which may be attributed to the increase in the crystallinity of iron doped samples compared with that of pure HAp sample as confirmed by XRD results. Also the intensity of carbonate, phosphate and hydroxyl groups increased and the peaks is sharper as the iron content increased. These results may be due to the precipitation of CHAp layer in the surface of the soaked samples, which increased with the increase of iron content [10, 11].
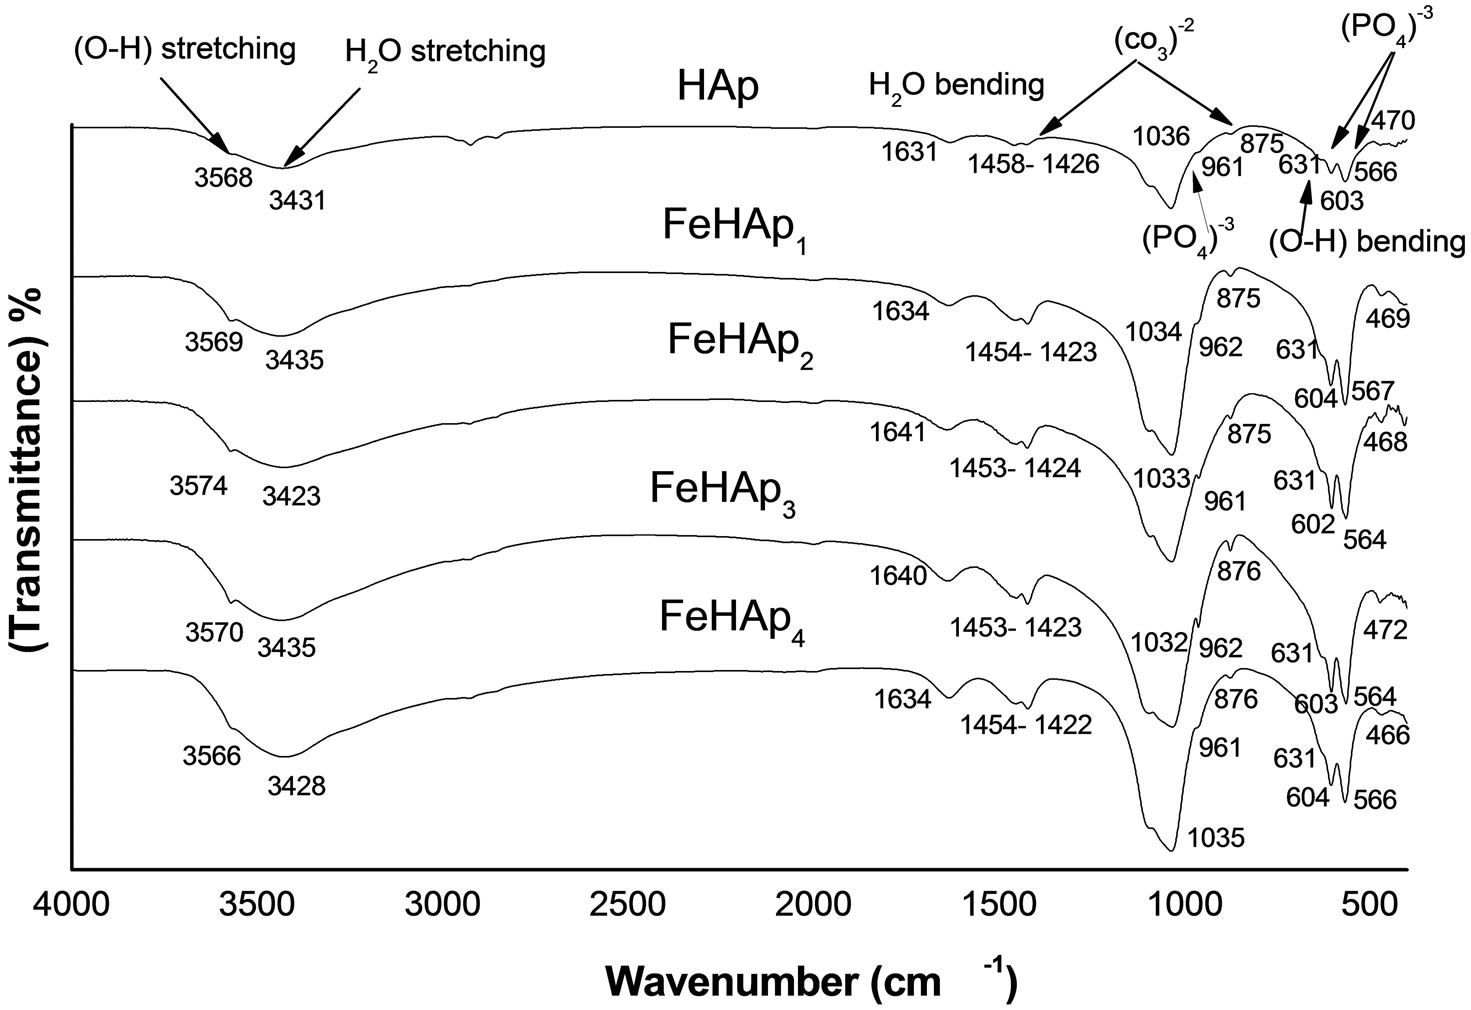
Figure 4. IR spectra of the immersed samples.
4.3. SEM of the Immersed Samples
The morphology of the immersed samples for 24 days in SBF as observed under SEM is presented in Figure 5. It can be observed that little amount of apatite formed on the surface of the pure HAp sample and agglomerated at the particle edges. These layers increases with the increase of iron content to include the whole sample surface, which suggested that iron, enhance the formation of HAp after soaking in SBF. These results confirm the results obtained from XRD and FTIR.
4.4. Solubility Measurement
Figure 6 shows the variation of pH versus time curves for all samples including the control sample, which didn’t have HAp. We can observe that the pH of samples decreased in the first 12 days, while it approximately constant during the remaining soaking period. That’s may be attributed to the alkaline effect of dissolved HAp content [13]. At the end of the interaction the solution saturated and then pH of the solution will stabilized. These results are in a good agreement with the documented result for
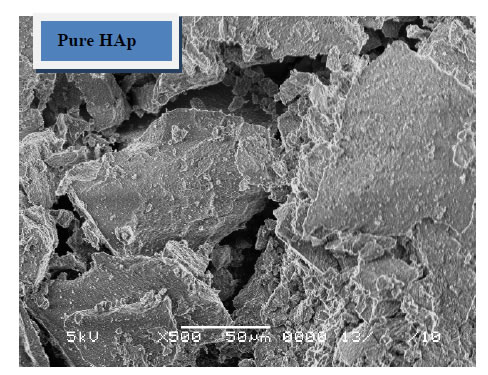
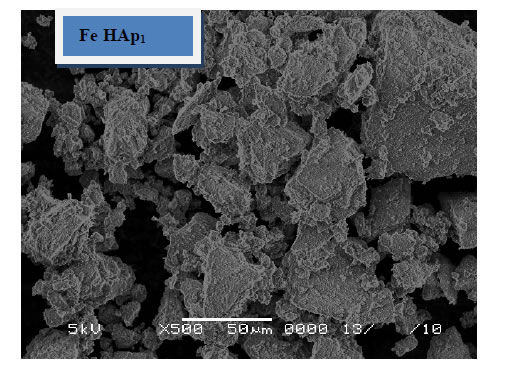
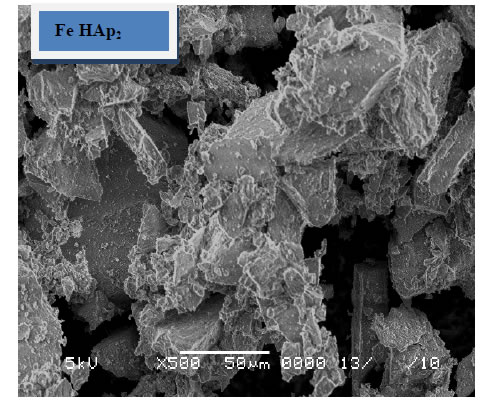
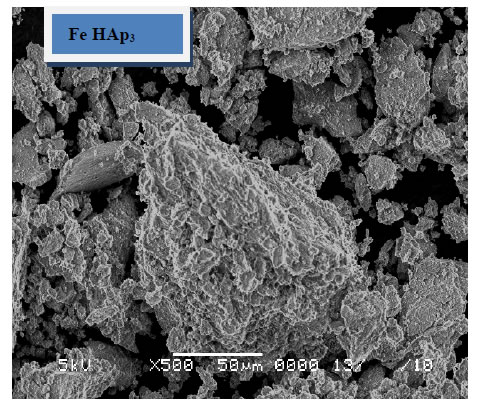
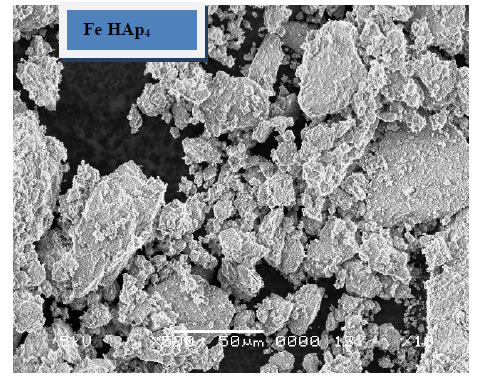
Figure 5. SEM of the immersed samples.
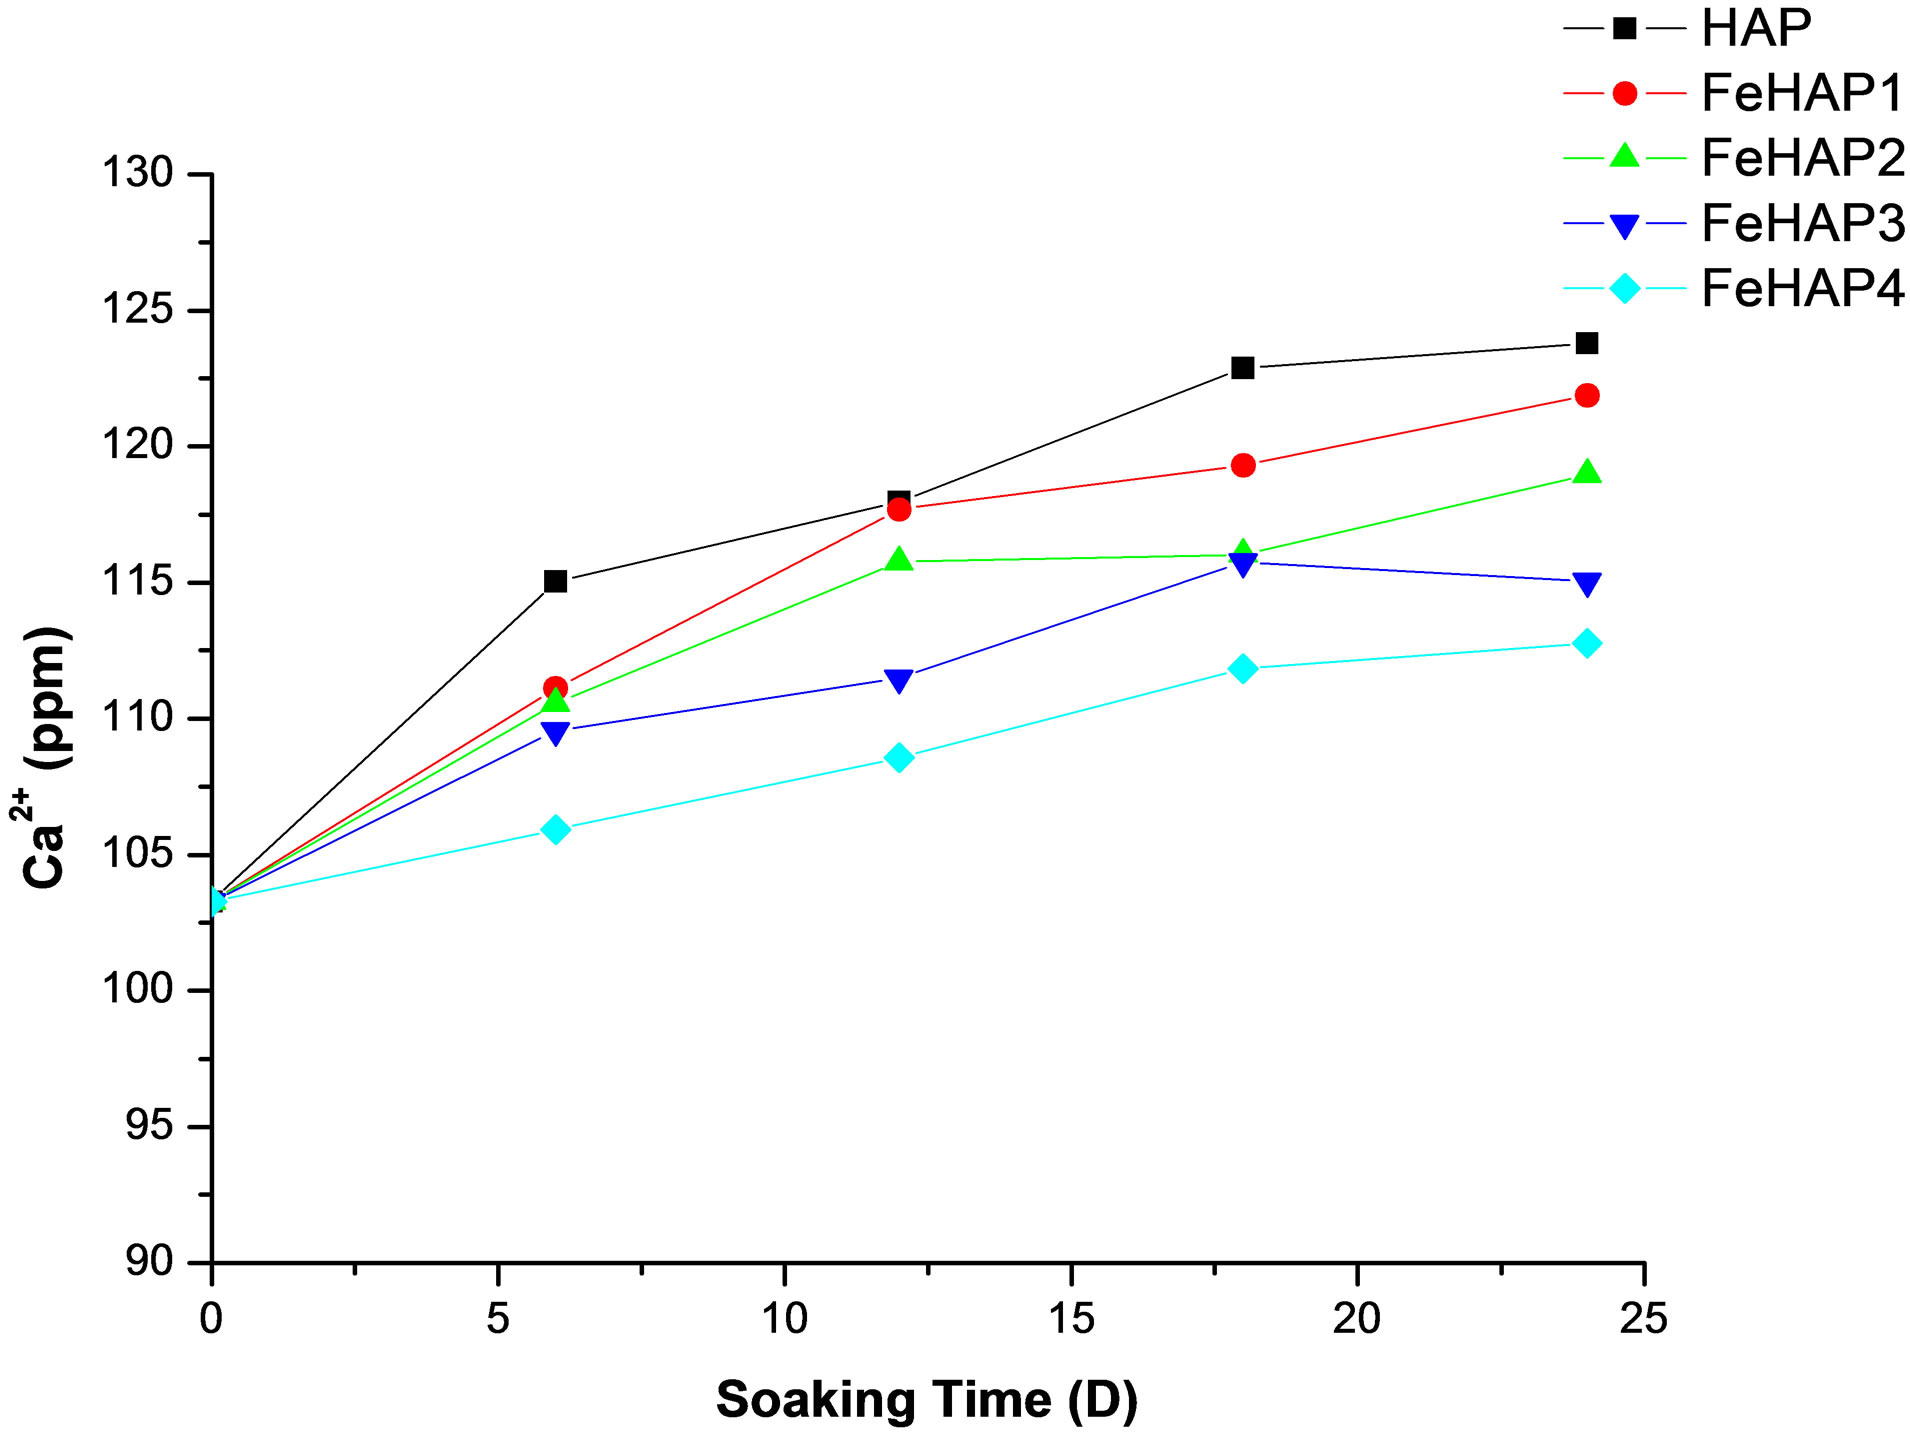
Figure 6. Chang of pH versus time of the immersed samples.
HAP [13-16]. According to these results and with the aid of XRD result, it may be suggested that the solubility of the prepared samples increased with the increase in the iron content.
4.5. Concentration of Released Ions
Figure 7 showed the concentration of calcium ions during the immersion time in SBF. The concentration of calcium ions in the original SBF is about 100 ppm [17]. The concentration of calcium ions in the prepared samples start with 103.27 ppm in the un-soaked SBF and increased with the increase of immersion time to reach 123.78, 121.86, 118.95, 115.03, 112.75 ppm for HAP, FeHAP1, FeHAP2, FeHAP3, FeHAP4 respectively. The increase in the Ca concentration may be attributed to the release of calcium from sample to the solution [17-19].
The concentration of calcium ions in FeHAp samples increase with the increase of immersion time, while it decreases with the increase of iron content. This may be to the increased CHAp in the surface of the samples as the iron content increased, which confirmed by XRD and IR results.
The original SBF contain about 30 ppm of phosphorus ions [17]. The concentration of phosphorus in the prepared samples start with 37.04 ppm in the un-soaked SBF and decreased with the increase of immersion time to reach 33.86, 32.01, 30.42, 29.36, 28.66 for HAP, FeHAP1, FeHAP2, FeHAP3, FeHAP4 respectively see Figure 8.
The decrease in the phosphorous concentration may be attributed to their uptake from the solution to the surface of the samples to form the apatite layer [17-19]. The decrease of both calcium and phosphorus ions in the solution of iron doped samples may be revels that the increase of apatite formation capability on the surface of iron doped samples. This may be due to the presence of iron in these samples as we mentioned before.

Figure 7. Concentration of calcium ions in SBF after 24 days of immersion.
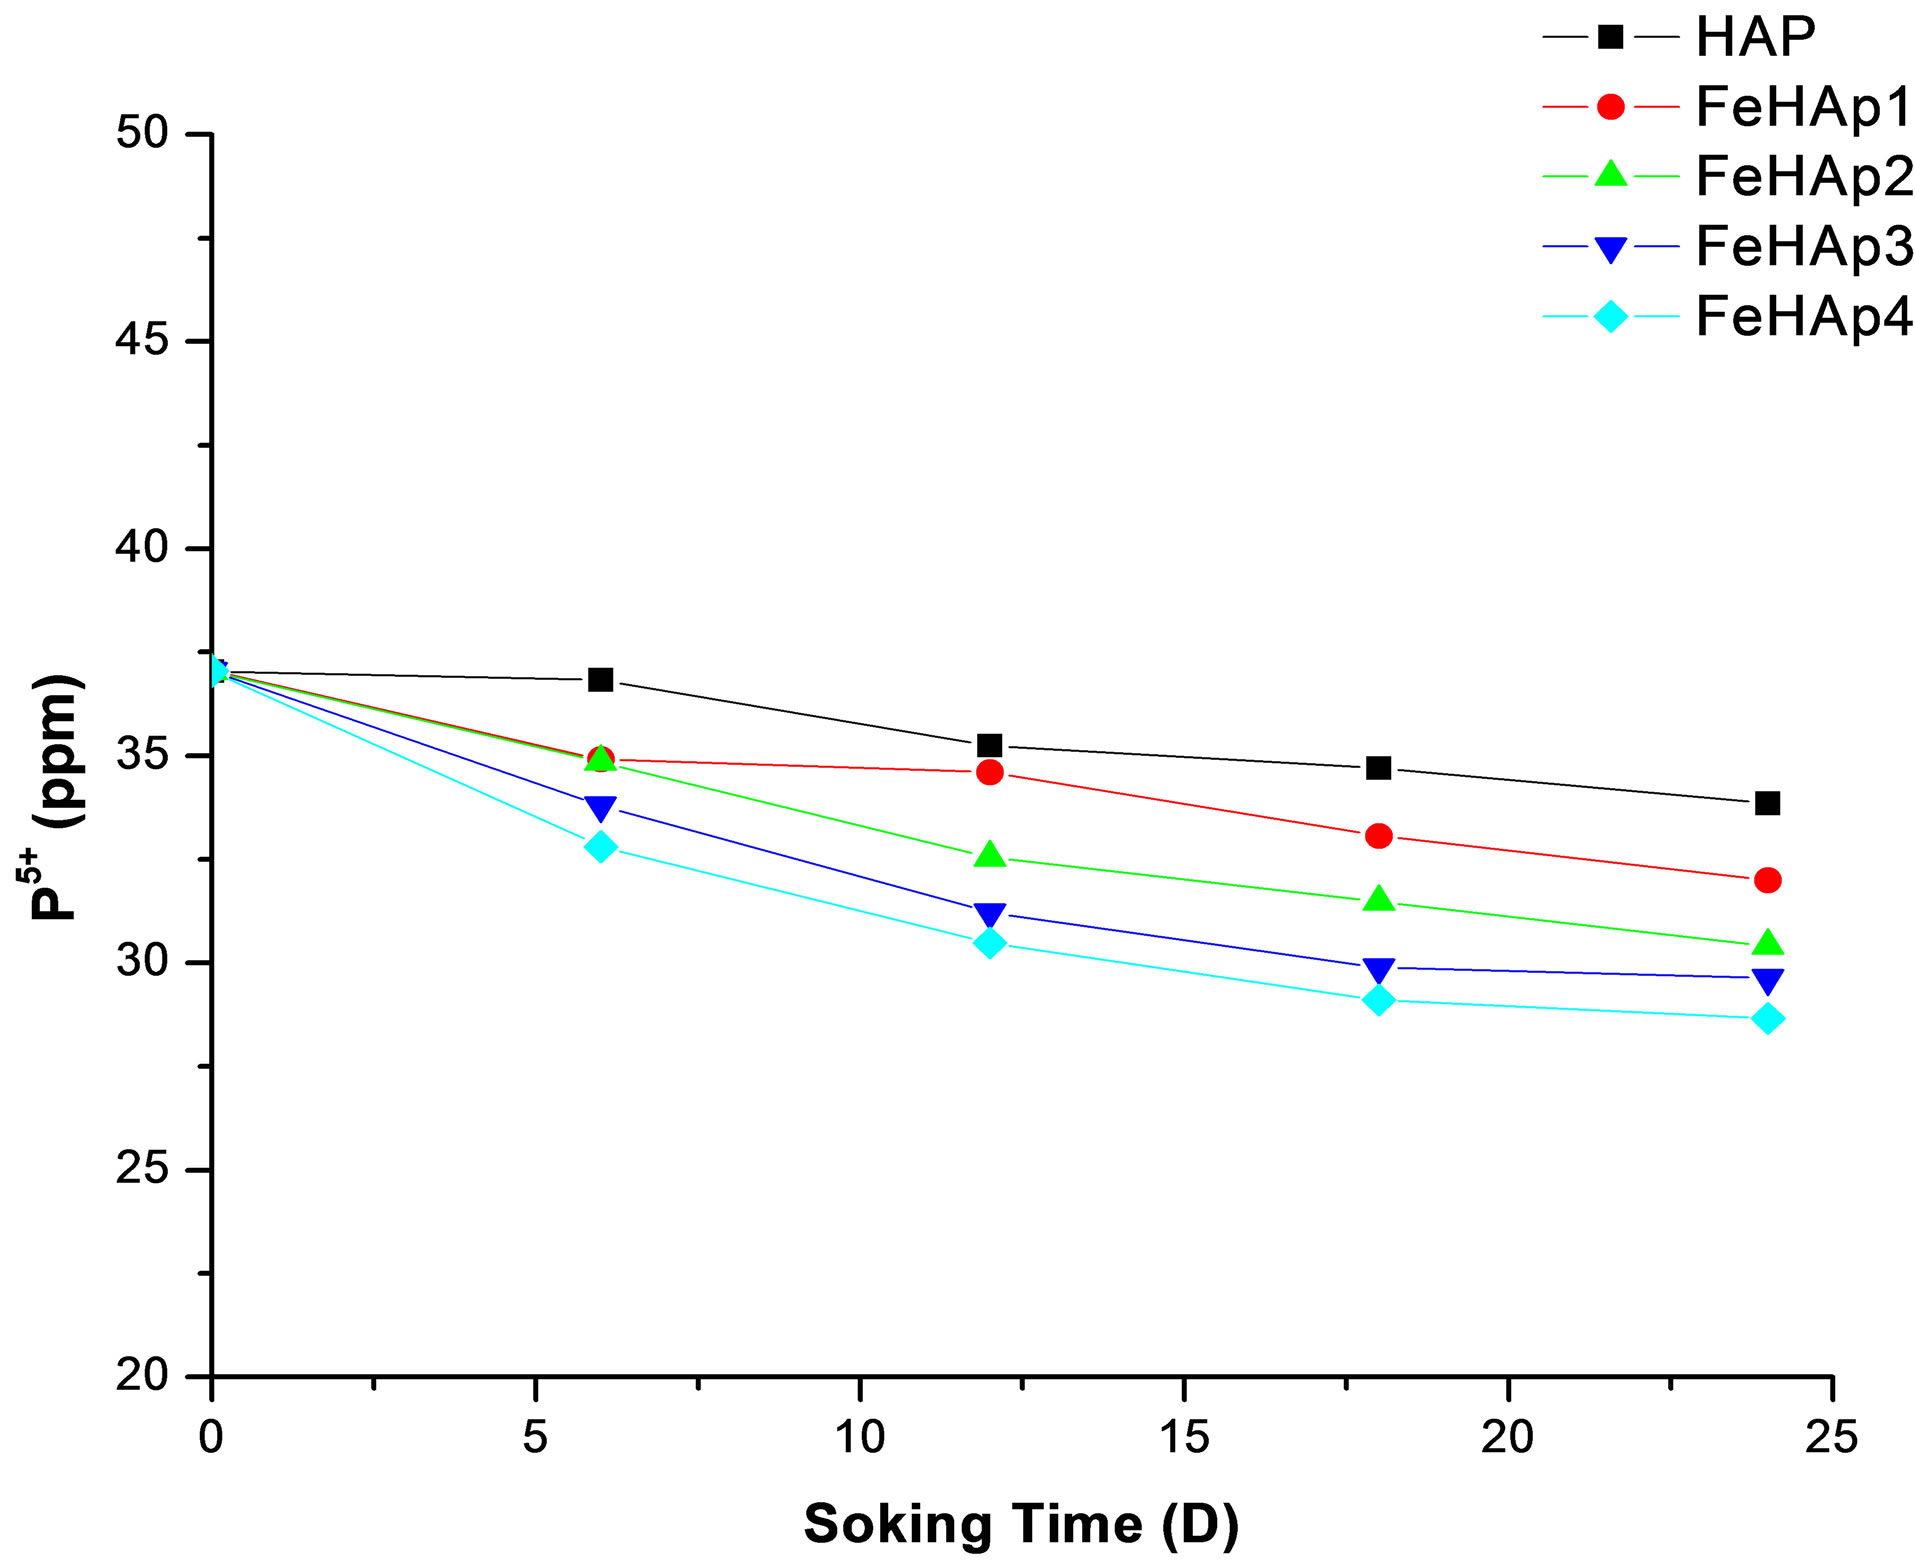
Figure 8. Concentration of phosphorus ions in SBF after 24 days of immersion.
Iron is a component of FeHAp, but SBF does not have this ions. Therefore, the presence of iron ions in the reacted solution is due to the leaching from the sample. Figure 9 represent the concentration of released iron ions during the immersion time for iron doped HAp. We can observe that the concentration of released iron decreased with the increase of immersion time. This may be attributed to the uses of iron ions as a nucleation sites for the formed apatite layer so the number of remnant ions in the solution decreased. Another interesting observation is the increase of the amount of released iron with the increase of iron content in samples. That decrease is attributed to the formation of hematite, which decreased with the increase of iron contents observed in XRD results.
5. CONCLUSION
The effect of iron on the bioactivity and solubility of
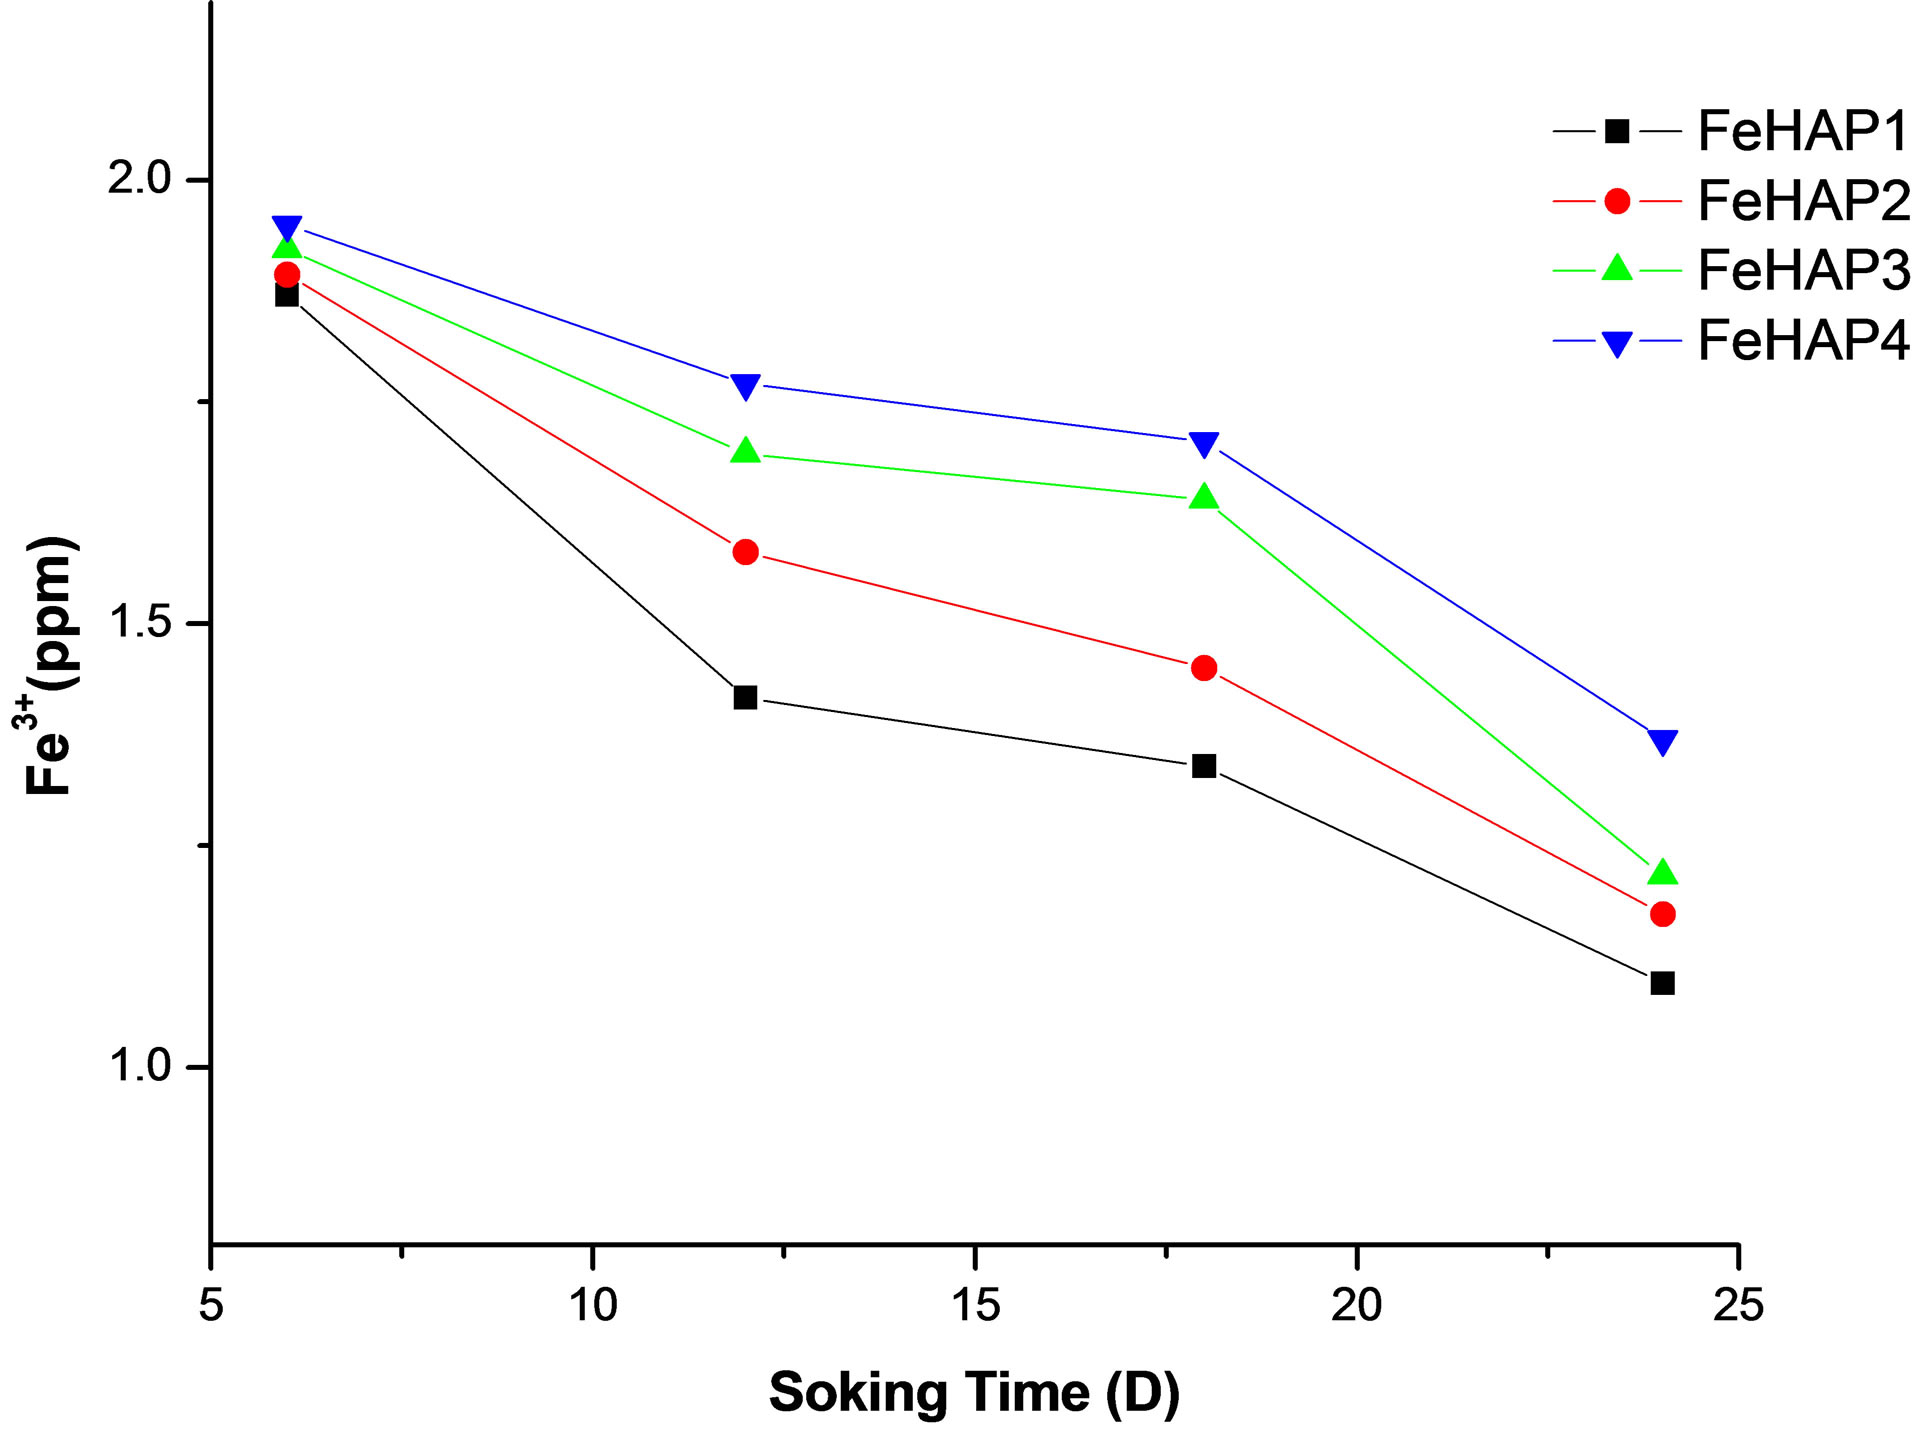
Figure 9. Concentration of released iron ions In SBF after 24 days of immersion.
HAp under the physiological conditions was investigated. The overall results showed that iron induced an electric field, which can enhance the nucleation and crystallization of HAp. The formed apatite layer increased with the increase of iron content. The solubility and dissolution rate of iron doped samples increased with the increase of iron content, which indicated that iron improved the bioactivity and solubility of HAp.
REFERENCES
- Weeraphat, P.-O. and Siwaporn, M. (2007) Incorporation of iron into nano hydroxyapatite particles synthesized by the microwave process. International Journal of Nanoscience, 6, 9. http://dx.doi.org/10.1142/S0219581X07004262
- Jeong, K.I., Kim, S.G., Moon, S.Y., Oh, J.S., Jo, J.H., Lim, H.S., Kim, J.S., Lim, S.C. and Jeong, M.A. (2012) Experimental study of osseointegration and stability of intentionally exposed hydroxyapatite coating implants. Journal of Korean Association of Maxillofacial Plastic and Reconstructive Surgeons, 1, 12-16.
- Kundu, B.. Soundrapandian, C., Nandi, S.K., Mukherjee, P., Dandapat, N., Roy, S., Datta, B.K., Mandal, T.K., Basu, D. and Bhattacharya, R.N. (2010) Development of new localized drug delivery system based on CeftriaxoneSulbactam composite drug impregnated porous hydroxyapatite: A systematic approach for in vitro and in vivo animal trial. Pharmaceutical Research, 27, 1659-1676.
- Kundu, B, Lemos, A., Soundrapandian, C., Sen, P.S., Datta, S., Ferreira, J.M.F. and Basu, D. (2010) Development of porous HAp and β-TCP scaffolds by starch consolidation with foaming method and drug-chitosan bilayered scaffold based drug delivery system. Journal of Materials Science: Materials in Medicine, 21, 2955-2969.
- Ducheyne, P. and Qiu, Q. (1999) Bioactive ceramics: The effect of surface reactivity on bone formation and bone cell function. Biomaterials, 20, 2287-2303. http://dx.doi.org/10.1016/S0142-9612(99)00181-7
- Capuccini, C., Torricelli, P., Sima, F., Boanini, E., Ristoscu, C., Bracci, B., Socol, G., Fini, M., Mihailescu, I.N. and Bigi, A. (2008) Strontium-substituted hydroxyapatite coatings synthesized by pulsed-laser deposition: In vitro osteoblast and osteoclast response. Acta Biomaterialia, 4, 1885-1893. http://dx.doi.org/10.1016/j.actbio.2008.05.005
- Xu, J.L. and Khor, K.A. (2007) Chemical analysis of silica doped hydroxyapatite biomaterials consolidated by a spark plasma sintering method. Journal of Inorganic Biochemistry, 101, 187-195. http://dx.doi.org/10.1016/j.jinorgbio.2006.09.030
- Li, Y., Chai, T.N. and Chui, P.O. (2009) Iron(III) and manganese(II) substituted hydroxyapatite nanoparticles: Characterization and cytotoxicity analysis. Journal of Physics: Conference Series, 187, 012024 http://dx.doi.org/10.1088/1742-6596/187/1/012024
- Wang, J.H., Toru Nonami and Kunio Yubata (2008) Syntheses, structures and photophysical properties of iron containing hydroxyapatite prepared by a modified pseudo-body solution. Journal of Materials Science: Materials in Medicine, 19, 2663-2667. http://dx.doi.org/10.1007/s10856-007-3365-2
- Tadashi, K. and Hiroaki, T. (2006) How useful is SBF in predicting in vivo bone bioactivity? Biomaterials, 27, 2907-2915. http://dx.doi.org/10.1016/j.biomaterials.2006.01.017
- Gross, K.A., Jackson, R., Cashion, J.D. and RodriguezLorenzo, L.M. (2002) Iron substituted apatites: A resorbable biomaterial with potential magnetic properties. European Cells and Materials, 3, 114.
- Zhu, P., Masuda, Y. and Koumoto, K. (2004) The effect of surface charge on hydroxyapatite nucleation. Biomaterials, 25, 3915-3921. http://dx.doi.org/10.1016/j.biomaterials.2003.10.022
- Guggenbuhl, P., Filmon, R., Mabilleau, G., Baslé, M.F. and Chappard, D. (2008) Iron inhibits hydroxyapatite crystal growth in vitro. Metabolism Clinical and Experimental, 57, 903.
- Anee, T.K., Palanichamy, M., Ashok, M., Meenakshi, Sundaram, N. and Narayana, K.S. (2004) Influence of iron and temperature on the crystallization of calcium phosphates at the physiological pH. Materials Letters, 58, 478.
- Borum-Nicholas, L. and Wilson, O.C. (2003) Surface modification of hydroxyapatite. Part I. Dodecyl alcohol. Biomaterials, 24, 3671-3679. http://dx.doi.org/10.1016/S0142-9612(03)00239-4
- Fathia, M.H., Hanifia, A. and Mortazavi, V. (2008) Preparation and bioactivity evaluation of bone like hydroxyapatite nanopowder. Journal of Materials Processing Technology, 202, 536.
- Sergio, B., Zambuzzi-Willian, F, Campos-Daniela, D.P., Ogeda, L., Thais, Ferreirab, C.V. and Bertran, C.A. (2010) Hydroxyapatite surface solubility and effect on cell adhesion. Colloids and Surfaces B: Biointerfaces, 78, 177.
- Fulmer, M.T., Ison, I.C., Hankermayer, C.R., Constantz, B.R. and John, R. (2002) Measurements of the solubility and dissolution rates of several hydroxyapatites. Biomaterials, 23, 751.
- Murugan, R. and Ramakrishna, S. (2006) Production of ultra-fine bioresorbable carbonated hydroxyapatite. Acta Biomaterialia, 2, 201-206. http://dx.doi.org/10.1016/j.actbio.2005.09.005
- De Aza, A.H., Vela’squez, P., Alemany, M.I., Pena, P. and De Aza, P.N. (2007) In situ bone-like apatite formation from a bioeutectic® ceramic in sbf dynamic flow. Journal of American Ceramic Society, 90, 1200-1206. http://dx.doi.org/10.1111/j.1551-2916.2007.01534.x
- Kim, C.Y. and Sang, S.J. (2003) Synthesis and dissolution behavior of β-TCP and HA/β-TCP composite powders. Journal of the European Ceramic Society, 23, 1803.
- Fathi, M.H. and Mohammadi, Z.E. (2009) Mechanical alloying synthesis and bioactivity evaluation of nanocrystalline fluoridated hydroxyapatite. Journal of Crystal Growth, 311, 1392-1403. http://dx.doi.org/10.1016/j.jcrysgro.2008.11.100
A LIST OF ABBREVIATIONS
| word | abbreviations |
| Hydroxyapatite | HAp |
| Iron doped hydroxyapatite (0.05% mol) | FeHAp1 |
| Iron doped hydroxyapatite (0.1% mol) | FeHAp2 |
| Iron doped hydroxyapatite (0.2% mol) | FeHAp3 |
| Iron doped hydroxyapatite (0.3% mol) | FeHAp4 |
| Stimulated body fluid | SBF |