Journal of Biophysical Chemistry
Vol.3 No.3(2012), Article ID:21939,6 pages DOI:10.4236/jbpc.2012.33025
Visualization of decreased docosahexaenoic acid in the hippocampus of rats fed an n – 3 fatty acid-deficient diet by imaging mass spectrometry
![]()
1Japan Advanced Institute of Science and Technology, Ishikawa, Japan
2Shimane University Haculty of Medicine, Shimane, Japan; *Corresponding Author: michio1@med.shimane-u.ac.jp
3Bruker Daltonics K.K., Kanagawa, Japan
Received 10 March 2012; revised 12 April 2012; accepted 7 May 2012
Keywords: Docosahexaenoic Acid; Imaging Mass Spectrometry; Fourier-Transform Ion Cyclotron Resonance Mass Spectrometry; Hippocampus
ABSTRACT
The present study employed an imaging mass spectrometry (IMS) method to evaluate the effect of dietary n – 3 fatty acids on the fatty acid composition in rat brain. Rats were divided into two groups and fed either an n – 3 fatty acid-deficient or adequate diet. We determined the decreased n – 3 fatty acids in the hippocampus of rats fed an n – 3 fatty acid-deficient diet compared to the control. IMS visualization was achieved at a resolution of 100 m in rat brain, and showed decreased docosahexaenoic acid (DHA)-containing phosphatidyl choline (PC) or phosphatidyl ethanolamine (PE) in the hippocampus of rats fed an n – 3 fatty acid-deficient diet.
1. INTRODUCTION
Docosahexaenoic acid (DHA, 22:6n – 3) is one of the n – 3 polyunsaturated fatty acids (PUFAs) has important role to our physiological activity. DHA is critical for cellular functioning, normal brain development, and memory and cognitive processes in animals and humans [1-4]. In aged animals, memory impairment is associated with reduced levels of cerebral DHA [5,6]. Moreover, loss of brain DHA content in patients with Alzheimer’s disease is accompanied by loss of memory and learning [7]. Further, a decrease in the level of serum DHA is correlated with cognitive impairment [8]. Escape latency is increased in n – 3 PUFA-deficient animals compared to control rats, suggesting that an n – 3 PUFA-deficient diet may affect the process of habituation, a simple form of learning [9]. DHA deficiency thus affects mostly the cortex and hippocampus, areas that mediate learning and memory. Previous reports revealed that dietary supplementation of DHA has been shown to improve the brain function and focused on the hippocampal area as the site of DHA accumulation [10,11]. If we visually indicate whether DHA-containing lipids concentrate in the hippocampus, the information helps us to reveal the effect of dietary supplementation of n – 3 PUFAs. Conventional staining methods required fluorescence or antibodies to visually reveal the localization of target molecules, whereas the use of two-dimensional mass spectrometry (MS) analysis of biomedical tissues, by means of what is known as imaging mass spectrometry (IMS), has become more commonplace for analyzing analyte distribution in several fields such as biology, medicine, pharmacology and agriculture. IMS has a potential for discovery of new biomarkers as well as common important target molecules. After two-dimensional MS measurements on sample section at regular interval, re-construction for target signals is given as an ion image. IMS enables simultaneous detection of multiple analytes even in the absence of target-specific markers such as antibodies (Figure 1) [12-14]. Here, we adopted three techniques in an effort to reveal the destination of DHA by feeding in the brain. To detect multiple molecules in raw tissue
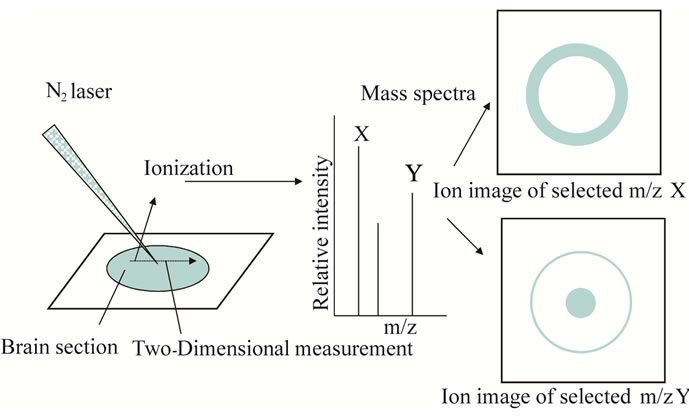
Figure 1. Schematic illustration of imaging mass spectrometry (IMS).
sections, 1) matrix-assisted laser desorption/ionization (MALDI) was used as a soft ionization technique, wherein a chemical matrix is used to assist the ionization of the molecules of interest [15,16]; 2) Fourier-transform ion cyclotron resonance (FT-ICR) mass spectrometry (MS) offers high resolution (R = 105 - 106) and accuracy (m = 10−4 - 10−3 u) [17-19]. Thus, we were able to classify the molecular species from exact mass (Me) without tandem mass spectrometry (MS/MS); 3) PUFA lipids were visualized at a resolution of 100 m in the rat brain by IMS. This is the first report to demonstrate decreased n – 3 PUFAs in the rat brain after intake of a PUFA-deficient diet as compared to normal diet.
2. MATERIALS AND METHODS
2.1. Animals
The rats were maintained and sacrificed in accordance with the procedures outlined in the Guidelines for Animal Experimentation of Shimane University (Shimane, Japan), compiled from the Guidelines for Animal Experimentation of the Japanese Association for Laboratory Animal Science. The animals were housed in a room under controlled temperature (23˚C ± 2˚C), relative humidity (50% ± 10%) and light-dark cycles (light: 08:00 to 20:00; dark: 20:00 to 08:00). Wistar rats (generation 0, G0) (Jcl: Wistar; Clea Japan Co., Tokyo, Japan) were housed in a room under controlled temperature (23˚C ± 2˚C), relative humidity (50% ± 10%), and light-dark cycle conditions, and were provided with either an n − 3 fatty acid-deficient pellet diet (F-1 group, F-1®; Funabashi Farm, Funabashi, Japan) or an n − 3 fatty acid-adequate pellet diet (MF group, MF; Oriental Yeast Co., Ltd., Osaka, Japan) with water ad libitum. The fatty acid composition of the F-1® and MF pellet diets is shown in Table 1" target="_self"> Table 1. Inbred second-generation male rats, raised with either F-1® or MF diet, were anaesthetized with sodium pentobarbital (65 mg·kg–1 BW, i.p.) and blood was drawn for plasma analysis (n = 15, 20-week old, respectively). The hippocampus was removed in 10 rats from each group, as previously described [11]. The tissues were stored at –80˚C by flash-freezing in liquid N2 until use. Whole brains of the remaining five rats from each group were removed and used in IMS analysis.
2.2. Determination of Fatty Acid Profile
The fatty acid composition of plasma and brain tissues was determined using a modification of the one-step reaction of Lepage and Roy [20] by gas chromatography (GC) as previously described [11]. Protein concentrations were estimated by the method of Lowry et al. [21].
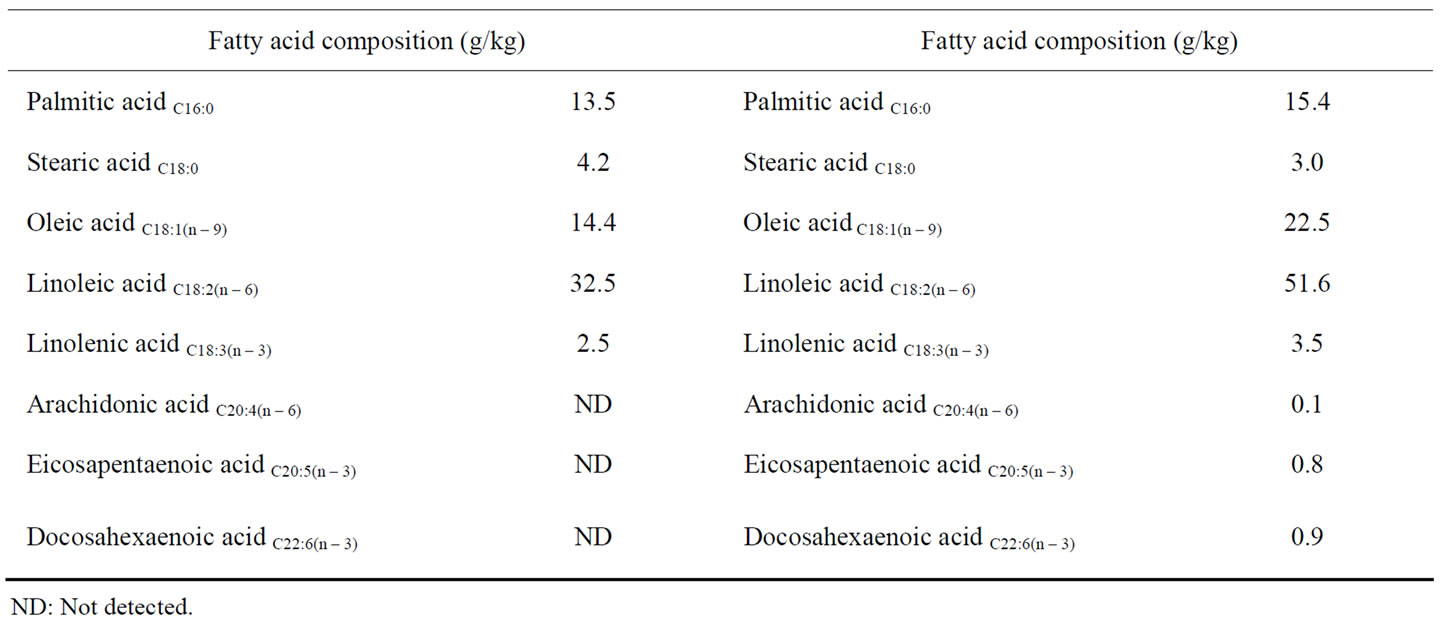
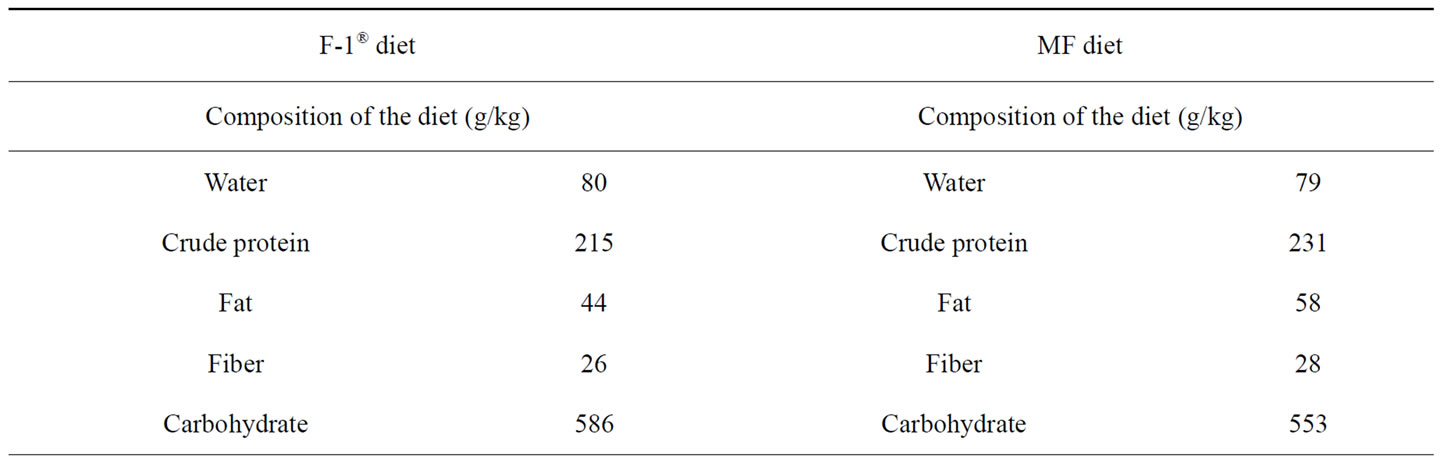
Table 1. Composition of the n − 3 fatty acid-deficient (F-1®) and -adequate pellet diets (MF).
2.3. IMS
The extirpated tissue samples were immediately frozen in powdered dry ice. Frozen cerebellar sections (10 m) were sliced at –16˚C using a cryostat (Leica, CM 3050) and were thaw-mounted on indium tin oxide (ITO)- coated glass slide for IMS, and non-coated glass slide for HE-staining. 2,5-dihydroxybenzoic acid (DHB) matrix solution (50 mg·mL–1 DHB, 70% methanol, and 0.1% trifluoroacetic acid) fluid was sprayed on cerebellar sections using an air brush (nozzle caliber, 0.2 mm). We scanned the sections and determined the laser spot area (2700 spots/measurement) with a spot-to-spot center distance of 100 m in each direction. A laser energy of 150 J was used in IMS. The tissue surface was irradiated with 100 laser shots using the positive ion detection mode (Bruker, Solalix as FT-ICR MS). To discriminate brain area, nuclear and cytoplasmic staining was performed using HE-staining. The glass-mounted sections were immersed in hematoxylin solution for 5 min and washed with tap water for 5 min. Next, sections were immersed in 80% ethanol (EtOH) and subsequently immersed in eosin solution for 1 min. After washing with tap water, the sections were immersed in a series of EtOH solutions (70%, 80%, 90% and 100%) to dehydrate. The labeled glass slide was mounted with a coverslip and Entellan reagent.
2.4. Statistical Analysis
Results are expressed as means ± SEM. Statistical evaluation of the data (Tables 2 and 3) was performed
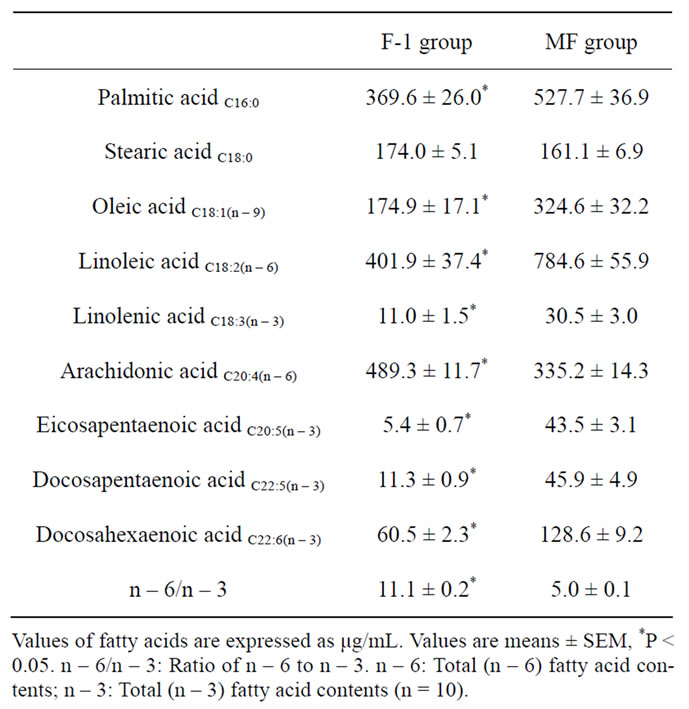
Table 2. Plasma fatty acid profiles in rats fed n – 3 fatty aciddeficient (F-1 group) and -adequate (MF group) diets.
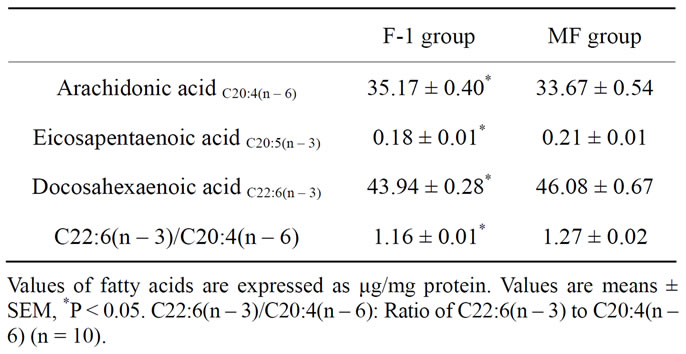
Table 3. Major fatty acid composition of hippocampus in rats fed n – 3 fatty acid-deficient (F-1 group) and -adequate (MF group) diets.
using unpaired Student’s t-test. StatView 4.01 (MindVision Software, Abacus Concepts, Inc., Berkeley, CA, USA) was used for statistical analyses. Statistical significance was set at P < 0.05.
3. RESULTS AND DISCUSSION
3.1. Plasma and Brain Fatty Acid Profiles
The plasma fatty acid composition of rats fed n – 3 fatty acid-deficient (F-1 group) and -adequate (MF group) diets is shown in Table 2. The plasma levels of palmitic, oleic, linoleic, linolenic, eicosapentaenoic, docosapen-taenoic acids and DHA were significantly lower in F-1-fed rats than in MF-fed rats, while the arachidonic acid (AA) level and the molar ratio of n – 6 to n – 3 fatty acids were significantly higher (P < 0.05) in F-1-fed rats than in MF-fed rats. The major fatty acid composition in the rat hippocampus is shown in Table 3. Long-term administration of n – 3 fatty acid-deficient diet significantly decreased the eicosapentaenoic acid and DHA contents and increased the AA content in the hippocampus of F-1-fed rats compared to MF-fed rats, resulting in a significant decrease in the ratio of DHA/AA in the hippocampus.
3.2. MS
Using rat brain sections, we investigated whether the MS system is applicable for raw biological samples. In the representative mass spectrum obtained for the tissue section sprayed with matrix solution, we detected various highresolution signals in an m/z range of 750 to 850 for lipids using FT-ICR MS. We focused on five exact masses obtained at m/z 762.5073, 766.5308, 786.5073, 790.5386, 804.5464 and 806.5699 from F-1 and MF (Figure 2). Owing to the high resolution, we were able to recognize isotope peaks and determine their molecular species from databases (Lipid search: http://metabo.umin.jp/index-English.htm and Lipid maps: http://www.lipidmaps.org/). The m/z 762.5073, 786.5073, 790.5386 and 806.5699 were identified as docosahexaenoic acid (DHA)-containing phosphatidyletha nolamine (PE) (1-acyl 16:1/22:6), PE (1-acyl 18:3/22:6),
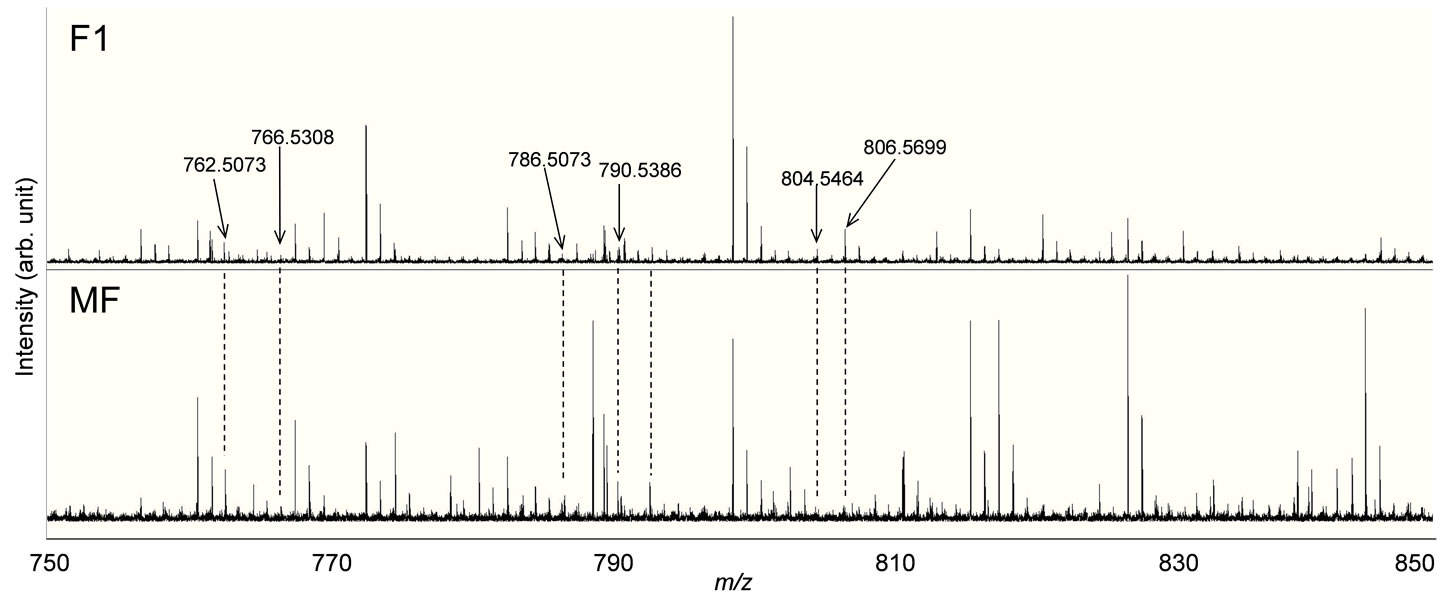
Figure 2. MALDI via DHB spectra of cryostat-prepared rat brain sections. The m/z 762.5073, 786.5073, 7905386 and 806.5699 correspond to DHA-containing lipids. The m/z 804.5464 and 766.5308 correspond to AAand EPA-containing lipids, respectively.
PE(1-acyl 18:1/22:6) and phosphatidylcholine (PC) (1- acyl 16:0/22:6), respectively. DHA preferentially binds to aminophospholipids in the cell membrane compared to other lipids. Interestingly, we were able to determine DHAcontaining PC lipid from m/z 806.5699, and this lipid was observed throughout the entire brain region in this time. For comparison, we also identified the m/z 766.5308 and 804.5464 as eicosapentaenoic acid (EPA)-containing PC(1-acyl 15:0/20:5) and arachidonic acid (AA)-containing PC(1-acyl 18:3/20:4), respectively.
3.3. IMS
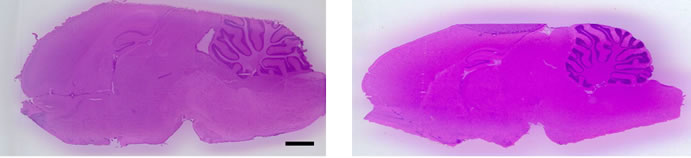
Next, we performed IMS using rat hippocampal sections. Successive brain sections were stained with HE observed. Optical images of the brain sections used for IMS were obtained, which indicated that the hippocampal regions were similar to those observed with HE staining. We visualized brain sections for five DHA-, one AAand one EPA-containing lipids and the red dashed line indicates the IMS region (Figure 3(b)). With respect to DHA, in both the F-1 and MF sections, distinct lipid distributions were revealed with ions at m/z 762.5073: PE(1-acyl 16:1/22:6), 786.5073: PE(1-acyl 18:3/22:6) as representative image data. With respect to m/z 762.5073: PE(1-acyl 16:1/22:6), the relevant lipid in both F-1 and MF was specifically detected to the hippocampus compared with other brain regions (Figure 3(c)). For m/z 786.5073: PE(1-acyl 18:3/22:6), the relevant lipids were observed not only in the hippocampus but also in the brain cortex (Figure 3(d)). These images also indicated that DHA-containing lipid was decreased in F-1 compared with that of MF. As a control, we imaged AAand EPA-containing lipids. The majority of AAs were distributed throughout the whole brain. The lipid with an ion at m/z 804.5464: PC(1-acyl 18:3/20:4) was barely exhibited higher levels in the MF hippocampus compared to that of the F-1 (Figure 3(e)). We were successful in imaging the EPA-containing lipid (Figure 3(f)). From these results, a semiquantitative analysis was performed by correlating the MS intensities and hippocampus region (Figure 4). For the DHA-containing lipids, a significant difference was detected between MS intensity in the F-1 and MF groups, respectively. The total ion count and the decreased ratio of both F-1 and MF were augmented with an increase in molecular weight. With respect to AAand EPA-containing no significant differences was detected between MF and F1, and its signal intensity was about 4 times lower than that of DHAcontaining lipid (PE(1-acyl 22:0/22:6)) (Figure 4). The signal intensity corresponding to DHA-containing lipids in the MF rat group was greater, and conversely, the intensity of AAand EPA-containing lipids was smaller, than that in F1, although the IMS data for AAand EPAcontaining lipids were not significantly different (Figure 4). We speculated that the AA- (m/z 804.5464) and EPA- (m/z 766.5308) containing lipids were present in smaller amounts in the hippocampus than DHA (Table 3). The ion intensity of the MS spectra also showed smaller ion intensity for AAand EPA-containing lipids than that of DHA (Figure 2). The IMS data were also based on MS spectra and, therefore, we detected distinct differences and imaged multi lipids at single measurement without antibody and fluorescent reagent.
4. CONCLUSION
The IMS technique is widely used in the localization of biological compounds. A decrease in hippocampal docosahexaenoic acid of rats fed a lipid-poor diet was
 (a)
(a) (b)
(b)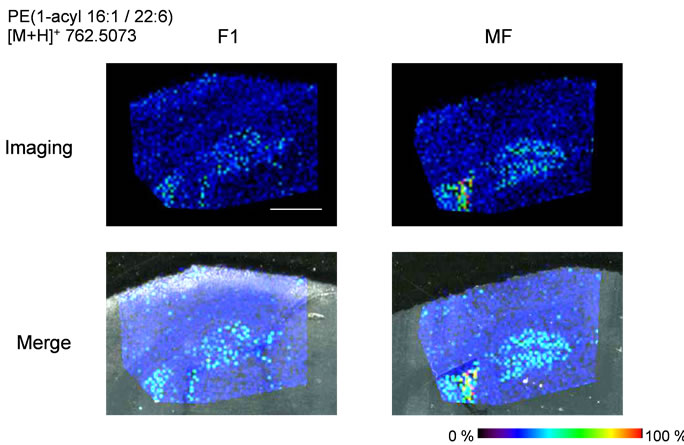 (c)
(c)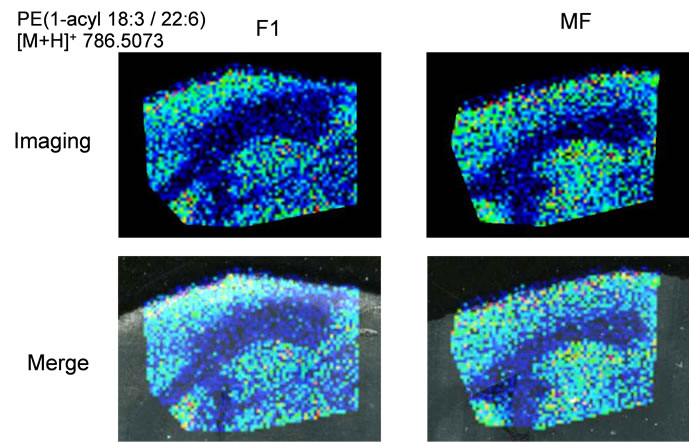 (d)
(d)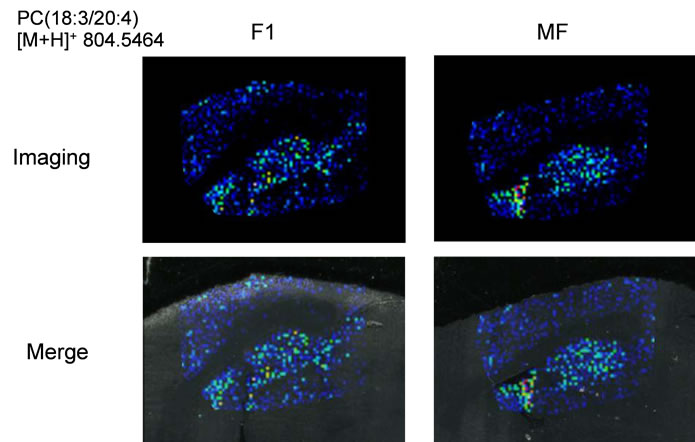 (e)
(e)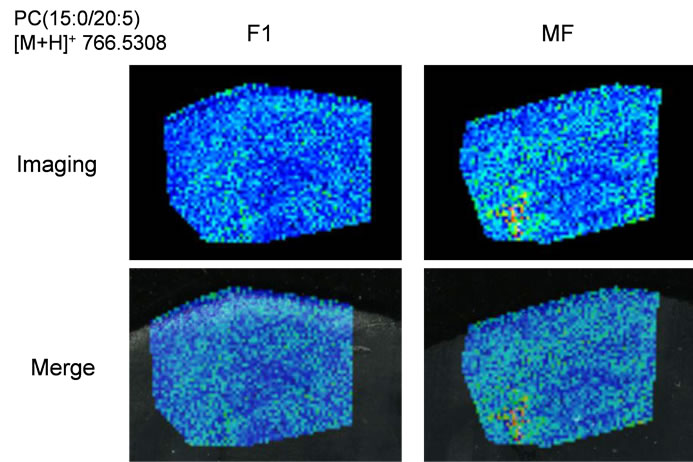 (f)
(f)
Figure 3. MALDI imaging of lipids in rat brain sections. (a) HE-stained rat brain tissue; and (b) Optical images of rat brain tissues. The red line indicated IMS region; (c)-(f) Obtained MS spectra reconstructed as ion images. The scale bar is 2 mm.
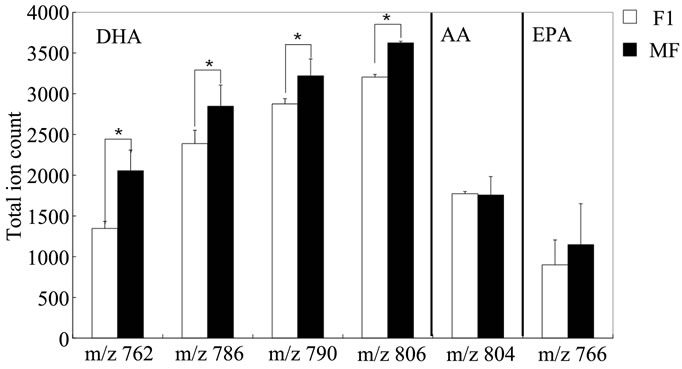
Figure 4. Semi-quantitative analysis of DHA-containing lipids using IMS. Total MS intensity in the brain of F-1- and MF-fed rats. MS intensities in the hippocampal regions were determined. Obtained values were commuted to per unit area. The values are expressed in terms of means ± SEM. *P < 0.05 with Student’s t-test. n = 5.
imaged using IMS. DHA was stored in the hippocampus as PCand PE-lipids and the amount of these lipids was affected by the composition of the diet. IMS was able to image DHA-containing lipids from one section without the use of antibodies and fluorescent reagents. We will investigate the distribution of additional PUFAs in future studies.
5. ACKNOWLEDGEMENTS
We thank Assistant Prof. M. Katakura, Prof. M. Takagi, Prof. K. Ebitani and Prof. Y. Takamura in JAIST and Dr. Y. Sahashi in Nitto Denko Co. for providing technical assistance and advice. This research was supported by a WAKATE-B (#23710124) grant from the Japan Society for the Promotion of Science to S. T. and a Grant-in-Aid for Scientific Research (C) from the Ministry of Education, Culture, Sports, Science and Technology, Japan (2350841, M.H.).
REFERENCES
- Crawford, M.A. (1990) Ups. Journal of Medical Sciences, 48, 43-78.
- Denys, A., Hichami, A., Maume, B. and Khan, N.A. (2001) Docosahexaenoic acid modulates phorbol ester induced activation of extracellular signal-regulated kinases 1 and 2 in NIH/3T3 cells. Lipids, 36, 813-818. doi:10.1007/s11745-001-0789-2
- Wainwright, P.E., Huang, Y.S., Coscina, D.V., Levesque, S. and McCutcheon, D. (1994) Brain and behavioral effects of dietary n − 3 deficiency in mice: A three generational study. Developmental Psychobiology, 27, 467-487. doi:10.1002/dev.420270705
- Calderon, F. and Kim, H.Y. (2004) Docosahexaenoic acid promotes neurite growth in hippocampal neurons. Journal of Neurochemistry, 90, 979-988. doi:10.1111/j.1471-4159.2004.02520.xJNC2520
- Favrelere, S., Stadelmann-Ingrand, S., Huguet, F., De Javel, D., Piriou, A., Tallineau, C. and Durand, G. (2000) Age-related changes in ethanolamine glycerolphospholipid fatty acid levels in rat frontal cortex and hippocampus. Neurobiology of Aging, 21, 653-660.
- Delion, S., Chalon, S., Guilloteau, D., Besnard, J.C. and Durand, G. (1996) α-linolenic acid dietary deficiency alters age-related changes of dopaminergic and serotoninergic neurotransmission in the rat frontal cortex. Journal of Neurochemistry, 66, 1582-1591. doi:10.1046/j.1471-4159.1996.66041582.x
- Soderberg, M., Edlund, C., Kristensson, K. and Dallner, G. (1991) Fatty acid composition of brain phospholipids in aging and in Alzheimer’s disease. Lipids, 26, 421-425. doi:10.1007/BF02536067
- Suzuki, H., Park, S. J., Tamura, M. and Ando, S. (1998) Effect of the long-term feeding of dietary lipids on the learning ability, fatty acid composition of brain stem phospholipids and synaptic membrane fluidity in adult mice: a comparison of sardine oil diet with palm oil diet. Mechanisms of Ageing and Development, 101, 119-128.
- Moriguchi, T., Greiner, R.S. and Salem Jr., N. (2000) Behavioral deficits associated with dietary induction of decreased brain docosahexaenoic acid concentration. Journal of Neurochemistry, 75, 2563-2573. doi:10.1385/JMN:16:2-3:299
- Gamoh, S., Hashimoto, M., Sugioka, K., Shahdat Hossain, M., Hata, N., Misawa, Y. and Masumura, S. (1999) Chronic administration of docosahexaenoic acid improves reference memory-related learning ability in young rats. Neuroscience, 93, 237-241.
- Hashimoto, M., Tanabe, Y., Fujii, Y., Kikuta, T., Shibata, H. and Shido, O. (2005) Chronic administration of docosahexaenoic acid ameliorates the impairment of spatial cognition learning ability in amyloid beta-infused rats. Journal of Nutrition, 135, 549-555.
- Taira, S., Sugiura, Y., Moritake, S., Shimma, S., Ichiyanagi, Y. and Setou, M. (2008) Nanoparticle-assisted laser desorption/ionization based mass imaging with cellular resolution. Analytical Chemistry, 80, 4761-4766. doi:10.1021/ac800081z
- Stoeckli, M., Chaurand, P., Hallahan, D. E. and Caprioli, R. M. (2001) Imaging mass spectrometry: A new technology for the analysis of protein expression in mammalian tissues. Nature Medicine, 7, 493-496. doi:10.1038/8657386573
- Taira, S., Ikeda, R., Yokota, N., Osaka, I., Sakamoto, M., Kato, M. and Sahashi, Y. (2010) Mass spectrometric imaging of ginsenosides localization in Panax ginseng root. The American Journal of Chinese Medicine, 38, 485-493.
- Nielsen, M.L., Bennett, K.L., Larsen, B., Moniatte, M. and Mann, M. (2002) Peptide end sequencing by orthogonal MALDI tandem mass spectrometry. Journal of Proteome Research, 1, 63-71. doi:10.1021/pr0155174
- Tanaka, K., Ido, Y., Akita, S., Yoshida, Y. and Yoshida, T. (1987) Detection of high mass molecules by laser desorption time-of-flight mass spectrometry. Proceedings of the 2nd Japan-China Joint Symposium on Mass spectrometry, 185-187.
- Budzikiewicz, H. (2005) J.H. gross: Mass spectrometry. A textbook. Analytical and Bioanalytical Chemistry, 381, 1319-1320. doi:10.1007/s00216-004-3039-6
- Walk, T.B., Trautwein, A.W., Richter, H. and Jung, G. (1999) ESI fourier transform ion cyclotron resonance mass spectrometry (ESI-FT-ICR-MS): A rapid high-resolution analytical method for combinatorial compound libraries. Angewandte Chemie International Edition, 38, 1763-1765. doi:10.1002/(SICI)1521-3773(19990614)38:12<1763::AID-ANIE1763>3.0.CO;2-#
- Asamoto, B. (1991) FT-ICR/MS.
- Lepage, G. and Roy, C.C. (1986) Direct transesterification of all classes of lipids in a one-step reaction. The Journal of Lipid Research, 27, 114-120.
- Lowry, O.H., Rosebrough, N.J., Farr, A.L. and Randall, R.J. (1951) Protein measurement with the Folin phenol reagent. The Journal of Biological Chemistry, 193, 265- 275.