Psychology
Vol.5 No.5(2014), Article ID:44615,12 pages DOI:10.4236/psych.2014.55043
Which Working Memory Components Predict Fluid Intelligence: The Roles of Attention Control and Active Buffer Capacity
Adam Chuderski
Institute of Philosophy, Jagiellonian University in Krakow, Krakow, Poland
Email: adam.chuderski@uj.edu.pl
Copyright © 2014 by author and Scientific Research Publishing Inc.
This work is licensed under the Creative Commons Attribution International License (CC BY).
http://creativecommons.org/licenses/by/4.0/


Received 25 January 2014; revised 27 February 2014; accepted 21 March 2014
ABSTRACT
This study tested which of two crucial mechanisms of working memory (WM): attention control, consisting of focusing attention on the proper task-set as well as blocking distraction, and the active buffer capacity, related to the number of chunks that can be actively maintained, plays a more important role in WM’s contribution to fluid intelligence. In the first study, the antisaccade task was used, the standard measure of attention control, in a modified variant which resulted in scores less sensitive to individual differences in the active buffer capacity, in comparison to the standard variant. In effect, attention control became a weak predictor of Gf, explaining less than one third of its variance accounted for by the capacity. In the second study, a variant of another attention control test, the Stroop task, was applied, which minimized the load on capacity, and no significant contribution of this task to Gf was found. Thus, when contribution of control and capacity were unconfounded, attention control mechanisms of WM contributed to fluid intelligence to a lesser extent than did the mechanisms related to the active buffer of WM.
Keywords
Working Memory, Fluid Intelligence, Attention Control, Storage Capacity

1. Introduction
For over thirty years, significant correlations between attention, working memory (WM), and higher-level cognition have been found (Daneman & Carpenter, 1980; Hunt, 1980; Kyllonen & Christal, 1990). This data have inspired researchers to identify various WM mechanisms presumably underlying general fluid intelligence (Gf, fluid ability, fluid reasoning, reasoning ability). Recently, two such theories have gained considerable influence in WM and Gf literature. The executive-attention theory explains differences in reasoning in terms of attention control capability, predicting that the advantage of more intelligent people stems from their better focus on relevant information as well as from their more effective blocking of distraction in WM operation (Engle & Kane, 2004; Kane & Engle, 2002). The competing storage-capacity theory assumes that more successful reasoning relies on the larger scope or size or capacity of the active buffer of WM (often called short-term memory buffer; STM), which is defined as the number of items (Cowan, 2001) or items’ bindings (Oberauer, Süß, Wilhelm, & Sander, 2007) that one can actively and accessibly maintain in parallel within WM.
Both approaches to Gf agree that active maintenance of information for the purpose of ongoing processing (i.e., WM) is crucial for effective fluid reasoning. What distinguishes the executive-attention approach is the belief that WM and reasoning depend on the quality (e.g., strength, task relevance, etc.) of maintenance of information (be it a current goal, an S-R mapping, a target item, or a key context), which is crucial under conditions of interference and response competition, but that these abilities are not related to the quantity of actively maintained chunks. Moreover, it is important for the executive-attention theory that the effective focusing of attention requires also the successful blocking of distractors (e.g., irrelevant stimuli or response tendencies), in order to prevent inevitable attentional capture. So, assuming that WM mechanism consists of the STM component with executive attention controlling its contents, according to this theory, the variance in higher-level cognition reflects primarily the executive attention but not the STM component. Consequently, theories focusing on the active buffer capacity are not meant to allow for predictions or data accommodated by the executive-attention view (Kane & Engle, 2002: p. 638). In contrast, storage-capacity theories predict that controlling attention during reasoning tasks yields not so much impact for reasoning scores, whereas it is crucial for Gf to maintain in WM as many items as possible, because it may determine how complex relations can be constructed from working memory items, e.g., (Halford, Cowan, & Andrews, 2007; Oberauer, Süß, Wilhelm, & Sander, 2007).
Indeed, various measures of the active buffer capacity strongly predict scores on Gf tests, e.g., (Chuderski, Taraday, Nęcka, & Smoleń, 2012; Martinez et al., 2011; Oberauer, Schulze, Wilhelm, & Süβ, 2005; Süβ, Oberauer, Wittmann, Wilhelm, & Schultze, 2002). However, the studies which aimed to support the contribution of attention control to Gf seem to be less conclusive, as often the respective correlations are neglible, e.g., (Buehner, Krumm, & Pick, 2005; Chuderski et al., 2012; Friedman et al., 2006; Martinez et al., 2011), or the results are mixed, e.g., (Salthouse, 2005). In order to provide more data on how well attention control versus the active buffer capacity actually predict fluid intelligence, in this paper I evaluate the relationship between Gf and two tests of attention control, that is, the antisaccade (Study 1) and Stroop tasks (Study 2), which have borne most of support for the executive-attention approach to Gf, while controlling statistically for individual STM.
Early suggestions on the links between attention control and intelligence came from latent variable studies (Conway, Cowan, Bunting, Therriault, & Minkoff, 2002; Engle, Tuholski, Laughlin, & Conway, 1999; Kane et al., 2004) which compared STM tasks involving only storage to dual tasks requiring both storage and processing (i.e., complex span tasks intended to tap attention control). In these studies, the variables reflecting control correlated with Gf more strongly than did the storage variables. However, there was no consistency in defining attentional control, as in some studies, e.g., (Kane et al., 2004) the control variable loaded scores on both STM and complex span tasks, while in other studies (Conway et al., 2002; Engle et al., 1999) a variable defined in such a way was meant to reflect storage, while attention control was equated only to residual variance in complex spans. In fact, when in the latter studies the control variable was recalculated to reflect all tasks, it yielded similar Gf correlations as the residual variable (Kane et al., 2004: see their Footnote 3).
As any valid research on executive processing requires that its indices must not reflect general performance, but instead should rely on subtracting conditions requiring control from some baseline performance (as in the cases of switching or dual-task costs, interference effects, etc.), the fact that a general WM factor correlates with Gf supports no specific hypothesis on executive mechanisms underlying WM-Gf. Moreover, Colom, Abad, Rebollo and Shih (2005) reanalysed data from Kane et al. (2004) and found that a higher-level complex span factor (based on respective verbal and spatial primary factors) was a worse predictor of Gf than a higher-level STM factor. In a meta-analysis of latent variable studies on WM and Gf, Unsworth and Engle (2007a) showed that scores on STM tasks calculated more appropriately (i.e., using proportional scores instead of absolute ones) represent virtually the same portion of Gf variance as do complex spans. In another metaanalysis, Colom, Shih, Flores-Mendosa, and Quiroga (2006) noted that the residual complex-span variance is unstable and does not predict reasoning. Finally, it is not clear whether complex span tasks do measure attention control (for alternative explanations see Barrouillet, Bernardin, & Camos, 2004; Lustig, May, Hasher, 2001; Lewandowsky, Geiger, Morrell, & Oberauer, 2010; Unsworth & Engle, 2007b), while the interpretation of simpler STM tasks in terms of storage capacity is more unequivocal see (Brady, Konkle, & Alvarez, 2011; Fukuda, Awh, & Vogel, 2010; Rouder, Morey, Morey, & Cowan, 2011). From this perspective, results from complex span tasks do not seem to prove that it is attention control capability that determines variation in reasoning.
More important arguments for the role of attention control in intelligence rely on the results of comparison of performance on diverse attention control tests between participants from the lowest and the highest quartile of a complex span distribution (for review see Engle & Kane, 2004). Example studies demonstrated lower error rates of high-span people in the antisaccade task (Unsworth, Shrock, & Engle, 2004), in the flanker task (Heitz & Engle, 2007), and in incongruent trials of the high-proportion-congruent version of the Stroop task (Kane & Engle, 2003). Other instances included their less frequent lapses of attention in a psychomotor vigilance task (Unsworth et al., 2010) and in a dichotic listening task (Colflesh & Conway, 2007). However, from the fact that (a) attention control is related to complex spans, and (b) they are related to fluid intelligence, it does not necessarily follow that (c) attention control should be related to Gf (especially when only quartiles are examined). Better attention control may indeed be involved in the performance of high-span people e.g., (Fukuda & Vogel, 2011; Unsworth & Spillers, 2010; Vogel, McCollough, & Machizawa, 2005), but factors other than control (e.g., the active buffer capacity) may (also) drive complex spans’ relation to Gf. For example, recent studies have shown that complex spans are statistically identical to memory updating (Schmiedek, Hildebrandt, Lövdén, Wilhelm, & Lindenberger, 2009), that memory updating is identical to STM tasks (Chuderski et al., 2012; Martinez et al., 2011), and, finally, that complex spans are identical to STM tasks (Martinez et al., 2011).
Apart from studies based on extreme complex-span quartiles, Unsworth and colleagues (Unsworth, Redick, Lakey, & Young, 2009; Unsworth & Spillers, 2010; Unsworth, Spillers, & Brewer, 2009) have recently analysed correlations between attention control tasks and Gf tests in full samples. In particular, Unsworth and Spillers (2010) partitioned the explained Gf variance into parts predicted separately by latent variables reflecting complex spans, long-term memory (LTM), and attention control, the latter measured with the antisaccade, Stroop, flanker, and vigilance tasks, as well as identified parts shared by respective pairs of factors and by all factors. As much as 13% out of 32% of explained variance was shared by the three factors, and another 12% was unique to complex spans, LTM, or their interaction. This fact means that no more than 7% of Gf variance can be unequivocally assigned to attention control (the identical value was estimated by Schweizer, 2010)—a value suprisingly small if this factor is presumed to be the primary mechanism underlying Gf.
Generally, in three studies by Unsworth, mean raw correlations between scores on specific attention control tasks and three Gf tests were weak. The mean r in the case of the antisaccade task equaled .13, in the case of the Stroop task it reached .11, in the case of the flankers it was .14, and, finally, the vigilance task yielded r = 14. These values are much lower than raw correlations usually observed between Gf tests and simple STM scores (e.g., the mean r = .32, for 29 correlations, in three comparable recent studies, Chuderski et al., 2012; Colom et al., 2008; Martinez et al., 2011).
Moreover, in light of the prevalent suggestions that STM can indeed be very limited (i.e., to three or four items on average, see Cowan et al., 2011; Daavelaar, Goshen-Gottstein, Ashkenazi, Haarmann, & Usher, 2005; Luck & Vogel, 1997; Vogel & Machizawa, 2004), it seems probable that scores on attention control tasks used to date were influenced by individual STM. The maintenance of task instructions, like “look away from the flashing point” in the antisaccade task, or “say a color, not a word” in the Stroop task, or S-R mappings, like “if blue color then press Z”, might be very difficult for a substantial part of the population below the mean capacity, that is, for those who can maintain only few items in their active buffer, even if no distraction is involved. Moreover, if distraction indeed impaired maintenance, even salient distractors need not immediately capture all STM (which is an implicit assumption of the executive-attention view), but they may gradually leak into it, crowding out task-relevant chunks one by one. Due to distraction, less capacious persons may lose all the information for the task, while more capacious ones can handle both that information and the distractors.
Cowan et al. (2006) have tested this speculation and showed that attention control and STM share substantial amount of variance. These results are consistent with an fMRI study indicating that encoding of the goal of the pending antisaccade is supported by the high gamma band located in the intraparietal sulcus (Van Der Werf, Jensen, Fries, & Medendorp, 2008), a brain area found to support the active buffer (Cowan et al., 2011; Todd & Marois, 2004).
Goals of the Present Study
For all the aforementioned reasons, the evaluation of the actual relationships between fluid reasoning and two crucial mechanisms of WM: its active buffer and its attention control, the latter reflected by scores on its most widely used tests (i.e., the antisaccade and Stroop-like tasks), seems to be a very important research goal. In light of findings on the large amount of variance shared between STM measures and the control of attention, the proper fulfillment of this goal should require 1) the design of attention control tasks that would be minimally influenced by individual differences in STM as well as 2) statistical control for these differences.
Below, two studies serving this goal are reported. Novel versions of the attention control tasks were used, which seemed to substantially decrease the influence of storage mechanisms on performance, and it was tested whether such purer indices of executive attention ability are or are not important contributors to fluid reasoning after the variance in STM—estimated as a number of items that can be maintained in specially designed STM tasks—is partialled out.
2. Study 1
In Study 1, it was aimed to verify that the antisaccade task was sensitive to the differences in individual capacity, and whether after decreasing this sensitivity it would still be an important predictor of fluid intelligence, or not. The opposite hypothesis, assuming that the STM task requires attention control, seems less likely. Firstly, detailed analysis of this task does not reveal any important sources for interference or distraction. Also, the STM task used was self-paced, so adequate breaks most likely helped participants to avoid most of interference from previous trials. Secondly, Chuderski, Andrelczyk, and Smolen (2013) demonstrated that the distribution of individual capacity observed in this task (as well as several other effects related to capacity differences) can be precisely replicated by a computational model which included only storage mechanisms (fast oscillations reflecting the gamma band), but no control mechanisms.
As it is not possible to eliminate from the antisaccade task the storage requirements (i.e., the instruction must be maintained throughout the task, as is implicated by neuroimaging research; Van Der Werf et al., 2008), the opposite logic was adopted and it was tried to substantially increase this task’s load on storage mechanisms. It was assumed that when most participants' buffer was heavily loaded, the differences in the buffer capacity would less influence their performance on the task, and its variance shared with Gf would primarily reflect the differences in effectiveness of attentional control over the distraction and interference related to prepotent prosaccadic response tendency. The diminished sensitivity to storage of the modified version should result in much weaker correlations between the control and STM tasks, and a smaller amount of Gf variance they can jointly account for, compared to the performance on the standard version.
2.1. Method
Participants. There were 278 participants (166 females, M = 23.2 years, SD = 4.2, range 17 - 46). The participants were randomly assigned to two groups: the standard antisaccade task group, called the “low-load group”—138 people, and the modified task group, called the “high-load group”—140 people. Each participant was paid the equivalent of about 6 EUR. All participants reported normal or corrected-to-normal vision, they were instructed to take the most comfortable sitting position during the experiment, they completed WM and Gf tests in groups of two to five people, and during the computerized task they were equipped with headphones.
Materials and procedure. The standard version of the antisaccade task consisted of 18 training and 40 test antisaccade trials. Each test trial consisted of four events. First, a cue was presented for 1.5 s, reminding participants that a target would be presented precisely in the middle of the opposite side to the flashing square. Next, a fixation point was presented at the center of the screen for 1 - 9 s. Then, a rapidly flashing black square (3 cm in size) was shown on the left or right side of the screen, about 16 cm from the fixation point, for 150 ms. Finally, a small dark gray arrow (0.6 cm long), pointing left, down, or right, was presented in the location opposite the square for only 150 ms and was then replaced by a mask. The visual angle from both the square and the arrow to the fixation point was approximately 14˚. The task was to look away from the flashing square, to detect the direction of the arrow, and to press the arrow key matching the stimulus arrow. The trials were self-paced. A dependent variable was accuracy.
The modification of the standard version was that the arrows could be presented not only in the middle of the side opposite to the flashing square, but also in the top or bottom part of this side. There were 30, 10, and 10 trials of each type, respectively. The cues presented before the two latter types of trials informed participants that they should look precisely at the top/bottom corner of the opposite side. Apart from that, the modified version was identical to the standard one. The former was expected to impose a greater load on WM storage, because it required the maintenance not only of the instruction “look away from the square”, but also of a precise location that should be looked at (top/middle/bottom). Importantly, accuracy from only the 30 “middle” trials was taken as a dependent variable in the modified version, the same as in the standard version, so both scores reflected comparable trials. The “top”/“bottom” trials were only introduced to justify the need for active maintenance of the target location, thus increasing WM load, and were not analysed further.
The active buffer capacity was screened with a modified change detection paradigm (Luck & Vogel, 1997; Rouder et al., 2011). Each of the 90 trials of the task consisted of a virtual, four by four array filled with five, six, or seven stimuli (i.e., only some cells in the array were filled). The stimuli were ten Greek symbols (e.g., α, β, χ, and so on), each approximately 2 × 2 cm in size. The array was presented on the screen for a time equal to the number of its items multiplied by 400 ms, and then covered for 1.2 s by a black square mask. In a random half of trials, a second array identical to the first one was presented next, while in the remaining trials the first and second arrays differed by exactly one item at one position. If they differed, then the new item was highlighted by a square red border. If they were identical, a random item was highlighted. The task was to press one of two response keys depending on whether the highlighted item differed or not in two arrays. The second array was shown until a response was given or 4 s elapsed. The trials were self-paced.
The score on this task is the estimated sheer capacity of the active buffer (Cowan, 2001), based on the proportion of hits (H, correct responses for arrays with one item changed) and the proportion of false alarms (FA, incorrect responses for unchanged arrays). The capacity is estimated to be k items (out of N items of a WM load), on the assumption that a participant produces a correct hit or avoids a false alarm only if a cued item is transferred to his or her buffer (with the k/N chance). If a non-transferred item is cued, then a participant guesses the answer. In consequence, the formula k = N × (H – FA) evaluates the score on the task for each N. The total score on this task was a mean from three values of k (i.e., for Ns = 5, 6, and 7).
Fluid reasoning was assessed with two tests applied after the computerized tasks. Raven’s APM test (Raven, Court, & Raven, 1983) consists of 36 items that include a three-by-three matrix of figural patterns which is missing the bottom-right pattern, and eight response options which are the patterns which can potentially match a missing one. The participant’s task is to discover the rules that govern the patterns and choose the one and only response option. A novel analogy test (Orzechowski & Chuderski, 2007) included figural analogies in the form “A is to B as C is to X”, where A, B, and C are types of figures, A is related to B according to two, three, four, or five latent rules (e.g., symmetry, rotation, change in size, color, thickness, number of objects, etc.), and X is an empty space. The task is to choose one figure from four that relates to figure C, as B relates to A. Responses were filled in the answer sheet. The reasoning score (Gf) was calculated as the mean of z-scores of the total number of correctly solved items within 40 min in Raven’s and 30 min in Analogies.
2.2. Results
Descriptive statistics and reliabilities for all DVs as well as the matrix of correlations among them are presented in Table 1. Accuracy in the antisaccade task was significantly lower in the high-load group than in the low-load group, t(276) = 3.44, p < .001, d = .40. No other score differentiated the groups, ps > .35. Most importantly, the correlation between the antisaccade score and k value was weaker (Δr = .117) in the high-load group than in the low-load group, t(276) = 1.56, p = .060, d = 1.46, indicating that the manipulation with load was effective to considerable extent.
Next, the regression analyses were calculated, and the Gf variance was partitioned separately for each group see (Chuah & Maybery, 1999; Cowan et al., 2005). In the high-load group, single-predictor regressions yielded, βANTISACCADE = .317, t(138) = 3.93, p < .001, R2 = .101, and βK = .449, t(138) = 5.91, p < .001, R2 = .202, while a double-predictor analysis yielded βANTISACCADE = .210, t(137) = 2.72, p = .007, βK = .392, t(137) = 5.07, p < .001, R2 = .243. In the low-load group, the respective values for single-predictor regressions were βANTISACCADE = .521, t(136) = 7.11, p < .001, R2 = .271, and βK = .431, t(136) = 5.57, p < .001, R2 = .186, while a double-predictor analysis provided βANTISACCADE = .416, t(135) = 5.45, p < .001, βK = .269, t(135) = 3.52, p < .001, R2 = .333. The βANTISACCADE value was significantly lower in the high-load than in the low-load group in both single-predictor and double-predictor regression, ts(276) = 2.75, ps = .003., ds = 2.73.
In consequence, the variance partitioning analysis gave substantially different results in each group. In the high-load group, only 4.1% of Gf variance was uniquely accounted for by the antisaccade score, as much as

Table 1. Descriptive statistics, reliabilities and correlation matrix for measures used in Study 1.
Note: N = 278. All correlations were significant on at least p = .004 level. Reliability = Cronbach’s alpha.
14.2% was uniquely accounted for by the k value, and the remaining 6.0% was explained by both variables together. In the low-load group, these parts were 14.7%, 6.2%, and 12.4%, respectively.
2.3. Discussion
The manipulation considering the load imposed on active maintenance resulted in the fact that the performance in the more highly loading task correlated less strongly with k value than in the standard antisaccade task, and this fact indicates that in the former condition the individual buffer capacity influenced the accuracy of antisaccades to a lesser extent. As a result, the pattern of contributions of the active buffer capacity and the control of attention to intelligence substantially changed. Contrary to the low-load group, in the high-load group the active buffer capacity was the primary contributor to Gf, while attention control univocally explained only 4% of Gf variance. The amount of Gf variance shared by both constructs decreased from 12.4% in the low-load group to 6% in the high-load group. That observation supports the interpretation that this variance was shared due to common maintenance requirements instead of the common involvement of attention control. On the basis of the executive-attention theory it could be argued that the modified antisaccade task required an even larger amount of control due to the need to switch between three target locations, but in fact that did not result in its stronger predictory power with regard to Gf score.
All the above results suggest that the antisaccade task is a predictor of fluid intelligence in part because its performance substantially covaries with individual capacity of the active buffer. When the task was changed in such a way that its scores were less sensitive to the individual differences in STM, its contribution to Gf was much weaker than that of STM, making the latter the primary predictor of Gf. The part of Gf variance that is uniquely accounted for by the antisaccade task does not allow attention control as a factor underlying Gf to be decisively ruled out, however maybe its actual role in the explanation of fluid intelligence have been overestimated.
3. Study 2
According to the executive-attention theory, the Stroop task involves a great deal of attention control when it is applied in the high-proportion-congruent version, that is, when words presented in a non-matching color are relatively rare in a sequence. In such conditions, as often both reading words and naming colors lead to the same response, stimuli do not exogenously “remind” participants that words should not be read, so they have to endogenously focus their attention on the proper task. Kane and Engle (2003) showed that people with high-spans commit less errors than those with low-span (extreme quartiles) in such a condition, but this difference disappears when incongruent trials are frequent. In the latter condition, however, high-spans responded faster, presumably because it took them shorter to resolve conflicts between reading and naming.
However, to the author’s knowledge, this prediction (i.e., contrasting the highand low-proportion-congruent versions) has not been tested on a full sample and with regard to fluid intelligence. Kane and Engle (2002) cite an unpublished study by Kane, Sanchez, and Engle (1999), who observed r = −.49 between a single Gf measure and Stroop interference in the high-proportion-congruent version, but they did not test if such a correlation does also appear (or does not) in the alternative version. In a published study, Unsworth and Spillers (2010), using 33% of incongruent trials, found weak and insignificant correlations (rs = .10 - .12) between the latency interference effect and three Gf measures (for a similar result, see also Friedman et al., 2006). Moreover, Unsworth and Spillers’ task does not seem sheer enough, because it imposed a certain load on WM, as apart from the maintenance of an instruction, the participants had to remember the arbitrary associations between colors and respective response keys.
In this study, a low-loading variant of the 75%-congruent color-word task was applied to one group of participants, while the other group did the analogous variant of the 25%-congruent color-word task. It was intended to test if the correlation between Gf and accuracy interference in the former group was significant and significantly stronger than in the latter group. Such a result would indicate that specifically endogenous attention control, and not the Stroop performance in general, contributes to fluid intelligence. Crucially, unlike in the antisaccade task, within the Stroop paradigm it was possible to directly minimize related WM load, by presenting the color-key associations at the bottom of screen for the whole duration of the task.
3.1. Method
Participants. There were 297 participants (180 females, M age = 22.6 years, SD age = 3.2, range 15 - 46). The participants were randomly assigned to two groups (“the 75%-congruent group”—152 people, “the 25%-congruent group”—145 people). Data from four other participants was discarded due to their very low accuracy in the incongruent condition (all four Ms < .5). The reward and testing conditions were the same as in Study 1.
Materials and procedure. The stimuli in the color-word task (MacLeod, 1991) were four capital Polish words (approx. 5 cm × 2 cm in size) naming the colors red, green, blue, and black. Each word could be displayed in any of the four ink colors. In congruent stimuli the meaning of the word and the color of the ink were the same. In incongruent stimuli the former differed from the latter. Trials lasted until a response was given, or for a maximum of 3 s. The instruction was to avoid reading a word and to press a response key that was assigned to a presented color. There were 90 congruent and 30 incongruent trials presented in the 75%-congruent group, while 30 congruent and 90 incongruent trials were shown in the 25%-congruent group. The accuracy (interference) effect was the difference between proportion correct in congruent versus incongruent trials. It showed how many more errors (in terms of their proportion) participants commited in the conflict trials in comparison to the baseline. Analogously, the latency (interference) effect was the difference between the mean RT of correct responses in incongruent versus congruent trials (i.e., how much longer it took participants to resolve conflicts). Because individual differences in elementary cognitive tasks are often related to the tail of latency distribution (Coyle, 2003), no trimming procedure was applied to latencies in order to amplify any possible correlations. The STM task and intelligence tests were the same as in Study 1.
3.2. Results
All data are presented in Table 2. As latency interference effects did not correlate significantly with Gf in any group (both rs < |.05|), and had low reliability (around .5), I analysed only accuracy effects.
Both accuracy and latency effects in the 25%-congruent group were approximately four times lower compared to the 75%-congruent group, t(295) = 6.28, p < .001, d = 7.74, and t(295) = 10.62, p < .001, d = 1.24, respectively. This indicates that the former condition was relatively easy and might not involve substantial attention control, while the interference effects in the latter condition were comparable to other studies e.g., (Kane & Engle, 2003; Unsworth & Spillers, 2010) and indicated increased difficulty for the attentional system. In each group, both effects positively and significantly correlated, suggesting no speed-accuracy trade-off. In no group did these effects significantly correlate with the k value (all ps > .13).
In order to partition the Gf variance, a couple of regression analyses were calculated. In the 75%-congruent group, single-predictor regressions yielded βSTROOP = −.160, t(150) = 1.98, p = .050, R2 = .025, and βK = .502, t(150) = 7.11, p < .001, R2 = .252, while a double-predictor analysis yielded βSTROOP = −.099, t(150) = 1.40, p = .163, βK = .490, t(150) = 6.91, p < .001, and R2 = .262. In the 25%-congruent group, the results were βSTROOP = −.014, t(143) = .16, and βK = .332, t(143) = 4.20, p < .001, R2 = .110. So, the Stroop effect was an expected but
Table 2. Descriptive statistics, reliabilities and correlation matrix for measures used in Study 2.
Note: N = 297. Correlations significant at p < .05 level were the ones stronger than r = |.16|. Reliability = Cronbach’s alpha.
weak predictor of Gf only in the 75%-congruent condition.
Gf variance partitioning in the 75%-congruent group indicated that an insignificant 1.0% of this variance was uniquely accounted for by the Stroop effect, another 1.5% was predicted by both the Stroop and k value together, and as much as 23.7% was uniquely accounted for by the k value.
3.3. Discussion
The present data is consistent with Kane and Engle’s (2003) hypothesis predicting that the increased proportion of congruent trials will amplify the link between the Stroop effect and Gf. However, after keeping the load on WM low by attenuating the need to maintain the S-R mappings in WM (as they were presented onscreen), this correlation was weak and only marginally significant (anyway, it closely matched results of Unsworth & Spillers, 2010). The high-proportion-congruent Stroop task did not contribute to any significant variance beyond that of the active buffer capacity. In the case of latency effects, no relation to Gf was found in any group.
4. General Discussion
To sum up the results (see Figure 1), when (a) the antisaccade and Stroop tasks were designed so that scores on these tasks were relatively unaffected by the individual differences in STM, and (b) these differences were statistically controlled for, the previously substantial Gf variance uniquely predicted by attention control (14.7% in the case of the standard antisaccade task in Study 1), either largely decreased (to 4.1% in the case of the modified antisaccade task in Study 1) or even diminished (1% in the case of the modified 75%-congruent Stroop task in Study 2). On the contrary, the part of Gf variance uniquely explained by the active buffer capacity was constantly substantial, and it reached 23.7% in Study 2. Moreover, the experimental manipulation of Study 1 diminishing the contribution of the STM task to the antisaccade task suggests that there are good reasons to believe that the part of Gf variance jointly explained by both these tasks was shared due to their common load on storage mechanisms and not a load on attention control.
Although using only one attention control task in each study instead of calculating a latent variable from several tasks may be seen as a limitation of the present research, the use of one task and one experimental manipulation in each study was intended, in order to interpret the results more clearly. Other attention control tests, like psychomotor vigilance task, correlate with Gf even more weakly (Unsworth et al., 2009) than each of the tasks examined here, so taking the former into account should not have changed the conclusions of this study.
The present results seem to pose some problems for the executive-attention theory of fluid intelligence, and at least they suggest that if attention control mechanisms indeed contribute to fluid intelligence, they are not the sole nor the primary contributor. On the contrary, the results suggest that the primary factor related to Gf is the active buffer capacity, while attention control in even such an attentionally demanding test as the antisaccade task contributes to only a moderate part of individual differences in fluid ability, when the influence of STM is
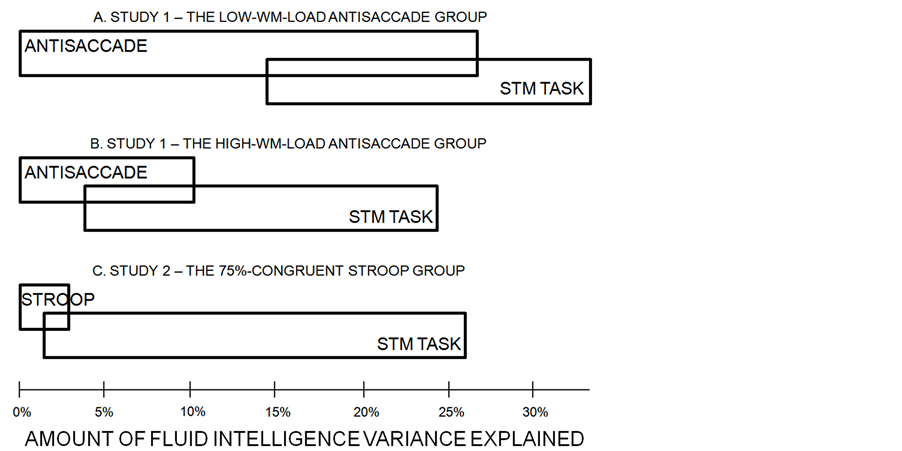
Figure 1. The amounts of variance in fluid reasoning uniquely and jointly explained by attention control (boxes on the left) and STM tasks (boxes on the right), in Studies 1 and 2. Panel A: data from the experimental group who fulfilled the variant of the antisaccade task yielding low storage load, thus sensitive to individual differences in STM. Panel B: data from the group who fulfilled the variant of the antisaccade task yielding high storage load, thus insensitive to individual differences in STM. Panel C: data from the group who fulfilled the variant of the Stroop task yielding minimal storage load, thus insensitive to individual differences in STM.
controlled for. In the latter regard, these results are consistent with data from Schweizer (2010), who estimated that only a few percent of Gf variance can be explained by attention control. A little higher such an estimation was presented by Cowan et al. (2006), who found that 10% of Gf variance was uniquely predicted by the attention control task, and another 12% was shared with the STM task. However, Cowan et al. used a small sample (52 adults) as well as a disputable measure of control (the correct recall of unattended versus attended stimuli), so Schweizer’s as well as mine few-percent-variance estimation of attention control contribution to Gf may lay closer to the real value. At the same time, the active buffer capacity may contribute to between ten and twenty percent of Gf variance at least.
The presented results are particularly important because they directly test the frequent assumptions made by proponents of the executive-attention theory on the reliance of fluid reasoning on attentional control capabilities. Although there is scarce evidence that measures of attention control can be predictors of Gf as strong as the storage measures (except for the cited paper by Cowan et al., 2006), numerous authors have referred to such a hypothesis, and interpreted the activation of the prefrontal cortex (PFC) in both attention control tasks and reasoning tests as the argument for linking attentional control with Gf (for reviews see Burgess, Gray, Conway, & Braver, 2011; Kane & Engle, 2002). However, as long as what processes take place in various structures of PFC is not understood precisely, such an indirect argumentation may not be so strong as intended. Likely, the view on the role of WM in complex cognition is more complicated, and various components of WM play different roles see (Conway, Getz, Macnamara, & Engel de Abreu, 2011).
However, does the fact that attention control does not contribute so importantly to fluid ability indicate that, generally, executive control is not necessary for fluid reasoning? Surely, such a conclusion cannot be drawn on the basis of the presented study. Another control process different from attention control which can explain some part of variance in reasoning may rely on the control of interference between competing solutions related to a reasoning task. For example, studies on cross-mapping in analogy-making show that it is very difficult to choose a perceptually/semantically improbable mapping, even if it properly fits the structure of analogy (i.e., it is the correct mapping), and to ignore a perceptually/semantically consistent but structurally misfitting mapping (Cho, Holyoak, & Cannon, 2007; Chuderska & Chuderski, 2014; Markman & Gentner, 1993). Maybe, Gf-unrelated (attention) control over perceptual-motor entities, like salient but irrelevant stimuli or prepotent but improper responses, should be conceptually distinguished from Gf-related control over internal cognitive processes aimed at regulating the flow of thoughts, the retrieval of semantically-rich representations, the construction of new informational structures, etc. (for an example of such a distinction see Nigg, 2000). It seems unlikely that the latter control can be tapped by such simple performance tests as the antisaccade task or the Stroop, while it may still be crucial for successful performance in various tests of relatively more complex cognition. Obviously, more work is needed in future for a fuller understanding of the role of such control processes in cognition (MacLeod, 2007; Morrison, Doumas, & Richland, 2010).
5. Conclusion
In conclusion, both the reviewed and presented data as well as the theoretical considerations suggest that out of two crucial mechanisms of WM, attention control, understood as the capability of focusing attention on the current goal/task-set and blocking interference/distraction, and measured with two most widely used tasks, contributes to fluid intelligence to a lesser extent than does the active buffer of WM, which is responsible for active maintenance of several chunks of information for the purpose of the current task/goal. Thus, the present study provides significant knowledge about which WM mechanisms (i.e., the active buffer) primarily determine WM functioning as well as its role in higher-level cognitive processes, and which WM mechanisms (i.e., attention control) may have less influence on both these characteristics of WM.
Acknowledgements
This research was supported by grant 2011/01/D/HS6/00467 funded by National Science Centre of Poland. Thanks to Maciej Taraday, Anna Anzulewicz, Krzysztof Cipora, and Dominika Czajak for their help in conducting the study and to Mike Timberlake for correcting the text.
References
- Barrouillet, P., Bernardin, S., & Camos, V. (2004). Time Constraints and Resource Sharing in Adults’ Working Memory Spans. Journal of Experimental Psychology: General, 133, 83-100. http://dx.doi.org/10.1037/0096-3445.133.1.83
- Brady, T. F., Konkle, T., & Alvarez, G. A. (2011). Review of Visual Memory Capacity: Beyond Individual Items and toward Structured Representations. Journal of Vision, 11, 1-34. http://dx.doi.org/10.1167/11.5.4
- Buehner, M., Krumm, S., & Pick, M. (2005). Reasoning = Working Memory ≠ Attention. Intelligence, 33, 251-272. http://dx.doi.org/10.1016/j.intell.2005.01.002
- Cho, S., Holyoak, K. J., & Cannon, T. D. (2007). Analogical Reasoning in Working Memory: Resources Shared among Relational Integration, Interference Resolution, and Maintenance. Memory and Cognition, 35, 1445-1455. http://dx.doi.org/10.3758/BF03193614
- Chuah, Y. M. L., & Maybery, M. T. (1999). Verbal and Spatial Short-Term Memory: Common Sources of Developmental Change? Journal of Experimental Child Psychology, 73, 7-44. http://dx.doi.org/10.1006/jecp.1999.2493
- Chuderska, A., & Chuderski, A. (2013). Two Facets of Cognitive Control in Analogical Mapping: The Role of Semantic Interference Resolution and Goal-Driven Structure Selection. Thinking & Reasoning. http://dx.doi.org/10.1080/13546783.2013.825642
- Chuderski, A., Andrelczyk, K., & Smolen, T. (2013). An Oscillatory Model of Individual Differences in Working Memory Capacity and Relational Integration. Cognitive Systems Research, 24, 87-95. http://dx.doi.org/10.1016/j.cogsys.2012.12.005
- Chuderski, A., Taraday, M., Nęcka, E., & Smoleń, T. (2012). Storage Capacity Explains Fluid Intelligence while Executive Control Does Not. Intelligence, 40, 278-295. http://dx.doi.org/10.1016/j.intell.2012.02.010
- Colflesh, G. J. H., & Conway, A. R. A. (2007). Individual Differences in Working Memory Capacity and Divided Attention in Dichotic Listening. Psychonomic Bulletin & Review, 14, 699-703. http://dx.doi.org/10.3758/BF03196824
- Colom, R., Abad, F. J., Quiroga, M. A., Shih, P. C., & Flores-Mendoza, C. (2008). Working Memory and Intelligence Are Highly Related Constructs but Why? Intelligence, 36, 584-606. http://dx.doi.org/10.1016/j.intell.2008.01.002
- Colom, R., Abad, F. J., Rebollo, I., & Shih, P. C. (2005). Memory Span and General Intelligence: A Latent Variable Approach. Intelligence, 33, 623-642. http://dx.doi.org/10.1016/j.intell.2005.05.006
- Colom, R., Rebollo, I., Abad, F. J., & Shih, P. C. (2006). Complex Span Tasks, Simple Span Tasks, and Cognitive Abilities: A Re-Analysis of Key Studies. Memory & Cognition, 34, 158-171. http://dx.doi.org/10.3758/BF03193395
- Conway, A. R. A., Cowan, N., Bunting, M. F., Therriault, D. J., & Minkoff, S. R. (2002). A Latent Variable Analysis of Working Memory Capacity, Short-Term Memory Capacity, Processing Speed, and General Fluid Intelligence. Intelligence, 30, 163-183. http://dx.doi.org/10.1016/S0160-2896(01)00096-4
- Conway, A. R. A., Getz, S. J., Macnamara, B., & Engel de Abreu, P. M. J. (2011). Working Memory and Fluid Intelligence: A Multi-Mechanism View. In R. J. Sternberg, & S. B. Kaufman (Eds.), The Cambridge Handbook of Intelligence (pp. 394-418). Cambridge, UK: Cambridge University Press. http://dx.doi.org/10.1017/CBO9780511977244.021
- Cowan, N. (2001). The Magical Number 4 in Short-Term Memory: A Reconsideration of Mental Storage Capacity. Behavioral and Brain Sciences, 24, 87-114. http://dx.doi.org/10.1017/S0140525X01003922
- Cowan, N., Fristoe, N. M., Elliott, E. M., Brunner, R. P., & Saults, J. S. (2006). Scope of Attention, Control of Attention, and Intelligence in Children and Adults. Memory & Cognition, 34, 1754-1768. http://dx.doi.org/10.3758/BF03195936
- Cowan, N., Li, D., Moffitt, A., Becker, T. M., Martin, E. A., Saults, J. S., & Christ, S. E. (2011). A Neural Region of Abstract Working Memory. Journal of Cognitive Neuroscience, 23, 2852-2863. http://dx.doi.org/10.1162/jocn.2011.21625
- Coyle, T. R. (2003). A Review of the Worst Performance Rule: Evidence, Theory, and Alternative Hypotheses. Intelligence, 31, 567-587. http://dx.doi.org/10.1016/S0160-2896(03)00054-0
- Daneman, M., & Carpenter, P. A. (1980). Individual Differences in Working Memory and Reading. Journal of Verbal Learning and Verbal Behavior, 19, 450-466. http://dx.doi.org/10.1016/S0022-5371(80)90312-6
- Engle, R. W., & Kane, M. J. (2004). Executive Attention, Working Memory Capacity, and a Two-Factor Theory of Cognitive Control. In B. Ross (Ed.), The Psychology of Learning and Motivation, Vol. 44, (pp. 145-199). New York, NJ: Elsevier.
- Engle, R. W., Tuholski, S. W., Laughlin, J. E., & Conway A. R. A. (1999). Working Memory, Short Term Memory, and General Fluid Intelligence: A Latent Variable Approach. Journal of Experimental Psychology: General, 128, 309-331. http://dx.doi.org/10.1037/0096-3445.128.3.309
- Friedman, N. P., Miyake, A., Corley, R. P., Young, S. E., DeFries, J. C., & Hewitt, J. K. (2006). Not All Executive Functions Are Related to Intelligence. Psychological Science, 17, 172-179. http://dx.doi.org/10.1111/j.1467-9280.2006.01681.x
- Fukuda, K., & Vogel, E. K. (2011). Individual Differences in Recovery Time from Attentional Capture. Psychological Science, 22, 361-368. http://dx.doi.org/10.1177/0956797611398493
- Fukuda, K., Awh, E., & Vogel, E. K. (2010). Discrete Capacity Limits in Visual Working Memory. Current Opinion in Neurobiology, 20, 177-182. http://dx.doi.org/10.1016/j.conb.2010.03.005
- Halford, G. S., Cowan, N., & Andrews, G. (2007). Separating Cognitive Capacity from Knowledge: A New Hypothesis. Trends in Cognitive Sciences, 11, 236-241. http://dx.doi.org/10.1016/j.tics.2007.04.001
- Heitz, R. P., & Engle, R. W. (2007). Focusing the Spotlight: Individual Differences in Visual Attention Control. Journal of Experimental Psychology: General, 136, 217-240. http://dx.doi.org/10.1037/0096-3445.136.2.217
- Hunt, E. B. (1980). Intelligence as an Information Processing Concept. The British Journal of Psychology, 71, 449-474. http://dx.doi.org/10.1111/j.2044-8295.1980.tb01760.x
- Kane, M. J., & Engle, M. J. (2002). The Role of Prefrontal Cortex in Working-Memory Capacity, Executive Attention, and General Fluid Intelligence: An Individual-Differences Perspective. Psychonomic Bulletin & Review, 9, 637-671. http://dx.doi.org/10.3758/BF03196323
- Kane, M. J., & Engle, R. W. (2003). Working-Memory Capacity and the Control of Attention: The Contributions of Goal Neglect, Response Competition, and Task Set to Stroop Interference. Journal of Experimental Psychology: General, 132, 47-70. http://dx.doi.org/10.1037/0096-3445.132.1.47
- Kane, M. J., Hambrick, D. Z., Tuholski, S. W., Wilhelm, O., Payne, T. W., & Engle, R. W. (2004). The Generality of Working Memory Capacity: A Latent Variable Approach to Verbal and Visuo-Spatial Memory Span and Reasoning. Journal of Experimental Psychology: General, 133, 189-217. http://dx.doi.org/10.1037/0096-3445.133.2.189
- Kane, M. J., Sanchez, A., & Engle, R. W. (1999). Working Memory Capacity, Intelligence, and Goal Neglect in the Stroop Task. Poster presented at the Annual Meeting of the Psychonomic Society, Los Angeles, November 1999.
- Kyllonen, P. C., & Cristal, R. E. (1990). Reasoning Ability Is (Little More than) Working Memory Capacity?! Intelligence, 14, 389-433. http://dx.doi.org/10.1016/S0160-2896(05)80012-1
- Lewandowsky, S., Geiger, S. M., Morrell, D. B., & Oberauer, K. (2010). Turning Simple Span into Complex Span: Time for Decay or Interference from Distractors? Journal of Experimental Psychology: Learning, Memory, and Cognition, 36, 958- 978. http://dx.doi.org/10.1037/a0019764
- Luck, S. J., & Vogel, E. K. (1997). The Capacity of Visual Working Memory for Features and Conjunctions. Nature, 390, 279-281. http://dx.doi.org/10.1038/36846
- Lustig, C., May, C. P., & Hasher, L. (2001). Working Memory Span and the Role of Proactive Interference. Journal of Experimental Psychology: General, 130, 199-207. http://dx.doi.org/10.1037/0096-3445.130.2.199
- MacLeod, C. M. (1991). Half a Century of a Research on the Stroop Effects: An Integrative Review. Psychological Bulletin, 109, 163-203. http://dx.doi.org/10.1037/0033-2909.109.2.163
- Markman, A., & Gentner, D. (1993). Structural Alignment during Similarity Comparisons. Cognitive Psychology, 25, 431- 467. http://dx.doi.org/10.1006/cogp.1993.1011
- Morrison, R. G., Doumas, L. A. A., & Richland, L. E. (2012). A Computational Account of the Development of Analogical Reasoning: The Importance of Inhibitory Control in Working Memory. Developmental Science, 14, 516-529. http://dx.doi.org/10.1111/j.1467-7687.2010.00999.x
- Oberauer, K., Schultze, R., Wilhelm, O., & Süß, H.-M. (2005). Working Memory and Intelligence—Their Correlation and Their Relation: Comment on Ackerman, Beier, and Boyle (2005). Psychological Bulletin, 131, 61-65. http://dx.doi.org/10.1037/0033-2909.131.1.61
- Oberauer, K., Süß, H.-M., Wilhelm, O., & Sander, N. (2007). Individual Differences in Working Memory Capacity and Reasoning Ability. In A. R. A. Conway, C. Jarrold, M. J. Kane, A. Miyake, & J. N. Towse (Eds.), Variation in Working Memory (pp. 49-75). Oxford: Oxford University Press.
- Orzechowski, J., & Chuderski, A. (2007). Test Analogii Obrazkowych [A Figural Analogies Test]. Unpublished manuscript, Krakow: Jagiellonian University.
- Raven, J. C., Court, J. H., & Raven J. (1983). Manual for Raven’s Progressive Matrices and Vocabulary Scales (Section 4: Advanced Progressive Matrices). London: H. K. Lewis.
- Rouder, J. N., Morey, R. D., Morey, C. C., & Cowan, N. (2011). How to Measure Working Memory Capacity in the Change Detection Paradigm. Psychonomic Bulletin & Review, 18, 324-330. http://dx.doi.org/10.3758/s13423-011-0055-3
- Salthouse, T. (2005). Relations between Cognitive Abilities and Measures of Executive Functioning. Neuropsychology, 19, 532-545. http://dx.doi.org/10.1037/0894-4105.19.4.532
- Schmiedek, F., Hildebrandt, A., Lövdén, M., Wilhelm, O., & Lindenberger, U. (2009). Complex Span versus Updating Tasks of Working Memory: The Gap Is Not That Big. Journal of Experimental Psychology: Learning, Memory, and Cognition, 35, 1089-1096. http://dx.doi.org/10.1037/a0015730
- Schweizer, K. (2010). The Relationship of Attention and Intelligence. In A. Gruszka, G. Matthiews, & B. Szymura (Eds.), Handbook of Individual Differences in Cognition: Attention, Memory, and Executive Control (pp. 247-262). New York: Springer. http://dx.doi.org/10.1007/978-1-4419-1210-7_15
- Süß, H. M., Oberauer, K., Wittmann, W. W., Wilhelm, O., & Schulze, R. (2002). Working Memory Capacity Explains Reasoning Ability—And a Little Bit More. Intelligence, 30, 261-288. http://dx.doi.org/10.1016/S0160-2896(01)00100-3
- Unsworth, N., & Engle, R. W. (2007a). On the Division of Short-Term and Working Memory: An Examination of Simple and Complex Span and Their Relation to Higher Order Abilities. Psychological Bulletin, 133, 1038-1066. http://dx.doi.org/10.1037/0033-2909.133.6.1038
- Unsworth, N., & Engle, R. W. (2007b). The Nature of Individual Differences in Working Memory Capacity: Active Maintenance in Primary Memory and Controlled Search from Secondary Memory. Psychological Review, 114, 104-132. http://dx.doi.org/10.1037/0033-295X.114.1.104
- Unsworth, N., & Spillers, G. J. (2010). Working Memory Capacity: Attention, Memory, or Both? A Direct Test of the Dual-Component Model. Journal of Memory and Language, 62, 392-406. http://dx.doi.org/10.1016/j.jml.2010.02.001
- Unsworth, N., Redick, T. S., Lakey, C. E., & Young, D. L. (2010). Lapses in Sustained Attention and Their Relation to Executive Control and Fluid Abilities: An Individual Differences Investigation. Intelligence, 38, 111-122. http://dx.doi.org/10.1016/j.intell.2009.08.002
- Unsworth, N., Schrock, J. C., & Engle, R. W. (2004). Working Memory Capacity and the Antisaccade Task: Individual Differences in Voluntary Saccade Control. Journal of Experimental Psychology: Learning, Memory, & Cognition, 30, 1302- 1321. http://dx.doi.org/10.1037/0278-7393.30.6.1302
- Unsworth, N., Spillers, G. J., & Brewer, G. (2009). Examining the Relations among Working Memory Capacity, Attention Control, and Fluid Intelligence from a Dual-Component Framework. Psychology Science Quarterly, 51, 388-402.
- Van Der Werf, J., Jensen, O., Fries, P., & Medendorp, W. P. (2008). Gamma-Band Activity in Human Posterior Parietal Cortex Encodes the Motor Goal during Delayed Prosaccades and Antisaccades. Journal of Neuroscience, 28, 8397-8405. http://dx.doi.org/10.1523/JNEUROSCI.0630-08.2008
- Vogel, E. K., & Machizawa, M. G. (2004). Neural Activity Predicts Individual Differences in Visual Working Memory Capacity. Nature, 428, 748-751. http://dx.doi.org/10.1038/nature02447
- Vogel, E. K., McCollough, A. W., & Machizawa, M. G. (2005). Neural Measures Reveal Individual Differences in Controlling Access to Working Memory. Nature, 423, 500-503. http://dx.doi.org/10.1038/nature04171