Journal of Environmental Protection
Vol.5 No.4(2014), Article ID:43851,8 pages DOI:10.4236/jep.2014.54027
Enhancing the Removal of Organic Matter and Nutrient from Wastewater by Using the Packed Bed Biological Reactor
Moayyed Shawaqfah
Civil Engineering Department, Al al-Bayt University, Mafraq, Jordan
Email: mshawaqfah@aabu.edu.jo
Copyright © 2014 by author and Scientific Research Publishing Inc.
This work is licensed under the Creative Commons Attribution International License (CC BY).
http://creativecommons.org/licenses/by/4.0/


Received 29 December 2013; revised 27 January 2014; accepted 24 February 2014
ABSTRACT
Packed Bed biological Reactor (PBR) system has the potential to offer an effective and low-cost technology for upgrading the conventional wastewater treatment systems. The objective of this study was to evaluate the performance of PBR in removing the organic matter and nutrient from different types of wastewater (primary treatment effluent and secondary treatment effluent (exit of biological unit)). The experiments were carried out in two laboratory-sized reactors with 4 L in volume made of Plexiglas. The reactor was filled with PET packing and the reactor was kept in a temperature-controlled water bath at 20˚C. Wastewater samples used in this experiment were collected from Wadi Al-Arab wastewater treatment plant in Irbid, Jordan. The concentrations of COD, TN, and TP were 280 mg/l, 41.74 mg-N/l and 9 mg/l, respectively in the primary effluents. Also, the concentrations of COD, TN, and TP were 58 mg/l, 61.55 mg-N/l and 33 mg/l, respectively in the secondary effluents. The removal efficiencies of COD, TN, and TP were 52%, 52% and 79% respectively when using the primary effluent as an influent to the reactor. On the other hand, when using the secondary effluent as an influent to the reactor, the removal efficiencies of COD, TN, and TP were 30%, 77%, and 81%, respectively. Thus, this technique could be used as a posttreatment step for conventional biological wastewater treatment.
Keywords:Wastewater Treatment; Nutrient Removal; Packed Bed Reactor

1. Introduction
The new regulations regarding the permitted concentration limit of wastewater treatment plant effluents such as biochemical oxygen demand (BOD), suspended solids (SS), phosphorus and nitrogenous compound (ammonia, nitrate and nitrite) have been changed during the last decays in both developed and developing countries. The nitrate contamination of water body’s results from wastewater discharges and the Nitrate contamination of drinking water have been recognized in many parts of the world [1] . For this circumstantial, the World Health Organization (WHO) has set the maximum contaminant levels (MCLs) in drinking water on  at 11.4 mg/L as N [2] . The US Environmental Protection Agency has set the (MCLs) for
  and
and  at 10 mg/L as N and 1.0 mg/L as N, respectively [3] . The Jordanian Ministry of Water and Irrigation (MWI) guidelines state that nitrogen in the form of ammonia should not exceed 10 mg-N/L in the discharged effluent [4] and the Canadian Ministry of Environment (MOE) stated the same guidelines with respect to ammonia [5] .
Other countries apply very strict environmental standards regarding the discharge of ammonia. Thus, it was critical to have a system that would consistently maintain a high standard of wastewater effluent.
Biofilm-based technology had the ability to remove nutrient from wastewater. This process considers the most economical method for decreasing nitrogenous compounds and phosphorus concentrations from municipal wastewaters [6] -[8] . However, the effect of different operational parameters such as the presence of organic matter, alkalinity and temperature on nutrient removal microorganisms is of much concern when designing wastewater treatment plants (WWTPs).
Packed Bed biofilm reactor (PBR) system has the potential to offer an innovative, effective, and low-cost solution for upgrading the conventional wastewater treatment systems. There is a very little research available on the performance of PBR systems with different types of wastewater that contain different levels of alkalinity and organic matter. Therefore, it is essential to carry out fundamental research to understand how the PBR system would perform with different types of wastewater samples, whether significant organic matter and nutrient removals can be achieved so that contaminated concentrations can be brought down considerably, and if the PBR process would be successful in providing additional treatment.
The objective of the present work is to study the performance and suitability of the PBR technology as a treatment for wastewaters taken from different points in the conventional wastewater treatment plant to achieve simultaneous organic matter and nutrient removal. This study is particularly interested in establishing organic matter and nutrient (nitrogen and phosphorus) removal rates using wastewaters taken from different points: (I) primary treatment effluent and (II) secondary treatment effluent (exit of biological unit).
2. Materials and Methods
2.1. Experimental Set Up
The Experiments were carried out in two laboratory-sized reactors with 4 L in volume. Wastewater samples used in this experiment were collected from primary effluent and secondary effluent of the treatment train. The wastewater was brought from Wadi Al-Arab wastewater treatment plant (WWTP) in Irbid, Jordan. The treatment plant is a conventional treatment process with capacity of 35,100 (m3/day). The effluents collected from the treatment plants were used as a feed for the packed bed reactor (PBR) with no further changes. These effluent streams were selected because it has been proposed that PBR process will be upgrades to current treatment process for organic matter and nutrient removals. The difference in organic matter content between primary and secondary effluent will be a suitable tool to follow up the effect of organic matter on the PBR performance. Table 1 shows the wastewater Characteristics entering the PBR system.
PBRs were run with Primary and secondary effluent wastewater from the beginning of February to the 10th of March, 2012 (69 days). The experimental setup used in this study is presented in Figure 1. The PBR with a total volume of 4 L were made of Plexiglas. The reactor was filled with (Polyethylene terephthalate) PET packing. The reactor was kept in a temperature-controlled water bath at 20˚C. Before operating the reactors with wastewater it was operated for 60 days at 20˚C with feeding the reactor by synthetic wastewater (SWW). The synthetic wastewater was used to develop the biofilm on the PET particles and to stabilize the reactor performance. The synthetic wastewater (SWW) was composed of (NH4)2SO4 (124 mg/L), NaHCO3 (286 mg/L), MgSO4·7H2O (71 mg/L), CaCl2·2H2O (29 mg/L), KH2PO4 (79 mg/L) and FeSO4·7H2O (5 mg/L).
2.2. Procedure
At the beginning of the experiment, the reactors were fed with synthetic wastewater (SWW), after that the feed to the PBR was prepared by mixing SWW with either primary or secondary effluent wastewater (real wastewater: RWW). The percentage of real wastewater (RWW) in the reactor feed was increased progressively until reaching 100% meanwhile, the temperature was kept at 20˚C. Table 2 shows the feed composition, total operating time, removal efficiencies in PBRs during start period.
2.3. Analytical Methods
Samples were collected daily from the PBR effluent, after that analyzed for , pH,
, pH,  ,
,  , CODt, CODdiss, and total phosphorus. Other routine tests BOD, total solid (TS) and volatile solid were carried out weekly.
 was measured according to standard method 4500-NH3 B and C [9] .
  was measured according to the diazotiation method using HACH powder pillows and HACH spectrophotometer.
  was measured using the HACH cadmium reduction method using HACH powder pillows and HACH spectrophotometer.
The chemical oxygen demand test was carried using HACK COD reagents following the standard methods section 5220D. Total phosphorous (Ptotal) were analysed as following the guidelines given by the standard methods. Biomass attached to carriers (TS) was measured by weighing dry biomass extracted from one carries and
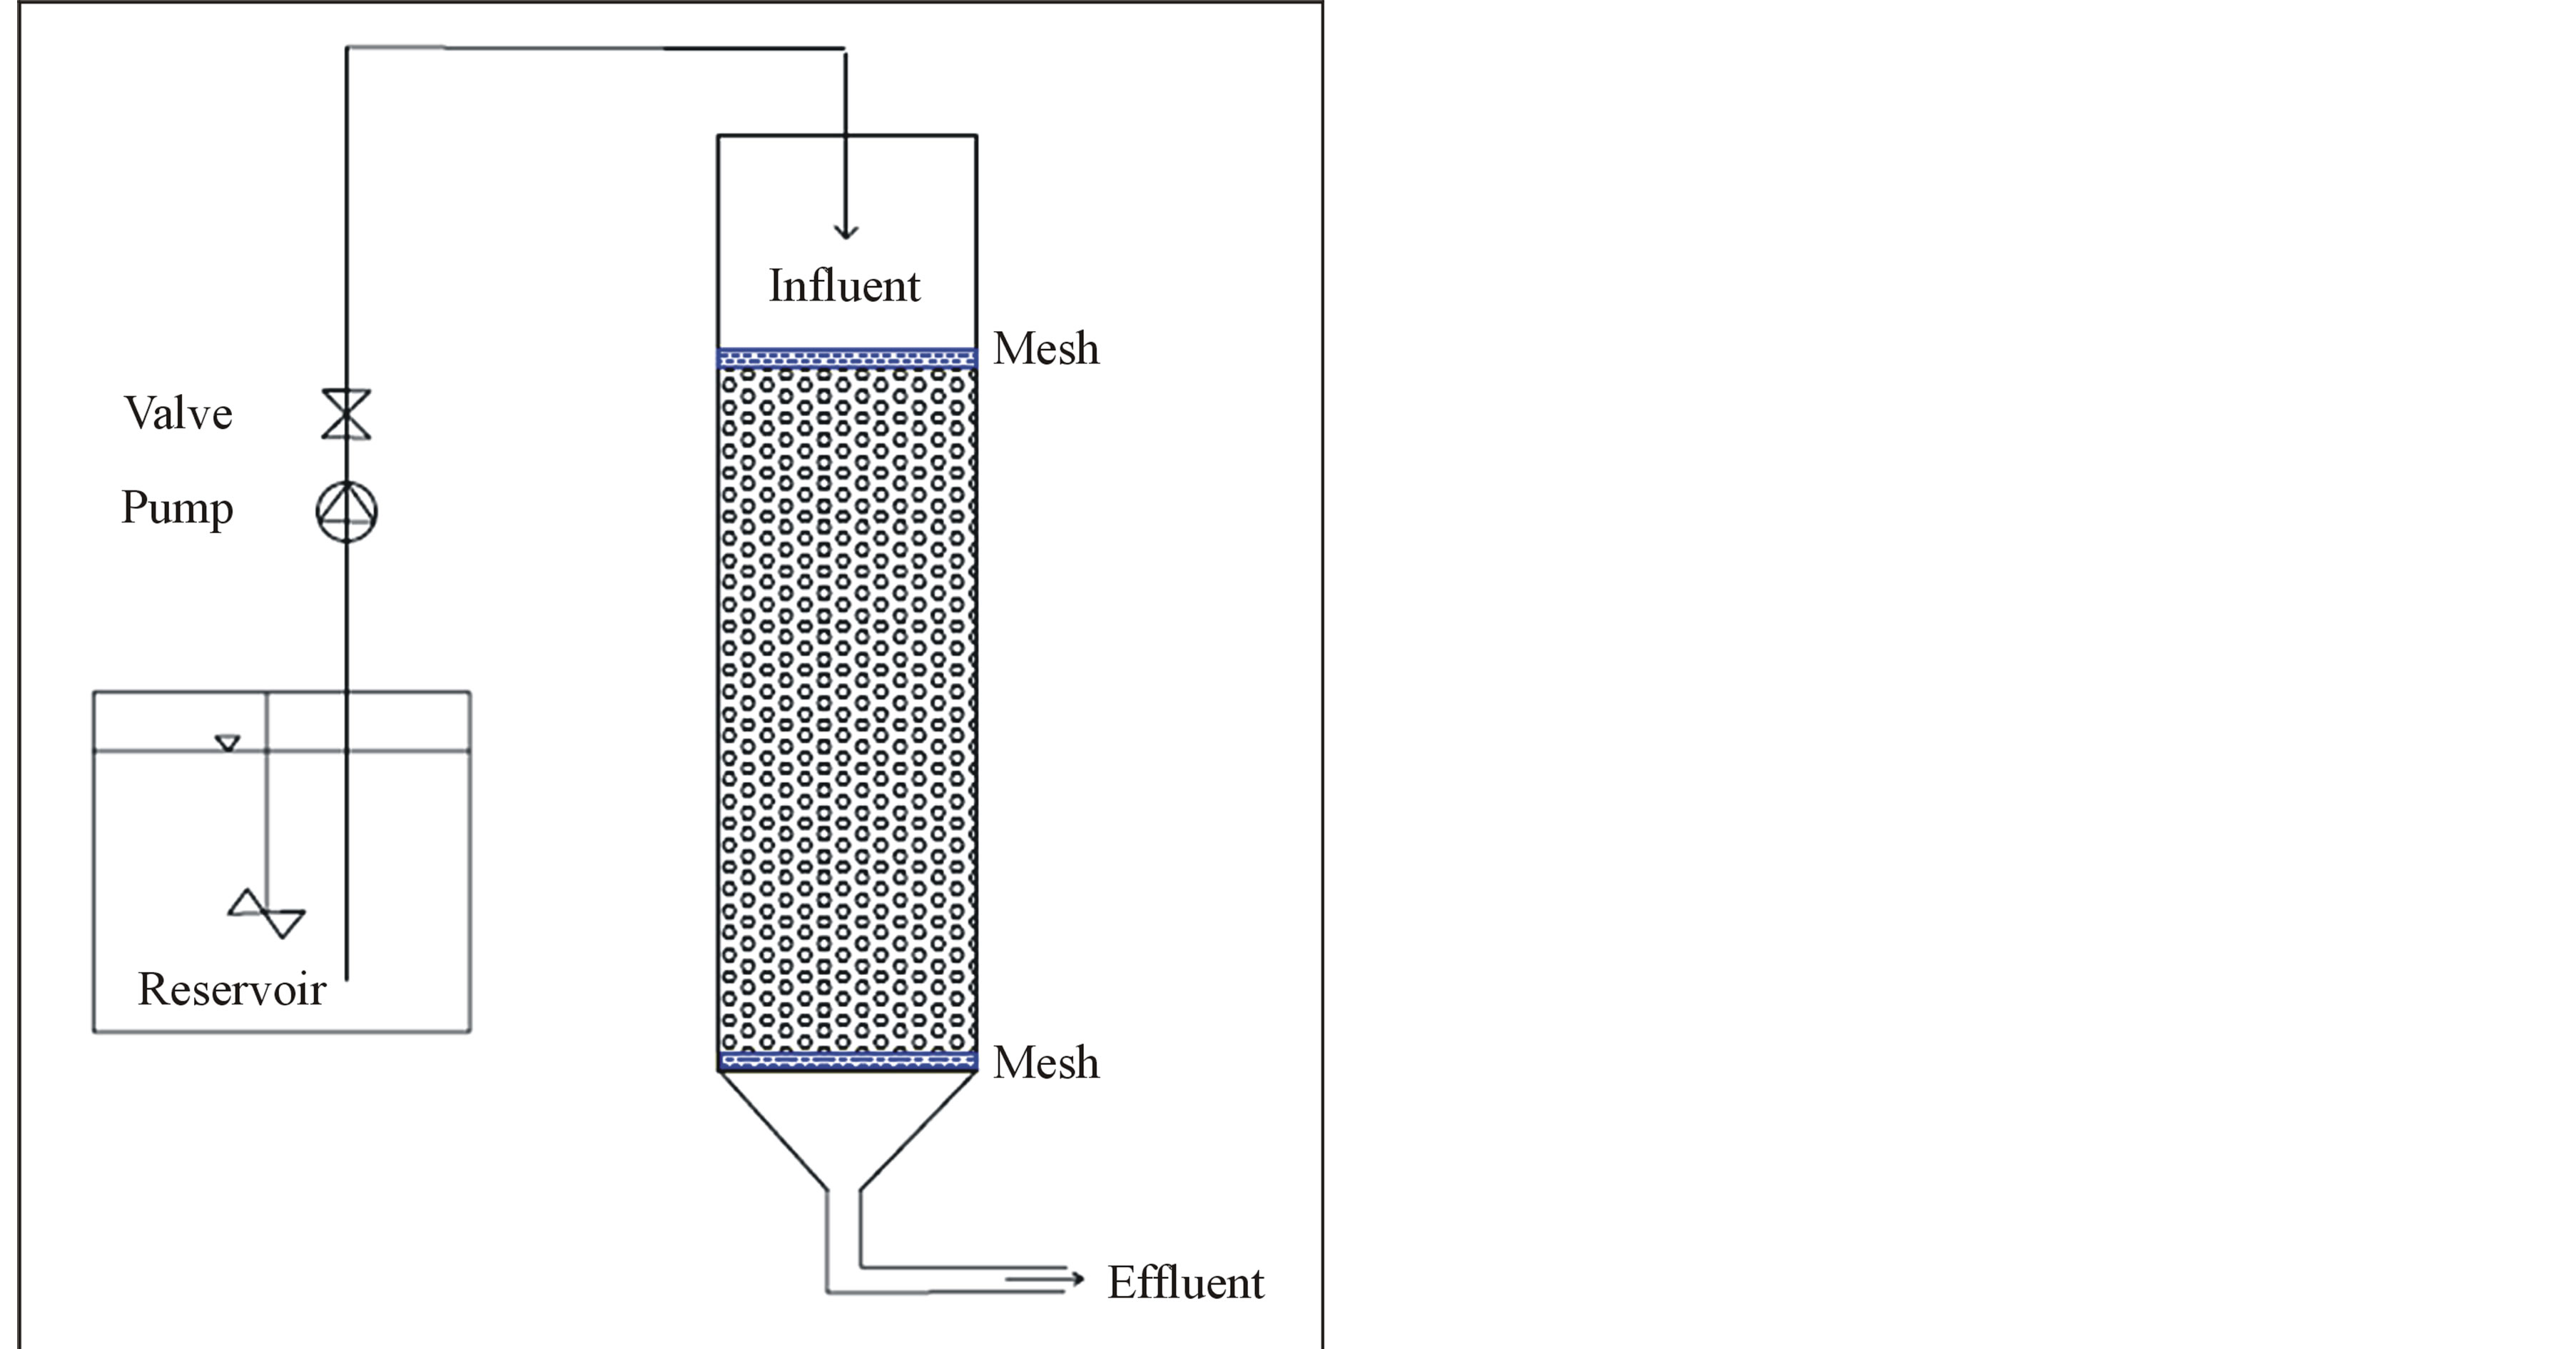
Figure 1. Experimental set-up.

Table 1. Characteristics of wastewater used as feed to PBR.
volatile solid were determined by the ignition of the extracted biomass at 550˚C for 15 minutes. Alkalinity was analyzed according to standard methods [9] .
3. Results
3.1. Start-Up of PBR
Figure 2 shows the percent of COD removal, total nitrogen and total phosphorus removal during the start-up of PBR.
Figure 2 shows that the removals percentage of COD, total nitrogen and total phosphorus are highly dependent on the reactor feed composition. There is a clear difference between the performances of the reactors when the feed changed from SWW to RWW. Changing the composition of the feed had a direct effect on TN, COD and TP removals. Figure 2(a) and (b) show that the increasing in the % of primary or secondary wastewater in the reactor feed resulted in a significant decrease in TN, COD and TP removals. This decrease demonstrates that the change in influent wastewater characteristics has a critical effect on the metabolic activity of bacteria and so in the rate of nitrogen compound removals. The effect that can be clearly noticed during the first (20% RWW) and second (50% RWW) change in feed composition. As shown in Figure 2(a), upon changing the feed composition from 0% to 20% secondary wastewater effluent, the reactor showed a decrease in total nitrogen removal from 71.5% to 63.2%. However, the removal rate seems to stabilize after the percent of secondary wastewater
Table 2. Feed composition, total operating time, COD removal, total nitrogen and total phosphorus removal during the startup of PBR.

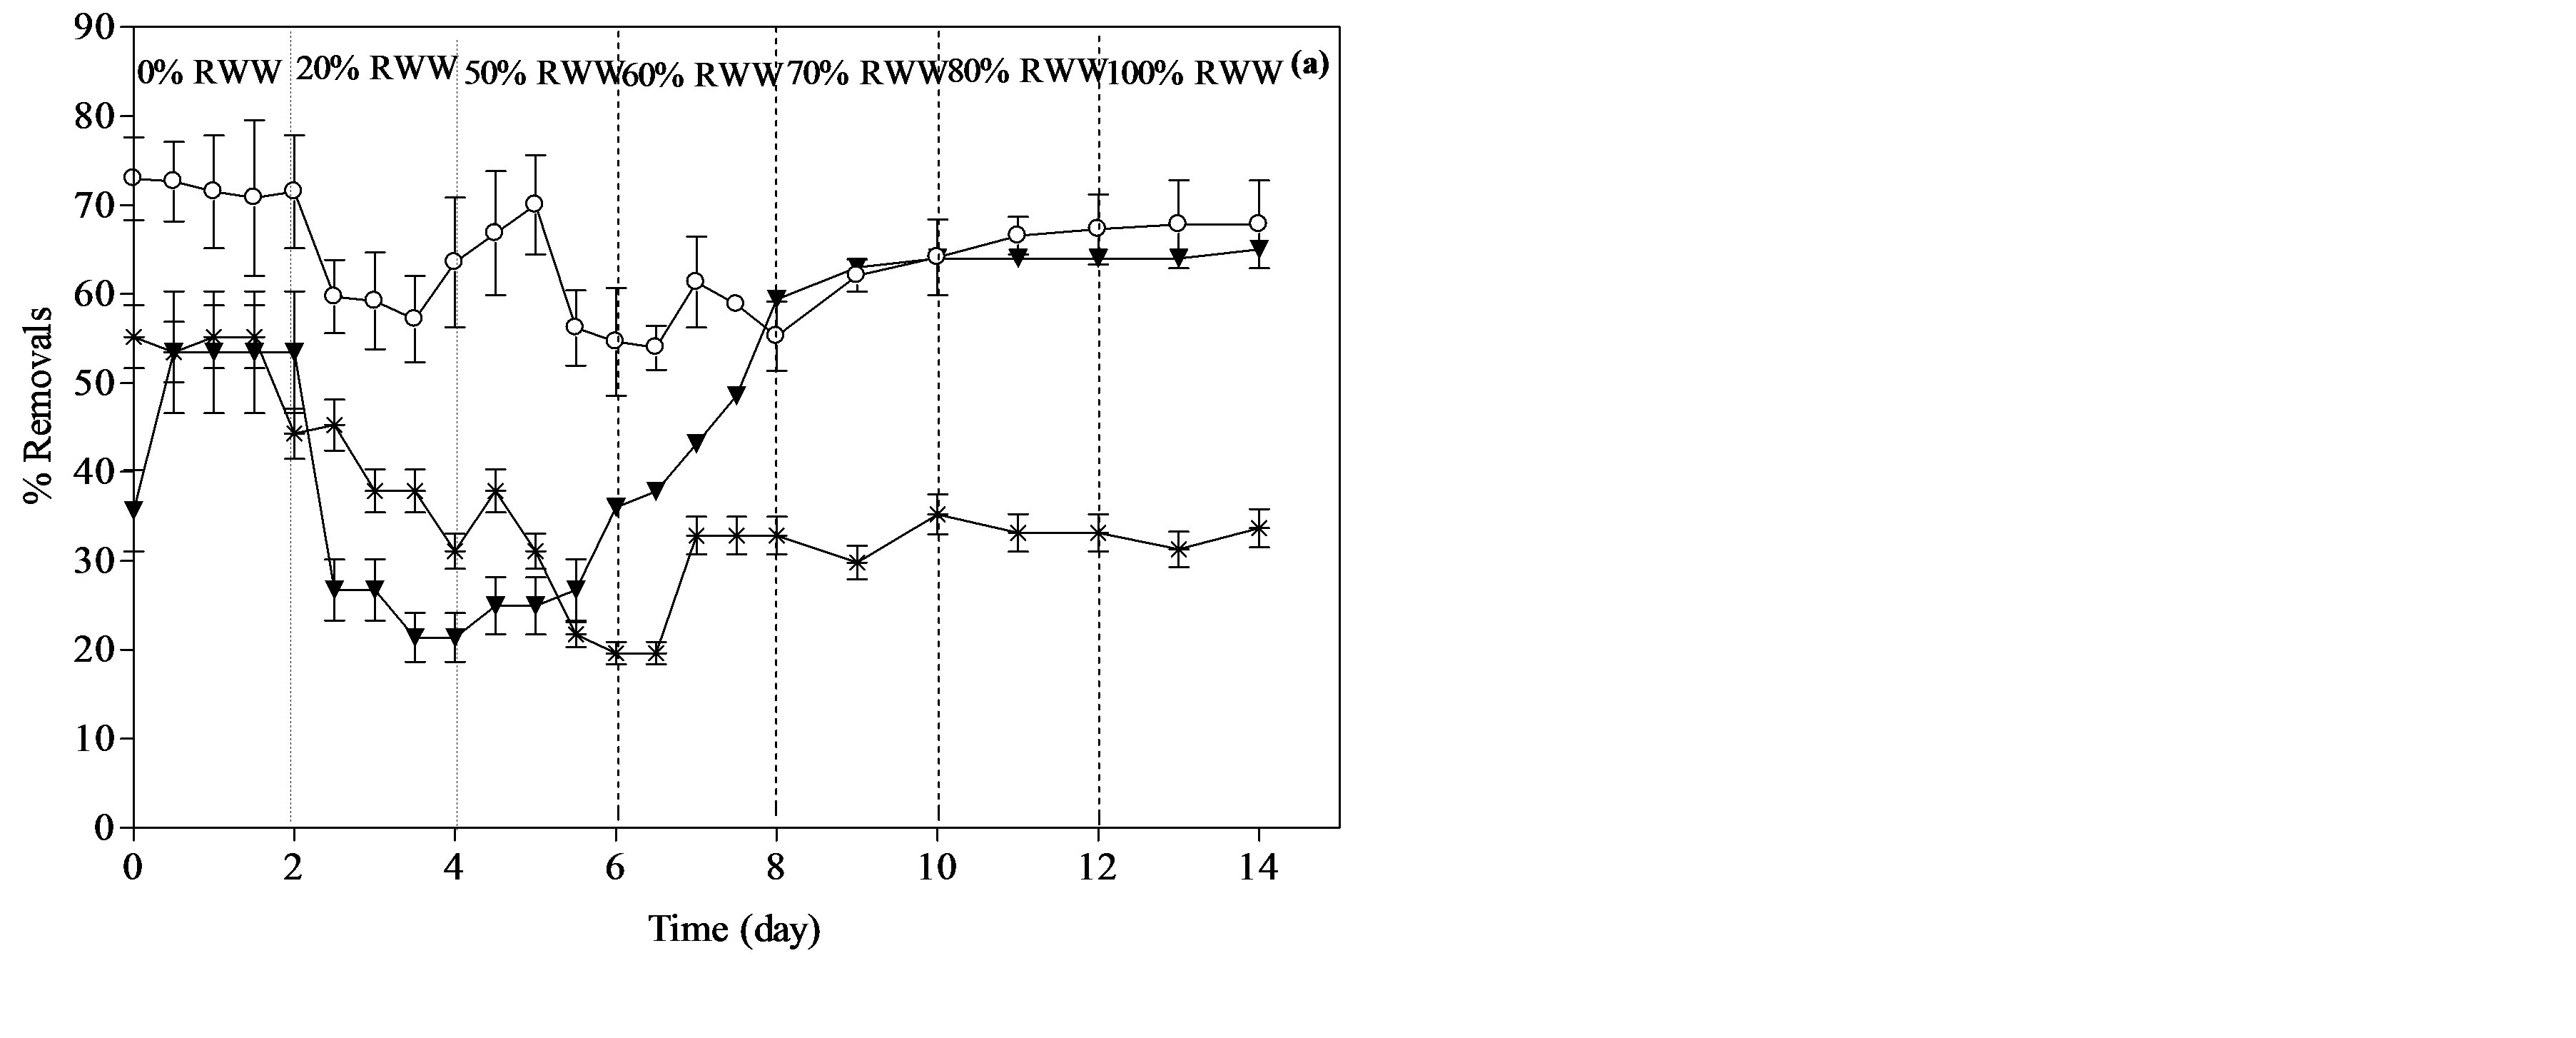
Figure 2. Percent removals of COD, total nitrogen and total phosphorus during the start-up of PBR. (a) PBR fed with secondary effluent and (b) PBR fed with primary effluent.
reaches 70%. A Similar trend was observed with the reactor which fed by primary effluent. However, the % removal with this wastewater ranged from 30% to 42% with an average value of 38%. It was noticed that the % removals achieved with primary effluent in less than the removals with the reactor fed by secondary effluent. The total solids and volatile solids during the start-up of the reactor were measured daily. The total solids and volatile solids at day 2 of the start-up for the reactor fed by secondary wastewater were 1.35 ± 0.05 g/L and 0.96 ± 0.03 g/L, respectively. Total solids and volatile solids for the reactor fed by primary wastewater at day 2 were 1.25 ± 0.05 g/L and 0.89 ± 0.03 g/L, respectively. After 14 days of start-up period, these values were slightly decreased to be 1.3 ± 0.05 g and 0.93 ± 0.03 g/L for reactor fed with secondary wastewater and be 1.2 ± 0.05 g and 0.86 ± 0.03 g/L for the reactor fed by primary wastewater, respectively. The decrease in the attached biomass suggests that the mass of biofilm within the reactors started to change during the start-up period.
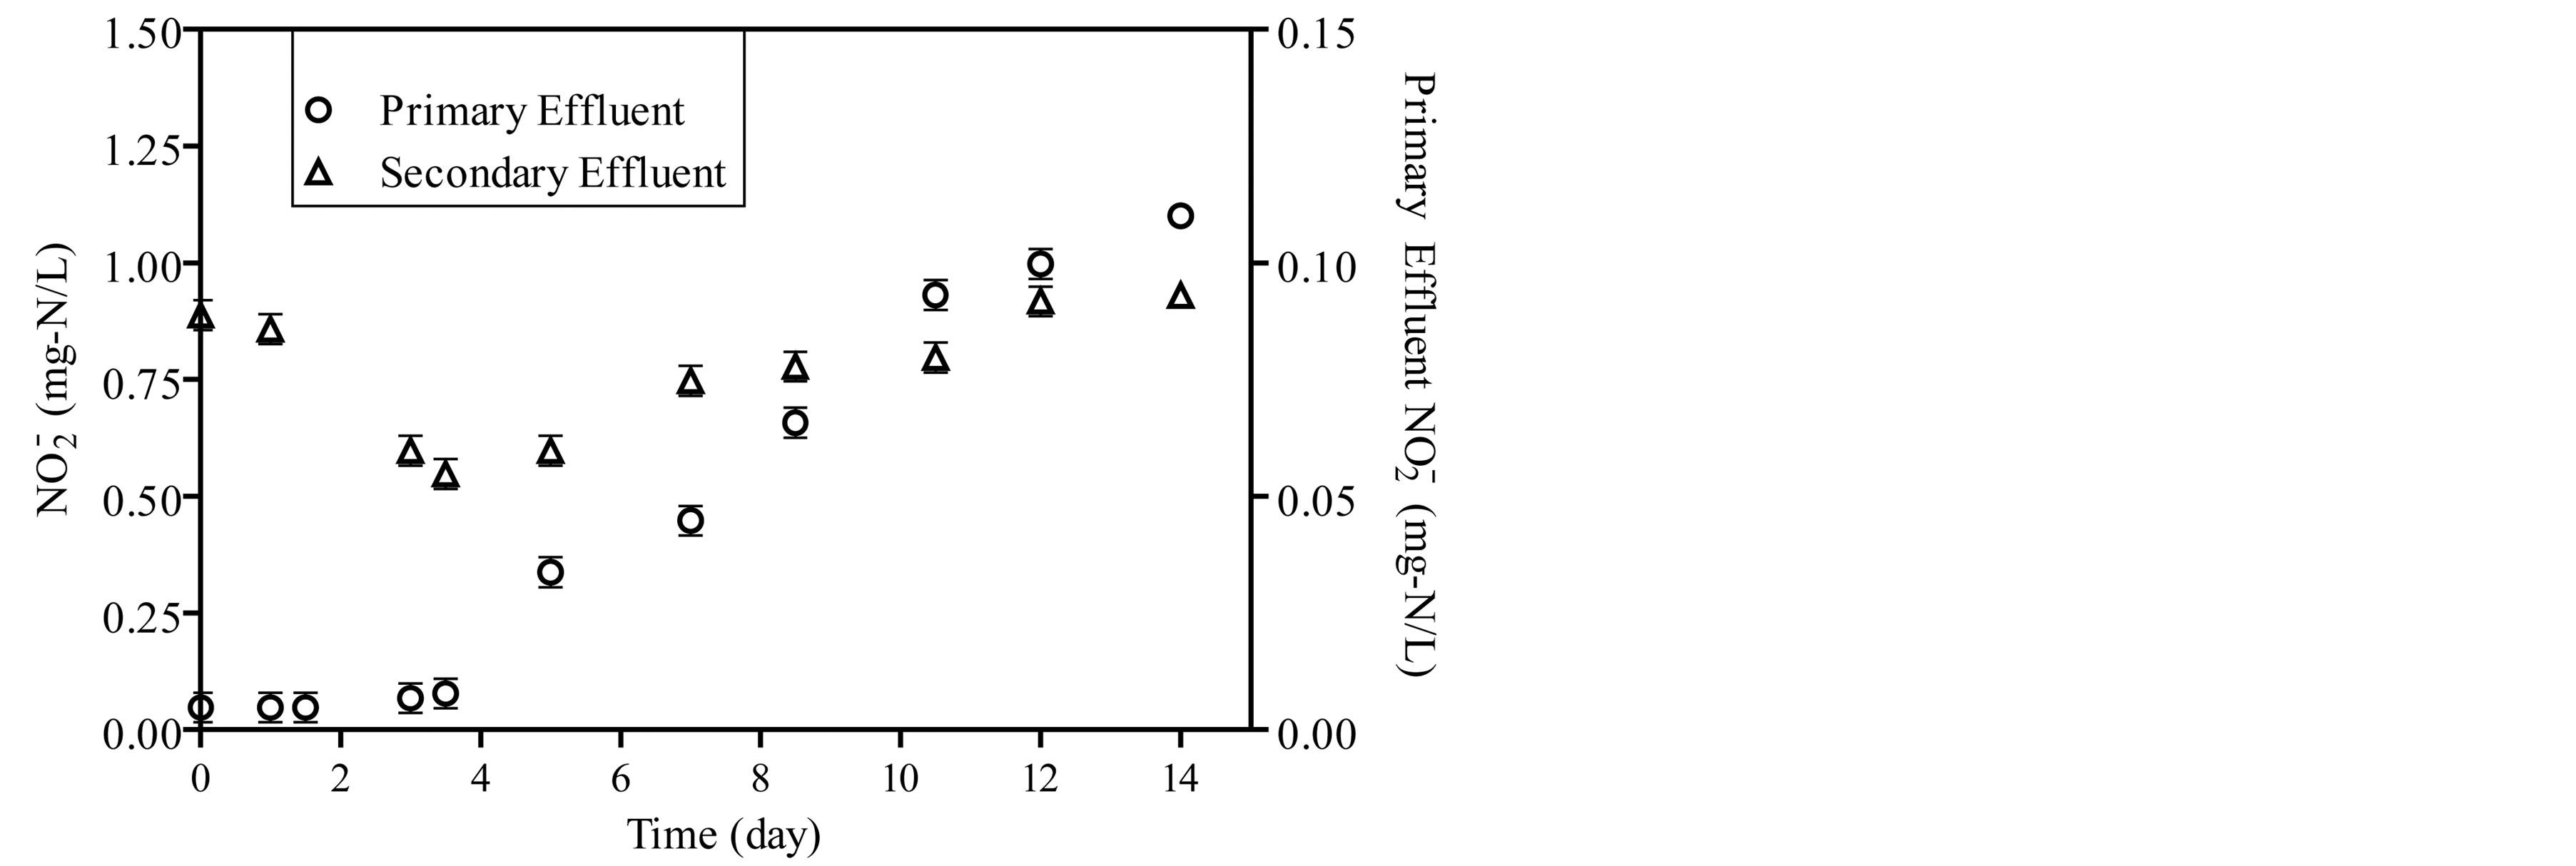
The concentrations of ammonia, nitrite and nitrate were monitored during the start-up period as shown in Figure 3. Ammonia concentration decreases as a function of incubation time and stabilize after 14 days as shown in Figure 3(a). The concentration of nitrite in the reactor fed by primary effluent ranged from 0.005 to 0.11 mg-N/L and from 1.05 to 2.1 mg-N/L in reactor fed by secondary effluent as shown in Figure 3(b). For the same period, the concentration of nitrate ranged from 1.2 mg-N/L to 2.1 mg-N/L in the reactor which is fed by primary effluent and from 9.6 mg-N/L to 28.4 mg-N/L in a reactor which is fed by the secondary effluent as shown in Figure 3(c).
3.2. Organic Matter and Nutrient Removals
3.2.1. Organic Matter Removals
Figure 4(a) shows the % removal of COD in PBR which are fed by primary and secondary effluents during steady state operation. An average of 52% and 30% of COD removals were achieved for Primary and secondary wastewaters, respectively. The difference in percent removals between the two different wastewaters indicates
 (a)
(a)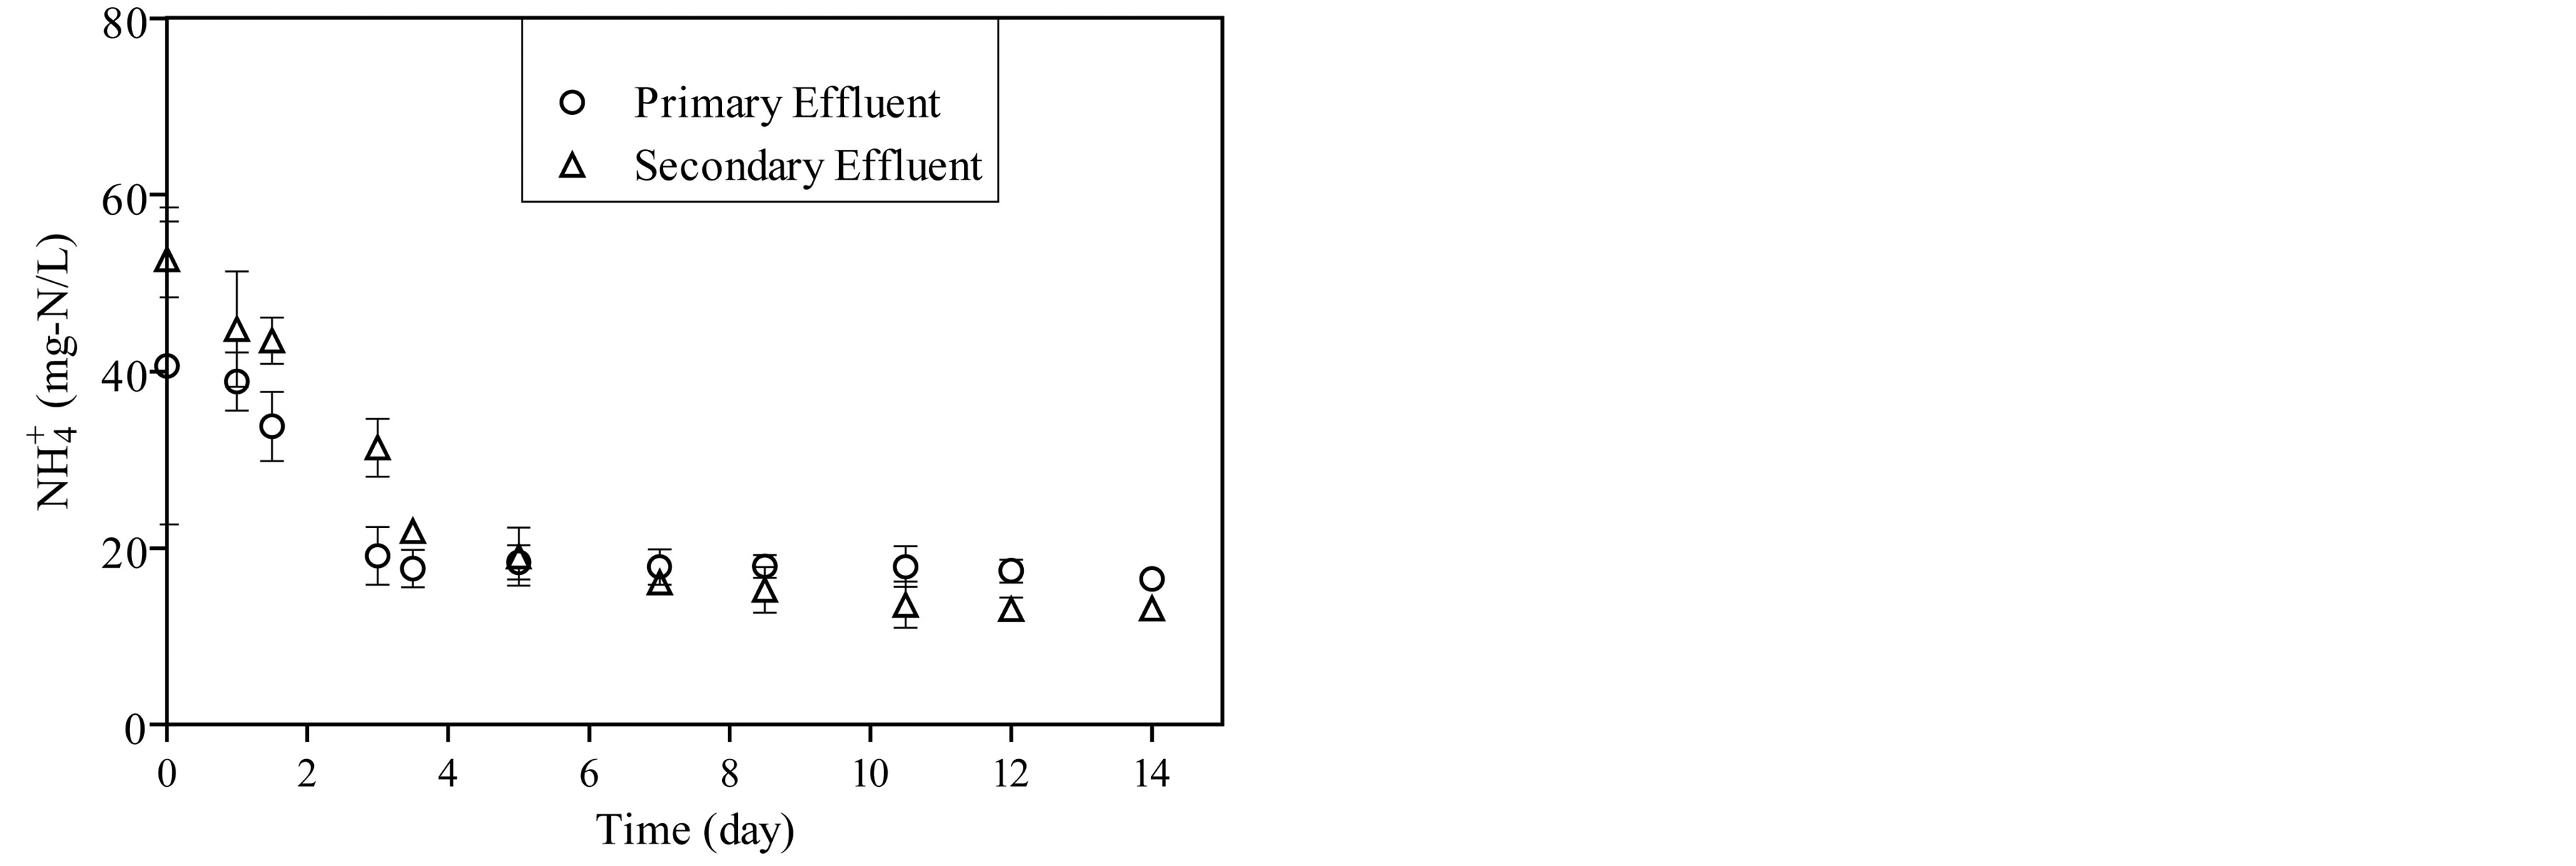 (b)
(b)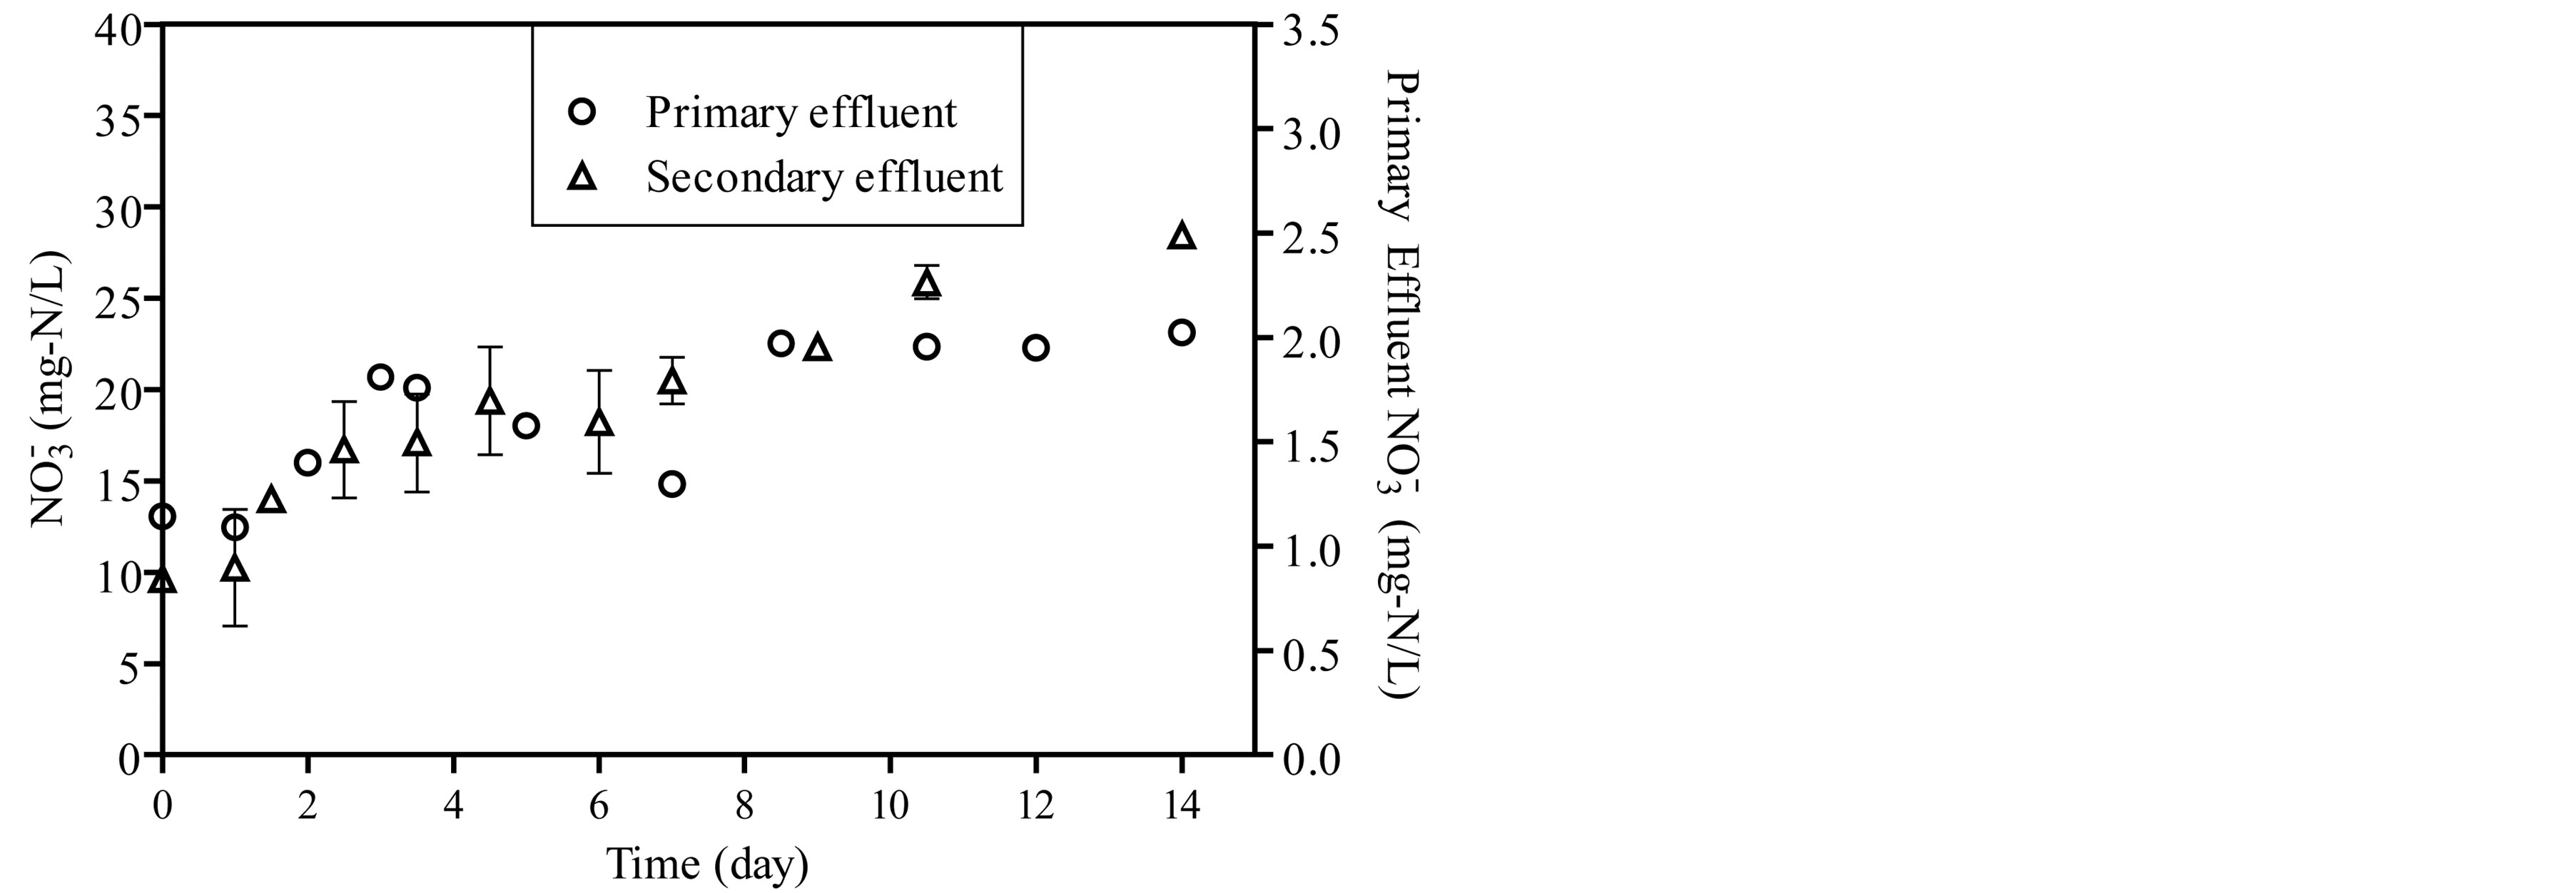 (c)
(c)
Figure 3. The concentration of ammonia, nitrite and nitrate during start-up period of the reactors.
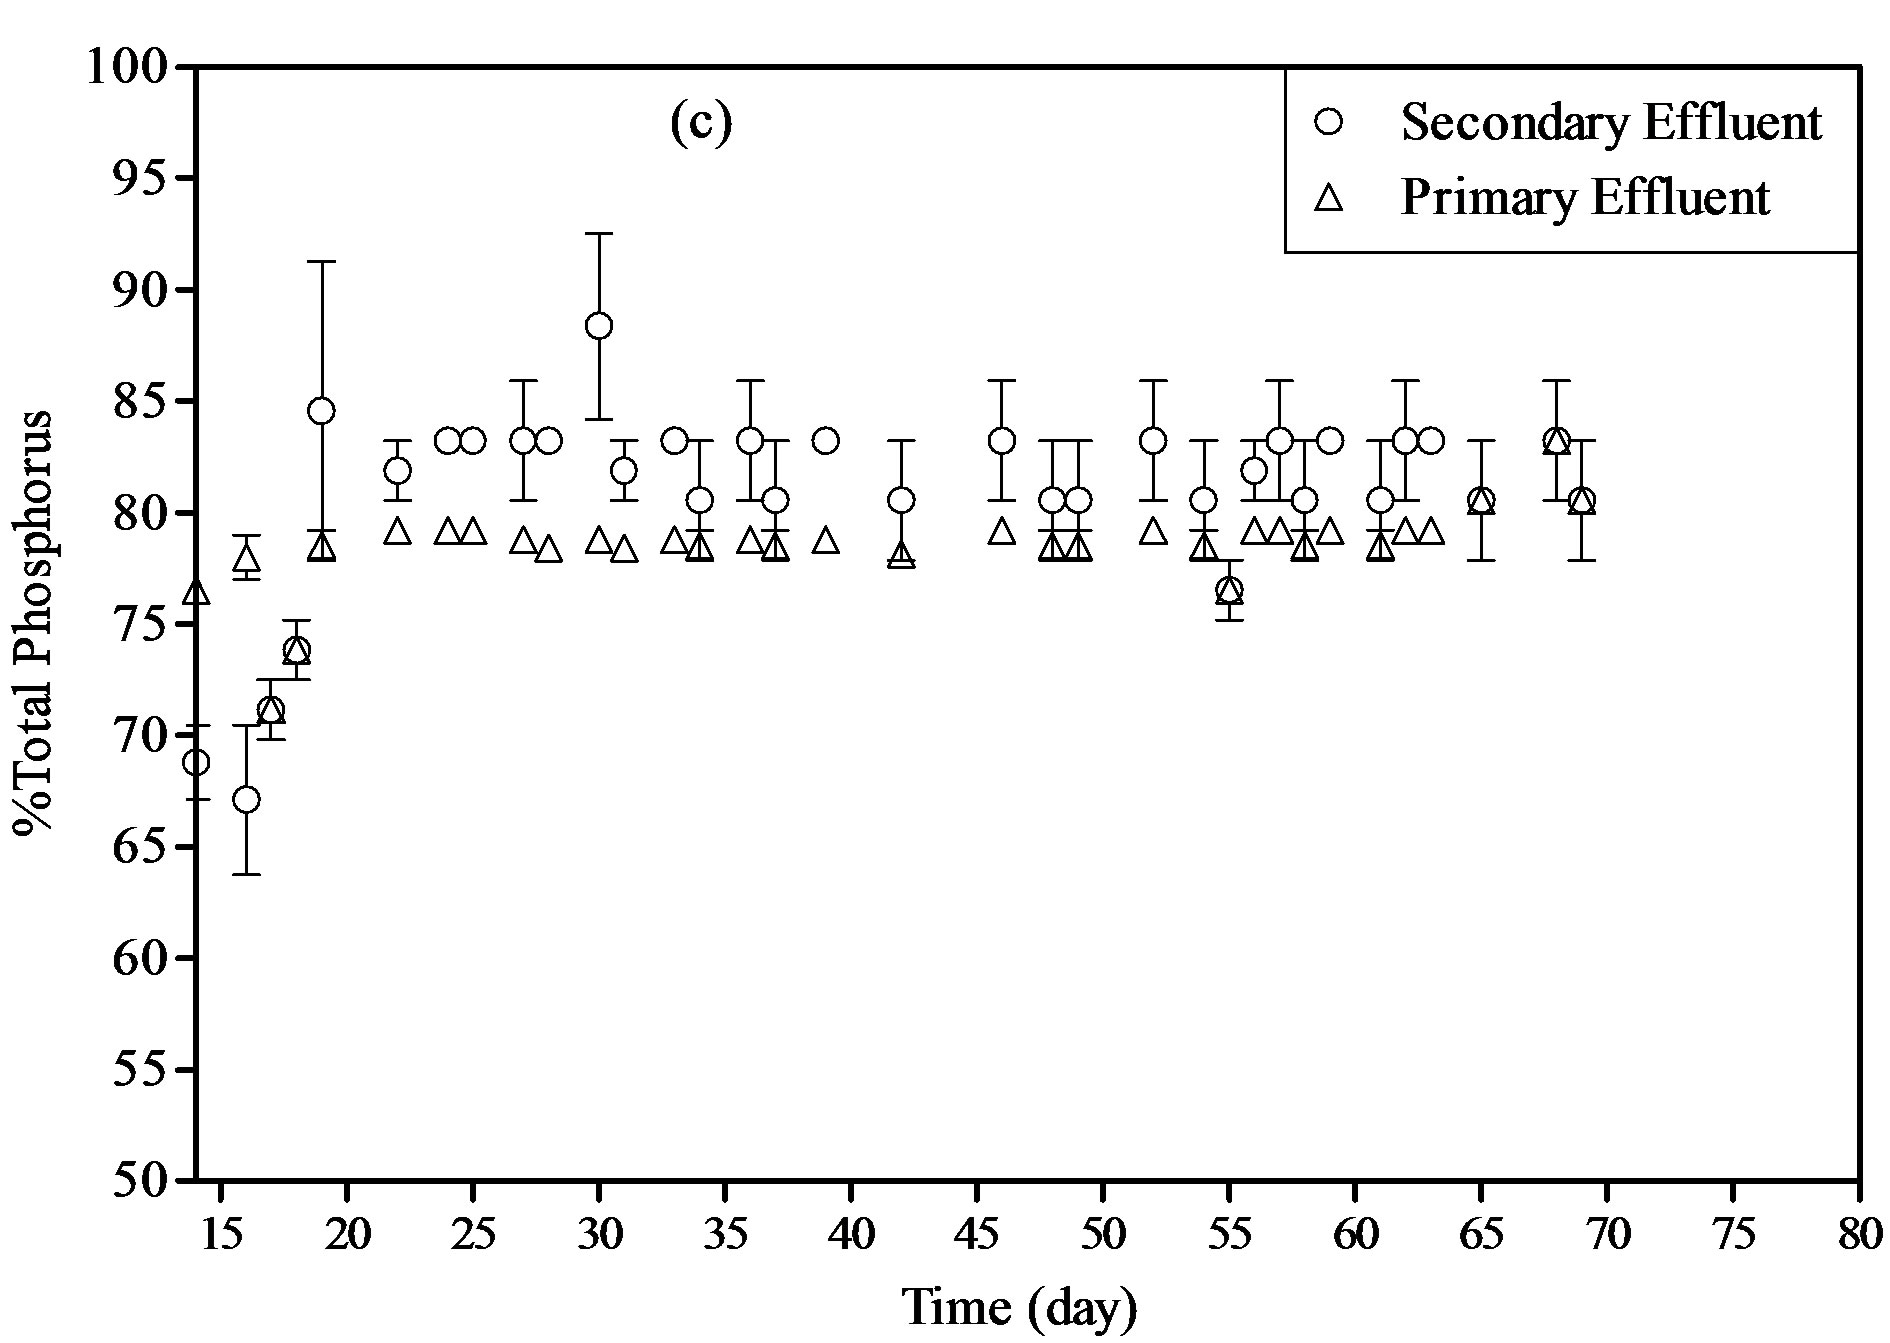

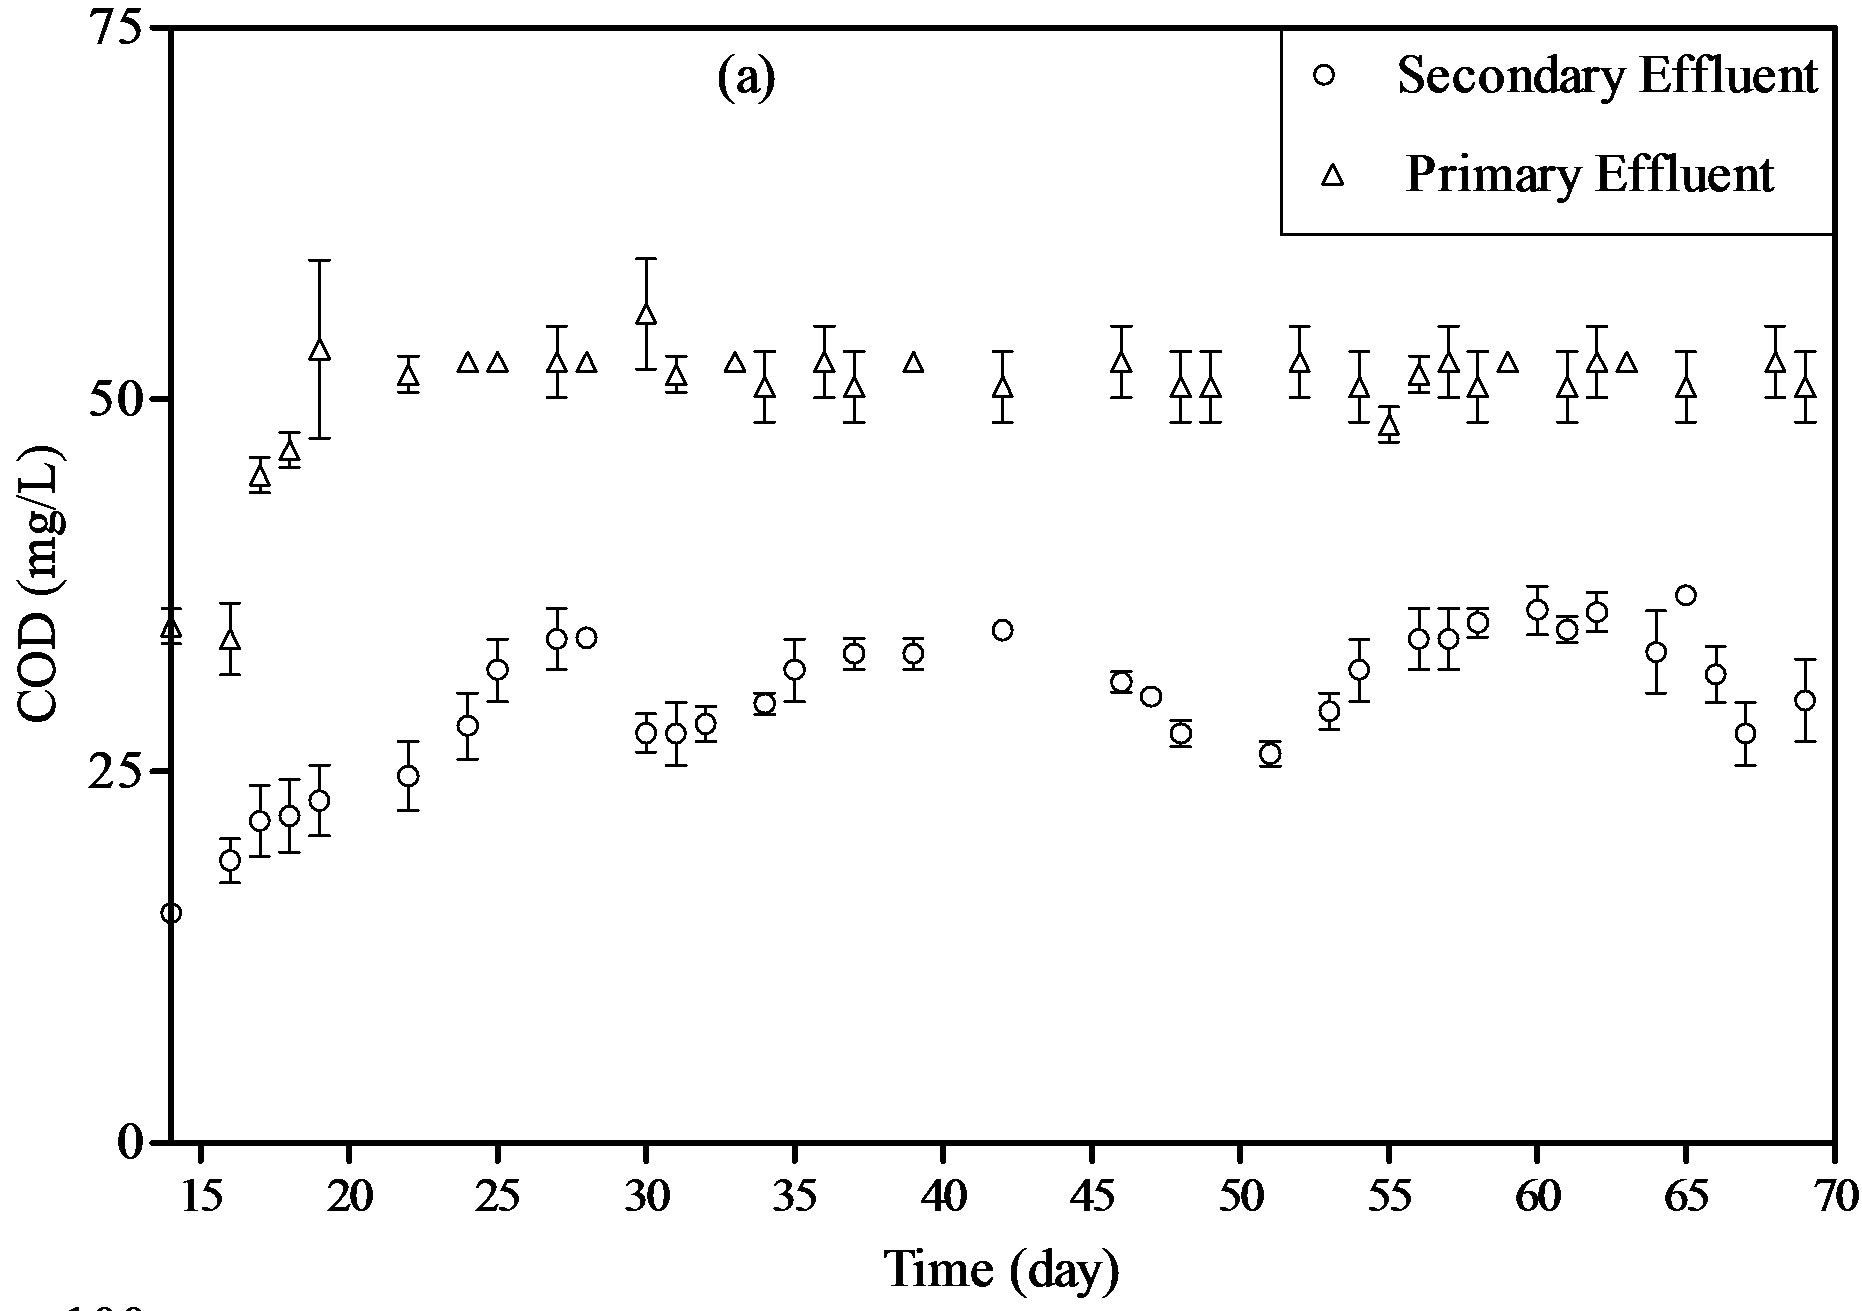
Figure 4. % removal of COD, TN and TP in PBR fed by primary and secondary effluents under steady state operation.
that there are two different metabolic pathways of organic matter uptake. Although the organic substances may function directly as an essential organic nutrient or act as an accessory growth factor, organic matter uptake depends on the type and the concentration of these organic matters in the wastewater. Bacterial growth can proceed in a much faster way if the available carbon in the solution can be directly incorporated for material production.
The organic matter present in primary effluent can be considered as an easy source of carbon for the bacteria. Thus, higher % COD removal reached a steady state value during the 55 days of operation with this water. On the other hand, carbon materials in the secondary effluent are mostly inert after activated sludge treatment and thus cannot be further utilized by bacteria. When the organic substrate is not available, autotrophic growth uses CO2 as the carbon source, excreting small molecular organic substances such as glycolic acid to the water solution as a product of carbon reduction, which is the reason why the % COD removal decreases every 20 days
Table 3. Average dissolved oxygen, pH range, hydraulic retention time, organic and nitrogen loading rate, chemical and ammonia removals during the operation of R1 and R2 at 20˚C.
(day 30 and day 50) of PBR operation with this wastewater.
3.2.2. Nitrogen Removal
Figure 4(b) shows the total nitrogen removal percentage during the steady state operation for both PBRs. Nitrogen removals (oxidation of ammonia) from wastewaters was studied in PBRs operated at 20˚C and fed by primary and secondary wastewater effluents. Nitrogen in the form of NH4-N, NO3-N and NO2-N are the only inorganic nitrogen can be found in primary and secondary effluents of wastewater. It was observed that ammonia-nitrogen, was significantly reduced in both wastewater samples. The average TN removal rates for primary and secondary effluents were 52% and 77%, respectively. This study showed that PBR could use to reduce the TN from wastewater.
Nitrite and nitrate concentration inside the reactors were monitored daily. The concentration of nitrite with the reactor fed by primary effluent ranged from 0.08 to 0.2 mg-N/L (average value 0.12) and from 0.06 to 0.25 mg-N/L (average value 0.1) with the reactor fed by secondary effluent. Concentration of nitrate ranged from 1.8 mg-N/L to 2.11 mg-N/L and from 15 mg-N/L to 29 mg-N/L in both reactors, respectively. Table 3 shows the average dissolved oxygen, pH range, organic loading rate (OLR) and nitrogen loading rate (NLR) as well as nitrogen removal rate during experimental period.
3.3.3. Phosphorus Removal
The results showed that the removal of phosphorus reached 79% and 81% for primary and secondary wastewater samples, respectively. The inorganic N/P ratios of the two wastewaters used in feeding the reactor was calculated and found to be ranged from 3.2 to 3.9 g-N/g-P in primary influent and from 2.1 to 2.5 g-N/g-P in secondary influent. According the results obtained from this work, it can be seen that the unbalanced N/P ratio in both wastewater samples had no effect in nitrogen and phosphorus removals, suggesting that the PBR can be used for nutrient removal from wide varieties of wastewater nevertheless the absolute levels of N and P in this wastewater.
4. Conclusion
Attached growth packed bed biological process preserved significant rates of organic matter and nutrient ammonia removal with short hydraulic retention time of 8 hrs. The treatment process was effective in removing organic matter from primary (52%) and secondary (30%) wastewater with organic 0.515 kg COD/m3·d and 0.315 kg COD/m3·d for primary and for secondary wastewater, respectively. Nitrogen removal rates with an average of 0.45 kgN/m3·d and 0.55 kgN/m3·d were removed from primary and secondary wastewater even at moderate nitrogen loading rates of 0.135 kg N/m3·d and 0.121 kg N/m3·d for primary and secondary wastewater, respectively.
References
- Pelley, J. (1998) Is Coastal Eutrophication out of Control? Environmental Science and Technology, 32, 462A-466A. http://dx.doi.org/10.1021/es983777p
- Mateju, V., Cizinska, S., Krejci, J. and Janoch, T. (1992) Biological Water Denitrification-A Review. Enzyme and Microbial Technology, 14, 170-183. http://dx.doi.org/10.1016/0141-0229(92)90062-S
- United States Environmental Protection Agency (USEPA) (2002) EPA 816-F-02-013. List of Drinking Water Contaminants and MCLs.
- Government of Jordan (2003) Technical Regulation for Reclaimed Domestic Wastewater. JS893/2002, Jordan Institution for Standards and Meterology, Amman.
- Awadalla, F.T., Striez, C. and K., L. (1994) Removal of Ammonium and Nitrate Ions from Mine Effluents by Membrane Technology. Separation Science and Technology, 29, 483-495. http://dx.doi.org/10.1080/01496399408002157
- Pramanik B., Fatihah S., Shahrom Z. and Ahmed E. (2012) Biological Aerated Filters (BAFS) for Carbon and Nitrogen Removal: A Review. Journal of Engineering Science and Technology, 7, 428-446.
- Khorsandi, H., Movahedyan, H., Bina, B. and Farrokhzadeh H. (2011) Innovative Anaerobic Upflow Sludge Blanket Filtration Combined Bioreactor for Nitrogen Removal from Municipal Wastewater. International Journal of Environmental Science and Technology, 8, 417-424. http://dx.doi.org/10.1007/BF03326228
- Metcalf, E. (2003) Wastewater Engineering: Treatment and Reuse. 4th Edition, McGraw-Hill, New York.
- APHA; AWWA; WEF (1998) Standard Methods for the Examination of Water and Wastewater. 20th Edition, American Public Health Association, Washington DC.