Journal of Environmental Protection
Vol. 4 No. 7A (2013) , Article ID: 34121 , 12 pages DOI:10.4236/jep.2013.47A002
Macroinvertebrate Assemblage Changes as an Indicator of Water Quality of Perennial Endorheic Reed Pans on the Mpumalanga Highveld, South Africa
![]()
1Natural Resources and the Environment, The Council for Scientific and Industrial Research (CSIR), Pretoria, South Africa; 2Department of Zoology, University of Johannesburg, Johannesburg, South Africa; 3Water Research Group, Unit for Environmental Science and Management, North-West University, Potchefstroom, South Africa.
Email: *adklerk@csir.co.za
Copyright © 2013 Arno R. de Klerk, Victor Wepener. This is an open access article distributed under the Creative Commons Attribution License, which permits unrestricted use, distribution, and reproduction in any medium, provided the original work is properly cited.
Received May 6th, 2013; revised June 7th, 2013; accepted July 8th, 2013
Keywords: Reed Pan; Endorheic Wetland; Macroinvertebrates; Mpumalanga
ABSTRACT
Reed pans are a very uncommon type of endorheic wetland, and as such the amount of information available is very limited. Thus, they are being impacted on by various agricultural, livestock and other anthropogenic activities. The objectives of this study were to determine the spatial and temporal variations of macroinvertebrate community structures in reed pans and the environmental factors (i.e., water quality) responsible for the maintenance of these structures. Reed pans were studied over four different seasons, during which time subsurface water, sediment and macroinvertebrate samples were collected and analyzed. The reed pans studied showed that the macroinvertebrates were able to reflect various changes in reed pans with regard to seasonal variability and anthropogenic impacts on water quality. These anthropogenic impacts caused the disappearance of sensitive macroinvertebrate taxa and the increase of tolerant macroinvertebrate taxa.
1. Introduction
Pans are found throughout the world and are predominantly concentrated in arid regions. These areas include North America, Argentina, Brazil, southern and central Africa as well as southern and western Australia. Pans are also present in most of South Africa’s neighboring countries, including Namibia, Botswana and Zimbabwe [1]. In South Africa, most of the pans are situated in the arid north-western regions in areas with a mean annual rainfall of 500 mm [2]. However, in the eastern province of South Africa (Mpumalanga) is an area densely covered with about 320 pans (of which ± 2.3% are reed pans) and known as the Mpumalanga Lakes District (MLD) [3,4]. Unlike other pan fields in the country, the MLD is situated in a relatively humid area with a mean annual precipitation of between 800 and 1000 mm [5]. It is in this area that a different type of wetland is found in South Africa, namely reed pans. Reed pans, which are classified as a type of pan [6], are usually defined as containing dense colonies of reeds and sedges [7], as well as a floating reed-covered mat within the pan, with high water levels maintained throughout the year [4].
Aquatic ecosystems, for example reed pans, can be affected by a variety of human activities. These include point-source pollution (e.g., factories or sewage works), non-point source pollution (e.g., runoff from agriculture, urban or mining areas), changing characteristics (e.g., through sedimentation), the removal of riparian vegetation or the introduction of exotic or alien species [8]. These activities are known to impact the integrity of these systems and as such scientific techniques are used to indicate environmental integrity. The use of biological indicators is known to supplement conventional chemical and physical monitoring and greatly improves the assessment of the ecological integrity of water resources [8,9]. The most commonly used aquatic organisms for biomonitoring are aquatic macroinvertebrates [10]. They can act as indicators of disturbance, because they are adapted to specific habitats, substrate types, temperature, dissolved oxygen, etc., and thus these disturbances are reflected in the changes of the types and abundances of aquatic macroinvertebrates [11,12]. These changes are able to indicate alterations as a result of human-induced disturbances [13]. Aquatic macroinvertebrates are particularly sensitive to organic and various other compounds [14] and they have the ability to integrate these effects during their lifetime [9].
Most of the pans in South Africa are mainly shallow and temporary in nature. These temporary waters are usually host to diverse taxa, often mainly characterized by crustacean orders, where some might only be represented by larval stages [15]. Due to the differences in the inundation period between the non-perrenial pans and their perennial counterparts we expected that the macroinvertebrate assemblages would also differ vastly. In contrast to the perennial pans in the MLD (especially reed pans), pans in the north-western regions of South Africa have been the focus of most studies conducted on pans in South Africa. Perennial pans are also very scarce in South Africa (especially reed pans).
Because of the limited information available on these wetlands and in the face of ever increasing land use activities, a study was deemed necessary to evaluate the macroinvertebrate assemblages present in reed pans and their seasonal changes. This study is a first attempt to gather sufficient information on macroinvertebrate assemblages in reed pans so as to determine the use of these organisms as biological indicators of the environmental integrity (namely water quality) of reed pans. Thus, the aim of this study was to determine the temporal and spatial changes in the aquatic macroinvertebrate assemblages within reed pans, over different seasons and hydrological extremes on the Mpumalanga Highveld in South Africa.
2. Materials and Methods
2.1. Study Area
This study was conducted within the MLD near the town of Chrissiesmeer in the Mpumalanga Province, South Africa. Four reed pans were selected in the Chrissiesmeer area (Figure 1) that were sampled during four consecutive seasons, namely Autumn (AUT), Winter (WIN), Spring (SPR) and Summer (SUM). In so doing we were able to account for the different hydrological extremes experienced within these wetlands. The four selected reed pans, namely Klein Tevrede se Pan (KT), Groot Tevrede se Pan (GT), Goedverwachting se Pan (GO) and Swaeltjie Pan (SW) were selected due to ease of accessibility, as well as the fact that they are impacted upon by adjacent land use practices (which includes dryland ag-
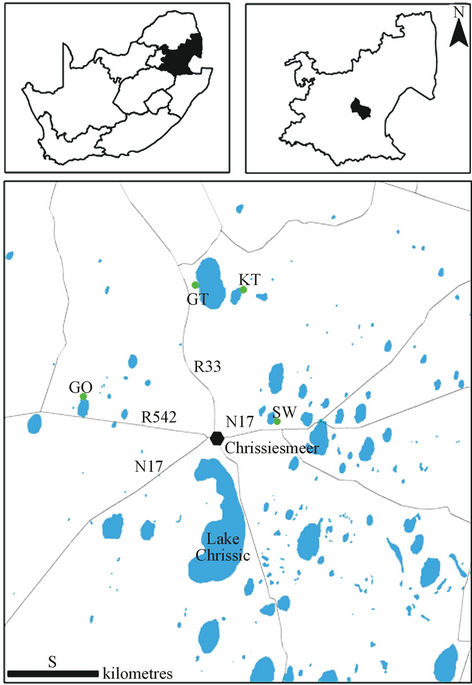
Figure 1. The four reed pans selected for the purpose of this study. Insert maps on the top left and right indicate the study area within South Africa and Mpumalanga, respectively. KT represents Klein Tevrede se Pan, GT (Groot Tevrede se Pan), GO (Goedverwachting se Pan) and SW (Swaeltjie Pan).
riculture, intensive irrigation and livestock) to varying degrees.
2.2. Water Quality
During this study a detailed chemical assessment of the surface waters of the four selected reed pans was carried out and published in [16]. This included measuring in situ water quality parameters (pH, temperature, conductivity as well as dissolved oxygen) using Eutech Instrument’s handheld water quality meters. Water samples were collected in triplicate using pre-cleaned polypropylene containers and analysed for ammonium ( ); nitrate (
 ); nitrite (
 ), phosphate (
 ), chemical oxygen demand (COD) and turbidity using a Merck Spectroquant Photometer SQ 118.
Chlorophyll a was analyzed within 24 hours of sampling according to the methods described in [17,18]. Chlorophyll a concentrations were calculated according to the equations described by [19]. The concentrations of dissolved metals in the water samples were measured using an Inductively Coupled Plasma—Optical Emission Spectrometer (ICP-OES), as well as an Inductively Coupled Plasma—Mass Spectrometer (ICP-MS). The following metals were analyzed, namely arsenic (As), cadmium (Cd), chromium (Cr), copper (Cu), iron (Fe), lead (Pb), manganese (Mn), molybdenum (Mo), nickel (Ni), selenium (Se), strontium (Sr), uranium (U) and zinc (Zn).
For the purposes of this paper only the most influential variables of the selected abiotic variables mentioned above, as determined in [16], will be used. Quality control and quality assurance protocols were followed with each batch of samples through the inclusion of blanks, certified reference materials and matrix spikes, as well as by doing a standard calibration run.
2.3. Macroinvertebrates
Aquatic macroinvertebrates were sampled in each of the selected reed pans from all of the available invertebrate biotopes which were identified according to [20]. Various invertebrate sampling techniques were used to determine which would provide a representative sample of aquatic macroinvertebrates within reed pans and the results were published in [21]. The methods used, included the use of aquatic light traps, benthic sampling, emergent traps, plankton nets, sweep nets, as well as terrestrial light traps. All of the macroinvertebrate specimens sampled were identified to the lowest taxonomic level possible using a dissection microscope and guides to the Fresh Water Invertebrates of Southern Africa [22-30]. Most of the collected specimens were identified to genus level, some to species level, and the remainder to family or higher levels.
2.4. Statistical Analysis
To determine the changes in macroinvertebrate community compositions on a temporal and spatial scale, the most appropriate univariate and multivariate statistical analysis methods were used. Univariate analysis (i.e., diversity and richness indices) was used to describe macroinvertebrate species-abundance relations with the help of the software program PRIMER Version 6.0 [31]. These indices included Margalef’s species richness index (d) [32] and the Shannon’s diversity index (H’) [33]. Analysis of variance (ANOVA) was used to determine any significant differences with significance assumed as a probability level of p ≤ 0.05. A K-dominance plot was constructed to determine any increased dominance of one family relative to other sites and seasons. For this purpose the software program PRIMER Version 6.0 was used and the data were log-transformed. Multivariate statistics, namely redundancy analysis (RDA) plots were used to determine the relationship between macroinvertebrate community structures and selected water quality variables with the help of the software program CANOCO version 4.5 [34]. The data were log-transformed and the significance of the RDA axes was tested using Monte Carlo permutation tests (499 permutations). The different sites presented on these two-dimensional plots reflect their relative similarity or dissimilarity to each other in terms of the macroinvertebrate assemblages with the water quality variables overlain. The arrows in an ordination plot can indicate whether any correlation between variables exist depending on whether the angles between them are acute or not.
3. Results
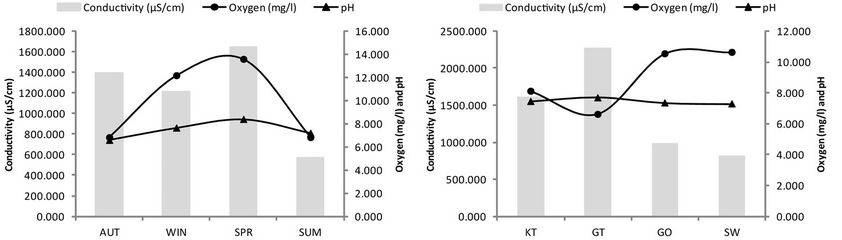
The results of the most influential water quality data obtained within the four selected reed pans are summarized and presented in Figure 2. The seasonal trend of nutrient enrichment at the four reed pans is presented and indicated as relative concentrations of ;
;  and
and , as well as
 . A few seasonal trends can be observed with regard to nutrient levels (Figure 2(c)) although a general increase in concentrations were measured during SUM. The maximum concentrations of
 measured during SUM was 0.083 mg/l,
  = 7.483 mg/l,
  = 0.075 mg/l and
  = 0.088 mg/l. The conductivity values (Figure 2(a)) remained relatively similar during AUT, WIN and SPR (~1415.6 mS/cm) after which it decreased during SUM (~564.5 mS/cm). An increase in pH levels was noticed during WIN and SPR (~7.99), when compared to AUT and SUM (~6.87). Turbidity and chlorophyll a levels increased during SUM, whilst COD concentrations were variable between the different seasons. From Figure 2(d), it can be seen that an increase in
 ;
;  and
and , as well as
  was noticed at GO where the highest concentrations were measured, when compared to the other sites (approximately 0.053 mg/l, 8.833 mg/l, 0.050 mg/l and 0.217 mg/l, respectively). As with the nutrients, the COD, turbidity and chlorophyll a concentrations were also high at GO (approximately 32 mg/l, 29 NTU and 29.857 µg/l, respectively). The pH levels remained relatively similar between the different sites (~7.44), while conductivity levels were lower at GO and SW (988.5 mS/cm and 819 mS/cm, respectively) when compared to GT and KT (2273 mS/cm and 1614.5 mS/cm, respectively).
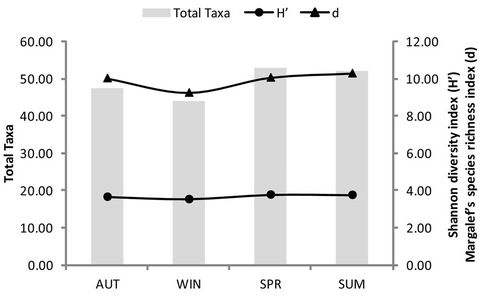
When determining the changes in diversity of the aquatic macroinvertebrates in the selected reed pans (Figure 3), it was found that the highest total number of
 (a)
(a)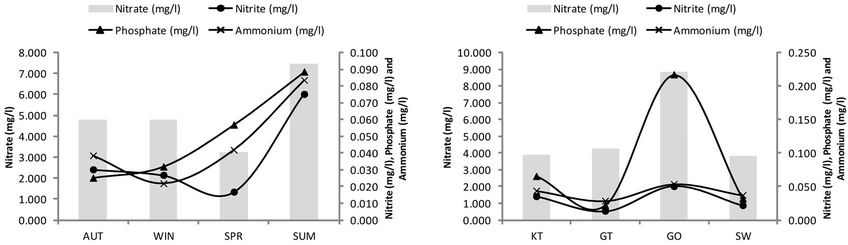 (b)
(b) (c)
(c)
Figure 2. Temporal and spatial fluctuations in pH, electrical conductivity, dissolved oxygen, nitrate, nitrite, phosphate, ammonium, chlorophyll a, chemical oxygen demand and turbidity for the four selected reed pans. KT represents Klein Tevrede se Pan, GT (Groot Tevrede se Pan), GO (Goedverwachting se Pan), SW (Swaeltjie Pan), AUT (autumn), WIN (winter), SPR (spring) and SUM (summer).
taxa was found during SPR (Figure 3(a)) and at Groot Tevrede se Pan (Figure 3(b)). The Shannon diversity index (Figure 3(a)) also showed the highest diversity occurring during SPR, as well as a high diversity at Groot Tevrede se Pan (Figure 3(b)). Margalef’s species richness index is used to indicate species diversity and abundance and was included to compliment the results obtained from Shannon’s diversity index. Margalef’s species richness index also indicated that the highest level of diversity and abundance of macroinvertebrates was found in Groot Tevrede se Pan and during SPR (Figure 3), with a significant difference (p < 0.05) between the scores obtained between this pan and Goedverwachting se Pan. Spatially, both Klein Tevrede se Pan and Swaeltjie Pan scores showed a slightly lower macroinvertebrate abundance, richness and diversity than those of Groot Tevrede se Pan, while Goedverwachting se Pan consistently had the lowest scores. These diversity results are based on the list of aquatic macroinvertebrates sampled and identified from the respective reed pans (Table 1).
The K-dominance curves presented in Figure 4 are in the form of ranked species abundance curves. From the data it can be seen that the K-dominance curve from the different reed pans during the different seasons all have a typical sigmoidal curve. This indicates a balanced community of aquatic macroinvertebrates in all four reed pans studied throughout the four different seasons. Thus, no dominance of a single species can be observed which means that as the abundance of the macroinvertebrates increased, the diversity also increased.
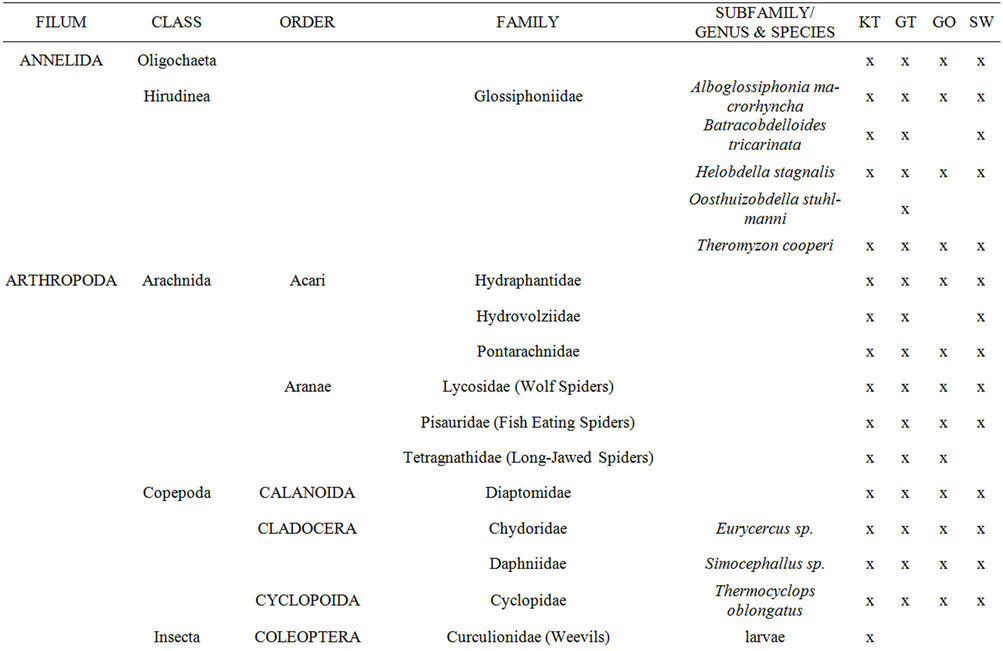
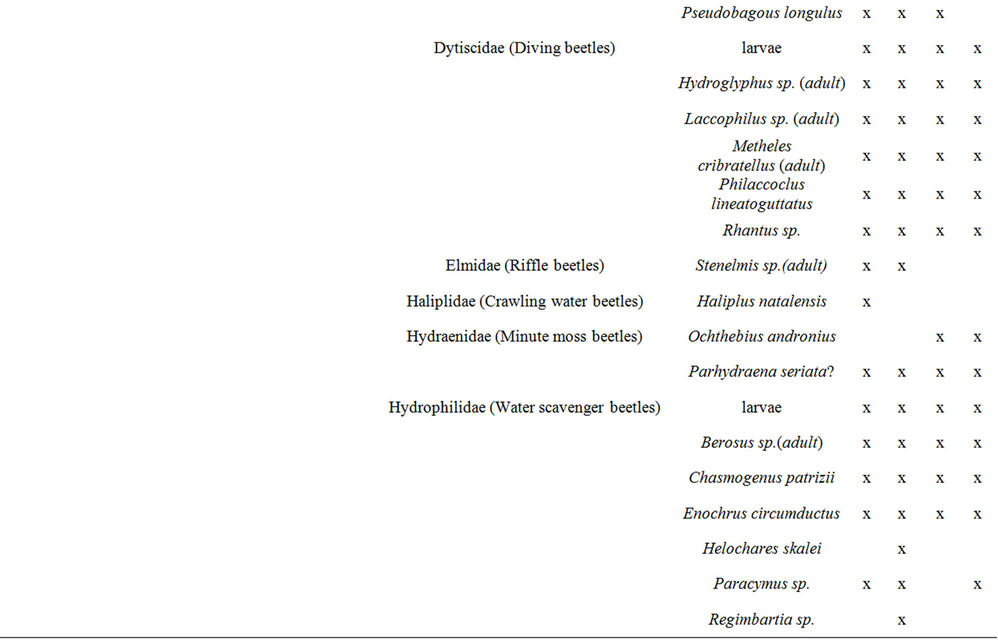
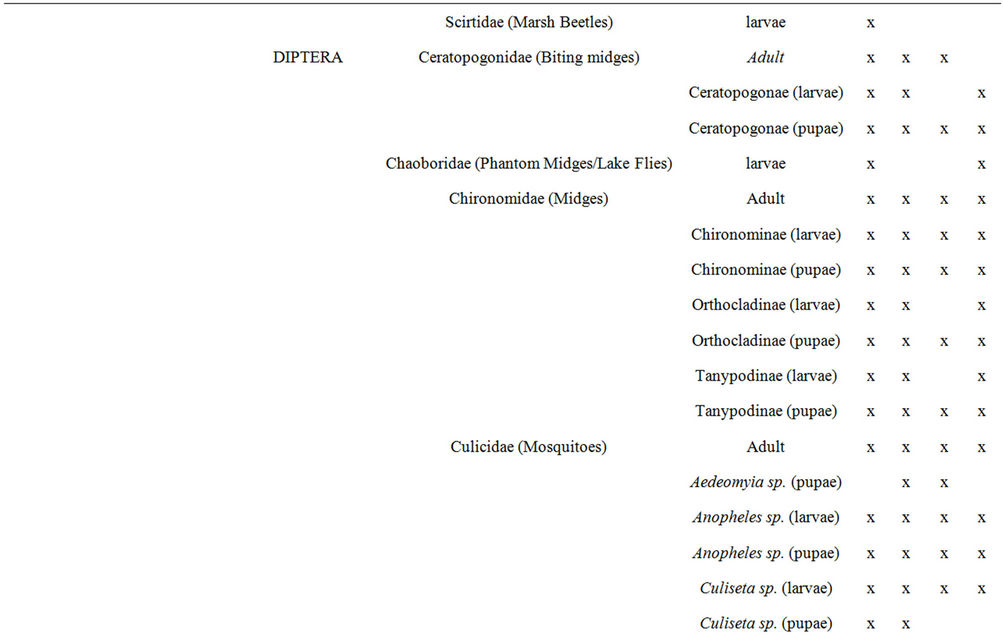

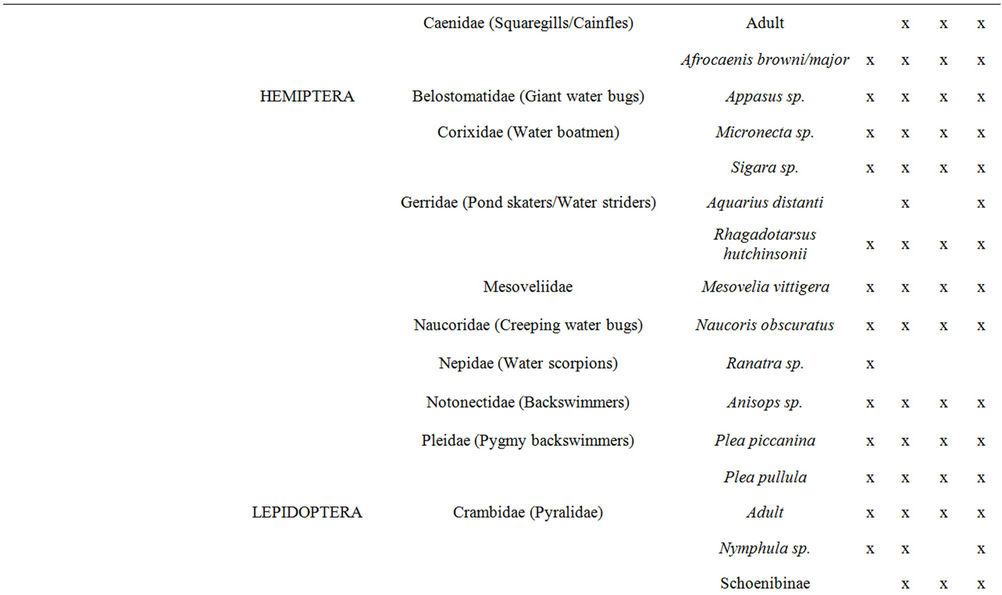
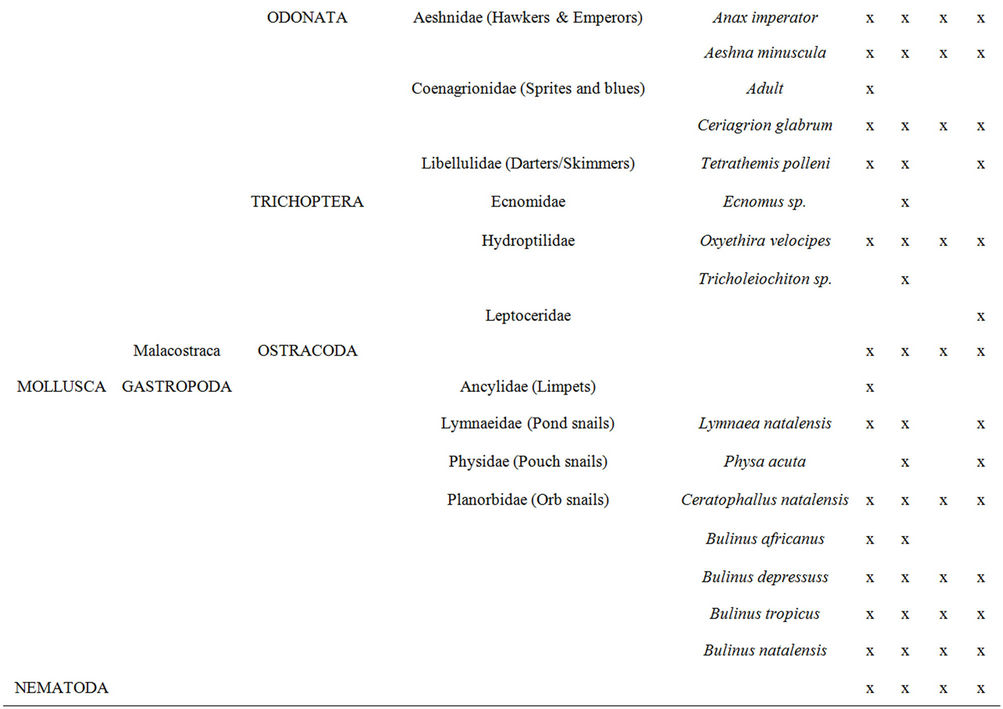
Table 1. A list of the aquatic macroinvertebrate taxa found at the selected reed pans from four seasonal sampling trips.
 (a)
(a)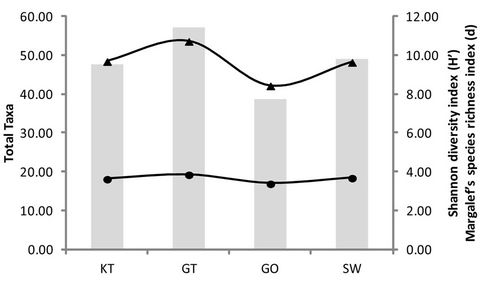 (b)
(b)
Figure 3. The scores obtained for the total number of macroinvertebrate taxa present, Margalef’s species richness index, Shannon’s diversity index during the different seasons (a) and at the various sites (b). KT represents (Klein Tevrede se Pan), GT (Groot Tevrede se Pan), GO (Goedverwachting se Pan) and SW (Swaeltjie Pan).
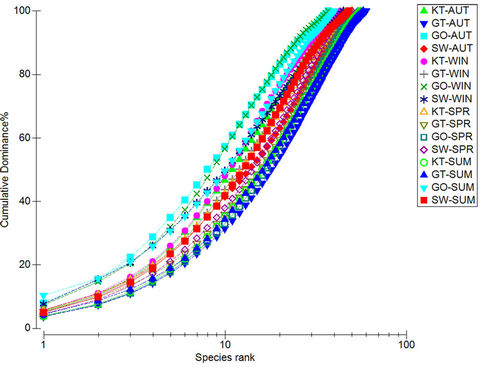
Figure 4. A ranked species K-dominance curve for macroinvertebrate communities collected at the four pans during the different seasons. KT represents (Klein Tevrede se Pan), GT (Groot Tevrede se Pan), GO (Goedverwachting se Pan), SW (Swaeltjie Pan), AUT (autumn), WIN (winter), SPR (spring) and SUM (summer).
Based on the RDA triplot (Figure 5), it can be seen that reed pans differ temporally with regard to their macroinvertebrate assemblages with a distinction between the warmer spring (blue indication) and summer (green indication) and the colder autumn and winter seasons (red indication). As with the diversity indices studied in Figure 3, the highest diversity was also found to occur during the warmer seasons (Figure 5). In addition to this, a difference was also observed between spring and summer seasons, with more tolerant macroinvertebrates (e.g., Culicidae and Oligochaeta) present during summer which coincides with an increase in nutrient enrichment during this period (thus a decrease in water quality).
4. Discussion
According to [35], multivariate similarity measures can be used successfully to indicate biodiversity changes using ordination. Ordination plots using species composition are particularly effective in detecting diversity changes, seeing that the first macroinvertebrate biodiversity changes usually occur as a result of species replacing one another, rather than resulting from a reduction in richness [36]. Ordination plots can also be used to characterize a wetland, produce stable patterns, detect turnover and predict changes likely to occur as a result of anthropogenic activities [37]. It was evident from the results (Figure 5) that the macroinvertebrate abundance data in reed pans show a distinct difference between cold and warm seasons. This difference may be due to the increase in productivity during the warmer seasons, which leads to a regeneration of plants and animals during this period [38]. Thus, the abundance and diversity of aquatic macroinvertebrates were greatest during the warmer (spring/ summer) seasons. This was also evident from the univariate diversity indices (Figure 3(a)), which showed an increase in macroinvertebrate abundance, richness and diversity during the warmer seasons.
A variance in macroinvertebrate taxa, richness and diversity was also observed between the spring and summer seasons (Figure 5), which may be attributed to the deteriorating water quality which occurs during summer. This is the result of increased rainfall which transports enhanced levels of silt and soil, as well as associated nutrients, salts and pollutants into these pans [39]. This may be due to the agricultural practices occurring within the catchments of these pans which have the ability to increase nutrient inputs [40] or by increasing sedimentation which results in a reduction of primary productivity [41]. This corresponds to the water quality assessment done within these pans (Figure 2) where an increase in nutriaents and turbidity was observed during SUM. The activeity of these practices also corresponds to the higher rainfall periods.
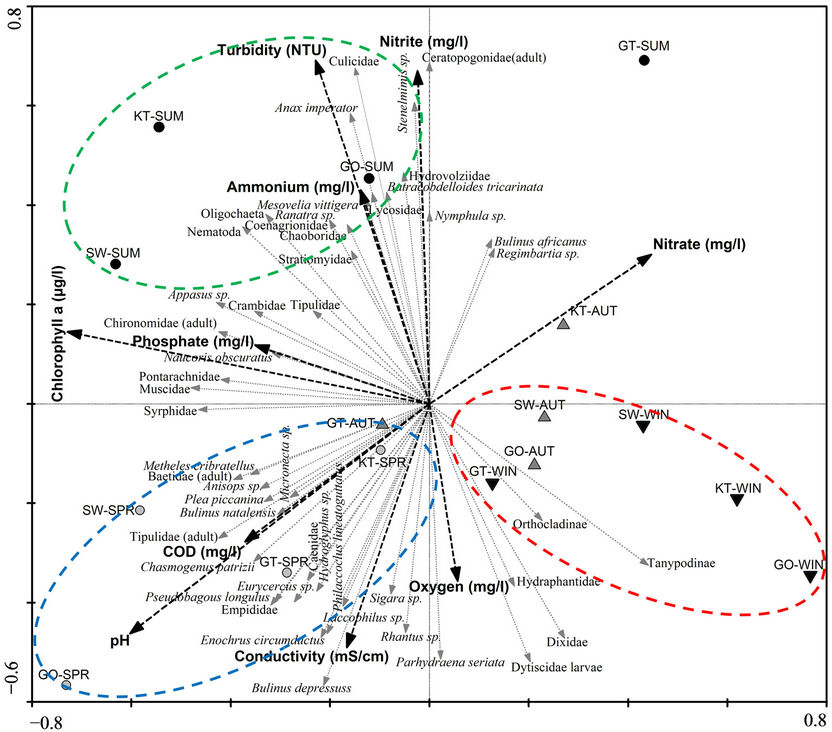
Figure 5. An RDA plot showing the similarity between sites and seasons based on macroinvertebrate abundance data with water quality variables superimposed. KT represents (Klein Tevrede se Pan), GT (Groot Tevrede se Pan), GO (Goedverwachting se Pan), SW (Swaeltjie Pan), AUT (autumn), WIN (winter), SPR (spring) and SUM (summer).
Pollution in aquatic systems may cause the community structure of organisms to change, as opportunistic species start to dominate [37,40,42]. From the results it was observed that there was an increase in more tolerant macroinvertebrate taxa, e.g. Chironomidae and Oligochaeta, during summer, which is characteristic of stressed aquatic systems [43]. Chironomidae can tolerate the effects of pollution, such as low oxygen levels, as it contains haemoglobin in its blood [44] and may exploit stressed systems when there is a lack of competitors [45], while Oligochaeta is generally linked with unfavourable conditions, for example nutrient enrichment and organic pollution [42,46]. The extent of this exploitation by less sensitive taxa does not appear to have resulted in a complete community imbalance as yet, as from Figure 4 it can been seen that a balanced community of aquatic macroinvertebrates is mostly still present.
The determination of macroinvertebrate taxa richness is known as a good indication of the water quality of an aquatic ecosystem [47]. Contamination of these systems results in intolerant species disappearing, which decreases the macroinvertebrate taxa richness [42]. The results obtained from the various univariate and multivariate statistical analysis during this study indicates that the greatest macroinvertebrate abundance, richness and diversity were found at Groot Tevrede se Pan. The opposite was found at Goedverwachting se Pan, which may be as a result of increased runoff as this reed pan had the most noticeable increase in nutrients and suspended material. The change in macroinvertebrate community structure found at Goeverwachting se Pan can also be used as an indication of the loss of riparian vegetation surrounding this pan [48]. The slightly lower macroinvertebrate abundance, richness and diversity found at Klein Tevrede se Pan and Swaeltjie Pan, when compared to Groot Tevrede se Pan, may be as a result of the sheer size of Groot Tevrede se Pan relative to that of Klein Tevrede se Pan and Swaeltjie Pan. The many and varied taxa are supported by different substrates. Thus, complex substrates (e.g., gravel, leaves, macrophytes, etc.) support more taxa than simple substrates [49]. Groot Tevrede se Pan may therefore contain more complex substrates and is thus able to support a higher macroinvertebrate abundance, richness and diversity.
Thus, through the findings mentioned in this article, it can be seen that aquatic macroinvertebrates have the potential to be used as biological indicators of water quality within reed pans and can be used for the better management and protection of these systems.
5. Conclusion
Based on the data collected from this study it is clear that macroinvertebrates reflect various changes in reed pans with regard to seasonal variability and anthropogenic impacts on water quality. The greatest macroinvertebrate abundance, richness and diversity occurred during the warm (spring/summer) seasons, while the impacts on water quality occurred mostly during summer. Thus, macroinvertebrates can be used as a biomonitoring tool in reed pans to monitor impacts on water quality within these systems and in so doing aid in the better management and protection of reed pans.
6. Acknowledgements
The funding provided by the Council for Scientific and Industrial Research (CSIR) during this study is greatly appreciated. The assistance of Mrs Leanie de Klerk in the laboratory and field is greatly appreciated.
REFERENCES
- S. Goudie and G. L. Wells, “The Nature, Distribution and Formation of Pans in Arid Zones,” Earth-Science Reviews, Vol. 38, 1995, pp. 1-69. doi:10.1016/0012-8252(94)00066-6
- A. S. Goudie and D. S. G. Thomas, “Pans in Southern Africa with Particular Reference to South Africa and Zimbabwe,” Zeitschrift für Geomorphologie N.F, Vol. 29, 1985, pp. 1-19.
- D. Allan, “The Conservation of the Pans of the Transvaal Highveld,” Unpublished Report by Transvaal Division of Nature Conservation, Project No. TN6/4/2/3/2, 1985.
- P. Grundling, A. Linström, R. Grobler and J. Engelbrecht, “The Tevredenpan Peatland Complex of the Mpumalanga Lakes District,” In: J. Couwenberg and H. Joosten, Eds., International Mire Conservation Group, Newsletter Issue 2007/3, 2003.
- R. E. Schulze, “South African Atlas of Agrohydrology and -Climatology,” Report to the Water Research Commission, Report No. TT82/96, Pretoria, 1997.
- J. Dini, G. Cowan and P. Goodman, “South African National Wetland Inventory: Proposed Wetland Classification System for South Africa,” Department of Environmental Affairs and Tourism, Pretoria, 1998.
- G. I. Cowan and W. Van Riet, “A Directory of South African Wetlands,” Department of Environmental Affairs and Tourism, Pretoria, 1998.
- D. R. Hohls, “National Biomonitoring Program for Riverine Ecosystems: Framework Document for the Program,” NBP Report Series No 1, Institute for Water Quality Studies, Department of Water Affairs and Forestry, Pretoria, 1996.
- B. J. E. Ten Brink and J. H. Woudstra, “Towards an Effective and Rational Water Management: The Aquatic Outlook Project-Integrating Water Management, Monitoring and Research,” European Water Pollution Control, Vol. 1, No. 1, 1991, pp. 20-27.
- R. Haase and U. Nolte, “The Invertebrate Species Index (ISI) for Streams in Southeast Queensland, Australia,” Ecological Indicators, Vol. 8, No. 5, 2008, pp. 599-613. doi:10.1016/j.ecolind.2007.08.005
- J. N. Rinne, “The Utility of Stream Habitat and Biota for Identifying Potential Conflicting Forest Land Uses: Montane riparian areas,” Forest Ecology and Management, Vol. 33-34, 1990, pp. 363-383. doi:10.1016/0378-1127(90)90204-O
- T. J. Hillman and G. P. Quinn, “Temporal Changes in Macroinvertebrate Assemblages Following Experimental Flooding in Permanent and Temporary Wetlands in an Australian Floodplain Forest,” River Research and Application, Vol. 18, No. 2, 2002, pp. 137-154. doi:10.1002/rra.628
- D. M. Rosenberg and V. H. Resh, “Introduction to Freshwater Biomonitoring and Benthic Macroinvertebrates,” In: D. M. Rosenberg and V. H. Resh, Eds., Freshwater Biomonitoring and Benthic Macroinvertebrates, Chapman and Hall, 1993.
- T. Assmuth, and S. Penttilä, “Characteristics, Determinants and Interpretations of Acute Lethality in Daphnids Exposed to Complex Waste Leachates,” Aquatic Toxicology, Vol. 31, No. 2, 1995, pp. 125-141. doi:10.1016/0166-445X(94)00062-U
- S. Meintjies, “Seasonal Changes in the Invertebrate Community of Small Shallow Ephemeral Pans at Bain’s Vlei, South Africa,” Hydrobiologia, Vol. 317, No. 1, 1996, pp. 51-64. doi:10.1007/BF00013725
- A. R. de Klerk, L. P. de Klerk, J. Chamier and V. Wepener, “Seasonal Variations in Water and Sediment Quality Found in Reed Pans on the Mpumalanga Highveld,” Water SA, Vol. 38, 2012, pp. 663-672. doi:10.4314/wsa.v38i5.3
- D. P. Sartory and J. U. Grobbelaar, “Extraction of Chlorophyll A from Freshwater Phytoplankton for Spectrophotometric Analysis,” Hydrobiologia, Vol. 114, No. 3, 1984, pp. 177-187. doi:10.1007/BF00031869
- DWAF (Department of Water Affairs and Forestry), “Analytical Methods Manual,” Technical Report 151. Department of Water Affairs and Forestry, Pretoria, 1992.
- C. J. Lorenzen, “Determination of Chlorophyll and PheoPigments: Spectrophotometric Equations,” Limnology and Oceanography, Vol. 12, No. 2, 1967, pp. 343-346. doi:10.4319/lo.1967.12.2.0343
- MPCA (Minnesota Pollution and Control Agency), “Macroinvertebrate Community Sampling Protocol for Depressional Wetland Monitoring Sites,” Biological Monitoring Program, 2007.
- A. R. de Klerk and V. Wepener, “The Influence of Biotope and Sampling Method on the Assessment of the Invertebrate Community Structure in Endorheic Reed Pans in South Africa,” African Journal of Aquatic Science, Vol. 36, No. 1, 2011, pp. 67-74. doi:10.2989/16085914.2011.559705
- J. A Day, B. A. Stewart, I. J. De Moor and A. E. Louw, “Guides to the Freshwater Invertebrates of Southern Africa, Vol. 2: Crustacea I: Notostraca, Anostraca, Conchostraca and Cladocera,” WRC Report No. TT 121/00, Water Research Commission, Pretoria, 1999.
- J. A Day, I. J. De Moor, B. A. Stewart and A. E. Louw, “Guides to the Freshwater Invertebrates of Southern Africa, Vol. 3: Crustacea II: Ostracoda, Copepoda & Branchiura,” WRC Report No. TT 148/01, Water Research Commission, Pretoria, 2001.
- J. A. Day, B. A. Stewart, I. J. De Moor and A. E. Louw, “Guides to the Freshwater Invertebrates of Southern Africa, Vol. 4: Crustacea III: Bathynellacea, Amphipoda, Isopoda, Spelaeogriphacea, Tanaidacea, Decapoda,” WRC Report No. TT 141/01, Water Research Commission, Pretoria, 2001.
- J. A. Day, A. D. Harrison and I. J. De Moor, “Guides to the Freshwater Invertebrates of Southern Africa, Vol. 9: Diptera,” WRC Report No. TT 201/02, Water Research Commission, Pretoria, 2002.
- J. A. Day and I. J. De Moor, “Guides to the Freshwater Invertebrates of Southern Africa, Vol. 5: Non-Arthropods: The Protozoans, Porifera, Cnidaria, Platyhelminthes, Nermertea, Rotifera, Nematoda, Nematomorpha, Gastrotrichia, Bryozoa, Tardigrada, Polychaeta, Oligochaeta & Hirundinea,” WRC Report No. TT 167/02, Water Research Commission, Pretoria, 2002.
- J. A. Day and I. J. De Moor, “Guides to the Freshwater Invertebrates of Southern Africa, Vol. 6: Arachnida & Mollusca: Araneae, Water Mites & Mollusca,” WRC Report No. TT 182/02, Water Research Commission, Pretoria, 2002.
- I. J. De Moor, J. A. Day and F. C. De Moor, “Guides to the Freshwater Invertebrates of Southern Africa, Vol. 7: Insecta I: Ephemeroptera, Odonata & Plecoptera,” WRC Report No. TT 207/03, Water Research Commission, Pretoria, 2003.
- I. J. De Moor, J. A. Day and F. C. De Moor, “Guides to the Freshwater Invertebrates of Southern Africa, Vol. 8: Insecta II: Hemiptera, Megaloptera, Neuroptera, Trichoptera & Lepidoptera,” WRC Report No. TT 214/03, Water Research Commission, Pretoria, 2003.
- R. Stals and I. J. De Moor, “Guides to the Freshwater Invertebrates of Southern Africa, Vol. 10: Coleoptera,” WRC Report No. TT 320/07, Water Research Commission, Pretoria, 2008.
- K. R. Clarke and R. N. Gorley, “Primer v6: User Manual/Tutorial,” PRIMER-E, Plymouth, 2006.
- R. Margalef, “Diversidad de Especies en las Comunidades Naturales,” Publicaciones del Instituto de Biologia Aplicada, Vol. 6, No. 1, 1951, pp. 59-72.
- T. P. Wilhm and T. C. Dorris, “Biological Parameters for Water Quality Criteria,” Biological Science, Vol. 18, No. 6, 1968, pp. 477-481.
- C. J. F. Ter Braak and P. Šmilauer, “CANOCO Reference Manual and Canodraw for Windows User’s Guide: Software for Canonical Community Ordination (Version 4.5),” Microcomputer Power, New York, 2002.
- J. S. Gray, K. R. Clarke, R. M. Warwick and G. Hobbs, “Detection of Initial Effects of Pollution on Marine Benthos: An Example from the Ekofisk and Eldfisk Oilfields, North Sea,” Marine Ecology Progress Series, Vol. 66, 1990, pp. 285-299. doi:10.3354/meps066285
- J. E. Growns, J. A. Davis, F. Cheal, L. G. Schmidt, R. S. Rosich and J. S. Bradley, “Multivariate Pattern Analysis of Wetland Invertebrate Communities and Environmental Variables in Western Australia,” Australian Journal of Ecology, Vol. 17, No. 3, 1992, pp. 275-288. doi:10.1111/j.1442-9993.1992.tb00809.x
- S. A. Halse, D. J. Cale, E. J. Jasinska and R. J. Shiel, “Monitoring Change in Aquatic Invertebrate Biodiversity: Sample Size, Faunal Elements and Analytical Methods,” Aquatic Ecology, Vol. 36, No. 3, 2002, pp. 395-410. doi:10.1023/A:1016563001530
- H. F. Dallas and J. A. Day, “The Effect of Water Quality Variables on Riverine Ecosystems: A Review,” Water Research Commission, Pretoria, 1993.
- A. D. Lemly, “Modification of Benthic Insect Communities in Polluted Streams: Combined Effects of Sedimentation and Nutrient Enrichment,” Hydrobiologia, Vol. 87, No. 3, 1982, pp. 229-245. doi:10.1007/BF00007232
- M. F. Paisley, W. J. Walley, J. Nikhade and R. Dils, “Identification of the Key Biological Indicators of Nutrient Enrichment in Rivers for Use in Predictive/Diagnostic Models,” Diffuse Pollution Conference, Dublin, 17-21 August 2003, pp. 8-13.
- J. M. Hellawell, “Biological Indicators of Freshwater Pollution and Environmental Management,” Elsevier Applied Science Publishers, Amsterdam, 1986. doi:10.1007/978-94-009-4315-5
- D. R. Lenat and K. Crawford, “Effects of Land Use on Water Quality and Aquatic Biota of Three North Carolina Piedmont Streams,” Hydrobiologia, Vol. 294, No. 3, 1994, pp. 185-199. doi:10.1007/BF00021291
- D. R. Lenat and K. W. Eagleson, “Ecological Effects of Urban Runoff on North Carolina Streams,” North Carolina Department of Natural Resources & Community Development, Division of Environmental Management, Water Quality Section, Biological Monitoring Group, 1981.
- B. M. Weigel, L. J. Henne and L. M. Martinez-Rivera, “Macroinvertebrate-Based Index of Biotic Integrity for Protection of Streams in West-Central Mexico,” Journal of the North American Benthological Society, Vol. 21, No. 4, 2002, pp. 686-700. doi:10.2307/1468439
- M. Koryak, M. A. Shapiro and J. L. Sykora, “Riffle Zoobenthos in Streams Receiving Acid-Mine Drainage,” Water Research, Vol. 6, No. 10, 1972, pp. 1239-1247. doi:10.1016/0043-1354(72)90024-3
- S. Kucuk, “The Effect of Organic Pollution on Benthic Macroinvertebrate Fauna in the Kirmir Creek in the Sakarya Basin,” ADÜ Ziraat Fakültesi Dergisi, Vol. 5, No. 1, 2008, pp. 5-12.
- D. R. Lenat, “Agriculture and Stream Water Quality: A Biological Evaluation of Erosion Control Practices,” Environmental Management, Vol. 8, No. 4, 1984, pp. 333- 344. doi:10.1007/BF01868032
- B. Bis, A. Zdanowicz and M. Zalewski, “Effects of Catchment Properties on Hydrochemistry, Habitat Complexity and Invertebrate Community Structure in a Lowland River,” Hydrobiologia, Vol. 422-423, 2000, pp. 369-387. doi:10.1023/A:1017002923173
- M. R. Vinson and C. P. Hawkins, “Biodiversity of Stream Insects: Variation at Local Basin and Regional Scales,” Annual Review of Entomology, Vol. 43, 1998, pp. 271- 293. doi:10.1146/annurev.ento.43.1.271
NOTES
*Corresponding author.