Journal of Environmental Protection
Vol. 4 No. 5A (2013) , Article ID: 31892 , 10 pages DOI:10.4236/jep.2013.45A002
Ammonium Dissociation for Swine and Dairy Cattle Manures
![]()
1China Institute of Nuclear Information and Economics, Beijing, China; 2Department of Building, Civil and Environmental Engineering, Concordia University, Montreal, Canada; 3Consumaj Inc., Quebec, Canada.
Email: *suzellebarrington@sympatico.ca
Copyright © 2013 Min Liu et al. This is an open access article distributed under the Creative Commons Attribution License, which permits unrestricted use, distribution, and reproduction in any medium, provided the original work is properly cited.
Received March 8th, 2013; revised April 9th, 2013; accepted May 7th, 2013
Keywords: Ammonium Dissociation; Manure; pH; Temperature
ABSTRACT
The dissociation of ammonium  into ammonia (NH3) in wastewaters is a key factor governing atmospheric nitrogen volatilization. Relatively rich in total ammoniacal nitrogen (TAN or
  plus NH3), livestock manures are most susceptible to NH3 volatilization, although indirect measurements report 5 times less
  dissociation as compared to theoretical values. The objective of this study was therefore to directly measure
  dissociation of two standard NH4Cl solutions (1750 and 3500 mg TAN/L), and of swine and dairy cattle manures at various dilutions and temperatures using a ammonia selective electrode (hydrogen and silver-silver chloride electrode couple) at various pH and temperatures. All solutions demonstrated
  dissociation varying from theory, especially because of dissolved compounds such as atmospheric CO2. At a neutral pH, ratios of theoretical to measured [NH3-N] ranged from 1.5 to 3.5, with higher ratios corresponding to higher TAN levels. At a pH below 6, NH3 volatilization was enhanced by the shift of
  to H2CO3 and CO2. With previous research projects reporting 5 times less NH3 volatilization as compared to theory, the present indicates that dissociation activity account for half of this drop with gas diffusion accounting for the other half.
1. Introduction
Worldwide, food production generates 70% of the global ammonia (NH3) emissions, representing 55 million tons/ yr [1] and being concentrated especially in Europe, the Indian subcontinent, China and the US [2-4]. Within this 70%, fertilizers and livestock manures contribute 10 - 12 and 16 - 27 million tons/yr of NH3-N volatilization, respectively, where the share of livestock shelters including manure storage and manure land spreading is 30 to 55% and 15% to 40%, respectively [5].
Nitrogen deposition as a result of NH3-N atmospheric loading leads to several well acknowledged environmental issues: increased risks of water eutrophication [6,7] and acidification [8]; N accumulations changing plant species for soils [9,10], and benthic and pelagic organisms such as corals and algae for waters [11]; increased organic soil subsidence [12]; increased crop sensitivity to secondary stresses such as pathogens, frost and drought [13]; increased CO2 emissions from forest soils [14], and; damages to tomatoes, cucumbers, conifers and fruit crops [15].
Models simulating NH3 volatilization from wastewaters rich in  such as livestock manure, are based on a dissociation constant pKa. Nevertheless, available pKa coefficients pertain to pure solutions rather than natural solutions containing gases dissolved from the atmosphere and minerals in trace quantities. Hashimoto and Ludington [16] estimated the pKa coefficient of poultry manure slurries by measuring NH3 volatilization in reaction vessels equipped with a mixing system and assuming a value for Henry’s constant equivalent to that of water. They recommended a manure pKa coefficient 5 times lower than that computed theoretically for pure water solutions. Similarly for dairy manure, Chaoui et al. [17] observed a pKa coefficients 80% smaller than those predicted theoretically by measuring the rate of NH3 volatilization from non stirred jars and once more, assuming a value for Henry’s constant equivalent to that of water. Such low
  dissociation levels were used by Zhang et al. [18] to produce a model predicting NH3 losses from manures and by Masse et al. [19] estimating the efficiency of a membrane separation technology.
The assumption that Henry’s constant in manures is the same as that of water may introduce an error in estimating pKa since the solids content of manures increases their viscous properties and accordingly, decreases their rate of gas diffusion [20]. For anaerobic digesters, Hafner and Bisogni [21] demonstrated that the presence in particular of inorganic carbon could modify pKa by 20%. To obtain pKa values without estimating Henry’s constant, NH3 in solutions must de directly measured. Since the silver-silver chloride electrode, namely the NH3 selective electrode, is recognized as a reliable instrument to measure NH3 in solutions [22,23] being sold by several electrode manufacturers, this method is proposed to directly measure NH3 concentrations and compute measured pKa coefficients [22,23].
The objective of the present paper was to directly measure the concentration of NH3 resulting from  dissociation at various temperatures and pH, for two NH4Cl solutions and for fresh swine and dairy cattle manures at different dilution levels. Concentrations of NH3 ([NH3-N]) were directly measured using a NH3 selective electrode connected to a pH meter (Orion, Boston, USA) and converted into a dissociation coefficient pKa. The two NH4Cl solutions had a Total Available Nitrogen (TAN or
  -N plus NH3-N) of 1750 and 3500 mg/L, and the swine and dairy cattle manures were diluted to various levels with distilled water to offer a TAN in the range of 400 to 3800 mg/L.
2. Chemistry of Ammonium Dissociation
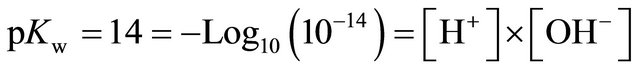
Because of the polar nature of water molecules, H+ ions are constantly being exchanged and a self ionization coefficient, pKw, of more or less 14 is exhibited:
 (1)
(1)
Pure water exhibits equal concentrations of H+ and OH–, [H+] and [OH–], or a pH (–Log10 [H+]) of 7. Ionic elements or compounds dissolved in water take part in the exchange of H+, shifting the pH under or above 7, whether an acid or a base generating H+ or OH–, respectively.
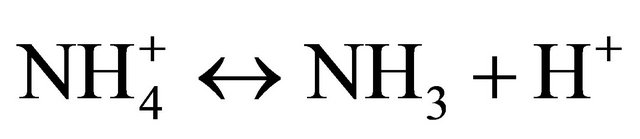
The ion  is a weak acid dissociating as follows in water:
 (2)
(2)
The level of  dissociation into NH3 depends on the availability of H+ in solution, where a deficit (alkaline conditions) shifts Equation (2) to the right, thus releasing H+ from
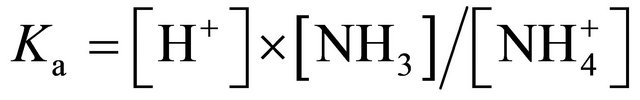
  and producing NH3. The extent of this dissociation process is expressed by the dissociation coefficient Ka, defined as follows:
 (3a)
(3a)
Since Ka coefficients are generally very small, such as that of water at 10–7, the general practice is to express dissociation coefficients as pKa where:
 (3b)
(3b)
This principle of dissociation applies to all acids (pKa) and bases (pKb) dissolved in water. The higher the value of Ka, or the lower the value of pKa, the more active is the acid, and the greater is the extent of dissociation exchanging H+ ions.
For pure  solutions in water, the dissociation coefficient, pKa, was initially determine in the 1940’s by measuring the electromotive forces created in a cell between a hydrogen and silver-silver chloride electrode couple (Bates and Pinching 1949). Such cell better known as a NH3 sensitive electrode can produce an error of +/– 5% [24] as a result of variations in the solution solubility of silver chloride and losses of NH3 during the reading process [23]. The ratio of NH3 to TAN, f, can be defined in terms of pH [25] based on:
 (4a)
(4a)
The solution to this equation gives (Loehr, 1984):
 (4b)
(4b)
To compute pKa, the temperature effect can be included as [26]:
 (5)
(5)
where T is in °K.
Water solutions are rarely pure and pKa reported for pure TAN solutions cannot be applied. In natural solutions, the extent of the dissociation process depends not only on the solution pH but also the presence of other acids or bases readily exchanging H+ without a noticeable change in pH [27]. An important acid affecting [H+] in water solution is carbonic acid (H2CO3) generated from CO2 dissolved from the atmosphere or produced from microbial activity degrading organic matter. Carbonic acid releases H+ as the pH increases or [H+] decreases, with the maximum  and
and  occurring at a pH of 6.5 and 10.5, respectively [28,29]:
 (6)
(6)
By releasing H+,  creates a buffering effect and increases the amount of available H+, thus potentially decreasing the dissociation of
  into NH3. Furthermore
  is the preferred ionic form as compared to
 , with a lower pKa coefficient (Table 1).
Besides dissolved atmospheric and microbial CO2, manures offer a wide range of compounds interfering with H+ exchanges, such as phosphates, with maximum concentrations of  and
and  occurring at a pH of 5 and 9.5, and with pKa of 2.13, 7.20 and 12.37 for
 ,
,  and
and  respectively (Table 1):
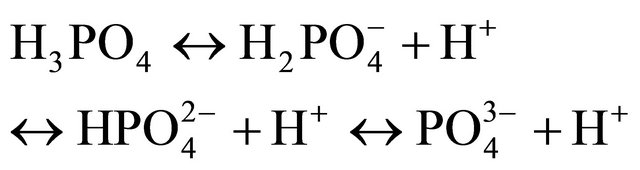 (7)
(7)
As compared to , both H3PO4 and H2CO3 have smaller pKa coefficients, with a greater potential of governing the availability and exchange of H+.
In conclusion, the dissociation coefficients expressed by pKa developed for pure solutions of specific acids, including , cannot be directly applied to natural solutions because of the presence and interaction of other more active species. Compared to water solutions with a limited amount of dissolved ions and solids, wastewaters such as manure can present a more complex reaction affecting
  dissociation, thus the need to conduct direct measurements.
2. Materials and Methods
2.1. Experimental Solutions
Fresh dairy cattle and swine manures were collected from the Dairy Cattle and Swine Complexes of the Macdonald Campus Research Farm of McGill University, located at the western tip of the island of Montreal, Canada. The samples were transported to the laboratory and refrigerated at 5˚C to 6˚C until used. Each sample was characterized in triplicate for total solids (TS), total volatile solids (TVS), pH, total Kjeldhal nitrogen (TKN),
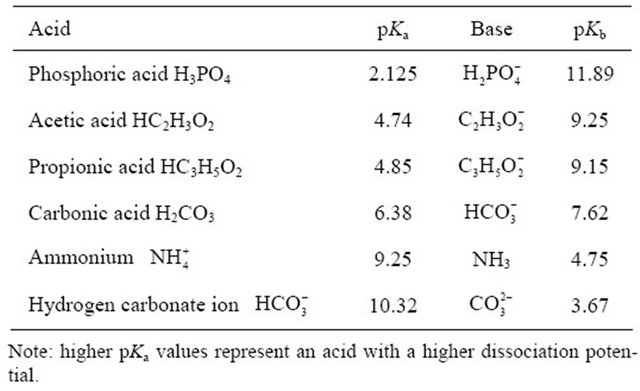
Table 1. Values of pKa and pKb for some weak acids generally found in manures.
TAN, total phosphorous (TP) and total potassium (TK), according to standard methods (APHA, 2005). To conduct the NH3 trials, swine manure was tested whole and after being diluted with distilled water, while dairy cattle manure, harder to stir because of its fibrous solids, was only tested at a dilution ratio of 1:4. The NH4Cl salt used to prepare the standard solutions was purchased from Fisher Scientific (98% purity).
2.2. Methodology
The NH3 sensitive electrode is a well recognized method for the measurement of TAN concentrations in solutions and manures. Generally, the pH is adjusted to 13, to dissociate practically all  into NH3. Therefore, this project use an NH3 sensitive electrode as follows to directly measure [NH3-N] [24]: 1) the pH of a standard NH4Cl solution or manure sub-sample was increased to 13 using 5 M NaOH and its TAN (total NH3 and
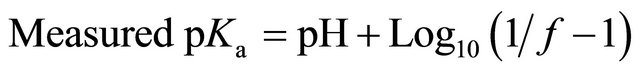
 ) was measured; 2) another sub-sample of the same NH4Cl solution or manure sample was tested for NH3-N after gradually changing its pH no more than 4 times, with either HCL or NaOH, while also measuring its temperature; 3) the process was repeated at various pH and temperatures. The measured NH3-N/TAN fraction f was used to compute the measured pKa coefficient for a given pH and temperature as follows:
 (8)
(8)
The temperature of the solutions and manures was modified by storing in a closed flask in a refrigerator or leaving on a bench top for 24 h to obtain room temperature. The temperature of the solution or manure was measured using a standard mercury laboratory thermometer with an accuracy of +/– 0.5˚C. Solutions of 1 M HCl and 5 M NaOH were used respectively to drop and increase the pH.
The procedure described above was initially used to quantify [NH3] in standard NH4Cl solutions of 3500 and 1750 mg TAN/L, at a pH increased from 6 to 13 and a temperature ranging from 15˚C to 25˚C. For each pH and temperature combination, the procedure was repeated 3 times.
The manure samples were tested at various pH using the same procedure. Swine manure with a 8.8% total solids (TS) was tested at a temperature and dilution ratio with distilled water of: 20˚C - 25˚C at a dilution of 0 (1 part manure and 0 part distilled water); 8˚C - 15˚C and 20˚C - 25˚C at a dilution ratio of 1 (1 part manure and 1 part distilled water), and; 8˚C - 15˚C and 20˚C - 25˚C at a dilution ratio of 4 (1 part manure and 4 part distilled water). The procedure was repeated with 9.9% TS cattle manure at temperatures of 8˚C to 25˚C, diluted with distilled water at a ratio of 4 (1 part manure and 4 part distilled water). All measured NH3 concentrations, pKa, coefficients and f fraction were compared to those obtained theoretically using Equations 4b.
2.3. Analytical Procedure
Both the swine and dairy manure samples were analyzed using standard methods (APHA 2005) for total solids (TS), and total volatilize solids (TVS), pH, total Kjeldhal nitrogen (TKN), total phosphorous (TP) and total potassium (TK). Total solids were determined by drying at 103˚C for 24 h in an oven (Scientific John by Sheldon Manufacturing Inc., Cornelius, Oregon, USA). The TVS were determined by burning the dried samples for 4 h in a muffle furnace (Blue M Electric Company, Blue Island, Illinois, USA). The pH was determined using a pH probe attached to a pH/Ion meter (Orion Model 450, Boston, Massachusetts, USA).
The TAN value was measured by increasing the pH of the solution to 13 using 5 M NaOH, and using an NH3 selective electrode (Orion 9512HBNWP ammonia sensitive electrode, Boston, USA) for quantification with an accuracy of 2% of the reading. Total Kjeldhal nitrogen (TKN) was determined after digesting the samples in 18 M sulfuric acid and 50% hydrogen peroxide for 15 minutes at 500˚C. The TKN of the digested samples was determined at a pH of 13, using an NH3 selective electrode connected to a pH meter. The electrode was calibrated before hand using standard NH4Cl solutions. The TP and TK of the digested samples were quantified at a pH of 7, using a spectrophotometer (Hach, Model DR 5000, Loveland, Co., USA).
2.4. Statistical Analysis
Standard deviations were obtained using Excel (Microsoft Office 2007, Seattle, USA). The ANOVA was used to measure differences between treatments (solution type and temperature), where pH range was used as block.
3. Results and Discussion
3.1. Characteristics of the Experimental Manures
The characteristics of the experimental cattle and swine manures are described in Table 2. The two manures had similar TS with that of dairy cattle and swine offering 9.9 and 8.8%, respectively. The TKN and TAN concentrations differed between the dairy and swine manure, with the dairy manure offering concentrations of 3720 and 2170 mg/L, and the swine manure offering concentrations of 5500 and 3825 mg/L, respectively. The pH of both manures was in the neutral range of 7.4 and 7.1 respectively. The total phosphorous and potassium content of the swine manure were higher than those of the dairy
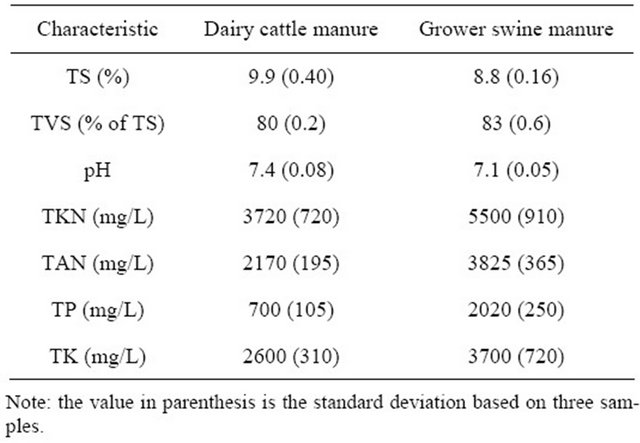
Table 2. Characteristics of the experimental manures.
cattle manure at 2020 and 3700 mg/L, compared to 700 and 2600 mg/L.
3.2. Ammonium Dissociation for NH4Cl Water Solutions
The pH of the NH4Cl solutions at various temperatures ranging from 15˚C to 25˚C is the first interesting observation. At 15˚C and 25˚C and in pure water,  exhibits a pKa of 9.55 and 9.24 computed from Equation 5. Accordingly, 0.25 and 0.125 molar
  solutions (3500 and 1750 mg TAN/L) should produce a pH of 4.9 and 5.1, respectively. For the solution at 0.25 molar
  (3500 mg/L TAN), the observed pH ranged from 5.6 to 5.9 irrespective of the temperature ranging from 15˚C to 20˚C. Another series of tests produced a pH of 5.9 to 6.0 at 25˚C for the 0.125 and 0.25 molar
  (1750 and 3500 mg/L TAN) solutions.
The discrimination between the measured and expected pH therefore resulted from the interference of other dissolved compounds or elements at the time of testing, besides the effect of NH4Cl. Because the observed pH was higher than that expected theoretically, the dissolved compounds or elements were either absorbing the H+ ions generated by the NH4+ dissociating into NH3, or simply attenuating the extent of the dissociation process as a result of a higher H+ availability. Since the NH4Cl solution was prepared in distilled water, dissolved atmospheric CO2 with a pKa of 6.35 is the most logical compound capable of producing such interference. Since the measurements were conducted in January and February, the ambient laboratory air likely contained CO2 levels of 800 to 1000 ppm, standard winter CO2 concentrations in public buildings. These concentrations enhanced the amount of dissolved CO2 and accordingly H2CO3. Accordingly, the initial solution pH indicated that  dissociation was influenced by other dissolved compounds primarily dissolved from the atmospheric, such as CO2 forming
  absorbing H+ and buffering a change in pH with the addition of NH4Cl.
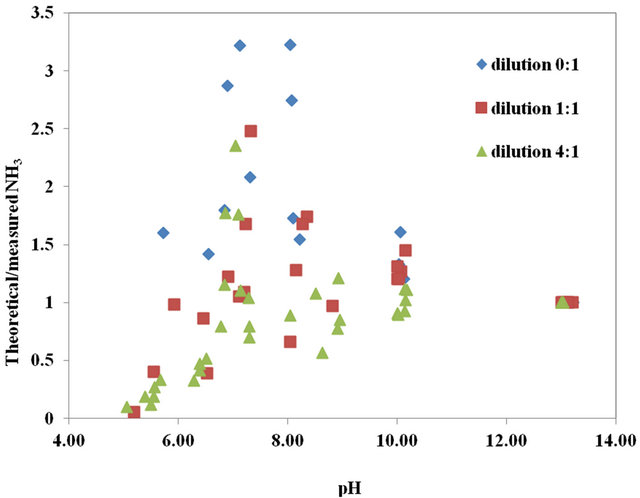
The ratio of theoretical to measured [NH3] is presented in Figure 1(a), for both NH4Cl solutions, as a function of pH. The first observation is that, below a pH of 6.5, the 3500 mg TAN/L at 15˚C - 20˚C and 1750 mg TAN/L at 25˚C produced a ratio generally under 1.0, except for the 3500 mg TAN/L solution at 25˚C which produced a ratio between 0.9 and 1.5. At a pH above 6.5, both the 3500 mg TAN/L produced a peak ratio of 2.3, as compared to the 1750 mg TAN/L producing a peak ratio of 1.5. At 25˚C, and compared to the 3500 mg/L solution, the 1750 mg/L solutions produced a lower theoretical to measured [NH3] ratio for a pH range of 7.7 to 8.7 (95% probability).
The observed ratio of theoretical to measured [NH3] in Figure 1(a) is explained by the buffering action of H2CO3. When adding a weak acid such as  to a solution of
 , the reaction illustrated by Equation 6 shifts to the left, thus producing H2CO3 absorbing H+, creating a H+ deficit and increasing [NH3]. Furthermore, this left shift of reaction for Equation 6 releases CO2 to the atmosphere further increasing the deficit of H+. This
 (a)
(a)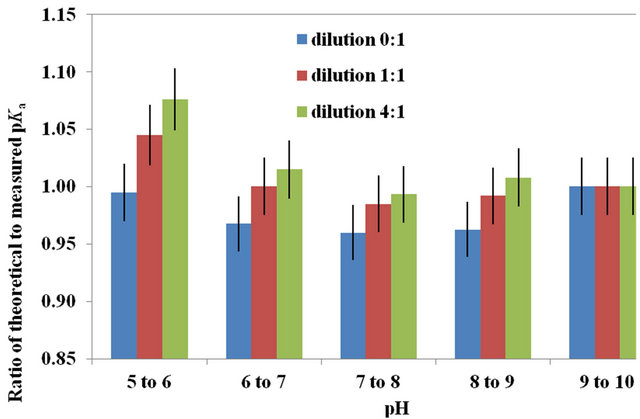 (b)
(b)
Figure 1. (a) Ratio of theoretical to measured NH3 concentrations as a function of pH for NH4Cl solutions of 3500 mg TAN/L at 15˚C - 20˚C and 25˚C and 1750 mg TAN/L at 25˚C. (b) Average ratio of the theoretical to measured pKa as a function of pH ranges selected to highlight significant difference, for NH4Cl solutions of 3500 mg TAN/L at 15˚C - 20˚C and 25˚C and 1750 mg TAN/L at 25˚C. The error bar is based on the coefficient of variance.
phenomenon is also observed in high salt solutions where CO2 solubility is reduced. Finally, this left shift of reaction for Equation 6 results in the absorption of H+ ions, explaining the higher observed pH discussed above. For the 3500 mg TAN/L solution at 25˚C with a higher ratio of theoretical to measured [NH3] as compared to the other treatments, the explanation is a higher  concentration versus a lower dissolved CO2 presence, thus shifting the H+ balance. At 25˚C, CO2 is less soluble.
At a pH above 6, the [OH–] increases and the reverse reaction happens. The measured [NH3] is lower than that expected theoretically because adding OHto an existing solution of  and
and  shifts the reaction of Equation 6 to the right. Thus,
  dissociation is reduced as compared to theoretical computations because of a lower deficit of exchangeable H+ [29]. Interestingly enough, temperature resulting in a lower CO2 concentration and
  concentration had less effect at such a pH range. Nevertheless, the 1750 mg TAN/L solution produced a significantly higher (95% confidence level) percentage of
  dissociation for a pH range of 7.5 to 9.0, likely because of its lower concentration requiring less H+. Instead of producing twice the NH3, the 3500 mg TAN/L solution produced only 10% more (6 × 10⁻⁹ moles of NH3 as compared to 5 × 10⁻⁹ moles of NH3) as compared to the 1750 mg/L solution at a pH of 7.5 to 9.0.
The ratio of theoretical to measured pKa as a function of pH range is illustrated in Figure 1(b) with error bars based on the coefficient of variance. As compared to Figure 1(a), this comparison better illustrates temperature effects for the 3500 mg TAN/L solution below a pH of 6.5, with more dissociation at 25˚C. At a pH above 6.5, the 1750 mg/L solution produced a significantly lower ratio of theoretical to measure pKa as compared to the 3500 mg TAN/L solution (95% probability). For the 3500 mg TAN/L solution at 15 - 20 and 25˚C, and the 1750 mg TAN/L solution at 25˚C, the measured pKa was reduced by 9.65, 9.69 and 9.81 respectively, as oppose to that computed theoretically.
In conclusion and at neutral pH range, simple NH4Cl solutions do not dissociate according to the theoretical pKa coefficient associated with pure solutions. Rather and because of the presence of especially dissolved atmospheric CO2, the NH4Cl solutions demonstrated a lower dissociation level compared to theoretical values, by a factor of 1.5 to 2.3, for TAN concentrations of 1750 to 3500 mg/L. Nevertheless, at a pH under 6 and a temperature of 25˚C, such solutions tended to demonstrate a higher dissociation levels as compared to the theoretical values for pure solutions.
3.3. Ammonium Dissociation with Swine and Cattle Manures
The swine manure was tested at different temperatures and dilutions: 20˚C to 25˚C for a dilution of 0 (1 part manure to 0 part distilled water); 8 to 15 and 20˚C to 25˚C for a dilution of 1 (1 part manure to 1 part distilled water), and; 8 to 15 and 20˚C to 25˚C for a dilution of 4 (1 part manure to 4 parts distilled water). The four dilutions produced 3800, 1910 and 765 mg TAN/L, where the first two dilutions had a TAN equivalent to that of the two NH4Cl solutions.
Because manures contain a much wider range of compounds and solids, their  dissociation as a function of pH should be more complex and variable than that of the NH4Cl solutions. Manures contain: solids affecting viscosity and therefore the rate of exchange of CO2 with the atmosphere; organics generating dissolved gases such as CO2, H2S and CH4 as a result of microbial degradation, and; soluble compounds including organic acids and H3PO4 [20,21] with a lower pKa than that of
 . For example, acetic acid has a pKa of 4.75 compare to that of
  at 9.25.
In Figure 2(a), the theoretical to measured [NH3] is illustrated as a function of pH. For all three dilutions, the trend is similar to that of the NH4Cl solutions. Nevertheless, some differences are observed. Below a pH of 6.0 and for the dilutions of 1 and 4, the ratio of theoretical to measured [NH3] is lower than that of the NH4Cl solutions, likely because of the additional CO2 produced by the microbial activity also know to increase with manure dilution. Still as compared to the NH4Cl solutions and for a pH of 6 to 8, the ratio of theoretical to measured [NH3] reaches a higher peak of 2.4 to 3.5, with higher values associated to the higher TAN swine manures with lower dilution rate.
At a pH under 6.0, higher CO2 levels generated from microbial activity and lower TAN concentrations for the diluted manures push the ratio of theoretical to measured [NH3] towards lower numbers below 1.0. This ratio for the less diluted manure at 3800 mg TAN/L remained generally above 1.0, similarly to the 3500 mg TAN/L solution of NH4Cl. For a pH of 6 to 9, the swine manure diluted 4 times tended to present a theoretical to measured [NH3] ratio of more or less 1.0. This can simply result from its dilution producing a lower TAN concentrations requiring less H+ for the dissociation process.
Still for the swine manure, the ratio of theoretical to measured pKa as a function of pH is illustrated in Figure 2(b) with a trend similar to that of the [NH3] ratio. On the average and for a pH between 6.5 and 9, the measured pKa for the swine manure diluted to a level of 0, 1 and 4 produced a pKa equal to 0.96, 0.975 and 0.995 times that computed theoretically. For all pH tested, the ratio of theoretical to measured pKa was inversely proportional to the swine manure TAN. Because of the result variability caused by the presence of other compounds, the difference was significant between the 0:1 and 4:1 dilutions
(a)(b)
Figure 2. (a) For swine manure, ratio of theoretical to measured NH3 concentrations as a function of solution pH for temperatures of 20˚C to 25˚C at a dilution of 0 (1 part manure to 0 part distilled water); 8˚C to 15˚C and 20˚C to 25˚C at a dilution of 1 (1 part manure to 1 part distilled water), and; 8˚C to 15˚C and 20˚C to 25˚C at a dilution of 4 (1 part manure to 4 parts distilled water). (b) Average ratio of theoretical to measured pKa versus a rqnge of pH for swine manure at: 20˚C to 25˚C and a dilution of 0 (1 part manure to 0 part distilled water); 8˚C to 15˚C and 20˚C to 25˚C and a dilution of 1 (1 part manure to 1 part distilled water), and; 8˚C to 15˚C and 20˚C to 25˚C and a dilution of 4 (1 part manure to 4 parts distilled water). The error bar is based on the coefficient of variance.
(95% confidence level) only for a pH of 5.0 to 6.0.
The ratio of theoretical to measured [NH3] of the dairy manure diluted 4 times is illustrated in Figure 3(a) at a TAN of 400 mg/L. This ratio follows the trends observed with the swine manure and the NH4Cl solutions. Nevertheless, the 8˚C to 15˚C tests provided a linear relationship with pH, on the average and despite the result variation, whereas the 25˚C test demonstrated a ratio decreasing from 2.6 to 1.2, for a pH of 7 to 9. This may result from a more active microbial population at 25˚C since the samples were left on the bench top for 24 h before testing. Cattle manure has higher fiber content than that of swine manure, offering a lower and more variable microbial digestibility especially at low temperatures.
For the diluted cattle manure, the ratio of theoretical to measured pKa as a function of pH is illustrated in Figure 3(b). This figure demonstrates the temperature effect on the pKa ratio, especially for a pH of 7 to 8. On the average and for a pH between 6.5 and 9, the measured pKa for the dairy cattle manure was equal to 0.975 and 0.98
 (a)
(a)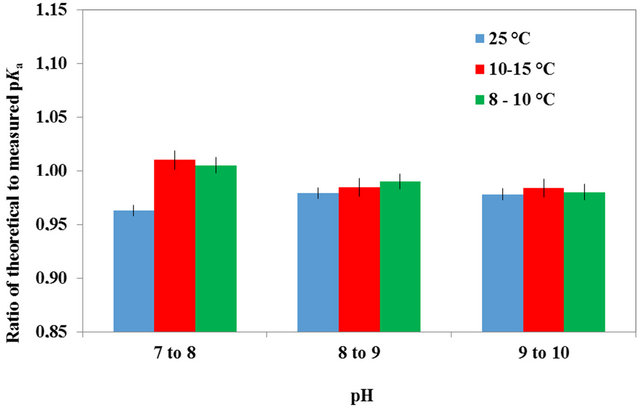 (b)
(b)
Figure 3. (a) Ratio of theoretical to measured NH3 concentrations as a function of solution pH for temperatures of 8˚C - 10˚C, 10˚C - 15˚C and 25˚C, for dairy manure at a dilution of 1:4 (1 part manure and 4 parts distilled water). (b) Average ratio of the theoretical to measured pKa as a function of a pH range for cattle manure at temperatures of 8˚C - 10˚C, 10˚C - 15˚C and 25˚C, and a dilution of 1:4 (1 part manure and 4 parts distilled water). The error bar is based on the coefficient of variance.
times that computed theoretically.
4. Conclusions
The objective of the present research was to measure the level of  dissociation at temperature of 10˚C to 25˚C, for two NH4Cl solutions, and for swine and dairy cattle manure at different dilutions with distilled water. Ammonia concentrations ([NH3]) were measured using an NH3 selective electrode consisting of a hydrogen and silver-silver chloride electrode couple connected to a pH meter. The theoretical and measured [NH3] and dissociation coefficient, pKa, were compared as a function of pH and temperature, respectively.
The results obtained with the two NH4Cl solutions indicated that  dissociation is highly influenced by dissolved compounds, especially atmospheric CO2 with a lower pKa coefficient and therefore a greater affinity for H+. Dissolved CO2 had the effect of increasing
  dissociation at a pH under 6, but decreasing its dissociation at a pH of 6 to 10, resulting in a measured pKa higher than that computed theoretically. Lowering the TAN concentration of the solution produced a measured [NH3] approaching that computed theoretically because of a lower H+ demand.
For the swine and dairy cattle manures, the ratio of theoretical to measured [NH3] was also influenced by the TAN concentration or the level of dilution with distilled water. The more diluted manure showed a dissociation activity approaching that computed theoretically. Nevertheless, the undiluted swine manure produced a ratio of theoretical to measured [NH3] of 3.3 at a neutral pH. For the two solutions and manures tested, temperature within a range of 10˚C to 25˚C, had little if any effect on  dissociation for a normal pH range of 6.5 to 9.
The present research therefore indicates that manures and  solutions, exposed to atmosphere and at a neutral pH, show less
  dissociation activity than that expected theoretically, by a factor ranging from 1.5 to 3.3. This factor is influenced by the TAN concentration of the manure or solution, with lower TAN levels producing values closer to those computed theoretically. With previous research projects reporting 5 times less NH3 volatilization as compared to theoretical computations, the present indicates that this phenomena results from a dissociation activity generally 2.5 times lower, and thus, a gas diffusion process 2.0 times slower.
5. Acknowledgements
This project was funded by the Natural Science and Engineering Research Council of Canada.
REFERENCES
- S. C. Doney, N. Mahowald, I. Lima, R. A. Feely, F. T. Maclenzie, J.-F. Lamarque and P. J. Rasch, “Impact of Anthropogenic Atmospheric Nitrogen and Sulphur Deposition on Ocean Acidification and the Inorganic Carbon System,” Proceedings of the National Academy of Sciences, Vol. 104, No. 37, 2007, pp. 14580-14585. doi:10.1073/pnas.0702218104
- USDA, “National Program on Air Quality: Component II: Ammonia and Ammonium Emissions”. www.ars.usda.gov/research/programs/programs.htm?np_code=203&docid=320&page=2
- S. G. Sommer and N. J. Hutchings, “Ammonia Emission from Field Applied Manure and Its Reduction—Invited Paper,” European Journal of Agronomy, Vol. 15, No. 1, 2001, pp. 1-15. doi:10.1016/S1161-0301(01)00112-5
- P. Sørensen and J. Eriksen, “Effect of Slurry Acidification with Sulfuric Acid Combined with Aeration on the Turnover and Plant Availability of Nitrogen,” Agriculture, Ecosystems and Environment, Vol. 131, No. 3-4, 2009, pp. 240-246. doi:10.1016/j.agee.2009.01.024
- A. H. W. Beusen, A. F. Bouwman, P. S. C. Heuberger, G. van Drecht and G. K. W. van Der Hoek, “Bottom up Uncertainty Estimate of Global Ammonia Emissions from Global Agricultural Systems,” Atmospheric Environment, Vol. 42, No. 24, 2008, pp. 6067-6077. doi:10.1016/j.atmosenv.2008.03.044
- M. Sutton, S. Reis and S. Baker, “Atmospheric Ammonia,” Springer Publishers, Cambridge, 2009. doi:10.1007/978-1-4020-9121-6
- J. Seedorf and J. Hartung, “Survey of Ammonia Concentrations in Livestock Buildings,” The Journal of Agricultural Science, Vol. 133, No. 4, 2009, pp. 433-437. doi:10.1017/S0021859699007170
- B. Ulrich, “Interaction of Forest Canopies with Atmospheric Constituents: SO2, Alkali and Earth Alkali Cations and Chloride,” In: B. Ulrich and J. Pankrath, Eds., Effect of Accumulation of air Pollutants in Forest Ecosystems, D. Reidel Publishers, Dordrecht, 1991, pp. 330-345.
- H. Ellenberg, “Floristic Changes Due to Nitrogen Deposition in Central Europe,” Nord Miljorapport, Vol. 15, 1988, pp. 375-383.
- B. Aaby, “Monitoring Danish Raised Bogs,” In: A. Grunig, Ed., Mires and Man. Mire Conservation in a Densely Populated Country—The Swiss Experience, Komos Publishers, Birmensdorf Switzerland, 1994, pp. 284-300.
- S. C. Doney, N. Mahowald, I. Lima, R. A. Feely, F. T. Maclenzie, J.-F. Lamarque and P. J. Rasch, “Impact of Anthropogenic Atmospheric Nitrogen and Sulfur Deposition on Ocean Acidification and the Inorganic Carbon System,” Proceedings of the National Academy of Sciences, Vol. 104 No. 37, 2007, pp. 14580-14585. doi:10.1073/pnas.0702218104
- M. A. Sutton, C. E. R. Pitcain and D. Fowler, “The Exchange of Ammonia between the Atmosphere and Plant Communities,” Advances in Ecological Research, Vol. 24, 1993, pp. 301-393. doi:10.1016/S0065-2504(08)60045-8
- E. Brouwer, R. Bobbink, F. Meeuwsen and J. G. M. Roelofs, “Recovery from Acidification in Aquatic Mesocosms after Reducing Ammonium and Sulphate Deposition,” Aquatic Botany, Vol. 56, No. 2, 1997, pp. 119-130.
- S. Fleischer,”CO2 Deficit in Temperature Forest Soils Receiving High Atmospheric N-Deposition,” Royal Swedish Academy of Sciences, Vol. 32, No. 1, 2003, pp. 2-5.
- L. J. M. Van der Eerden, P. H. B. de Visser and C. J. Van Dijk, “Risk of Damage to Crops in the Direct Neighbourhood of Ammonia Sources,” Environmental Pollution, Vol. 102, No. 1, 1998, pp. 49-53. doi:10.1016/S0269-7491(98)80014-6
- A. G. Hashimoto and D. C. Ludington, “Ammonia Desorption from Concentrated Chicken Manrue Slurries,” Livestock Waste Management and Pollution Abatement: The Proceedings of the International Symposium on Livestock Wastes, Paper PROC-271. ASABE, St. Joseph, 1971, pp. 117-121.
- H. Chaoui, F. Montes, C. A. Rotz and T. L. Richard, “Dissociation and Mass Transfer Coefficients from Ammonia Volatilization Models,” Annual International Meeting. Paper 083802. ASABE, St. Joseph, 2008, pp. 117- 121.
- R. H. Zhang, P. Yang, Z. Pan, T. D. Wolf and J. H. Turnbull, “Treatment of Swine Wastewater with Biological Conversion, Filtration, and Reverse Osmosis: A Laboratory Study,” Transactions of the ASAE, Vol. 47, No. 1, 2004, pp. 243-250.
- L. Masse, D. Masséand Y. Pellerin, “The Effect of pH on the Separation of Manure Nutrients with Reverse Osmosis Membranes,” Journal of Membrane Science, Vol. 325, No. 2, 2008, pp. 914-919. doi:10.1016/j.memsci.2008.09.017
- R. Loerh, “Pollution Control for Agriculture,” 2nd Edition, Academic Press Inc. (Harcourt Brace Jovanovich Publishers), Orlando, 1984, pp. 166-168.
- S. D. Hafner and J. J. Bisogni, “Modeling of Ammonia Speciation in Anaerobic Digesters,” Water Research, Vol. 43, No. 17, 2009, pp. 4105-4114. doi:10.1016/j.watres.2009.05.044
- R. G. Bates and G. D. Pinching, “Acid Dissociation Constant of Ammonium Ion at 0 to 5˚C and the Base Strength of Ammonia,” Journal of Research National, Bureau Standard, Vol. 42, 1949, p. 419. doi:10.6028/jres.042.037
- R. G. Bates and G. D. Pinching, “Dissociation Constant of Aqueous Ammonia at 0 to 5˚C from E. m. f. Studies of the Ammonium Salt in a Weak Acid,” Journal of American Chemical Society, Vol. 72, No. 3, 1950, pp. 1393- 1396. doi:10.1021/ja01159a087
- APHA, “Standard Methods for the Analysis of Water and Wastewater,” American Public Health Association, Washington DC, 2005.
- G. R. Jayaweera and D. A. Mikkelsen, “Ammonia Volatilization from Flood Soil Systems: A Computer Model,” Soil Science Society of America Journal, Vol. 54, No. 5, 1990, pp. 1447-1455. doi:10.2136/sssaj1990.03615995005400050039x
- G. Olofsson, “Thermodynamic Quantities for the dissociation of Ammonium Ion and for the Ionization of Aqueous Ammonia over a Wide Temperature Range,” Journal of Chemical Thermodynamics, Vol. 7, No. 6, 1975, pp. 507- 514. doi:10.1016/0021-9614(75)90183-4
- R. H. Piedrahita and A. Seland, “Calculation of pH in Fresh and Seawater Aquaculture Systems,” Aquaculture Engineering, Vol. 14, No. 4, 1995, pp. 331-346. doi:10.1016/0144-8609(94)00012-P
- D. Georgacaris, D. M. Sievers and E. L. Iannotti, “Buffer Stability in Manure Digesters,” Agricultural Wastes, Vol. 4, No. 6, 1982, pp. 427-441. doi:10.1016/0141-4607(82)90038-5
- M. L. Davis and S. J. Masten, “Principles of Environmental Engineering and Science,” McGraw Hill Publishers, New York, 2004, p. 69.
NOTES
*Corresponding author.