Journal of Environmental Protection
Vol. 3 No. 10 (2012) , Article ID: 23825 , 9 pages DOI:10.4236/jep.2012.310146
Assessment of Underwater Anthropogenic Noise Associated with Construction Activities in Bechers Bay, Santa Rosa Island, California
![]()
1Geo-Marine Inc., Plano, USA; 2University at Buffalo, Buffalo, USA.
Email: edazey@geo-marine.com
Received July 16th, 2012; revised August 14th, 2012; accepted September 18th, 2012
Keywords: Acoustic Monitoring; Pile Drilling; Mitigation; Channel Islands
ABSTRACT
Acoustic monitoring and mitigation of underwater construction noise was conducted during marine pier demolition and reconstruction activities near Santa Rosa Island, California. Activities spanned two construction seasons and used both auger and pneumatic percussion drilling methods for pile placement. Pile drilling activities during construction resulted in sound pressure levels (SPL) ranging from 121.0 to 184.5 dB re 1 μPa. No significant difference was found for calculated source SPLs between the Season 1 and Season 2 methods of pile drilling (KW = 2.28, p = 0.15). Additionally, no significant difference was found for calculated source SPLs during active drilling between the Season 1 and Season 2 methods of pile drilling (KW = 3.39, p = 0.07). The average calculated source SPL documented during this study was lower than the NOAA Fisheries mandated safety zone threshold (160.0 dB re 1 μPa [rms]) for harassment to marine mammals. This is the first known report of SPL data collected in concert with marine pile drilling via the auger drilling technique. The results from this study can be used to improve information for and assist with the development of regulatory policies and techniques regarding sound level thresholds and mitigation monitoring.
1. Introduction
Underwater construction encompasses a broad spectrum of activities that include, but are not limited to: pile driving (e.g., impact, vibration, and gravity driving), drilling, coring, dredging, excavation, hydroor vibro-hammering, and blasting [1]. Most underwater construction activities introduce recurring noise at levels capable of causing serious physical and behavioral impacts on marine life that use sound for a variety of reasons (e.g., navigation, communication, foraging [2-5]). The significance of potential impacts is dependent on several factors including the magnitude of sound pressures generated by the activity and the types of species receiving the sound pressures [6]. Impacts are situational and context specific and vary with source levels, exposure type (e.g., continuous, pulse), duration, site characteristics (affecting propagation and attenuation), and species’ auditory characteristics [4].
Marine construction activities, like pile driving, have the potential to create high underwater sound pressures (215 dB [6]) that may result in lethal or sub-lethal injurious or behavioral impacts to marine life. Depending on the sound level and presence of various species, this may lead to a regulatory taking of some species, such as marine mammals, that are protected under the United States (US) Marine Mammal Protection Act (MMPA) or US federal Endangered Species Act (ESA). Impacts to federally protected species can result in costly delays to construction. Activities anticipated that might produce excessive sound pressure levels (SPLs) when marine mammals might be present are required to use measures to avoid or minimize potential impacts (e.g., threshold shifts or barotrauma). Mitigation measures often include the use of underwater acoustic monitoring to establish safety zones around the source of anthropogenic noise associated with construction activities.
SPLs from pile driving activities have been fairly well studied and reported [6-8], while SPLs from other marine construction activities are not as well known. This paper represents the first known report of SPL data collected in concert with marine pile drilling via the auger drilling technique. Results are based on the real-time monitoring of underwater construction noise during marine pier demolition and reconstruction near Santa Rosa Island, California. Activities spanned two construction seasons and used both auger and pneumatic percussion drilling methods of pile installation. During construction activities, the National Oceanic and Atmospheric Administration (NOAA) Fisheries required the establishment of marine mammal safety zones (as described in 70 FR 1871, 71 FR 3260, and 73 FR 41,318) and underwater acoustic monitoring of pile drilling noise and requested peak sound pressures and root mean squares (RMS) to be measured and reported1. Dynamic safety zones were based on underwater acoustic measurements of noise levels produced in association with in-water active construction; the regulatory value 160 dB re 1 µPa at 1 m threshold was used as a maximum source reference value when calculating safety zones based on received SPL measures. When a received SPL value yielded a calculated (based on distance between source and SPL meter) source SPL in excess of 160 dB, the associated safety zone was identified. Sound level monitoring of construction noise was complemented by qualified visual monitors; the visual monitor would confirm whether marine mammals were present or not within the identified safety zone before construction activity could continue. In addition to characterizing sound pressures from the auger drilling method, we compared documented SPLs to those observed with the pneumatic percussion drilling method.
2. Methods
2.1. Study Area
Santa Rosa Island is located 42 km west of Santa Barbara, California and is part of the Channel Islands National Park. The marine pier construction site was located within Bechers Bay on the northeast coast of the island (34˚0'29"N, 120˚2'51.84"W, Figure 1). Bechers Bay is a large, open, shallow-water environment that includes a sea floor consisting of sand, rock, kelp, and other geographic features (Figure 1).
A timber pier was constructed in Bechers Bay in the late 1800s to support cattle ranching operations. Since the National Park Service (NPS) acquired Santa Rosa Island in the 1980s, the pier has provided primary access for the NPS personnel and visitors. The pier experienced multiple structural failures over the years and underwent subsequent rebuilds as recent as 2006 [9]; however, these
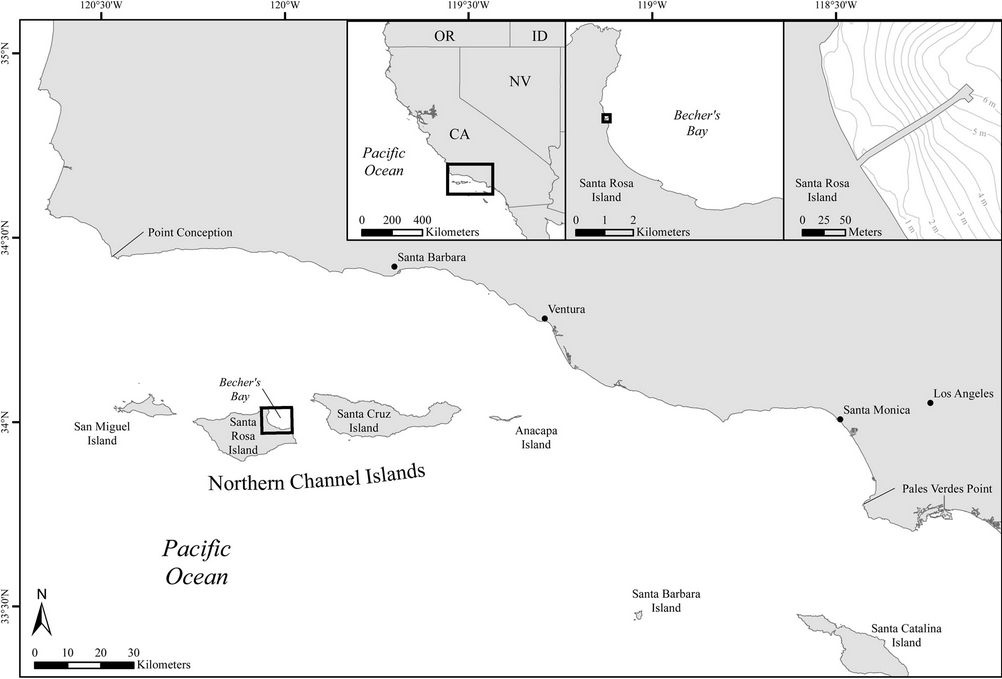
Figure 1. The location of Santa Rosa Island and Bechers Bay in relation to southern California and other Northern Channel Islands [11]. Inset in the top right corner depicts the pier that was demolished and then rebuilt during this project.
rebuilds were intended as short-term repairs. The NPS proposed complete reconstruction of the pier in 2007 [10]. The original pier extended approximately 175 m into Bechers Bay. The footprint for the new pier was designed to match as closely as possible to the old pier. In addition, the new pier would be reinforced in structure and design and provide wheelchair accessibility.
2.2. Construction Activity Technical Details
Construction activities spanned approximately 13 months (nonconsecutive) from April 2009 to July 2011, and were divided into two construction seasons designated Season 1 (April to September 2009) and Season 2 (November to July 2011) for this paper. Removal of original pier pilings was completed at the beginning of Season 1 using a hydraulic vibratory extractor (HVE) and a hydraulic clamshell grab bucket. The grab bucket was used to remove fallen and loose pilings; the HVE was used to extract embedded pilings through vibration. In-water pier demolition activity was conducted for a period of nine days total in May and June 2009.
Two methods were used for pile installation during reconstruction of the new pier. During Season 1, a downthe-hole (DTH) pneumatic percussion drilling method was used, while an auger-drilling technique was used during Season 2.
DTH pneumatic percussion drilling—The DTH pneumatic percussion drilling technique operated with a pounding action as it rotated. When the drill bit head came into contact with a resistant material, the piston in the hammer unit activated and the pounding force broke through the material. The pier pile was fit over the drill bar with the drill head extending beyond the bottom of the pile. As the drill advanced, so did the pile. When the borehole was complete, the drill head was retracted and the drill was removed from the hole, leaving behind the piling [12].
Auger-drilling—The auger-drilling method was comprised of six phases: casing installation, auger drilling, cleanout bucket and core barrel drilling, pile installation (including fenders), casing removal, and HVE. Casing installation included actively twisting a casing into the substrate as well as tapping the top of the casing with the drill rig Kelly bar (fender casings only). Drilling activities were conducted within casings using a variety of drill bits (single-flight rock auger, cleanout bucket, and core barrel) attached to the drill rig’s Kelly bar. Pile installation consisted of the insertion of a pile into the casing after the borehole was drilled; this stage was relatively short with respect to other in-water construction activity. Casing removal was also typically a short process; however, occasionally the casings would become stuck and would need to be struck on the side with a large hammer or forcefully twisted by the drill rig to release the casing. In a few instances, the HVE was used to vibrate casings loose.
2.3. Pile-Drilling Noise Monitoring
Baseline underwater ambient noise levels in Bechers Bay were documented prior to construction activity and again once pile placement was complete to facilitate comparison of noise levels before and after construction activities. Acoustic monitoring, in conjunction with visual monitoring, was completed in accordance with the mitigation requirements mandated by NOAA Fisheries and in consultation with the NPS. During in-water construction procedures, acoustic data were collected to measure noise levels underwater. SPLs were monitored in real time while in-water construction was ongoing; monitoring stations varied depending on construction activities and progress. In addition to real-time monitoring, one-to five-minute scan samples of audio data were recorded every 30 to 60 min during in-water construction. When monitoring was conducted by boat, data were recorded at distances of 47 to 194 m from the source of construction; variability was contingent upon safety of the acoustic monitor and weather and sea conditions. After the pier was constructed to a point suitable for deployment of the acoustic equipment, monitoring was conducted from a platform beneath the pier. Noise levels were read from a hydrophone placed one to two bents (a row of bearing piles held in position with a pile cap; 6.09 m row separation) away from the active construction site; an approximate distance of 6 to 12 m from the noise source.
All measurements were made in relatively shallow water, where attenuation is quite complex and cylindrical spreading is dominant, thus the following equation was used:
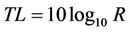 , (1)
, (1)
where TL is transmission loss and R is a factor for the distance from the sound source. Using this spreading equation, the source SPLs and complementary acoustic safety zone boundaries were calculated.
Season 1 Baseline Monitoring—Seven days of baseline acoustic monitoring were completed; ambient noise levels were recorded from a portable, inflatable skiff powered by a 6 HP, 4-stroke outboard engine. Baseline acoustic recordings were collected at several locations: 1) adjacent to the original pier structure at the outermost bent (158 m from shore, along each side of the pier as permitted by topography); 2) approximately adjacent to bents 10 and 14 (43 and 67 m from shore, respectively); and 3) at 50, 100, 150, and 200 m perpendicular to and along both sides of the pier. All distances were measured with a handheld rangefinder. Baseline recordings were completed on each side of the pier at least once per day to obtain ambient noise levels during times when pile drilling activities were planned. Recordings were made during the same time of day for each side of the pier. Baseline data were collected during all weather conditions (contingent upon the safety of the acoustic monitor) to best gauge the contribution of wind and wave action to the ambient noise levels. Ambient noise was recorded using one of two available omni-directional hydrophones2 extended 1 to 2 m into the water (approximately mid-water column) from the side of the boat, dependent upon depth at the specific recording site. The hydrophone was interfaced with an onboard laptop computer by a dynamic signal acquisition system/USB audio interface (ST Spectra Group, ST191DSA). The boat was anchored with the motor off during all acoustic recordings. Each recording was a minimum of three minutes. Recordings were digitized and stored in waveform audio (wav) format using SpectraPro software.
Acoustic properties were examined in time-frequency spectrograms with a 512 FFT size, 50% overlap, and Hann window using Raven Pro software. Selections of 30-second slices were made from each recording (from 10 to 40 seconds of every minute) allowing for triplicate measurements within each recording. Maximum frequency (Hz) and SPL (dB re 1 μPa [rms]) measurements were taken of each selection and averaged for each recording. Descriptive statistics were run on the baseline data. Data were confirmed for normalcy using a ShapiroWilks test.
Latitude and longitude were determined at every recording location using a handheld GPS to facilitate creation of a contour plot of ambient noise levels in effort to assess how wind and wave action and variations in bottom topography influence SPL readings. Baseline measurements were used to assess ambient noise level contributions to construction activities. It should be noted that beginning on day two, and continuing throughout baseline data collection, a tugboat and two construction barges were present in the bay, restricting recording locations and introducing inconsistent anthropogenic noise. This noise may have skewed the baseline data.
Season 1 Construction Monitoring—During 17 days of acoustic monitoring during construction activities, data were recorded from the inflatable skiff approximately 60 m from the site of active extraction or drilling; exact distance varied based on environmental conditions to ensure the safety of the acoustic monitor. The same recording equipment was used as during baseline monitoring. SPLs were measured using SpectraPro for sound and vibration measurement. Data were collected at a 44.1 kHz sampling rate with a 4096 FFT size and a Hann window. All distances (to source and to shore) and position coordinates were obtained in the same manner as during baseline monitoring. Water temperature data were also collected using a basic handheld thermometer.
Descriptive statistics were used to calculate peak frequency, received SPL measurements, calculated source SPLs, and associated safety zones. Additionally, an ANOVA test was used to determine if there was a statistically significant difference between SPLs from baseline recordings and source SPLs calculated during construction.
Season 2 Construction Monitoring—During 63 days of acoustic monitoring, data were collected from two stations: 1) the inflatable skiff as used in Season 1; or 2) an unfixed surface suspended beneath the pier. Monitoring from the pier was only conducted when pier construction had extended to an appropriate water depth such that monitoring was not impeded by effects of the surge zone or proximity to the active drilling location. Noise levels were recorded using an omni-directional hydrophone (same as Season 1) extended to approximately mid-water depth. A weighted line accompanied the hydrophone cable to minimize movement related to water currents. While monitoring from the pier, the SPL meter was placed on closed-cell foam padding to dampen potential effects of pier vibration that might skew readings. All distances (to source and to shore) and position coordinates were obtained in the same manner as during baseline and Season 1 monitoring. Wind speeds over water and water temperature data were collected using a handheld anemometer and thermometer, respectively. Recordings were digitized and stored in wav format. SPL measurements recorded during real-time monitoring were logged per second in data logs for data analysis.
Post-Construction Monitoring—Post-construction ambient noise levels were recorded from the skiff for comparison to baseline recordings gathered prior to pier demolition. Recordings were collected at several locations: 1) adjacent to the pier structure at the outermost bent (158 m from shore; within 10 m of each side of the pier as permitted by topography); 2) approximately adjacent to bents 16 and 20 (79 and 104 m from shore, respectively3); and 3) at 50, 100, 150, and 200 m perpendicular to and on both sides of the pier at about bent 20. All distances were measured with a handheld rangefinder. Postconstruction baseline recordings were completed to obtain ambient noise levels during the morning after pile drilling activities. Weather conditions and time constraints permitted post-construction baseline monitoring on only one day. Tidal state, wave action, and swell height were recorded to compare with pre-construction ambient noise recordings.
Post-construction baseline data were collected during wind speeds of 9.6 to 13.9 knots and ranging from 2 to 4 on the Beaufort Scale. These conditions represented average weather conditions experienced during in-water construction and allowed for best estimation of the contribution to noise levels from wind and wave action. Ambient noise was recorded in the same manner, using the same equipment as earlier in Season 2. Each recording lasted a minimum of 3 min. Recordings were digitized and stored in wav format. Latitude and longitude were determined at every recording location using the handheld GPS.
2.4. Statistical Analyses
Descriptive statistics (minimum [min], maximum [max], average [ ] and standard deviation [SD]) were run on Seasons 1 and 2 data (baseline and construction), using SYSTAT® software. Additionally, ambient noise maps were created from Season 1 baseline data points to display measured SPLs from Bechers Bay.
Season 1 data (NS1 = 142) and Season 2 data (NS2 = 1932) were compared and tested for significance. Statistical analysis was also conducted for Season 1 (NS1 = 31) and Season 2 (NS2 = 1030) data collected during active drilling only (i.e., active DTH versus active auger drilling). All data were tested for normality using the chisquare (X2) Goodness of Fit (GOF) test and for homoscedacity of variances using the Bartlett test. The data are non-normal and non-homoscedastic, thus the Kruskal-Wallis (K-W) one-way analysis of variance (ANOVA) test was applied to the two-sample ranked dataset.
Baseline data were not compared between pre-construction data collection for Season 1 and post-construction data collection for Season 2 because the data collection locations were not consistent between preand postconstruction, primarily because of equipment placement. However, a general comparison of baseline data indicates that ambient noise levels returned to pre-construction levels once the in-water active construction was complete.
3. Results
Season 1 Baseline Monitoring—During the seven days of pre-construction baseline monitoring, 143 acoustic recordings were collected. Ambient noise SPLs ranged from 70.6 to 110.9 dB with an average peak frequency of 174.1 Hz (Table 1).
Season 1 Construction Monitoring—From 28 May to 28 September 2009 (17 nonconsecutive days), calculated source SPLs collected during real-time monitoring and sound recordings of in-water construction (142 data points) ranged from 118.0 to 183.0 dB with an average of 150.1 dB and an average peak frequency of 484.0 Hz (Table 2). SPL measurements from real-time data logs captured per second indicated a total of 30 instantaneous noise spikes (source SPLs at or above the 160 dB threshold) that occurred during in-water construction (Table 3). The average source SPL above the threshold was 167.8 dB with an average peak frequency of 321.5 Hz. SPLs were documented on each day for which HVE and pile drilling occurred (Figures 2 and 3, respectively). The maximum source SPL (182.7 dB) was recorded during pile extraction procedures (i.e., HVE use).
It should be noted that on 7 August 2009, a pile made contact with the hull of an on-site barge resulting in a source level of 192 dB (safety zone 1758 m). This was the highest calculated SPL throughout the entire project
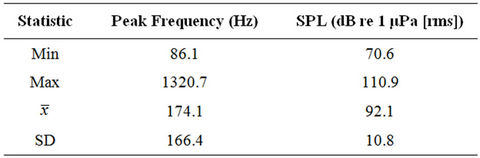
Table 1. Descriptive statistics for peak frequency and SPLs measured from recordings during baseline monitoring in Bechers Bay April and May 2009 (N = 143).
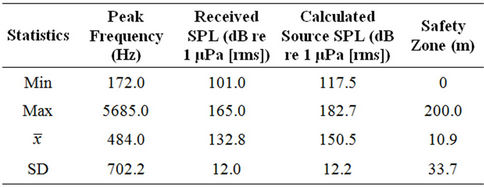
Table 2. Descriptive statistics for peak frequency, SPLs measured, calculated source SPLs, and associated safety zones during construction monitoring in Bechers Bay May to September 2009 (NS1 = 142).
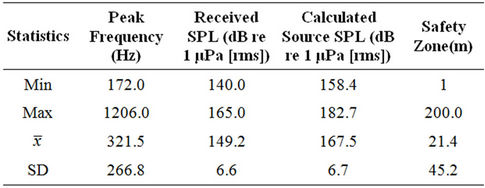
Table 3. Descriptive statistics for peak frequency, SPLs measured, calculated source SPLs, and associated safety zones for all occurrences of a source SPL exceeding 160 dB during construction monitoring in Bechers Bay May to September 2009 (NS1 = 31).
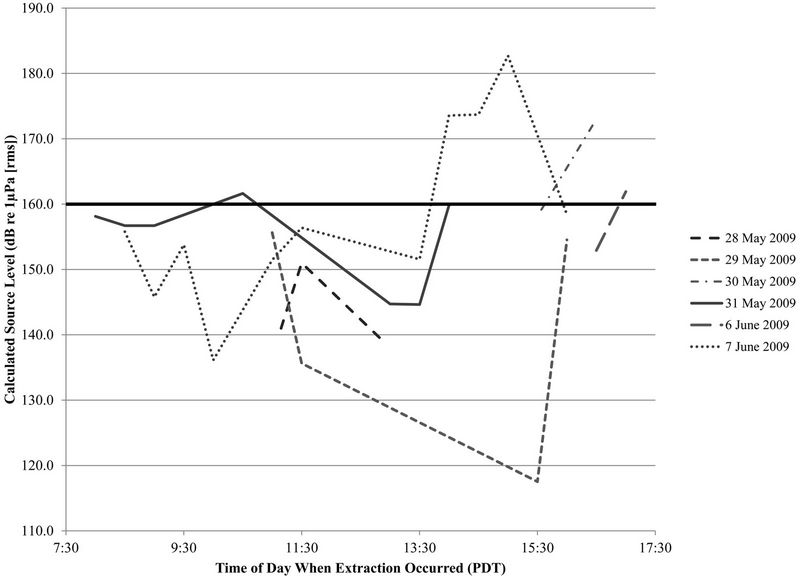
Figure 2. Daily, calculated source levels during pile extraction activities. Each line represents a day of construction monitoring in Bechers Bay during May and June 2009. The solid black line at 160 dB re 1 μPa (rms) represents the safety zone threshold.
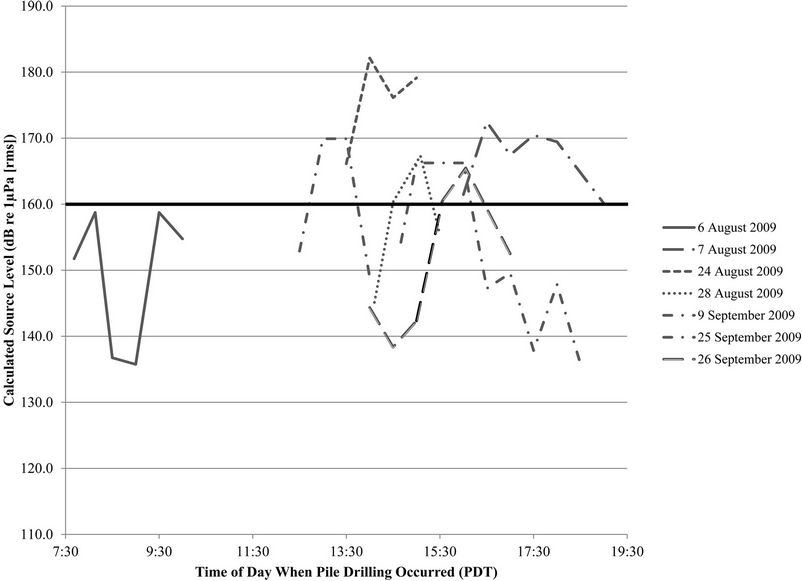
Figure 3. Daily, calculated source levels during pile drilling activities. Each line represents a day of construction monitoring in Bechers Bay during August and September 2009. The solid black line at 160 dB re 1 μPa (rms) represents the safety zone threshold.
and was considered a unique one-time event. Therefore, this data point was not included in statistical analyses or the following graphs and tables.
Minor construction delays related to mitigation monitoring were primarily a function of seasonal weather. In the winter, winds caused limited visibility of water surface and unsafe conditions for vessel launching. During the summer, excessive fog (i.e., the marine layer) often caused delays to visual monitoring, or delayed launch of the acoustic monitoring vessel.
Season 2—Construction Monitoring—From 11 November 2010 to 7 July 2011 (62 nonconsecutive days), calculated source SPLs collected during real-time monitoring and sound recordings of in-water construction (1932 data points) ranged from 121.0 to 184.5 dB with an average of 154.2 dB and an average peak frequency of 22027.7 Hz (Table 4). The maximum source SPL (184.5 dB) occurred in relation to banging activity on a fender pile.
There were a total of 770 instantaneous noise spikes that occurred during real-time monitoring and sound recordings of in-water construction (Table 5). The average source SPL above the threshold was 167.6 dB with an average peak frequency of 22240.5 Hz. Of the six phases of in-water construction in Season 2, casing installation yielded the highest source SPL of 184.5 dB (Figure 4). The auger-drilling phase generated 365 instantaneous noise spikes or 47.4% of spikes, which was the highest amount observed over all phases. The other phases that emitted instantaneous noise spikes were as follows (in decreasing order after auger drilling): Casing installation (41.3%), cleanout bucket and core barrel drilling (9.5%), casing removal (1.7%), and pile installation (0.1%). The HVE phase during Season 2 did not generate source SPLs above the threshold (Table 6).
No significant difference was found for calculated source SPLs between the Season 1 and Season 2 methods of pile drilling (KW = 2.28, p = 0.15). Additionally, no significant difference was found for calculated source SPLs during active drilling only between the Season 1

Table 4. Descriptive statistics for peak frequency, SPLs measured, and calculated source SPLs from 62 days of real-time monitoring and sound recordings during in-water construction in Bechers Bay November 2010 to July 2011 (NS2 = 1932).
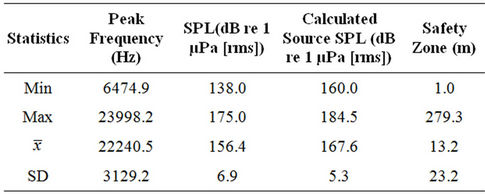
Table 5. Descriptive statistics for peak frequency, SPLs measured, and calculated source SPLs for all occurrences of a source SPL exceeding 160 dB re 1 µPa (rms). Data collected during real-time monitoring and sound recordings during in-water construction in Bechers Bay November 2010 to July 2011 (N = 770).

Table 6. Number of noise spikes exceeding 160 dB re 1 µPa (rms) for each defined in-water construction phase and percentage of total SPL spikes above the threshold received during real-time monitoring and sound recordings taken at Bechers Bay from November 2010 to July 2011.
and Season 2 methods of pile drilling (KW = 3.39, p = 0.07).
Season 2—Post-Construction Baseline—During postconstruction baseline monitoring, 14 acoustic recordings were collected. Ambient noise SPLs ranged from 106.0 to 107.5 dB: these ambient noise levels were similar to those collected during pre-construction baseline monitoring.
4. Discussion
Results of this study indicate that although the downthe-hole pneumatic percussion drilling technique of Season 1 is more percussive by design than the auger drilling method applied during Season 2, no significant difference in SPLs existed between the two construction methods for pile installation at Bechers Bay. During the 79 days of acoustic monitoring concurrent to in-water construction, the highest SPLs were related to percussive activities such as hydraulic vibratory extraction, striking the casing, and instances when drill bits made contact with the inside wall of casings. Although results showed higher calculated source SPLs during the Season 2 auger drilling method, these data were not significantly higher
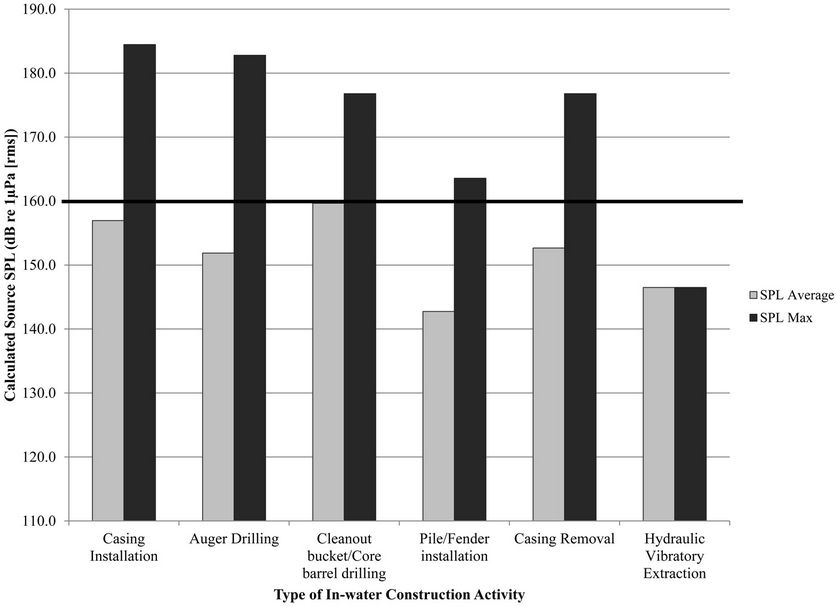
Figure 4. Calculated source SPLs measured for each defined, in-water construction phase during real-time monitoring in Bechers Bay from November 2010 to July 2011. The solid black line at 160 dB re 1 μPa (rms) represents the regulatory safety zone threshold.
than those calculated during the DTH method of Season 1. The two methods of pile drilling employed during this study presented much lower calculated source SPLs than more common pile driving methods (up to 237 dB [7]) and, thus, appear to be less invasive with respect to noise pollution in the marine environment. Factors that might have contributed to these observed differences with previously documented SPL values during underwater construction include the size of the piles, the geographic area in which this pier was being constructed (i.e., substrate composition and density), water depth, and more. Additionally, even though more acoustically quiet, the auger drilling technique is not the preferred method of pile installation in the marine environment for a variety of reasons; extra equipment such as casings and drill bits, as well as pouring and setting cement in water present a number of challenges that only increase with water depth. Therefore, pile driving is typically the preferred method for pile installation [13].
A comparison of preand post-construction noise levels suggests that ambient noise levels returned to baseline values once active in-water construction was complete. This suggests that while noise levels during construction activities were elevated, a long-term impact to the acoustic environment was not observed. The lack of observed long-term impact may be due in part to the concerted effort by the NPS and construction personnel to install a new pier that mirrored the existing pier (e.g., same length, footprint, etc.).
Underwater sound created during construction activities propagates through the drilling unit, radiating sound into the water and substrate. Data reported in the literature indicate that high peak sound pressure is a critical factor in assessing potential injury to or mortality of protected species such as marine mammals [14]. Pre-drilling for pier pilings eliminates the need for high energy impulsive sounds generated by impact pile driving. Reyff (2005) reported SPLs for pile driving activities ranging from 165 dB to 215 dB and Hildebrand (2009) has shown that SPLs from pile driving can reach 237 dB. Pile drilling activities reported herein resulted in much lower SPLs from 121.0 to 184.5 dB, which are 30.5 dB lower, on the high end of the range, than maximum SPLs reported by Reyff (2005) and 52.5 dB lower than Hildebrand (2009). Additionally, the average SPL documented during this study was lower than the NOAA Fisheries mandated safety zone threshold of 160.0 dB (see [15] for discussion of thresholds) for behavioral harassment under the MMPA.
Several physical obstructions embedded in the sediment were encountered farther offshore (attributing to numerous instantaneous noise spikes) where auger-drilling practices were used, as opposed to near shore where DTH percussion drilling was conducted. Thus, distance to shore and water depth likely represent confounding factors that account for average SPLs that were not significantly different between both seasons. Additionally, far fewer days were spent using the DTH technique than the auger drilling method, yielding a smaller sample size for the former technique. Furthermore, it is possible that different substrates were encountered during the auger drilling method than DTH percussion as the latter technique was used over approximately a 37 m2 area compared to the former that was used over an area of about 1041 m2. The data presented herein can be used to improve information for and assist with the development of regulatory policies and techniques regarding sound level thresholds and mitigation monitoring; however, further studies are needed to determine if auger drilling for pier pilings produces significantly lower source SPLs than other more commonly used methods.
5. Acknowledgements
Special thanks to the National Park Service for their support during all phases of the project; Channel Islands Aviation and Island Packers for transportation to and from the island; Atkins Global, American Civil Constructors, and John S. Meek Company personnel for boating support and safe navigation around the construction site; and to B. Kot, R. Paulos, and C. Smith who assisted in the collection of acoustic data. K. Knight provided GIS and graphic support, while A. Richardson assisted with statistical analyses. J. See, J. Laliberte, A. Whitt provided helpful comments on early drafts of this manuscript. Thanks to T. Lunsman for management of the project for GeoMarine, Inc. Thanks also to all visual monitors for their assistance and support during the tenure of this project.
REFERENCES
- URS (URS Australia Pty Ltd.), “Ichthys Gas Field Development Project: Potential Effects of Underwater Blasting, Piledriving, and Dredging on Sensitive Marine Fauna in Darwin Harbour,” Report Prepared by URS Australia Pty Ltd., for INPEX Browse, Ltd., Perth, 2011.
- C. Perry, “A Review of the Impact of Anthropogenic Noise on Cetaceans,” Scientific Committee at the 50th Meeting of the International Whaling Commission, Oman, 27 April-9 May 1998, pp. 1-27.
- S. Polefka, “Anthropogenic Noise and the Channel Islands National Marine Sanctuary: How Noise Affects Sanctuary Resources, and What We Can Do about It,” Environmental Defense Center, Santa Barbara, 2004.
- G. Nehls, K. Betke, S. Eckelmann and M. Ros, “Assessment and Costs of Potential Engineering Solutions for the Mitigation of the Impacts of Underwater Noise Arising from the Construction of Offshore Windfarms,” Prepared for COWRIE (Collaborative Offshore Wind Research into the Environment) by BioConsult SH, Husum, 2007.
- D. P. Nowacek, L. H. Thorne, D. W. Johnston and P. L. Tyack, “Responses of Cetaceans to Anthropogenic Noise,” Mammal Review, Vol. 37, No. 3, 2007, pp. 81-115. doi:10.1111/j.1365-2907.2007.00104.x
- J. A. Reyff, “Underwater Sound Pressure Levels Associated with Marine Pile Driving. Assessment of Impacts and Evaluation of Control Measures,” Transportation Research Record: Journal of the Transportation Research Board, Vol. 11s, 2005, pp. 481-490.
- J. A. Hildebrand, “Anthropogenic and Natural Sources of Ambient Noise in the Ocean,” Marine Ecology Progress Series, Vol. 395, 2009, pp. 5-20. doi:10.3354/meps08353
- H. Bailey, B. Senior, D. Simmons, J. Rusin, G. Picken and P. M. Thompson, “Assessing Underwater Noise Levels during Pile-Driving at an Offshore Wind Farm and Its Potential Effects on Marine Mammals,” Marine Pollution Bulletin, Vol. 60, No. 6, 2010, pp. 888-897. doi:10.1016/j.marpolbul.2010.01.003
- NPS (National Park Service), “Rehabilitation or Replacement of Pier at Bechers Bay Santa Rosa Island Environmental Assessment,” Channel Islands National Park, Ventura, 2007.
- CCC (California Coastal Commission), “California Coastal Commission Executive Director Memo Regarding Negative Determination Nd-066-07 (Pier Replacement, Santa Rosa Island, Channel Islands National Park),” California Coastal Commission, San Francisco, 2008.
- GMI (Geo-Marine, Inc.), “Marine Mammal and Acoustic Monitoring during Pier Construction at Bechers Bay, Santa Rosa Island, Channel Islands National Park, California. Nps Contract No. Gs10f0207j,” Prepared for the Denver Service Center, Contracting Services Division, National Park Service, Denver, 2009.
- A. Benamar, “Dynamic Pile Response Using Two PileDriving Techniques,” Soil Dynamics and Earthquake Engineering, Vol. 20, No. 1, 2000, pp. 243-247. doi:10.1016/S0267-7261(00)00057-9
- C. Goodwin, “Personal Communication by Telephone,” John S. Meek Co Inc., 3 July 2012.
- C. S. Wardle, T. J. Carter, G. G. Urquhart, A. D. F. Johnstone, A. M. Ziolkowski, G. Hampson and D. Mackie, “Effects of Seismic Air Guns on Marine Fish,” Continental Shelf Research, Vol. 21, No. 8-10, 2001, pp. 1005-1027. doi:10.1016/S0278-4343(00)00122-9
NOTES
1In this article, peak pressure and RMS SPLs are expressed in dB, referenced to 1 μPa at 1 m. Peak SPLs refer to the magnitude of maximum pressure fluctuations.
2Sensor Technology Ltd, Serial # CR1-9041-15; Sensitivity –197.98 dB; Capacitance 9.8 nF; Dissipation 0.017%, or and Serial # CR1-9041-17; Sensitivity –197.69 dB; Capacitance 10.9 nF; Dissipation 0.016%.
3Pre-construction baseline locations were too shallow due to low tides and wave action.