Journal of Environmental Protection
Vol. 3 No. 9A (2012) , Article ID: 22946 , 15 pages DOI:10.4236/jep.2012.329129
Asthma Hospital Admissions and Ambient Air Pollutant Concentrations in New York City
![]()
1Robert F. Wagner Graduate School of Public Service, New York University, New York, USA; 2Leonard N. Stern School of Business, New York University, New York, USA; 3Nelson Institute of Environmental Medicine, New York University School of Medicine, Tuxedo, USA.
Email: cer202@nyu.edu
Received June 30th, 2012; revised July 27th, 2012; accepted August 23rd, 2012
Keywords: Asthma; Air pollution; Epidemiology; New York City; Nitrogen Dioxide; Sulfur Dioxide; Carbon Monoxide; Particulate Matter; Ozone
ABSTRACT
Air pollution is considered a risk factor for asthma. In this paper, we analyze the association between daily hospital admissions for asthma and ambient air pollution concentrations in four New York City counties. Negative binomial regression is used to model the association between daily asthma hospital admissions and ambient air pollution concentrations. Potential confounding factors such as heat index, day of week, holidays, yearly population changes, and seasonal and long-term trends are controlled for in the models. Nitrogen dioxide (NO2), sulfur dioxide (SO2) and carbon monoxide (CO) show the most consistent statistically significant associations with daily hospitalizations for asthma during the entire period (1996-2000). The associations are stronger for children (0 - 17 years) than for adults (18 - 64 years). Relative risks (RR) for the inter-quartile range (IQR) of same day 24-hour average pollutant concentration and asthma hospitalizations for children for the four county hospitalization totals were: NO2 (IQR = 0.011 ppm, RR = 1.017, 95% CI = 1.001, 1.034), SO2 (IQR = 0.008 ppm, RR = 1.023, 95% CI = 1.004, 1.042), CO (IQR = 0.232 ppm, RR = 1.014, 95% CI = 1.003, 1.025). In the case of ozone (O3) and particulate matter (PM2.5) statistically significant associations were found for daily one-hour maxima values and children’s asthma hospitalization in models that used lagged values for air pollution concentrations. Five-day weighted average lag models resulted in these estimates: O3 (one-hour maxima) (IQR = 0.025 ppm, RR = 1.049, 95% CI = 1.002, 1.098), PM2.5 (one-hour maxima) (IQR = 16.679 μg/m3, RR = 1.055, 95% CI = 1.008, 1.103). In addition, seasonal variations were also explored for PM2.5 and statistically significant associations with daily hospital admissions for asthma were found during the colder months (November-March) of the year. Important differences in pollution effects were found across pollutants, counties, and age groups. The results for PM2.5 suggest that the composition of PM is important to this health outcome, since the major sources of NYC PM differ between winter and summer months.
1. Introduction
Asthma is a chronic health condition characterized by wheezing, breathlessness, chest tightness, and coughing. According to the Centers for Disease Control and Prevention (CDC), some 16.4 million people in the US, and over 9% of children, have asthma. Asthma is also one of the costliest diseases. In 2003, asthma was responsible for 12.8 million lost school days among children aged 5 to 17 and 10.1 million lost work days for employed adults. In the same year 4055 people died of asthma [1]. Genetic predisposition and environmental factors have been identified in the development of asthma. Key environmental factors include allergen exposure, environmental tobacco smoke, nutrition, socioeconomic statuslow birth weight, history of infections, and air pollutants [2]. Poor people are considered to be more susceptible to environmental and socio-economic stressors, including air pollution [3,4]. In New York City the distribution of hospitalizations and emergency room visits for asthma indicates that the burden of this disease falls disproportionately on poor communities [5]. In studies that involve controlled laboratory exposures, asthmatics are more susceptible to a number of inhaled pollutants than nonasthmatics [6]. Traffic-related pollutants may also contribute to the onset of asthma [7-9].
In this paper, the associations between asthma hospital admissions and several criteria air pollutants are evaluated in four New York City counties: Bronx, Kings (Brooklyn), New York (Manhattan) and Queens. The air pollutants included in the analyses are sulfur dioxide (SO2), nitrogen dioxide (NO2), ozone (O3), carbon monoxide (CO) and fine particulate matter (PM2.5). Although several studies have examined the relationship between asthma hospitalizations and air pollution levels, the results differ from one location to another. This is not surprising, as asthma is a complex, multi-factorial disease, and its association with air pollution is also complex. Asthma rates have increased in the United States at a time when some indicators of air pollution have been improving [10]. However, overall improvements in ambient air quality may not convey important information about the composition and mix of pollutants such as PM and their implication for public health. Literature reviews of the association between criteria air pollutants and asthma support the idea that criteria pollutants exacerbate asthma [11-14]. Carbon monoxide (CO) has also been associated with asthma, but this may be due to the fact that CO may act as a proxy for traffic-related pollution or particulate matter [15]. A number of studies have an association between air pollution and asthma hospitalizations or emergency room visits in various locations such as Seattle [15], Toronto [16] and New York City [17].
Several studies have looked specifically at temporal variations in asthma hospitalizations in New York City using various methodologies. These studies show important peaks in asthma hospitalizations in early autumn [18, 19]. More recent studies have looked at the relationship between air pollution and asthma hospitalizations. Initial studies that looked at very short time periods did not find an association between asthma hospitalizations and air pollution [20-22]. Thurston et al. [23] looked at the association between air pollution concentrations (acidic aerosols (H+), sulfates ( ) and O3) and respiratory hospital admissions in New York City for the summers of 1988 and 1989. The reported relative risk estimates for New York City on maximum summertime pollution days relative to the mean case were 1.23 ± 0.10 for O3; 1.32 ± 0.11 for H+; and 1.19 ± 0.06 for
 . Jamason et al. [24] examined the association between weather and asthma hospitalizations in New York City for the period 1982-1992. The analysis used the Temporal Synoptic Index (TSI) to separately identify air masses for the different seasons. The results suggest that in New York City asthma hospitalizations, weather and air pollution have different relationships depending on the season. Pollution concentrations were found to have little influence on asthma hospitalizations in the fall and winter, but are more important in the spring and summer. Gwynn [25] examined the association between daily air pollution concentrations and asthma hospital admissions in New York City and found significant associations with NO2, O3 and SO2, while PM was not found to be significant. For children’s asthma hospital admissions, negative significant associations were found with coefficient of haze (CoH), PM10, H+, O3, and SO4=, while there was a positive significant association with SO2. For young adults, positive significant associations were found with CO, PM10, NO2, O3 and
 . Associations between hospitalizations for asthma in young adults and CoH, H+ and SO2 were not statistically significant. None of the Gwynn [25] pollution-asthma associations were statistically significant for older adults. Lall et al. [26] analyzed the association between source-specific daily PM2.5 mass and hospital admissions for various health end-points. Their time-series analyses included single-lag and distributedlag models and found a positive and significant association between asthma hospital admissions and PM2.5 from steel with reported relative risks in the range 1.0 - 1.2 for 2- and 3-day lags per 5th-95th percentile increment.
2. Data
2.1. Asthma Hospitalizations Data
The data on daily hospitalizations for asthma were obtained from the New York State Department of Health’s Statewide Planning and Research Cooperative System (SPARCS) database. The data refer to patients admitted to a hospital with asthma as a primary diagnosis (ICD-9 code 493). These patients may or may not have had other secondary diagnoses. The daily data correspond to the period January 1st, 1996 to December 31st, 2000. Figures 1 and 2 summarize the asthma hospitalization data for the combined four counties and for two age groups: children (0 - 17 years) and adults (18 - 64 years). The y-axis in the figures shows the daily number of asthma hospitalizations. The data for asthma hospital admissions for children and adults show very strong but different seasonal patterns. The data for elderly (>64 years) show much less variation since the numbers are much lower. For the five year period included in the data there were 44,200 hospitalizations for asthma as primary diagnosis in Bronx County; 50,997 in Kings County; 28,401 in New York County; and 26,850 in Queens County. Kings County has the largest population of these counties and the highest number of asthma hospitalizations. However, when population is factored in Bronx County has by far the highest asthma hospitalization rate per 10,000 people. The rates in the year 2000 were 63 hospitalizations per 10,000 people in Bronx County; 37.8 in Kings County; 34.8 in New York County; and 23.8 in Queens County.
2.2. Air Pollution Data
Hourly ambient pollutant concentrations were obtained from a network of monitoring stations maintained by the New York State Department of Environmental Conservation (NYSDEC). The data are summarized in Figure 3. The y-axis shows average daily concentrations of SO2, O3, NO2, CO and PM2.5. The units of air pollution concentrations used in the study were parts per million (ppm) for SO2, O3, NO2, CO and micrograms per cubic meter (μg/m3) for PM2.5. The x-axis in the plots shown in Figure 3 shows the number of days in the study period starting with January 1, 1996 (1 to 1827). The data for PM2.5 refer to the last two years in the study period (January 1, 1999-December 31, 2000) since data on the concentration of this pollutant was not systematically collected before then in New York City. As Figure 3 shows, some pollutants such as SO2 and O3 show strong seasonal variations while the others show weak or no seasonal patterns. The location and number of stations in a given year changed over the study period and not all stations collect information about all the pollutants under consideration. For example, during 2000 the one monitoring
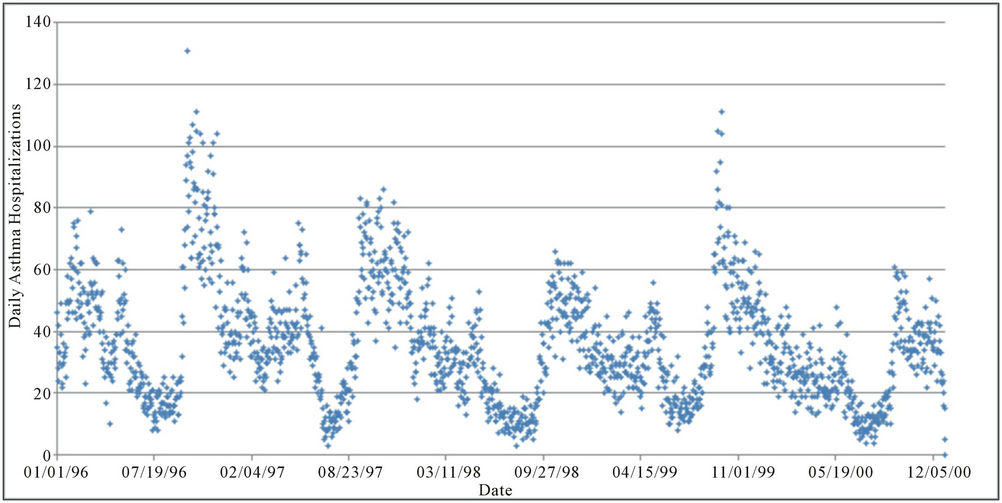
Figure 1. Daily asthma hospitalizations in four New York counties (children aged 0 - 17 years).
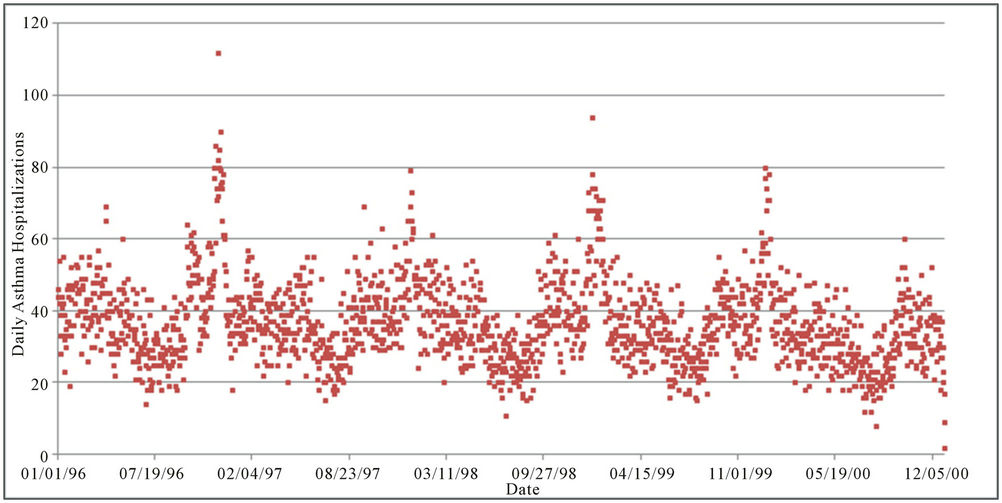
Figure 2. Daily asthma hospitalizations in four New York counties (adults aged 18 - 64 years).
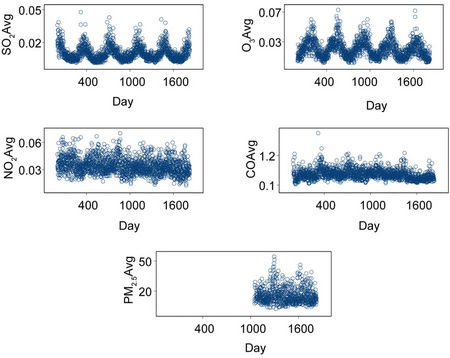
Figure 3. Daily average concentrations of the pollutants used in the analyses.
station located in Kings County only collected data for PM2.5. The air pollution data used in this study suggest that the air pollution data from the monitoring stations in the four counties analyzed are highly correlated spatially. The correlations for the daily average concentrations across the four counties have the following ranges: CO (0.42 - 0.60), NO2 (0.76 - 0.89), SO2 (0.80 - 0.90), O3 (0.78 - 0.93) and PM2.5 (0.96 - 0.97).
2.3. Weather Data
The weather data used in the analyses comes from three National Oceanic and Atmospheric Administration (NOAA) weather stations [27]. One is located in Central Park (CP), New York County, another is located at John F. Kennedy Airport (JFK), Queens County, and the third one is located in LaGuardia Airport (LG), Queens County. These data include daily average temperature and relative humidity. The temperature and relative humidity data were used to compute the heat index (also known as apparent temperature), which is calculated from a formula that takes into account relative humidity when the temperature is greater than 80˚ F [28].
2.4. Gaps in the Air Pollution and Weather Data
A summary of the gaps in the data including the percentage of daily data that are available for each air pollutant and weather variable during the period considered in the study is included in Table 1. Bronx and New York Counties have the most complete data sets. Kings and Queens have very significant gaps for some variables. In Kings County, the biggest deficiencies are for O3 and NO2, which have data for fewer than 10% of the days considered in the study. Queens County has data for fewer than half of the period of analysis for NO2 and CO. The weather and heat index data do not show important gaps, with over 99% of the days in the period of analysis covered.
3. Methods
The dependent variables in the analyses are daily asthma hospital admissions. Three sets of models were constructed according to age group: children (0 - 17 years), adults (18 - 64 years) and total (all ages). The base models use the four county total hospital admissions. In addition, sensitivity analyses were conducted that used data for asthma hospital admissions from each individual county. Negative Binomial and quasi-likelihood (based on assuming that the variance of the response is a constant times the mean) regression estimation were used in the study. These models are considered appropriate when the response variable is a count and they both address overdispersion, relative to a Poisson model [29,30]. All the regression results presented in the paper refer to regressions using S-Plus version 6.1 [31].
The independent variables used in the models include: daily pollutant concentration, time index, population, heat index, day of week and holiday. The daily pollutant concentration variables considered were the following: 24-hour average SO2, 24-hour average NO2, 1-hour daily maximum and 24-hour average CO, 1-hour daily maximum and 24-hour average O3, and 1-hour daily maximum and 24-hour average PM2.5. Given the gaps in the data (discussed in the previous section), and the geography of the area, the ambient pollutant values used in all the models refer to daily average values or average one-hour maxima values of each pollutant calculated using data from all the available monitoring stations in the four counties on a given day.
Five models were examined for each pollutant. The “same day” models include the pollution concentration and heat index values for the same day as the hospitalization day. The “1-day lag” models include pollution concentration and heat index data of the day prior to the hospitalization day. The “3-day average” models include pollution and heat index variables that are three-day averages, including the same day as the hospitalization day and the two previous days. The “5-day and 7-day weighted average” models include pollution and heat index data that are five and seven day weighted moving averages. These averages include the same day as the hospitalization and the four and six previous days respectively. For the comparisons the value of the inter-quartile range of the same day pollutant averages were used for all the lagged and averaged values of the pollutants. The IQR values used were: SO2 (0.008 ppm), NO2 (0.011 ppm), CO (0.232 ppm), CO 1-hr max (0.320 ppm), O3 (0.015 ppm), O3 1-hr max (0.025 ppm), PM2.5 (9.541 μg/m3) and PM2.5 1-hr max (16.679 μg/m3).
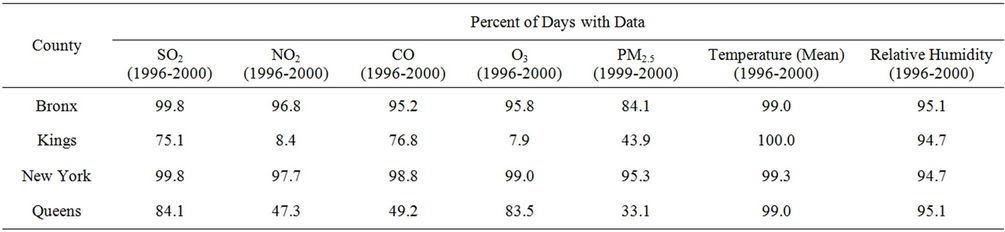
Table 1. Air pollution and weather data gaps in four New York City counties.
The time index is a daily counter to address autocorrelation. Natural splines based on time with 60 degrees of freedom, which is equivalent to the number of months in the period of analysis, were used to fit a smooth seasonal pattern. The logarithm of yearly values of population was introduced as an offset so that asthma hospitalization rates were modeled, rather than counts. The heat index is a measure that incorporates temperature and relative humidity. The heat index was modeled using natural splines with three degrees of freedom. The data indicate that there is a smooth nonlinear relationship between asthma hospitalizations and heat index and that low values and high values of the heat index have a similar functional effect on asthma hospitalizations.
The day of the week was introduced in the model because according to the literature people’s propensity to go to the hospital varies depending on the day of the week, with greater hospital admissions generally observed for the first few days of the week [18]. Day of the week was introduced as six indicator variables (with values of 0 or 1) for Monday through Saturday. Holidays are also introduced in the models because people seem to be less likely to go to the hospital during holidays [32]. A holiday is introduced in the model as an indicator variable. The holidays included were federal holidays and days immediately preceding and following these holidays.
Relative risks were computed using the formula RR = exp[β × (V(1) – V(0))], where β is the pollutant coefficient and (V(1) – V(0)) is the inter-quartile range of the pollutant concentration level [33,34].
4. Results
This section of the paper presents estimates for the relative risks of hospitalizations for asthma as primary diagnosis associated with a change in the inter-quartile range of each pollutant concentration. The results of the negative binomial and quasi-likelihood regression models were very similar and only the results of the negative binomial regression models are included.
In general, the models suggest that statistically significant associations are common for asthma hospitalizations with SO2, NO2, CO, and to a lesser extent O3 and PM2.5. The models for asthma hospitalizations for the four county hospitalization totals show that statistically significant associations between the pollutants and asthma hospitalizations are more common for children than for adults but when all age groups are combined for the asthma hospitalization data there are statistically significant associations for all the pollutants considered. Relative risks (RR) for the inter-quartile range (IQR) of same day 24-hour average pollutant concentration and asthma hospitalizations for children for the four county totals were: NO2 (IQR = 0.011 ppm, RR=1.017, 95% CI = 1.001,1.034), SO2 (IQR = 0.008 ppm, RR=1.023, 95% CI=1.004, 1.042), CO (IQR = 0.232 ppm, RR=1.014, 95% CI = 1.003, 1.025), CO (1-hour maxima) (IQR = 0.320 ppm, RR=1.006, 95% CI = 1.000, 1.012), O3 (IQR = 0.015 ppm, RR=1.005, 95% CI = 0.978, 1.034), PM2.5 (IQR = 9.481 µg/m3, RR = 0.993, 95% CI = 0.968, 1.024).
Relative risks (RR) for the inter-quartile range (IQR) of 24-hour average pollutant concentration (3-day averages) and asthma hospitalizations for adults (18 - 64 years) for the four county totals were: NO2 (IQR = 0.011 ppm, RR = 1.006, 95% CI = 0.986,1.026), SO2 (IQR = 0.008 ppm, RR = 1.010, 95% CI = 0.987, 1.034), CO (IQR = 0.232 ppm, RR = 1.013, 95% CI = 0.994, 1.032), CO (1-hour maxima) (IQR = 0.320 ppm, RR = 1.006. 95% CI = 0.988,1.024), O3 (IQR = 0.015 ppm, RR=1.039, 95% CI = 1.006, 1.072), PM2.5 (IQR = 9.481 µg/m3, RR = 1.005, 95% CI = 0.973, 1.038). Finally, relative risks (RR) for the inter-quartile range (IQR) of same day 24-hour average pollutant concentration and asthma hospitalizations for all age groups and for the four county totals were: NO2 (IQR = 0.011 ppm, RR = 1.011, 95% CI = 1.000, 1.022), SO2 (IQR = 0.008 ppm, RR=1.015, 95% CI = 1.002, 1.028), CO (IQR = 0.232 ppm, RR=1.010, 95% CI = 1.003, 1.017), ), CO (1-hour maxima) (IQR = 0.320 ppm, RR = 1.005. 95% CI = 1.001, 1.009), O3 (IQR = 0.015 ppm, RR = 1.006, 95% CI = 0.988, 1.024), PM2.5 (IQR = 9.481 µg/m3, RR = 0.998, 95% CI = 0.981, 1.016).
The relative risk estimates for Children are summarized in Figure 4 and the relative risk estimates for all age groups combined are shown in Figure 5. In general, the relative risk estimates are higher for the models that use children’s asthma hospitalizations than for the models that use asthma hospitalizations for all age groups combined. In addition, using the one-hour maximum values for O3 and PM2.5 as the air pollution concentration predictor variables results in more statistically significant models than using 24-hour average values for these pollutants. Figures 6-13 summarize the relative risk estimates per IQR change in daily air pollutant concentrations for asthma hospitalizations in four New York counties for all age groups combined. These figures summarize the sensitivity analyses conducted to examine countylevel variations and they show significant differences among the counties.
It is also important to compare the results for children and adults. Table 2 presents this information in a different way. It shows that the number of models with a statistically significant pollutant coefficient (with a Wald statistic of 2.0 or higher) is much higher for children hospitalizations than for adult hospitalizations. However, as the sensitivity analyses that use hospitalization data for each county summarized in figures 6-13 show, there are also important differences between counties. The models for adult hospitalizations show similar county
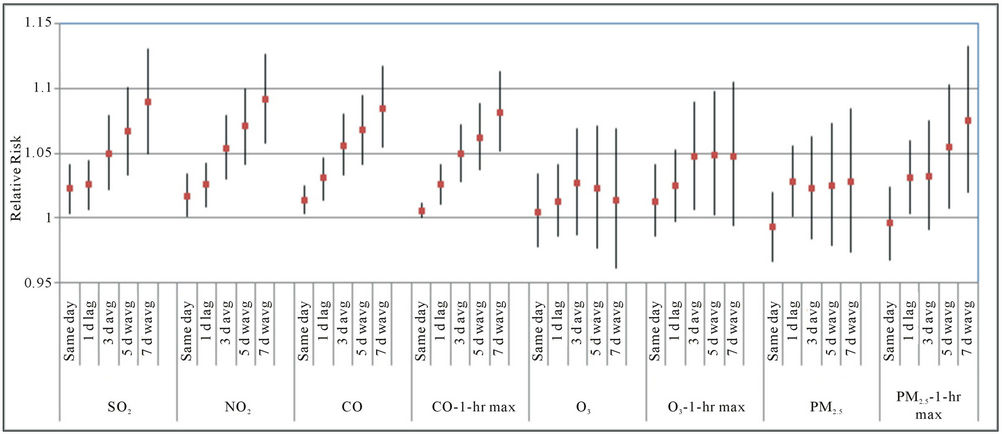
Figure 4. Relative risk estimates for asthma hospitalizations for children (4-county totals; the bands with every RR estimate are 95% confidence bands; d refers to day, avg refers to average, wavg refers to models that use 5-day and 7-day weighted averages for the air pollutant).
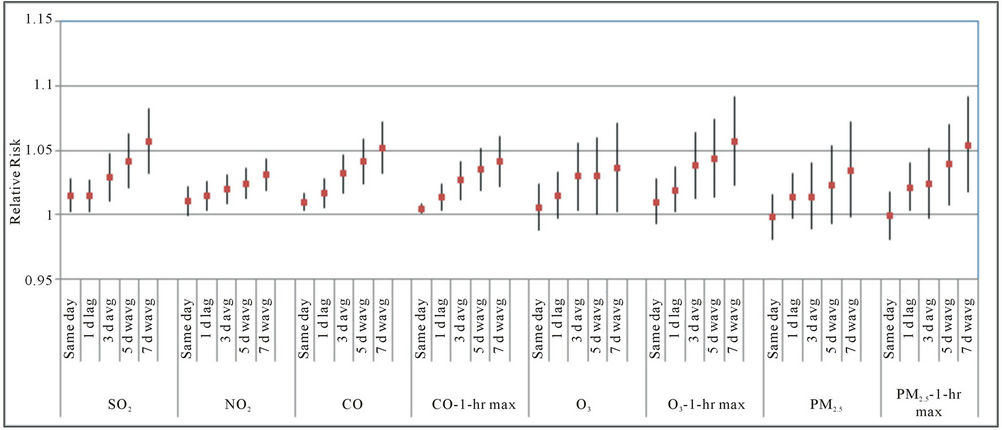
Figure 5. Relative risk estimates for asthma hospitalizations for all age groups (4-county totals).
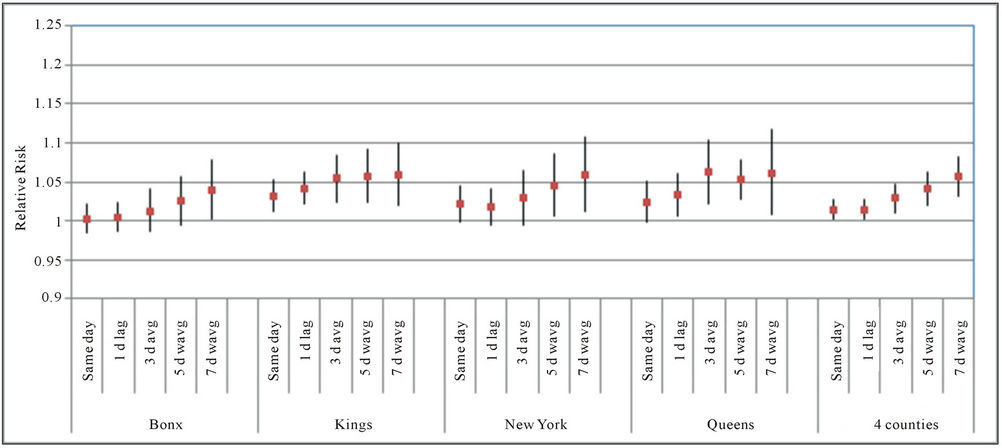
Figure 6. Relative risks per IQR change in daily SO2 concentrations for asthma hospitalizations in four New York counties.
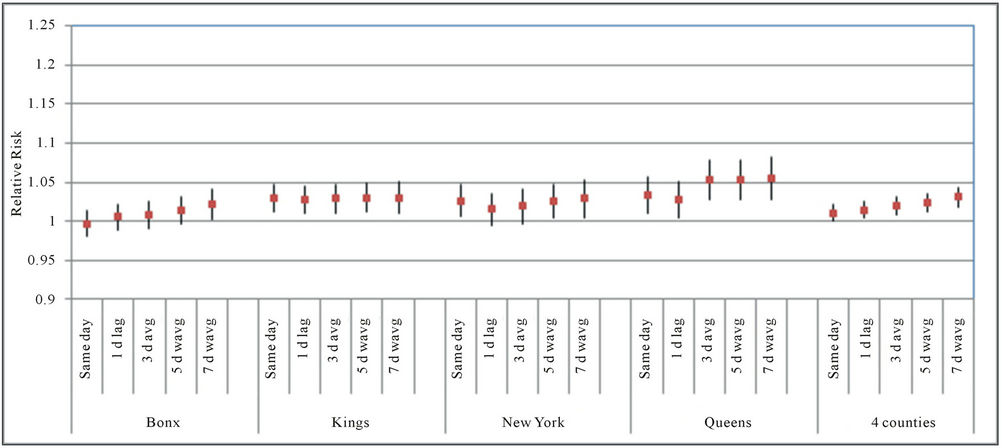
Figure 7. Relative risks per IQR change in daily NO2 concentrations for asthma hospitalizations in four New York counties.
variations.
Particulate Matter Models Revisited by Season
As discussed in the previous section, the particulate matter models show fewer statistically significant associations with asthma hospitalizations than the other pollutants. Gwynn did not find statistically significant associations between asthma hospitalizations and PM2.5 [25]. One possible reason for this disparity is that the effect of PM2.5 differs by season. PM2.5 consists of any liquid or solid particles with a diameter of 2.5 µm or less, and different components of PM like nitrates and sulfides may be relatively more important depending on the season. A recent study that characterized particulate matter in New York State indicates that although overall concentrations of PM do not vary much from one season to another its composition does change significantly when comparing cold and warm seasons, with sulfides being relatively more important in the warm months and nitrates relatively more important in the winter months [35]. In addition, concentrations of PM2.5 may be influenced by regional sources, especially in summer [36], which suggests that the composition of PM2.5 could also vary seasonally in a significant way. Lall et al. [26] found significant associations between asthma hospitalization and PM from steel, which is associated with construction
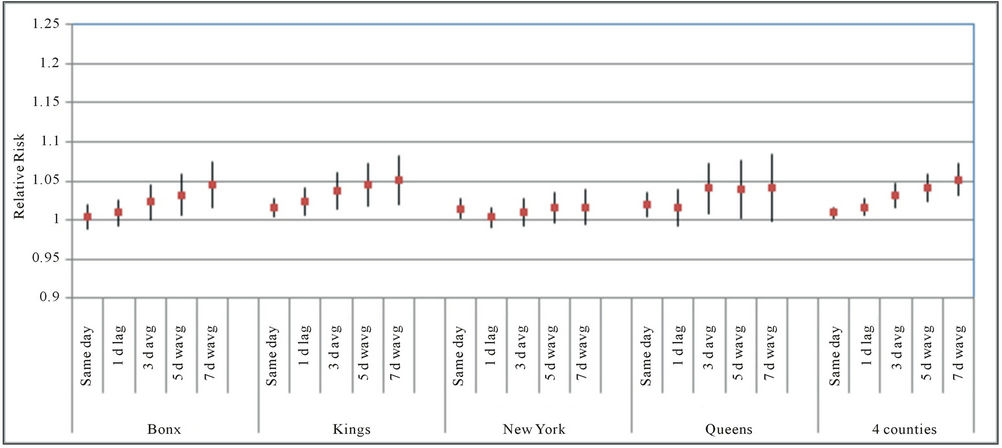
Figure 8. Relative risks per IQR change in daily CO concentrations for asthma hospitalizations in four New York counties.
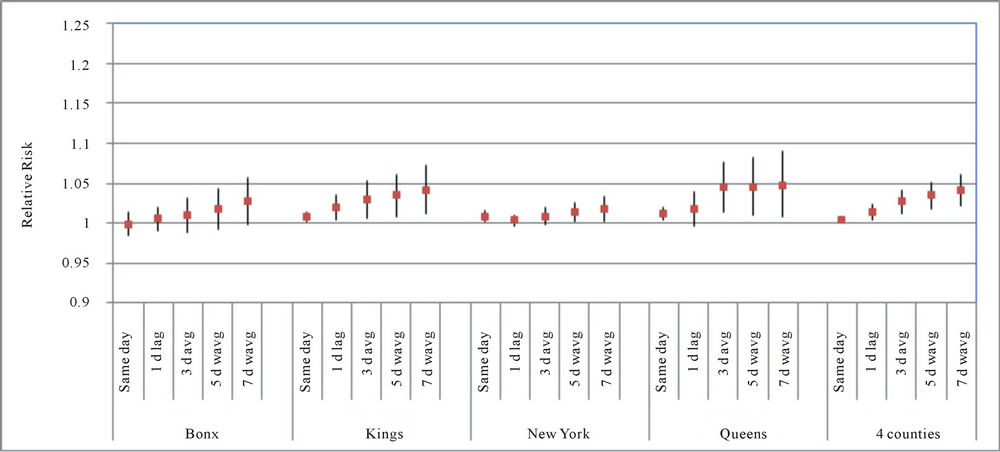
Figure 9. Relative risks per IQR change in daily CO concentrations (1-hour maximum values) for asthma hospitalizations in four New York counties.
activities, but not with other sources of PM. In order to examine whether there are significant variations in the results by season the PM2.5 data for the period 1999-2000 were reduced to include data from November 1 to March 31 for the colder-months data set and for May 1 to September 30 for the warmer-months data set. The data refer to hospitalizations for asthma as primary diagnosis for all age groups and are combined for the four counties.
For 24-hour average concentrations of PM2.5 in the colder months the results for the four county hospitalization totals and for all age groups combined were: IQR = 11.8 μg/m3, RR = 1.034, 95% CI = 1.008, 1.060). Table 3 summarizes the relative risk estimates for a change in the inter-quartile range of PM2.5 concentrations. The value of IQR used for all the models is that of the sameday PM2.5 values. The results of the models suggest that there are statistically significant associations between asthma hospitalizations and PM2.5 in the colder months, but not in the warmer months of the year.
5. Discussion
The strengths and weaknesses of epidemiological timeseries studies have been widely discussed in the literature. The main strength of this type of study is statistical

Figure 10. Relative risks per IQR change in daily O3 concentrations for asthma hospitalizations in four New York counties.
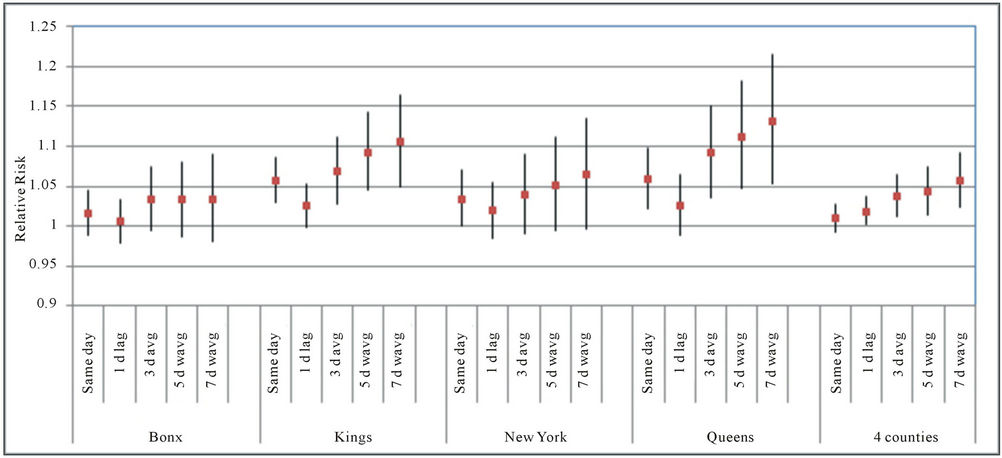
Figure 11. Relative risks per IQR change in daily O3 concentrations (1-hour maximum values) for asthma hospitalizations in four New York counties.
power. In this particular study, the analyses are done for four county totals and additionally for each county. Each of these New York City counties has a population comparable to a typical large city in the United States. Weaknesses of this type of study include possible misclassification of pollution exposures resulting from the use of central monitoring stations associated with this type of study [6,37,38]. Despite this potential weakness, some authors have argued that central monitoring site data are highly correlated with the average of individual exposures in a population and that is what is most appropriate for a time-series study [39]. As described in a previous section the air pollution data obtained for this study from the available monitoring stations are highly correlated across the four counties.
The results of the models presented in this paper suggest there are many statistically significant associations between daily hospitalizations for asthma and daily concentrations for various pollutants. However, the results indicate that there may be important differences among the counties studied. In general, Bronx County had less statistically significant associations than the other counties. This is a surprising result given the high rates of asthma hospitalizations in that county and suggests there
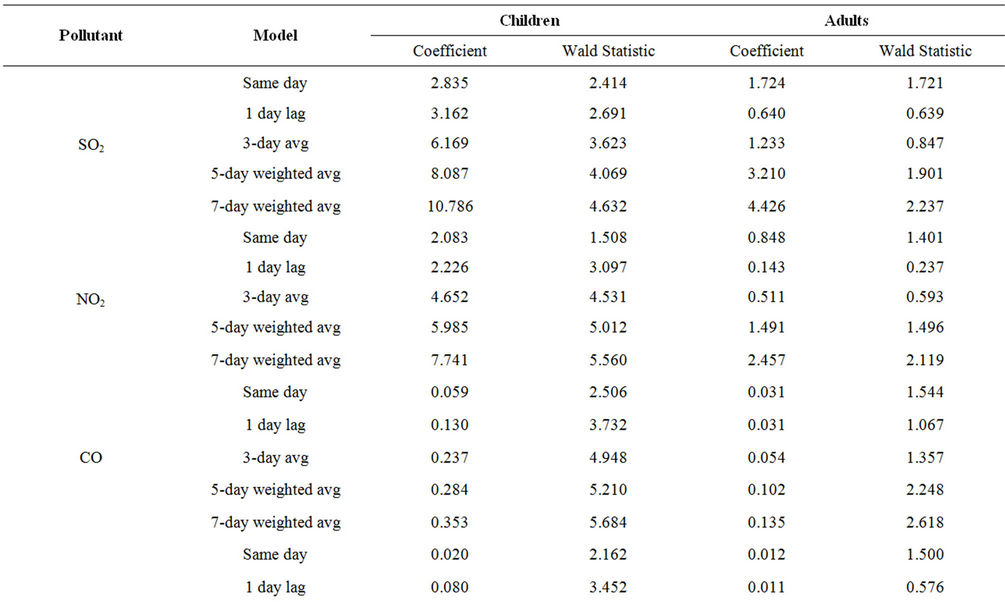
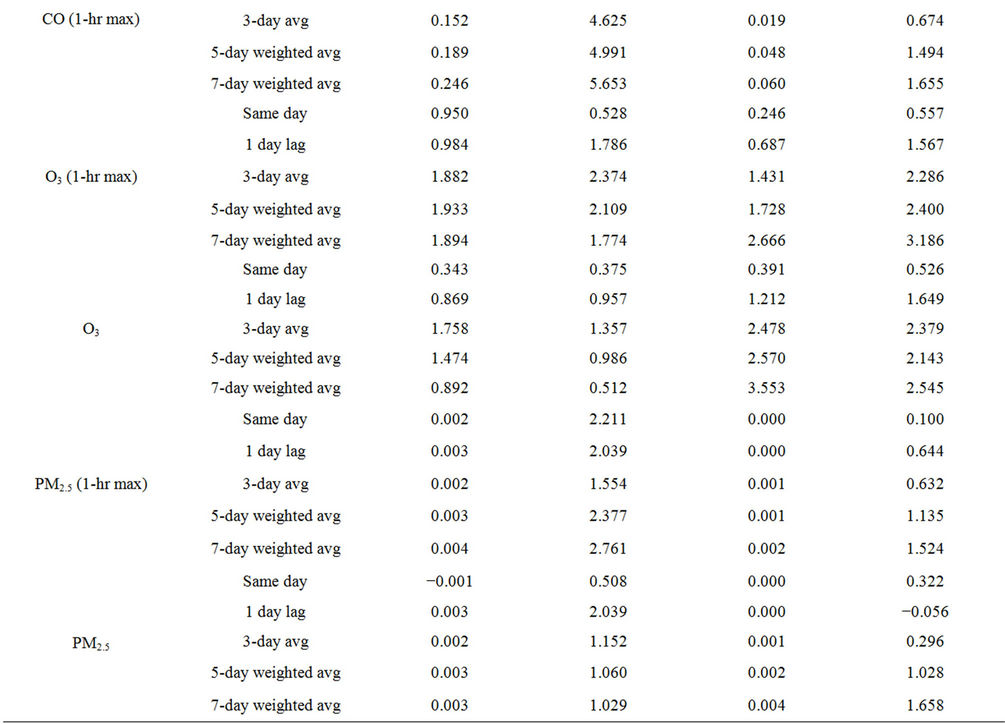
Table 2. Comparison between children (0 - 17 years) and adult (18 - 64 years) asthma hospitalization models (4-county totals).
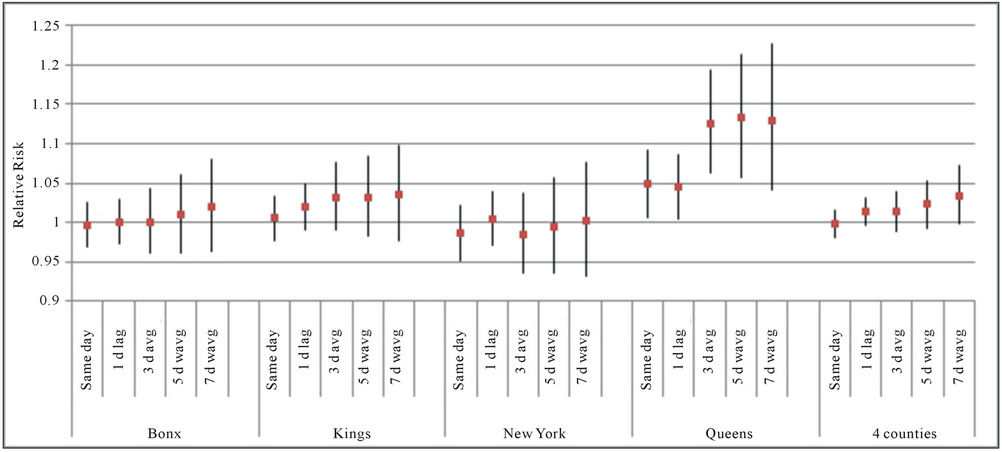
Figure 12. Relative risks per IQR change in daily PM2.5 concentrations for asthma hospitalizations in four New York counties.
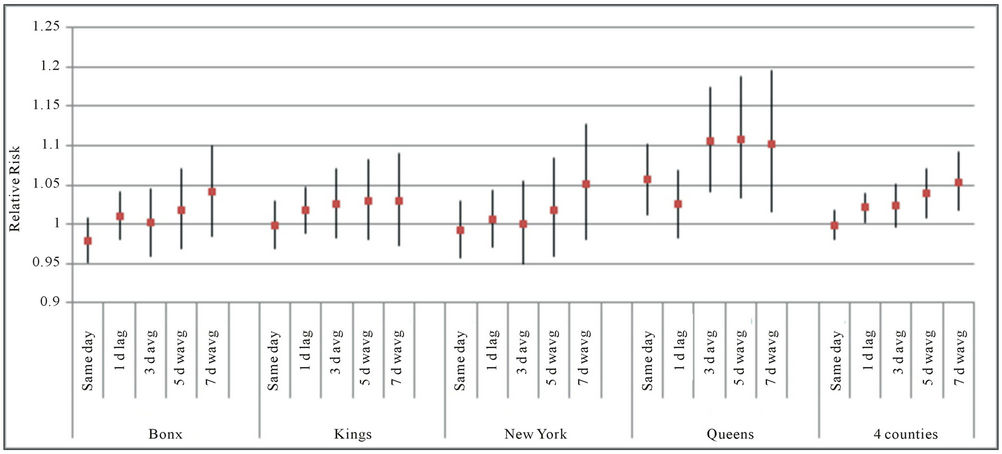
Figure 13. Relative risks per IQR change in daily PM2.5 concentrations (1-hour maximum values) for asthma hospitalizations in four New York counties.
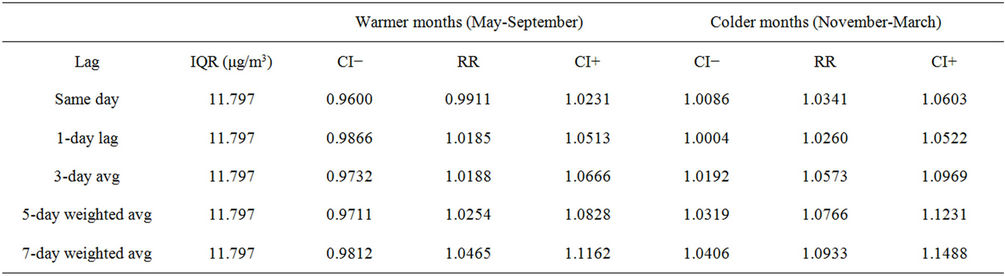
Table 3. Relative risk estimates for PM2.5 by season, all age groups combined.
may be other factors besides pollution driving day-to-day variations in asthma hospitalizations there. These results may also suggest that the network of central monitoring stations available for the time period of this study may not have adequately captured personal exposures across the whole study area. Factors such as the location of the monitoring stations and their height above ground may be relevant. For example, a study that compared ambient concentrations at 4 meters and 15 meters above ground in Bronx County found significant differences for concentrations of NO2, SO2 and CO [40]. However, concentrations of O3 and PM2.5 seem to be similar regardless of height above ground [40,41].
An additional limitation of epidemiologic studies is the difficulty of disentangling independent effects and/or potential interactions between highly correlated risk factors [6,37]. However, time-series designs may not need to control for individual-level confounding factors such as education, income, race, percentage of smokers and others, because these characteristics of the population do not change much on a daily basis [39].
This study provides additional evidence for a positive and statistically significant association between asthma hospitalizations and air pollution concentrations. The results show the strongest associations for CO, NO2, and SO2. This is consistent with the findings of other studies that suggest air pollution is linked to asthma [42-44] and in particular to asthma hospitalizations [15-17]. However, there are some important differences between the results of this study and other studies such as Gwynn’s analyses for New York City [25]. Whereas the latter did not find statistically significant associations between asthma hospitalizations for children (defined as children aged 0 - 15 years) and NO2 and CO the models included in this study did find strong associations between asthma hospitalizations for children (defined as those aged 0 - 17 years) and these pollutants in the counties examined. Gwynn reported statistically significant associations between asthma hospitalizations and CO, PM10, NO2, O3 and  for young adults (defined as people aged 15 - 60) [25]. However, unlike Gwynn’s study, the results of the models included in this study found fewer statistically significant associations for adults (defined as people aged 18 - 64 years) than for children.
As other time-series studies of this kind have shown, the time lag used was important with most pollutants showing statistically significant associations for the longer time lags of 3-day averages or 5- and 7-day weighted averages. Age is also important in considering the association between asthma hospitalizations and ambient air pollution. Statistically significant associations between pollutants and asthma hospitalizations were much more common for children than for adults in this study for the case of SO2, NO2 and CO but the opposite is true for O3.
The seasonal analysis of asthma hospitalizations and PM2.5 suggested that concentrations of this broad class of pollutants could be more important for asthma hospitalizations in the colder months of the year (NovemberMarch) than in the warmer months of the year (MaySeptember). A previous study suggests that local sources of PM including traffic and residual oil are relatively more important in the winter [36]. However, it is interesting to note that Lall et al. [26] found an association between asthma hospitalizations and PM from steel associated with construction activities that was driven by this source of PM in the months of May and September. These months are at the boundary of the category of “warmer” months in this and other studies. In addition, Ito, Thurston and Silverman conducted a time-series study to examine the association between PM2.5 concentrations and emergency room visits for asthma and found a stronger association in the warmer months than in the colder months, estimating a relative risk of 1.32 (95% CI: 1.23, 1.42) per 25 p.p.b. increase in PM2.5 [17]. Hence, further research should be conducted in this area to shed some light on what months of the year may be most relevant to the association between PM and asthma hospitalizations and how specific activities such as construction which could vary depending on year analyzed could affect this relationship. The statistically significant association found between SO2, NO2 and CO, as well as PM2.5 in the colder months, may suggest that local sources of PM could have the greatest impact on asthma hospitalizations.
NO2 is one of the pollutants with the most common associations with asthma hospitalizations in this study, with statistically significant associations in all four counties as well as for the models that combine the asthma hospitalizations data for the four counties. This finding supports the findings of other studies that have found a short-term health effect associated with this pollutant and supports EPA’s recent decision to add a 24-hour standard for this pollutant designed to protect individuals against short-term health effects [45].
Another issue mentioned in the literature on this subject is ranking the relevance of pollutants to asthma from strongest to weakest. Leikauf et al. rank them as follows based on the literature: fine particulate matter (PM2.5) ≥ particulate matter (PM10) ≥ sulfur oxides (SOx) ≥ ozone (O3) ≥ nitrogen oxides (NOx) [46]. This ranking is for asthma exacerbations as a whole, not just for asthma hospitalizations. How do the pollutants rank in terms of their effect on asthma hospitalizations according to the results presented in this study? This question is difficult to address given that the rankings change depending on the models used. If, for example, we consider the results of the models that examined the association between asthma hospitalizations for children for the four county totals and for a 3-day average value of the pollutants then according to the relative risk values associated with a change in the inter-quartile range of each pollutant the strongest impacts are observed for CO (24-hr avg), NO2 (24-hr avg) and SO2 (24-hr avg) in that order. This again suggests that traffic-related air pollution could be an important contributor to asthma hospitalizations.
6. Conclusion
In this study the association between daily asthma hospitalizations and ambient concentrations of five air pollutants was examined for the period 1996-2000 in four New York counties: Bronx, Kings, New York and Queens. The results of the models suggest that there is a positive and statistically significant association between all the pollutants considered and asthma hospitalizations, with the strongest associations obtained for children (0 - 17 years). Of the pollutants considered, NO2, SO2 and CO showed the most consistent associations with daily hospitalizations for asthma which suggests that traffic-related air pollution may be particularly relevant to asthma hospitalizations. In general, models that included 3-day or longer average values for pollution concentrations showed the strongest associations. The models for O3 and PM2.5 suggest that daily one-hour maximum values for these pollutants may be more relevant for this kind of analysis than daily averages. These results would suggest that air pollution standards designed to protect the public from short-term effects of these pollutants with one-hour averaging times are important for this health issue. In addition, the seasonal analyses conducted for PM2.5 provides additional evidence that the association between asthma hospitalizations and this pollutant is complex and may depend on the composition of PM, the relative importance of regional and local sources of PM and season.
7. Acknowledgements
Part of this work was supported by the South Bronx Environmental Health and Policy Study and funded under US EPA Agreement X-982152-01. The views expressed in this report are those of the authors and do not necessarily reflect the views of the US EPA. Dr. Thurston was also supported in part by the NYU-NIEHS Center of Excellence Grant ES00260.
REFERENCES
- Centers for Disease Control (CDC), “Asthma,” 2010. http://www.cdc.gov/nchs/fastats/asthma.htm
- R. J. Pandya, G. Solomon, A. Kinner and J. R. Balmes, “Diesel Exhaust and Asthma: Hypotheses and Molecular Mechanisms of Action,” Environmental Health Perspectives, Vol. 110, No. 1, 2002, pp. 103-112. doi:10.1289/ehp.02110s1103
- R. C. Gwynn and G. D. Thurston, “The Burden of Air Pollution: Impacts in Racial Minorities,” Environmental Health Perspectives, Vol. 109, No. 4, 2001, pp. 501-506. doi:10.1289/ehp.01109s4501
- D. E. McLean, S. Bowen, K. Drezner, A. Rowe, P. Sherman, S. Schroeder, K. Redlener and I. Redlener, “Asthma among Homeless Children,” Archives of Pediatrics and Adolescent Medicine, Vol. 158, 2004, pp. 244- 249. doi:10.1001/archpedi.158.3.244
- New York City Department of Health and Mental Hygiene, “Air Pollution and the Health of New Yorkers: The Impact of Fine Particles and Ozone,” 2011. http://www.nyc.gov/html/doh/downloads/pdf/eode/eode-air-quality-impact.pdf
- J. M. Samet and J. J. K. Jaakkola, “The Epidemiologic Approach to Investigating Outdoor Air Pollution,” In: S. T. Holgate, J. M. Samet, H. S. Koren and R. L. Maynard, Eds., Air Pollution and Health, Academic Press, New York, 1999, pp. 431-459. doi:10.1016/B978-012352335-8/50095-8
- M. Jerrett, K. Shankardass, K. Berhane, W. J. Gauderman, N. Künzli, E. Avol, F. Gilliland, F. Lurmann, J. N. Molitor, J. T. Molitor, D. C. Thomas, J. Peters and R. McConnell, “Traffic-Related Air Pollution and Asthma Onset in Children: A Prospective Cohort Study with Individual Exposure Measurement,” Environmental Health Perspectives, Vol. 116, No. 10, 2008, pp. 1433-1438. doi:10.1289/ehp.10968
- F. Castro-Giner, N. Künzli, B. Jacquemin, B. Forsberg, R. de Cid, J. Sunyer, D. Jarvis, D. Briggs, D. Vienneau, D. Norback, J. R. González, S. Guerra, C. Janson, J. M. Antó, M. Wjst, J. Heinrich, X, Estivill and M. Kogevinas, “Traffic-Related Air Pollution, Oxidative Stress Genes, and Asthma (ECHRS),” Environmental Health Perspectives, Vol. 117, No. 12, 2009, pp. 1919-1924. doi:10.1289/ehp.0900589
- N. A. Clark, P. A. Demers, C. J. Karr, M. Koehoorn, C. Lencar, L. Tamburic and M. Brauer, “Effect of Early Life Exposure to Air Pollution on Development of Childhood Asthma,” Environmental Health Perspectives, Vol. 118, No. 2, 2010, pp. 284-290. doi:10.1289/ehp.0900916
- S. Redd, “Asthma in the United States: Burden and Current Theories,” Environmental Health Perspectives, Vol. 110, No. 4, 2002, pp. 557-560. doi:10.1289/ehp.02110s4557
- H. S. Koren, “Associations between Criteria Air Pollutants and Asthma,” Environmental Health Perspectives, Vol. 103, No. 6, 1995, pp. 235-242. doi:10.1289/ehp.95103s6235
- D. V. Bates, “Observations on Asthma,” Environmental Health Perspectives, Vol. 103, No. 6, 1995, pp. 243-247. doi:10.1289/ehp.95103s6243
- G. W. K. Wong, T. F. Leung and T. F. Fok, “Outdoor Air Pollution and Asthma,” Pediatric Pulmonology, No. 26, 2004, pp. 220-222. doi:10.1002/ppul.70111
- L. Tzivian, “Outdoor Air Pollution and Asthma in Children,” Journal of Asthma, Vol. 48, No. 5, 2011, pp. 470-481. doi:10.3109/02770903.2011.570407
- G. Norris, S. N. YoungPong, J. Q. Koenig, T. V. Larson, L. Sheppard and J. W. Stout, “An Association between Fine Particles and Asthma Emergency Department Visits for Children in Seattle,” Environmental Health Perspectives, Vol. 107, No. 6, 1999, pp. 489-493. doi:10.1289/ehp.99107489
- M. Lin, Y. Chen, R. T. Burnett, P. J. Villeneuve and D. Krewski, “Effect of Short-Term Exposure to Gaseous Pollution on Asthma Hospitalisation in Children: A BiDirectional Case-Crossover Analysis,” Journal of Epidemiology and Community Health, Vol. 57, 2003, pp. 50-55. doi:10.1136/jech.57.1.50
- K. Ito, G. D. Thurston and R. A. Silverman, “Characterization of PM2.5, Gaseous Pollutants, and Meteorological Interactions in the Context of Time-Series Health Effects Models,” Journal of Exposure Science and Environmental Epidemiology, Vol. 17, 2007, pp. S45-S60.
- I. F. Goldstein and J. Cuzick, “Daily Patterns of Asthma in New York City and New Orleans: An Epidemiologic Investigation,” Environmental Research, Vol. 30, 1983, pp. 211-223. doi:10.1016/0013-9351(83)90181-0
- I. F. Goldstein and B. Currie, “Seasonal Patterns of Asthma: A Clue to Etiology,” Environmental Research, Vol. 33, 1984, pp. 201-215. doi:10.1016/0013-9351(84)90017-3
- L. Greenburg, F. Field, J. I. Reed and C. L. Erhardt, “Asthma and Temperature Change,” Archives of Environmental Health, Vol. 8, 1964, pp. 642-647.
- L. Greenburg, F. Field, J. I. Reed and C. L. Erhardt, “Asthma and Temperature Change,” Archives of Environmental Health, Vol. 12, 1966, pp. 561-563.
- I. F. Goldstein and E. Dulberg, “Air Pollution and Asthma: Search for a Relationship,” Journal of Air Pollution Control Association, Vol. 31, 1981, p. 370. doi:10.1080/00022470.1981.10465231
- G. D. Thurston, K. Ito, P. L. Kinney and M. Lippmann, “A Multi-Year Study of Air Pollution and Respiratory Hospital Admissions in Three New York State Metropolitan Areas: Results for 1988 and 1989 Summers,” Journal of Exposure Analysis and Environmental Epidemiology, Vol. 2, No. 4, 1992, pp. 429-450.
- P. F. Jameson, L. S. Kalkstein and P. J. Gergen, “A Synoptic Evaluation of Asthma Hospital Admissions in New York City,” American Journal of Respiratory and Critical Care Medicine, Vol. 156, 1997, pp. 1781-1788.
- R. C. Gwynn, “A Time-Series Analysis of Mortality and Hospital Admissions Associations with Particulate Matter Air Pollution Components in Two New York Metropolitan Areas,” Ph.D. Thesis, New York University, New York, 1999.
- R. Lall, K. Ito and G. D. Thurston, “Distributed Lag Analyses of Daily Hospital Admissions and Source— Apportioned Fine Particle Air Pollution,” Environmental Health Perspectives, Vol. 119, No. 4, 2011, pp. 455-460.
- National Oceanic and Atmospheric Administration (NOAA), “Climate-Radar Data Inventories,” 2012. http://lwf.ncdc.noaa.gov/oa/climate/stationlocator.html
- S. R. Schmitt, “Heat Index Calculator,” 2004. http://convertalot.com/heat_index_calculator.html
- J. S. Simonoff, “Analyzing Categorical Data,” Springer Texts in Statistics, Springer-Verlag, New York, 2003.
- W. N. Venables and B. D. Ripley, “Modern Applied Statistics with S,” Springer-Verlag, New York, 2002.
- Insightful Corporation. “S-Plus Version 6.1,” 2001.
- J. M. Samet, S. L. Zeger, F. Dominici, F. Curriero, I. Coursac, D. W. Dockery, J. Schwartz and A. Zanabetti, “The National Morbidity, Mortality, and Air Pollution Study Part I: Methods and Methodologic Issues,” Health Effects Institute (HEI), 2000.
- J. S. Hwang, T. H. Hu and C. C. Chan, “Air Pollution Mix and Emergency Room Visits for Respiratory and Cardiac Diseases in Taipei,” Journal of Data Science, Vol. 2, 2004, pp. 311-327.
- M. Lin, Y. Chen, P. J. Villeneuve, R. T. Burnett, L. Lemyre, C. Hertzman, K. M. McGrail and D. Krewski, “Gaseous Air Pollutants and Asthma Hospitalization of Children with Low Household Income in Vancouver, British Columbia, Canada,” American Journal of Epidemiology, Vol. 159, 2004, pp. 294-303. doi:10.1093/aje/kwh043
- K. Demerjian, “EPA PM Supersite Final Report: PM2.5 Technology Assessment and Characterization Study in New York State (PMTACS-NY),” 2004. http://www.epa.gov/ttnamti1/files/ambient/super/pmtacs.pdf
- R. Lall and G. D. Thurston, “Identifying and Quantifying Transported vs. Local Sources of New York City PM2.5 Fine Particulate Matter Air Pollution,” Atmospheric Environment, Vol. 40, No. 2, 2006, pp. 333-346. doi:10.1016/j.atmosenv.2006.04.068
- C. A. Pope III and D. W., “Epidemiology of Particle Effects,” In: S. T. Holgate, J. M. Samet, H. S. Koren and R. L. Maynard, Eds., Air Pollution and Health, Academic Press, New York, 1999, pp. 673-705.
- T. J. Grahame, “Does Improved Exposure Information for PM2.5 Constituents Explain Differing Results among Epidemiological Studies?” Inhalation Toxicology, Vol. 21, No. 5, 2009, pp. 381-393. doi:10.1080/08958370802380495
- G. D. Thurston and K. Ito, “Epidemiological Studies of Ozone Exposure Effects,” In: S. T. Holgate, J. M. Samet, H. S. Koren and R. L. Maynard, Eds., Air Pollution and Health, Academic Press, New York, 1999, pp. 485-510. doi:10.1016/B978-012352335-8/50097-1
- C. Restrepo, R. Zimmerman, G. Thurston, J. Clemente, J. Gorczynski, M. Zhong, M. Blaustein and L. C. Chen, “A Comparison of Ground-Level Air Quality Data with New York State Department of Environmental Conservation Monitoring Stations Data in South Bronx, New York,” Atmospheric Environment, Vol. 38, No. 31, 2004, pp. 5295-5304. doi:10.1016/j.atmosenv.2004.06.004
- A. Spira-Cohen, L. C. Chen, M. A. Kendall, R. Sheesley and G. D. Thurston, “Personal Exposures to Traffic-Related Particle Pollution among Children with Asthma in the South Bronx, NY,” Journal of Exposure Science and Environmental Epidemiology, Vol. 20, No. 5, 2010, pp. 446-456.
- H. R. Anderson, A. Ponce de Leon, J. M. Bland, J. S. Bower, J. Emberlin and D. P. Strachen, “Air Pollution, Pollens, and Daily Admissions for Asthma in London 1987-92,” Thorax, Vol. 53, 1998, pp. 842-848. doi:10.1136/thx.53.10.842
- J. T. Lee, H. Kim, H. Song, Y. C. Hong, Y. S. Cho, S. Y. Shin, Y. J. Hyun and Y. S. Kim, “Air Pollution and Asthma among Children in Seoul, Korea,” Epidemiology, Vol. 13, No. 4, 2002, pp. 481-484. doi:10.1097/00001648-200207000-00018
- J. Sunyer, C. Spix, P. Quénel, A. Ponce-de-León, A. Pönka, T. Barumandzadeh, G. Touloumi, L. Bacharova, B. Wojtyniak, J. Vonk, L. Bisanti, J. Schwartz and K. Katsouyanni, “Urban Air Pollution and Emergency Admissions for Asthma in four European Cities: The APHEA Project,” Thorax, Vol. 52, 1997, pp. 760-765. doi:10.1136/thx.52.9.760
- National Archives and Records Administration, “Primary National Ambient Air Quality Standards for Nitrogen Dioxide,” Federal Register, Vol. 75, No. 26, 2010, pp. 6474-6537.
- G. D. Leikauf, S. Kline, R. E. Albert, C. S. Baxter, D. I. Bernstein, J. Bernstein and C. R. Buncher, “Evaluation of a Possible Association of Urban Air Toxics and Asthma,” Environmental Health Perspectives, Vol. 103, No. 6, 1995, pp. 253-271. doi:10.1289/ehp.95103s6253