Smart Grid and Renewable Energy
Vol.06 No.04(2015), Article ID:55919,7 pages
10.4236/sgre.2015.64006
A New Method for Visual Real-Time Monitoring of Low Frequency Oscillation
Bo-Jian Wen1, Shi-Ming Li1, Chong-Wen Zhou2, Jun Luo2, Fang-Zong Wang2
1Guangdong Power Grid Co., Ltd., Power Dispatching Control Center, Guangzhou, China
2College of Electrical Engineering and Renewable Energy, China Three Gorges University, Yichang, China
Email: wenbojian@gddd.csg.cn
Copyright © 2015 by authors and Scientific Research Publishing Inc.
This work is licensed under the Creative Commons Attribution International License (CC BY).
http://creativecommons.org/licenses/by/4.0/


Received 12 March 2015; accepted 14 April 2015; published 23 April 2015
ABSTRACT
Visual real-time monitoring is the premise of low frequency oscillation control in power grids. This paper showed a visual method for the control center of power grids to monitor low frequency oscillation. It processed the PMU real-time data with incomplete S-transform, and converted the waveforms to two-dimensional time-frequency figures which showed the initial time, frequency and amplitude of each low frequency oscillation mode directly. GPU was used to show figures and calculate FFT with the purpose of improving calculation efficiency. The results of practical cases show that the real-time characters of low frequency oscillation can be identified availably by this visualization real-time monitoring method which is helpful and suitable for practical application.
Keywords:
Low Frequency Oscillation, Incomplete S-Transform, Real-Time Monitoring, Visual, GPU

1. Introduction
With the expanding of large-scale interconnected power systems, structure and characteristics of the power system are more and more complex. Low frequency oscillation becomes seriously, which puzzles the operation of power systems [1] . Real-time monitoring is the basis of arranging operation modes legitimately, which can damp low frequency oscillation and improve the stability of power system [2] .
In recent years, the phasor measurement unit (PMU) based on global positioning system (GPS) is widely spread. The wide area measurement system (WAMS) based on PMU is widely used in engineering practice [3] - [5] . For monitoring low frequency oscillation on-line, the WAMS uses PMU to collect operating data in different locations of power grids and sends them to the dispatch center. Currently, the real-time monitoring is imple- mented by analyzing the PMU real-time data artificially and directly. This method has two kinds of disadvantages. Firstly, it is difficult to determine the number of low frequency oscillation modes. Secondly, it is not easy to determine the frequency and amplitude of each oscillation mode directly.
As a signal analysis method with multi-resolution, S-transform [6] has been used to solve many electricity problems. It can be used to identify fault lines in power system [7] and analyze power quality disturbances [8] -[12] . It also can be applied to extract specific signal components of non-stationary signal [13] . Results of those researches show that S-transform possesses good time-frequency characteristics and can separate frequency components. Two-dimensional time- frequency figures based on results of S-transform can show the change of frequency and amplitude over time. S-transform was applied to monitor low frequency oscillation on-line in this paper. Only data in the range of 0.2 - 2.5 Hz were needed for monitoring analysis, so the incomplete S-transform was introduced [9] . This paper adopted parallel optimization algorithm on GPU [14] for improving the efficiency.
2. Incomplete S-Transform
2.1. S-Transform
S-transform is a modified short time Fourier transform (STFT). The short time Fourier transform of a signal  is defined as
 . (1)
. (1)
In Equation (1),  and
and  are time and frequency.
The form-retaining window  can be replaced with Gaussian window as
![]() . (2)
. (2)
Then S-transform of signal ![]() is
is
![]() . (3)
. (3)
It can be an another form as
![]() . (4)
. (4)
In Equation (4), ![]() is the Fourier transform of
is the Fourier transform of![]() . The result of S-transform is a two-dimensional time-frequency matrix named matrix
. The result of S-transform is a two-dimensional time-frequency matrix named matrix![]() . Rows and columns of matrix
. Rows and columns of matrix ![]() correspond to frequency and time, and elements correspond to amplitude.
correspond to frequency and time, and elements correspond to amplitude.
2.2. Incomplete S-Transform
S-transform has heavy computational complexity, but the useful data of low frequency oscillation just account for a small part. In incomplete S-transform, only data of characteristic frequency are calculated, which can reduce the computational complexity and memory space [9] . In the analysis of low frequency oscillation, it also works. Data with information of low frequency oscillation in matrix ![]() can be named as matrix
can be named as matrix![]() . For a N-dimensional discrete signal
. For a N-dimensional discrete signal , the calculation of incomplete S-transform is:
1) As the Fourier transform of ,
,  is given by
 , (5)
, (5)
where  is the sampling point of frequency.
2) Confirm the range of matrix . The corresponding relation of
  and
and  is
is
 , (6)
, (6)
where T is the sample interval and  is the sampling number. The value of
  can be counted by Equation (6): When
  and
and ,
,  corresponds to
  and
and . Then
  and the number of sampling point of frequency is
 .
.
3) Move elements of , and the step size is
 . Then
 . (7)
. (7)
Vector of window function  can be counted by
 . (8)
. (8)
Then, vector  is
is
 . (9)
. (9)
4) Matrix  can be expressed as
 . The inverse Fourier transform of vector
  corresponds to data of
  matrix in row
  as
as
 . (10)
5) Repeat steps 3)-4) and adopt  until
until .
.
6) Extract the modulus matrix of  denoted by
 , and
, and
 . (11)
3. Real-Time Monitoring of Low Frequency Oscillation Based on Incomplete S-Transform
3.1. Parallel Optimization Algorithm of FFT Based on GPU
The computation of S-transform is focus on the FFT algorithm and its inverse transformation, which requires large computation and restricts the practical application of the algorithm. GPU is a highly parallel data flow processor aims to improve the vector computing. Therefore, it is obvious to improve calculation efficiency by operating FFT and its inverse algorithm on GPU. Principles to optimize the parallel algorithm of FFT on GPU are illustrated as follows.
Equation (5) can be shown as
 , (12)
where  and it is called twiddle factor. The sampling number
  satisfies
 .
.
The traditional sequential algorithm of FFT on CPU is introduced in [15] . Sequential algorithm will have finished M levels of butterfly operation in total. Butterfly operation of the same twiddle factor should be put in the same group on each level. These groups should be completed one by one until all groups under the same level are completed, then proceeding to the next level. The traditional sequential algorithm of FFT is achieved by the three-cycle structure. Butterfly operation of the same group is the innermost layer. The second layer should change the twiddle factor as well as changing groups, and the outer layer is changing levels. Then M levels of butterfly operation can be finished.
Comparing to sequential algorithm, the advantages of parallel algorithm on GPU is: Every level has N/2 independent butterfly operation which can be performed in parallel at the same time, which makes the time complexity drop to  from
from . The inverse algorithm of FFT has similar structure, which can be completed by the same way.
3.2. Real-Time Monitoring of Low Frequency Oscillation Based on Incomplete S-Transform
WAMS collects real-time data at different places of power grids by PMU. Then the data will be marked time scale based on GPS and sent to the dispatch center in a high speed by fiber every 20 ms. At present, power dispatchers observe waveforms of PMU data to monitor the low frequency oscillation artificially. It’s hard even for experienced power dispatcher to analyze oscillation modes and their frequency quickly. In that case, a visual real-time monitoring method of low frequency oscillation based on incomplete S-transform in power grids has been proposed. The basic idea is: PMU can be used to collect the active power data of generator and tie line on- line; Those data can be transformed into two-dimensional time-frequency figures by incomplete S-transform process; If the low frequency oscillation occurs on girds, dispatchers can get those figures immediately; The horizontal axis of two-dimensional time-frequency figures shows time and the vertical axis represents the frequency while the amplitude of oscillation is illustrated by brightness; The data of figures should be updated every 20 ms so that those can keep up with PMU data and display the real-time information dynamically.
The flowchart of visualization real-time monitoring method of low frequency oscillation based on incomplete S-transform is shown in Figure 1.
4. Case Study
PMU data of low frequency oscillation in China Southern Power Grids can be used to test the feasibility and effectiveness of this method.
Case 1: Waveform of PMU active power data on line A in China Southern Power Grids is shown in Figure 2.
PMU sends data to the dispatch center every 20 ms, so the data window moves forward  at the same time. Changes of waveforms over time are shown in Figure 3.
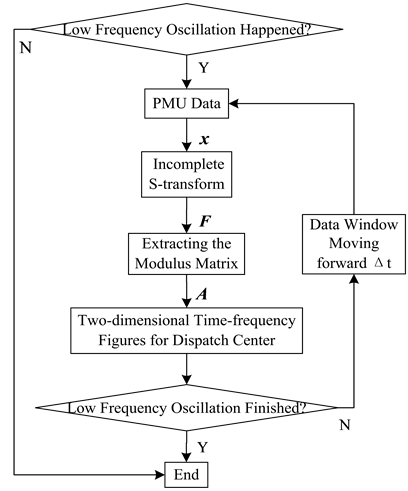
Figure 1. Flowchart of visualization real-time monitoring method based on incomplete S-transform.
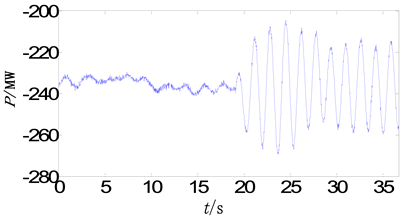
Figure 2. Waveform of PMU active power data, line A.
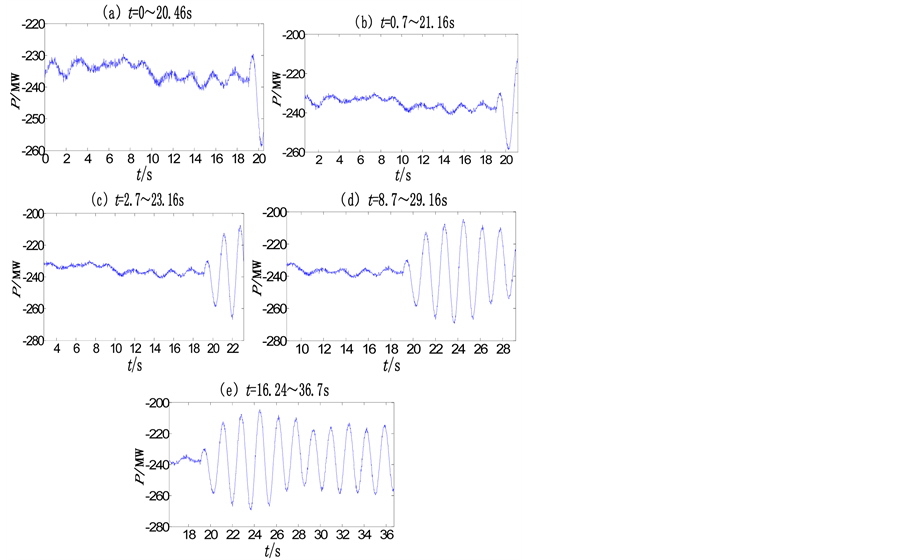
Figure 3. Waveforms of PMU active power data over time, line A.
Obviously, it is hard for human to determine the number, the frequency and the amplitude of low frequency oscillation modes directly.
Waveforms in Figure 3 can be transformed into two-dimensional time-frequency figures in Figure 4.
These two-dimensional time-frequency figures are based on data of matrix  and update data at the same time with PMU. It is easy to obtain the information of time, frequency and amplitude for power dispatchers. For easier analysis, the color of Figure 4(d) is changed in Figure 5. It shows that the main oscillation at frequency of 0.68 Hz starts at 18.7 s.
Case 2: Waveform of PMU active power data on line B in China Southern Power Grids is shown in Figure 6.
Waveforms in Figure 6 can be transformed into two-dimensional time-frequency figures in Figure 7 by incomplete S-transform.
It shows that this method can separate frequency components. The color of Figure 7(d) is changed in Figure 8.
There are two modes of low oscillation, the one at frequency of 0.54 Hz starts at 17.8 s, another at frequency of 0.93 Hz starts at 20.9 s.
The platform of those cases is Intel Pentium 4 CPU 3.06 GHz and size of main memory is 2 GB. The model of graphics is NVIDIA GEForce7025. Both complete S-transform and incomplete S-transform are performed on GPU and CPU. The computing time of each algorithm is shown in Table 1.
The data show that incomplete S-transform can reduce more than 90 percent of time comparing to the complete one, and running algorithm on GPU is over ten times faster than that on CPU.
5. Conclusions
This paper introduced a visual real-time monitoring method of low frequency oscillation based on incomplete S- transform, which transformed waveforms into two-dimensional time-frequency figures. Results showed that this method can determine the number, frequency and starting time of low frequency oscillation modes directly and exactly.
This paper adopted parallel optimization algorithm on GPU for FFT in incomplete S-transform, which improved the efficiency greatly.
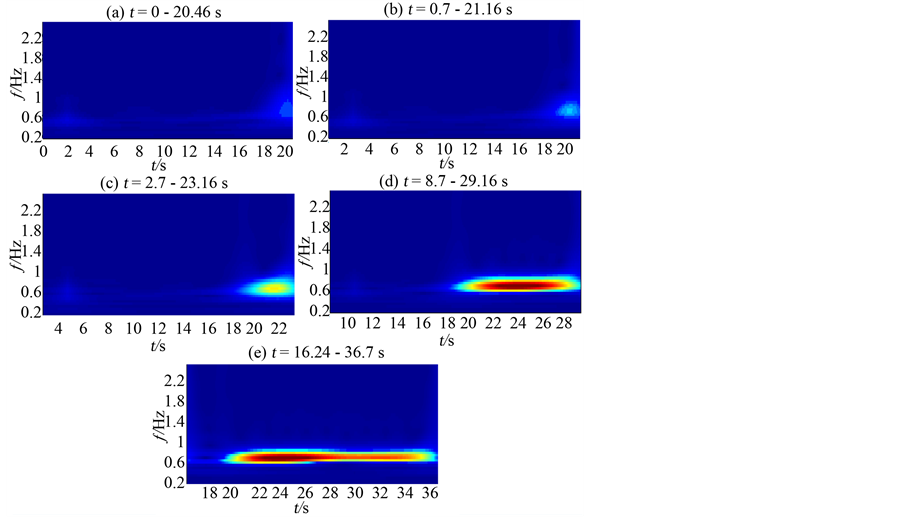
Figure 4. Two-dimensional time-frequency figures of active power signal over time, line A.
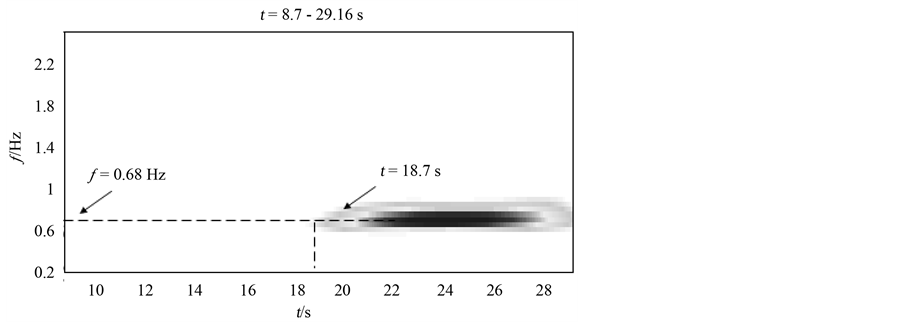
Figure 5. Two-dimensional time-frequency figures of active power signal in 8.7 - 29.16 s, line A.
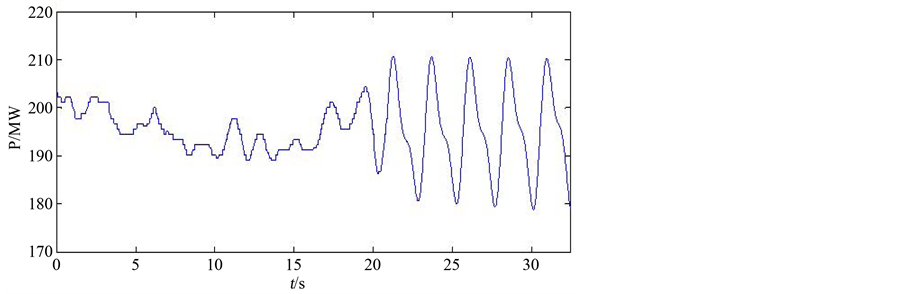
Figure 6. Waveform of PMU active power data, line B.
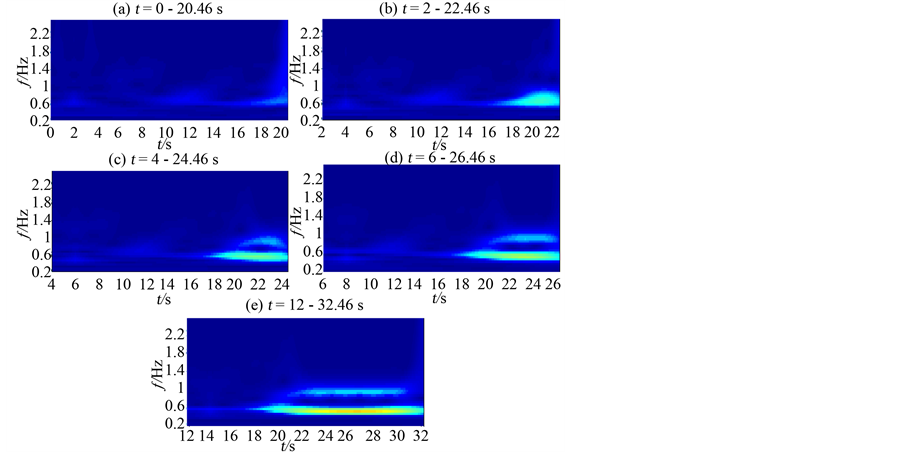
Figure 7. Two-dimensional time-frequency figures of active power signal over time, line B.
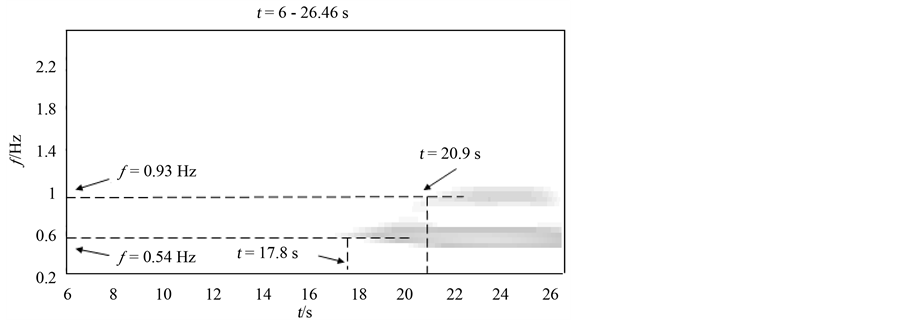
Figure 8. Two-dimensional time-frequency figures of active power signal in 6 - 26.46 s, line B.

Table 1. Comparison of computing time by each algorithm.
The method in this paper has been applied to China Guangdong Power Grid Company. The operational results show that this method can reflect the real-time characteristics to power dispatchers directly and exactly.
References
- Zhu, F., Zhao, H.-G., Liu, Z.-H., et al. (2007) The Influence of Large Power Grid Interconnected on Power System Dynamic Stability. Proceedings of the CSEE, 27, 1-7.
- Liang, S.-Y., Li, M., Li, P. and Chen, G. (2007) Algorithm of Real-Time Detection Low-Frequency Oscillation in Power System Base on the SCADA Data. Southern Power System Technology, 1, 40-42.
- Cheng, Y.-F., Zhang, X.-R. and Lu, C. (2014) Research Progress of the Application of Wide Area Measurement Technology in Power System. Power System Protection and Control, 42, 145-153.
- Xu, S.-K., Xie, X.-R. and Xin, Y.-Z. (2005) Present Application Situation and Development Tendency of Synchronous Phasor Measurement Technology Based Wide Area Measurement System. Power System Technology, 29, 44-49.
- Wu, H.-X. and Chang, Y. (2008) Advance of Monitor and Control of Low Frequency Oscillation Based on WAMS. High Voltage Engineering, 34, 1737-1744.
- Stockwell, R.G., Mansinha, L. and Lowe, R.P. (1996) Localization of the Complex Spectrum: The S Transform. IEEE Transactions on Signal Processing, 44, 998-1001. http://dx.doi.org/10.1109/78.492555
- Zhang, J., He, Z.-Y. and Jia, Y. (2011) Fault Line Identification Approach Based on S-Transform. Proceedings of the CSEE, 31, 109-115.
- Yi, J.-L., Peng, J.-C. and Tan, H.-S. (2011) A Summary of S-Transform Applied to Power Quality Disturbances Analysis. Power System Protection and Control, 39, 141-147.
- Yi, J.-L., Peng, J.-C. and Tan, H.-S. (2009) Detection Method of Power Quality Disturbances Using Incomplete S-Transform. High Voltage Engineering, 35, 2562-2567.
- Liu, Q., Zhou, L.-W. and Lu, W.-G. (2012) Localization and Identification of Transient Power Quality Disturbances Based on Generalized S-Transform. Power System Protection and Control, 40, 60-65.
- Tang, Q., Teng, Z.-S., Gao, Y.-P. and Zhou, Y.B.. (2012) Voltage Flicker Measurement Using Square Demodulation Method Based on S-transform. Proceedings of the CSEE, 32, 60-67.
- Chen, L., Wang, S. and Kong, W.-G. (2014) Method to Identify Composite Voltage Sag Disturbance Sources Based on Generalized S-Transform. Power System Protection and Control, 42, 27-33.
- Chen, X.-H., He, Z.-H. and Huang, D.-J. (2008) Generalized S Transform and Its Time-frequency Filtering. Signal Processing, 24, 28-31.
- Brandon, L.D., Boyd, C. and Govindaraju, N. (2008) Fast Computation of General Fourier Transforms on GPUs. IEEE International Conference on Multimedia and Expo, Hannover, 23-26 June 2008, 5-8.
- Zhao, L.-L., Zhang, S.-B., Zhang, M. and Yao, T. (2011) High Performance FFT Computation Based on CUDA. Application Research of Computers, 28, 1556-1559.