Smart Grid and Renewable Energy
Vol.5 No.3(2014), Article ID:44029,11 pages DOI:10.4236/sgre.2014.53006
Reliability Evaluation of Distribution Systems under μ Grid-Tied and Islanded μ Grid Modes Using Monte Carlo Simulation
Ahmed R. Abul’Wafa, A. T. M. Taha
Department of Electric Power and Machines, Faculty of Engineering, Ain-Shams University, Cairo, Egypt
Email: Ahmedlaila.nelly.ola@gmail.com, adel_taha06@yahoo.com
Copyright © 2014 by authors and Scientific Research Publishing Inc.
This work is licensed under the Creative Commons Attribution International License (CC BY).
http://creativecommons.org/licenses/by/4.0/


Received 13 January 2014; revised 12 February 2014; accepted 18 February 2014
ABSTRACT
Reliability evaluation of distribution networks under grid-tied and islanded µ grid modes is presented. The Monte Carlo simulation (MCS) algorithm is applied to a modified RBTS Bus 2 distribution network. The network includes three types of distributed energy resources, namely, solar photovoltaic (PV), wind turbine (WT), and diesel turbine generator (DTG). These distributed generators contribute to supply part of the load during grid-connected mode, but supply 100% of the load in the islanded µ grid mode. A storage system is included to decrease the peak load since the peak of the output power of the PV’s and the peak load do not match time wise in most load profiles. The impact of implementing renewable distributed generation, storage systems, and conventional generation on the reliability of distribution network is studied. This study shows that the penetration of distributed generations can improve the reliability indices of the distribution network.
Keywords:Reliability Evaluation; Monte Carlo Simulation; Distributed Generations

1. Introduction
In recent years, interest in application of distributed generation (DG) in improving power system reliability has grown tremendously [1] [2] . This interest is motivated by the potential to use renewable resources to generate electricity in distribution networks on a small scale, which can lead to µ grid configurations. The implementation of µ grids in distribution networks promises a higher level of reliability [3] [4] . One of the promising features of µ grids is the capability to perform auto-configuration of distribution networks without the interaction of networks operators [5] . Since the output power of wind turbine (WT) and photovoltaic (PV) generators are variable in nature, distribution networks must have enough capacity to deal with sudden drops in power. The networks must also be capable of dealing with bi-directional power flow because DGs are normally placed at customer ends. This requires utility companies to upgrade their protection systems to handle different modes of operation [1] .
To evaluate the reliability of distribution networks containing PV and WT generations, stochastic models have to be built to deal with uncertainty of these resources. A PV output power model may be seen in [6] . The authors in [7] have proposed three probability distributions for solar insolation and wind speeds. These are Normal, Weibull, and Beta. Prediction analysis tool has been used in [8] [9] , which can simulate light intensity fluctuations. A WT model for reliability studies has been proposed in [10] . A probabilistic method to predict wind speeds is presented in [11] .
Monte Carlo Simulation (MCS) is widely used in power system studies such as probabilistic power flow, economic dispatch and reliability evaluation [12] [13] . Distribution system reliability evaluation based on MCS is very useful for complex non-linear systems. This method yields more information on the load point and system reliability indices compared to analytical method [14] . Using MCS to simulate the output power of WT and PV can be used to avoid complexities of an analytical method. In [15] proposed µ grids having control facilities which provide for the operator, the ability of performing some particular management to improve reliability indices. For this, by a day-ahead scheduling, Distributed Energy Resources (DERs) generations at 24 hours can be obtained; then two suggested management methods are implemented and the results are compared. [16] describes the characteristics and optimal methods for the planning of stand-alone µ grid system, in order to improve the power supply reliability, increase the coefficient of utilization of renewable energy and reduce the cost of investment and operation.
In this paper, MCS is used to evaluate the reliability of the RBTS Bus 2 distribution system [1] [9] , with and without µ grids. The impact of implementing renewable distributed generation, storage systems, and conventional generation on the reliability of distribution network is studied. To evaluate the reliability of distribution networks containing PV and WT generations, stochastic models have been be built to deal with the uncertainty of these resources and loads. The storage system model was developed and implemented to smooth the fluctuations of the output power of renewable resources.
2. DG Model
It is well known that due to the fact that solar insolation and wind speeds are intermittent, the output power of PV and WT systems is not deterministic. That brings up the need for a stochastic model to simulate PV and WT outputs. The stochastic model is a simulation-based technique to describe a non-deterministic behavior and the randomness of the system.
2.1. Photovoltaic Output Power Model
The sunlight intensity or insolation I(t) and solar panel area S have a great impact on PV output power. The intensity of sunlight varies from month to month and reaches the peak during the summer. The output power of the PV system can be calculated by (1) below [6] :
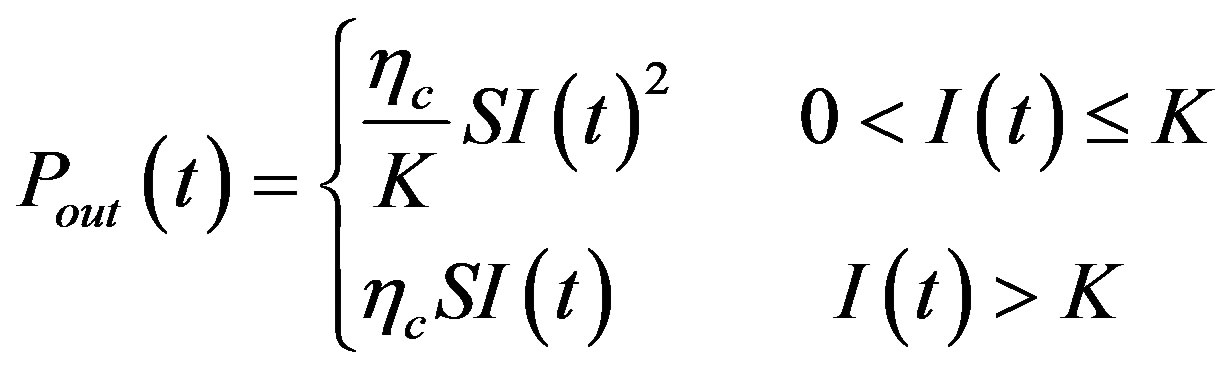 (1)
(1)
where ηc is the efficiency of the PV system including the inverter, and K is a threshold.
The efficiency ηc varies linearly when I(t) is less than or equal K and, is generally constant when I(t) exceeds K. The solar insolation can be affected by several factors such as cloud, temperature and relative humidity. To make the PV model more realistic, a prediction tool should be implemented. Studies have proven that the variation of PV output power (∆Pout) follows a normal distribution [8] , therefore, can be expressed by the following equation:
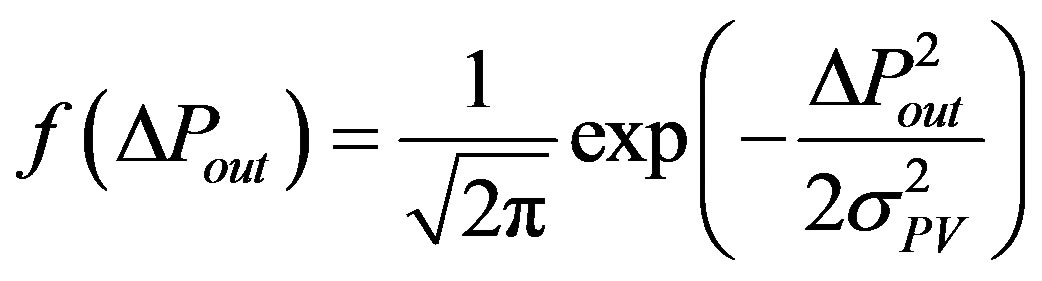 (2)
(2)
where  is the variance of PV output power.
The predicted PV output power includes  on a sunny day plus
 . Thus, the PV output can be calculated by (3).
 (3)
(3)
2.2. Wind Turbine Output Power Model
The output power of a wind turbine depends on wind velocity. The relationship between the output power and wind velocity can be expressed by the following equation [17] :
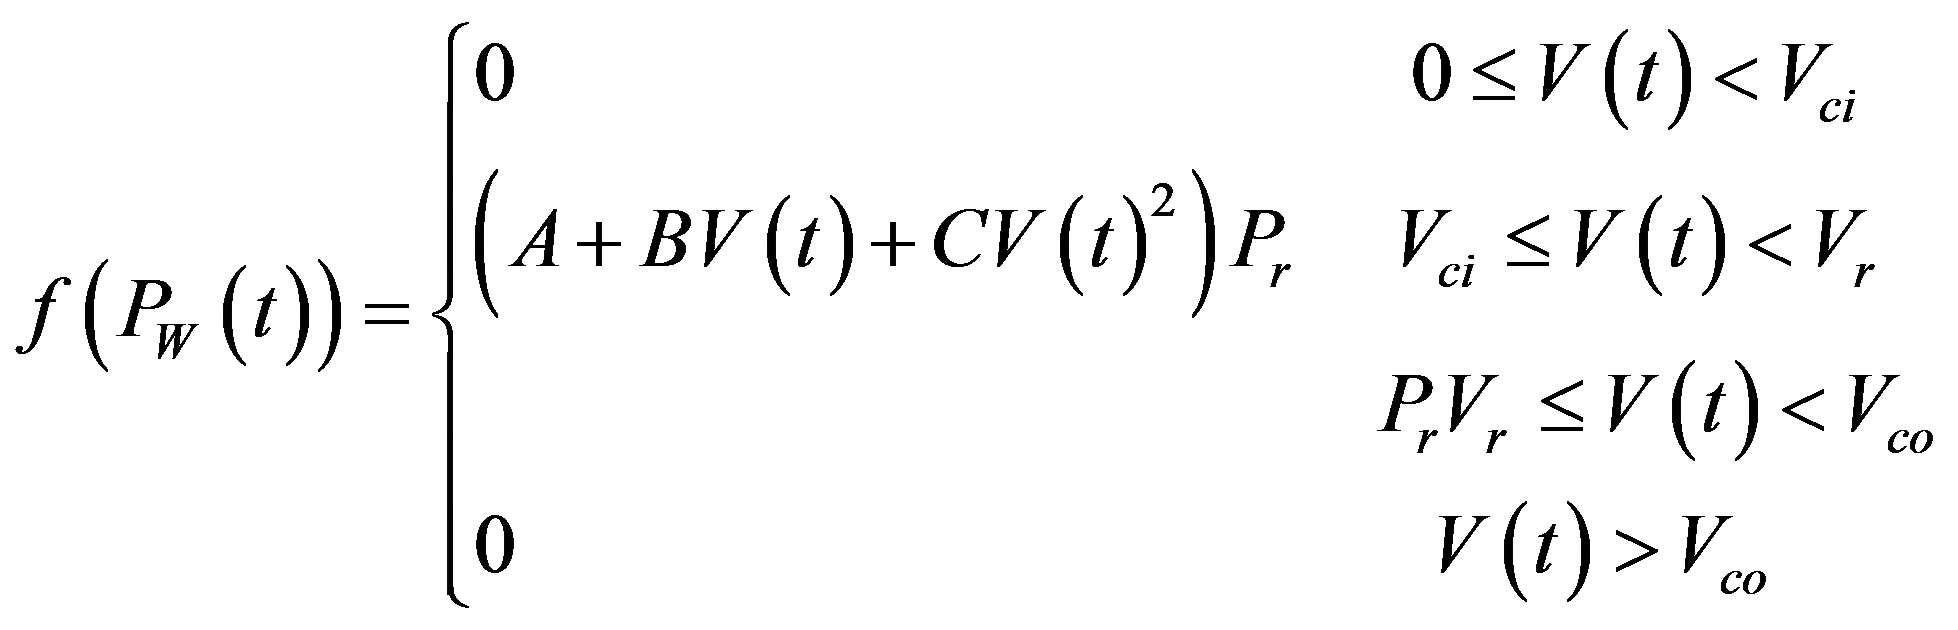 (4)
(4)
where Pr = rated power output, Vci = cut-in wind speed, Vr = rated wind speed, Vco = cut-out wind speed, PW(t)is the wind power output at the tth hour. The constants A, B and C can be found in [10] using Vci, and Vr.
Wind speed is intermittent by nature and this will result in variations in output power. Consequently, a probabilistic method should be implemented to simulate the uncertainty of the wind speed. Statistical data has shown that probability distribution of wind speed follows a Weibull distribution [18] . The probability density function of two parameters Weibull distribution is given as:
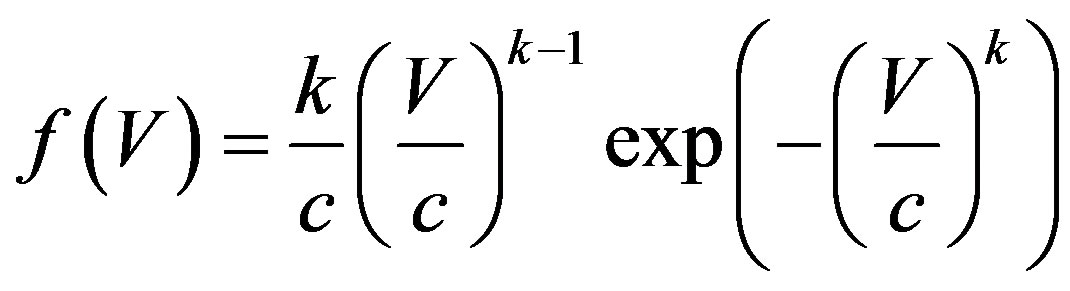 (5)
(5)
where V = wind speed, c = scale parameter, k = shape parameter.
Both k and c can be expressed as functions of average and standard deviation of wind speed [4] .
3. Storage System
A storage system can be used with a photovoltaic unit to smooth the fluctuation of the PV output power and shave the peak load by reducing the demand. In addition, battery storage can associate with the distributed energy resources to supply the load when the main source is not available. In this paper, a generic battery storage system is developed, which serves the main purpose of this study. The battery system capacity and the converter capacity are 0.4 MWh and 0.3 MW respectively. From 2:00 am to 6:00 am, the storage draws 0.15 MW continuously to charge the batteries because this time is considered to be off-peak (based on the load profile). From 4:00 pm to 8:00 pm, the storage system is discharged to supply the load during the peak. Because there is no output power of the PV during the night, the storage battery is charged by the main grid. During interruptions in the power network, the load can draw up to 0.3 MWh of energy in 2.5 hours if the battery is fully charged.
4. Load Model
Weather conditions and seasonal events affect the load. Fortunately, most of these events take place at the same time annually. Therefore, the behavior of power system loads is a frequent pattern during the normal condition. A time varying load model can be developed by using historical data. Monthly and hourly weight factor data [19] are used to construct a load model. Figures 1 and 2 show monthly and hourly weight factors respectively. Equation (6) can be used to find the predicted load for load point at any desired time.
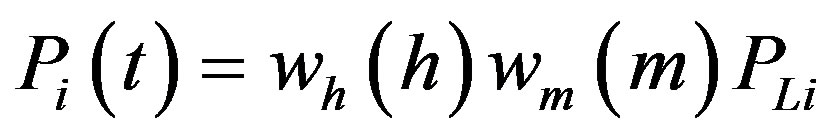 (6)
(6)
where  = hourly weight factor,
  = monthly weight factor, and
  = peak load for load point.
5. Reliability Indices
Mostly, forced interruptions in power service are included in reliability evaluation. These interruptions occur
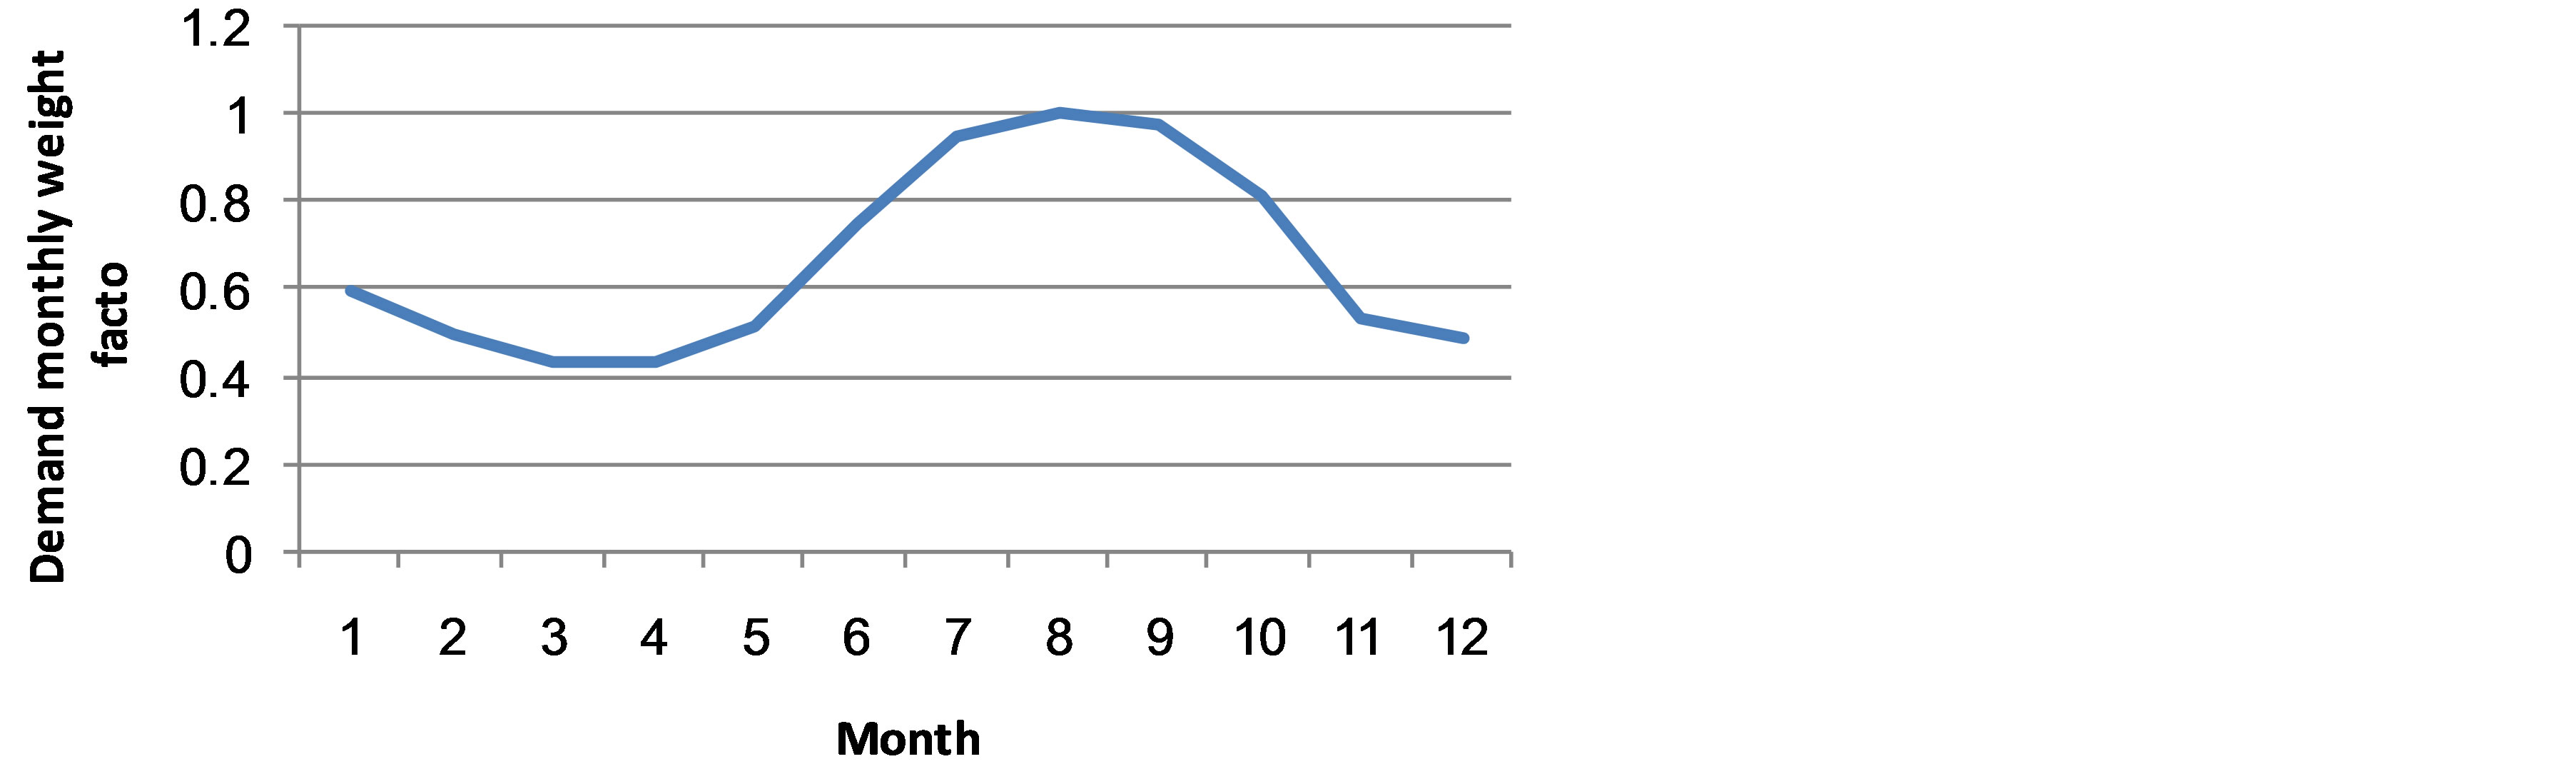
Figure 1. Demand monthly weight factor.
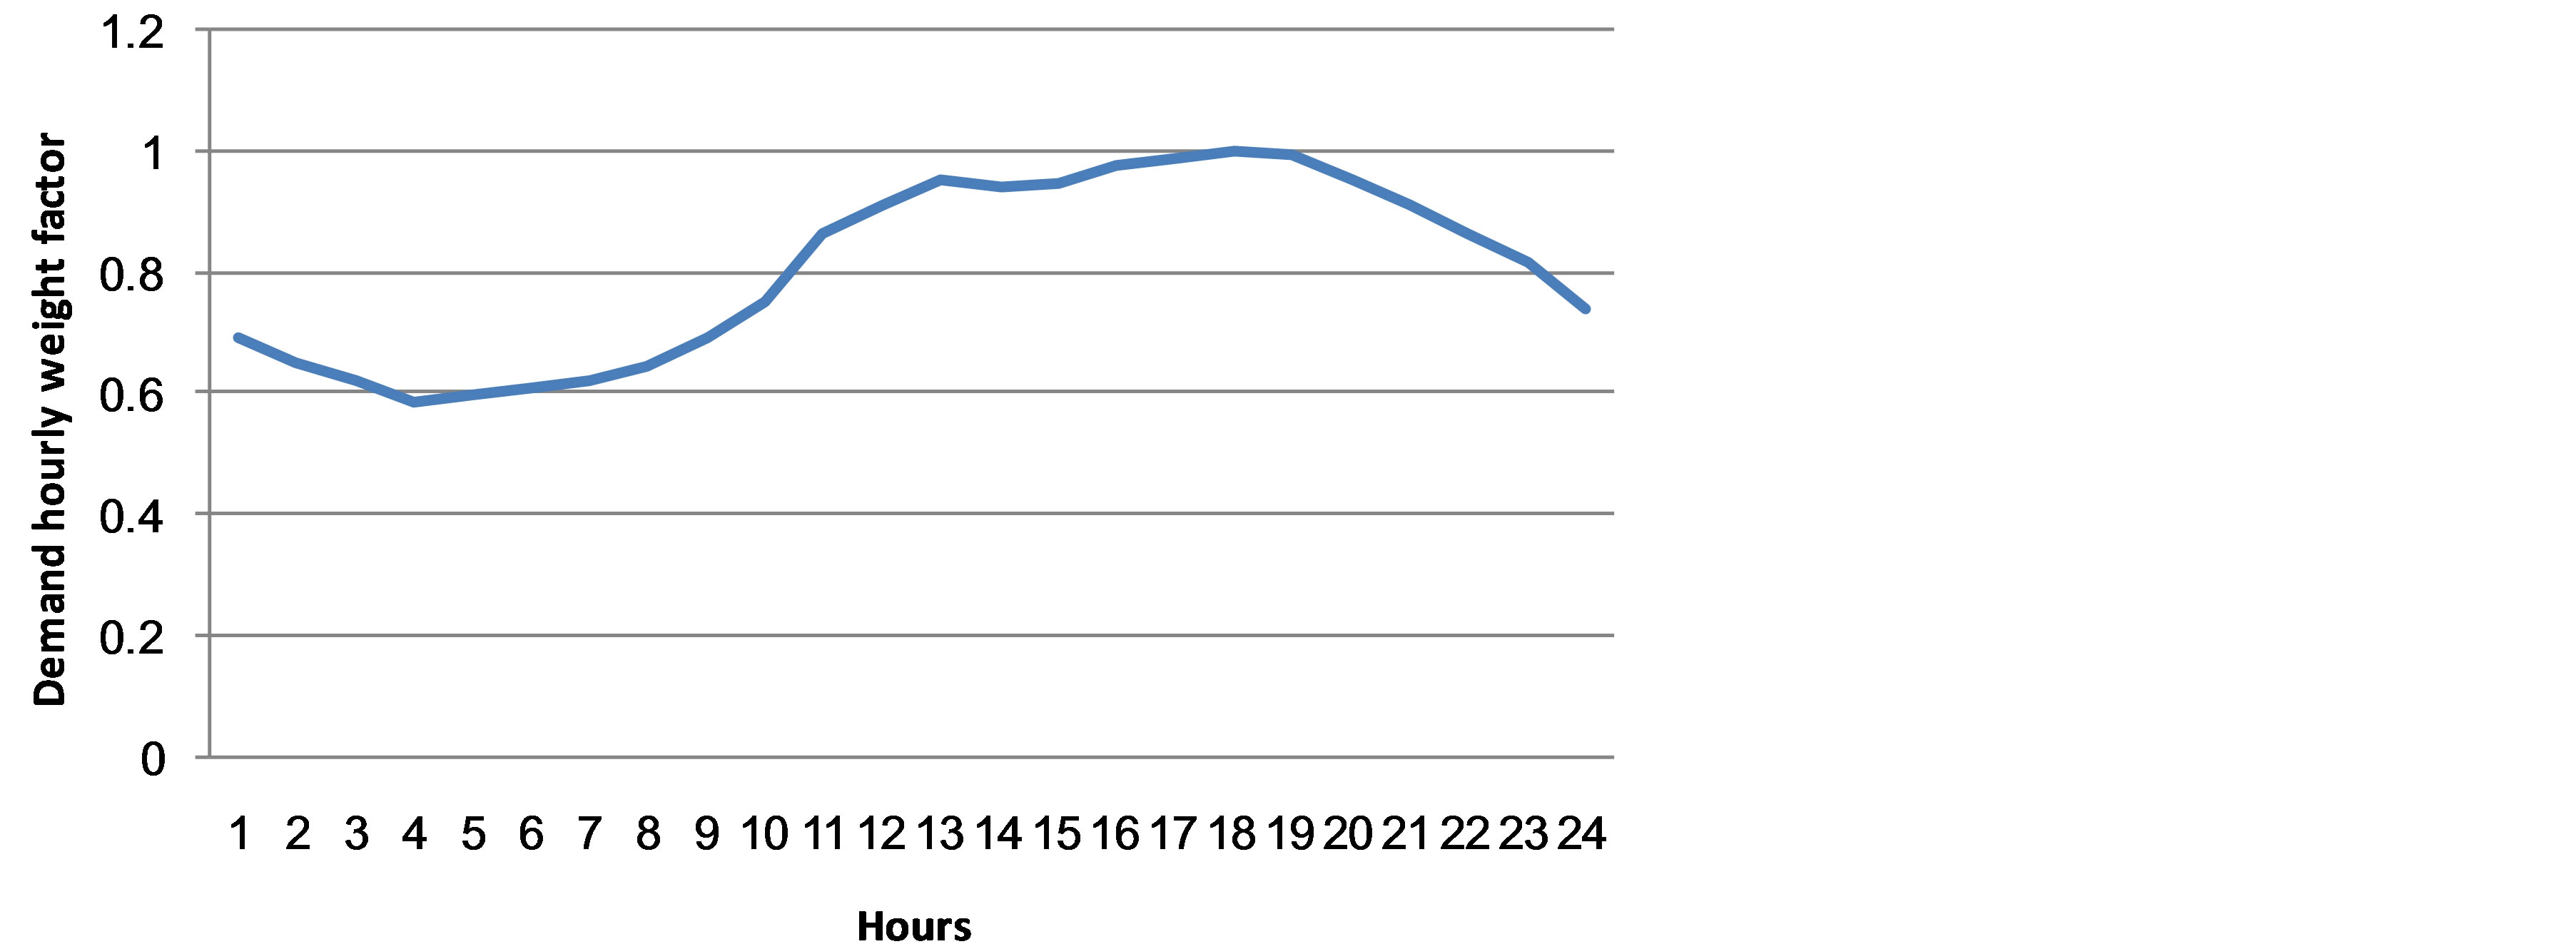
Figure 2. Demand hourly weight factor.
due to the failure of network components. In this study, some common indices are used to evaluate the reliability of power networks. These include SAIFI, SAIDI, and EENS [20] . These indices can be defined as functions of average failure rate over the total number of customers, and average interruption time.
6. Monte Carlo Simulation
Due to the fact that failures in power systems are random in nature, MCS can be used to simulate these failures. MCS is a probabilistic method that can be used to predict the behavior of the system components. Time sequential simulation is one of the MCS types used when the system behavior depends on past events.
An artificial history is needed in time sequential simulation and this can be obtained by generating the up and down times randomly for the system components. Time to failure (TTF) is the duration that would take the component to fail. This time is predicted randomly [21] by (7).
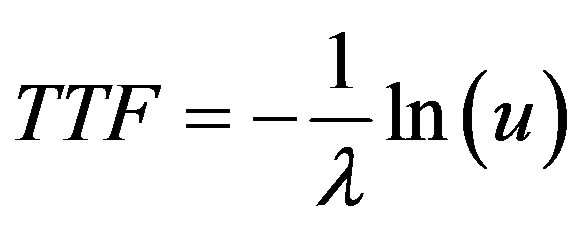 (7)
(7)
Time to repair (TTR) or Time to replace (TTR) is the time required to repair or replace a filed components. Also, this time is predicted randomly [21] by (8).
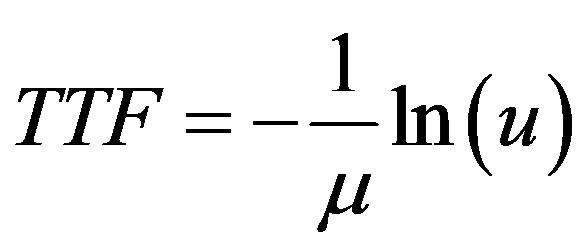 (8)
(8)
where  and
and  is failure and restoration rates of system component respectively. u is a uniformly distributed random number (ranging from 0 to 1).
It is obvious from Equation (7) and Equation (8) that TTF and TTR follow exponential distributions. To predict the artificial history of system components, TTF and TTR can be generated to cover simulation times (e.g. 1 year) in chronological order.
7. Simulation Procedure
In this study, two cases are investigated. The first case is for a distribution network that does not contain µ grids, and the second is for a distribution network containing µ grids. The results from the studies give a clear vision of how DGs can improve the reliability.
Since the main purpose of this study is to evaluate the reliability of distribution systems containing µ grids, the following assumptions were made which should not have a significant effect on the results:
· Only primary main feeder failures are included in the analysis.
· Only permanent faults are included in the study.
· All protection devices operate successfully to isolate faults.
· Each section is protected by a breaker to isolate faults.
· It takes 1 hr to transfer loads from the failed feeder to a neighboring feeder through a normally open point.
Figure 3 shows the algorithm of distribution system reliability evaluation indices with μ grids. Minor modification makes it applicable to system without μ grids.
8. Case Study
Many distribution network reliability studies reported in the literature have used the RBTS Bus 2 or Bus 4 [1] [8] . These networks offer the information needed to conduct a reliability study. In this study, a modified RBTS Bus 2 is used. The system is shown in Figure 4. All distribution network data may be found in reference [15] . The maximum output power of PV1, PV2 or PV3 is 1.5 MW each. The failure rate and average repair time of PV generators are 0.1 f/yr and 30 hr respectively. The maximum output power of WT1, WT2 and WT3 are 2.5, 2 and 2 MW respectively. The failure rate and average repair time of WTs are 0.25 f/yr and 20 hr respectively. The rated power of diesel generators DTG1 and DTG2 is 2 MW each. The failure rates and average repair time of the DTGs are 0.25 f/yr and 8 hr respectively. The solar insolation and wind speed data may be found in reference [9] .
The solar insolation data, extracted from [9] is given in Table 1. The wind velocity and wind turbine data, also extracted from [9] are given in Table 2. The PV efficiency (ηc) and K are 0.1 and 0.035 kW/m2.
The modified RBTS Bus 2 has four µ grids. µ grid 1 contains feeder 1 and is supplied by PV1, WT1, and DGT1. µ grid 2 contains feeder 2 and is supplied by PV2. µ grid 3 contains feeder 3 and is supplied by PV3, WT2, and DGT2. µ grid 4 contains feeder 4 and is supplied by PV4, WT3, and DGT3. If there is enough power generation to supply the feeder loads during a permanent fault, the µ grids can operate in islanded mode.
In this work, MCS is used to evaluate the reliability of RBTS Bus 2 with and without µ grids. In addition, the impact of implementing storage systems in the reliability assessment of the distribution network is investigated. In order to obtain an accurate result, MCS have to be performed for a large number of scenarios, and the simulation time can be expanded to be a very long time (e.g. 1000 years or more) depending on the case study and the desired accuracy. After that, the average can be calculated. In this study, the simulation is performed for a time period of one year and 20,000 simulation years. Figures 5-7 show convergence of MCS for annual average rate, average interruption time, and annual unsupplied energy respectively of load point #1.
Figures 8-10 show annual average rate, average restoration time, and annual energy unsupplied respectively to each load point in the two cases. Table 3 shows the results of reliability indices for the two cases.
9. Discussion
The failure rate of the feeder section is a function of the length and each section has a different length. Therefore,

Table 1. Monthly light intensity (kWhr/day/m2).
Table 2. Wind velocity and wind turbine data (m/s).
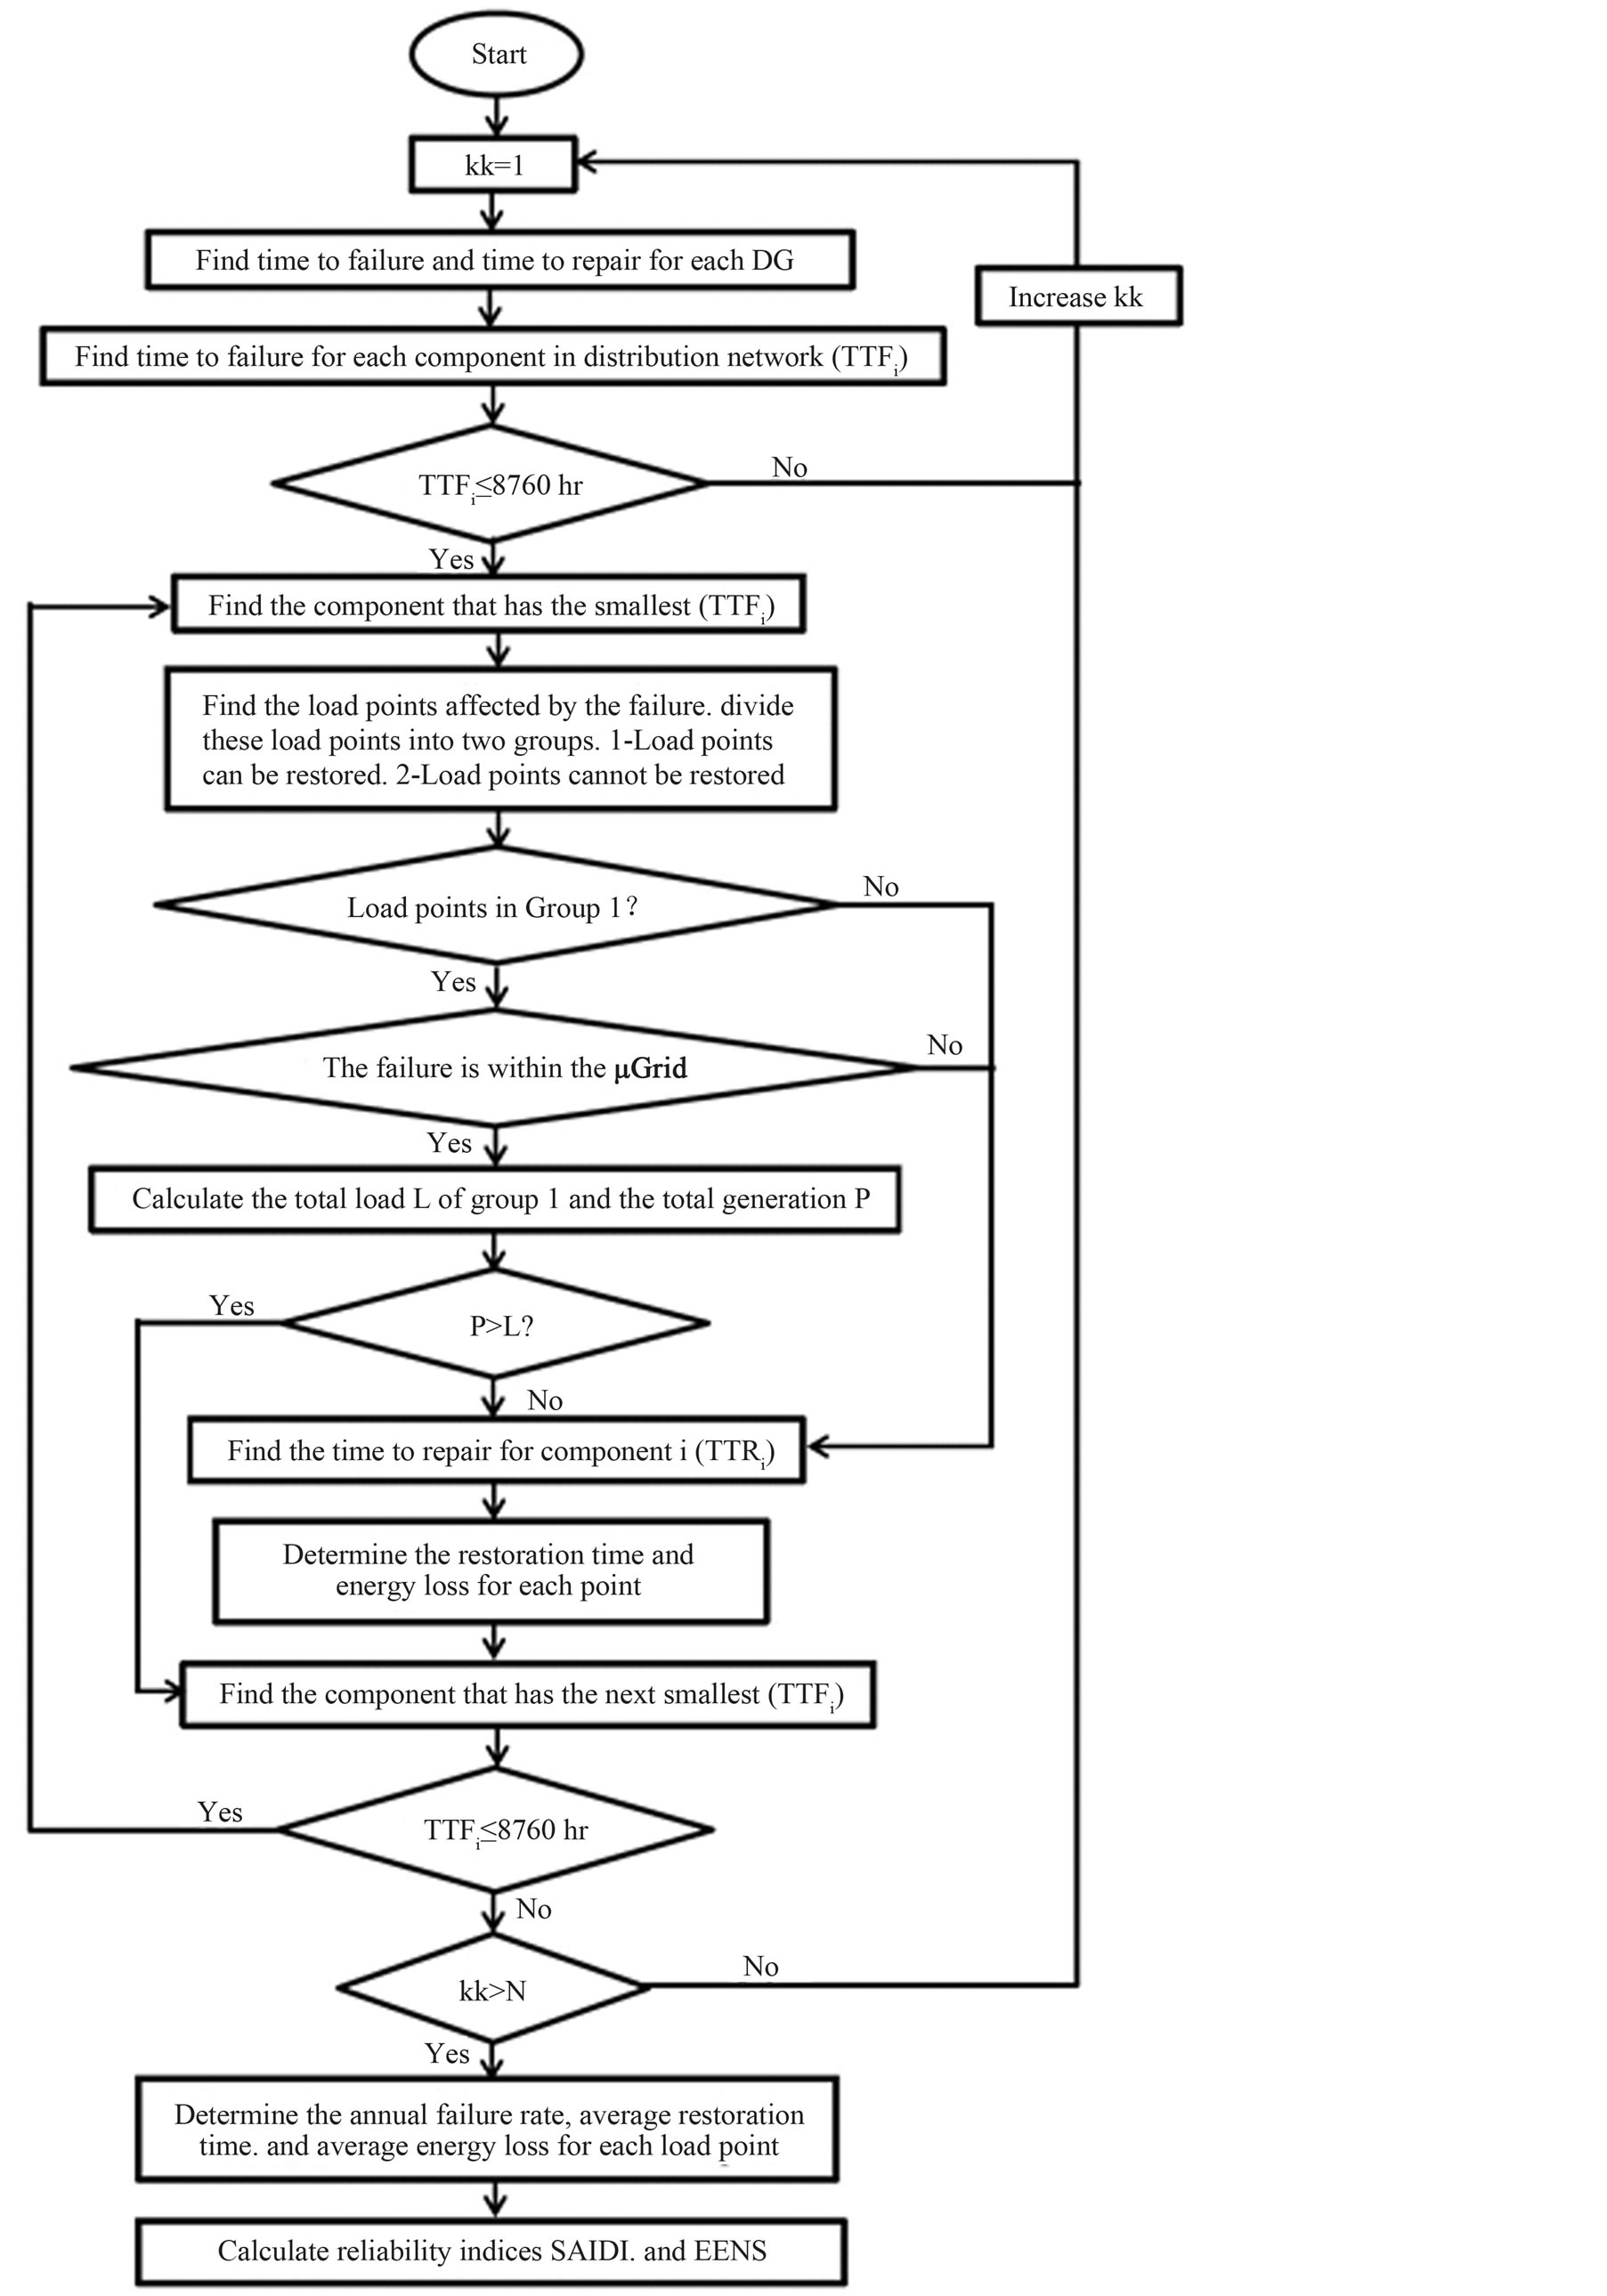
Figure 3. Flowchart of distribution system reliability evaluation with µ grids.
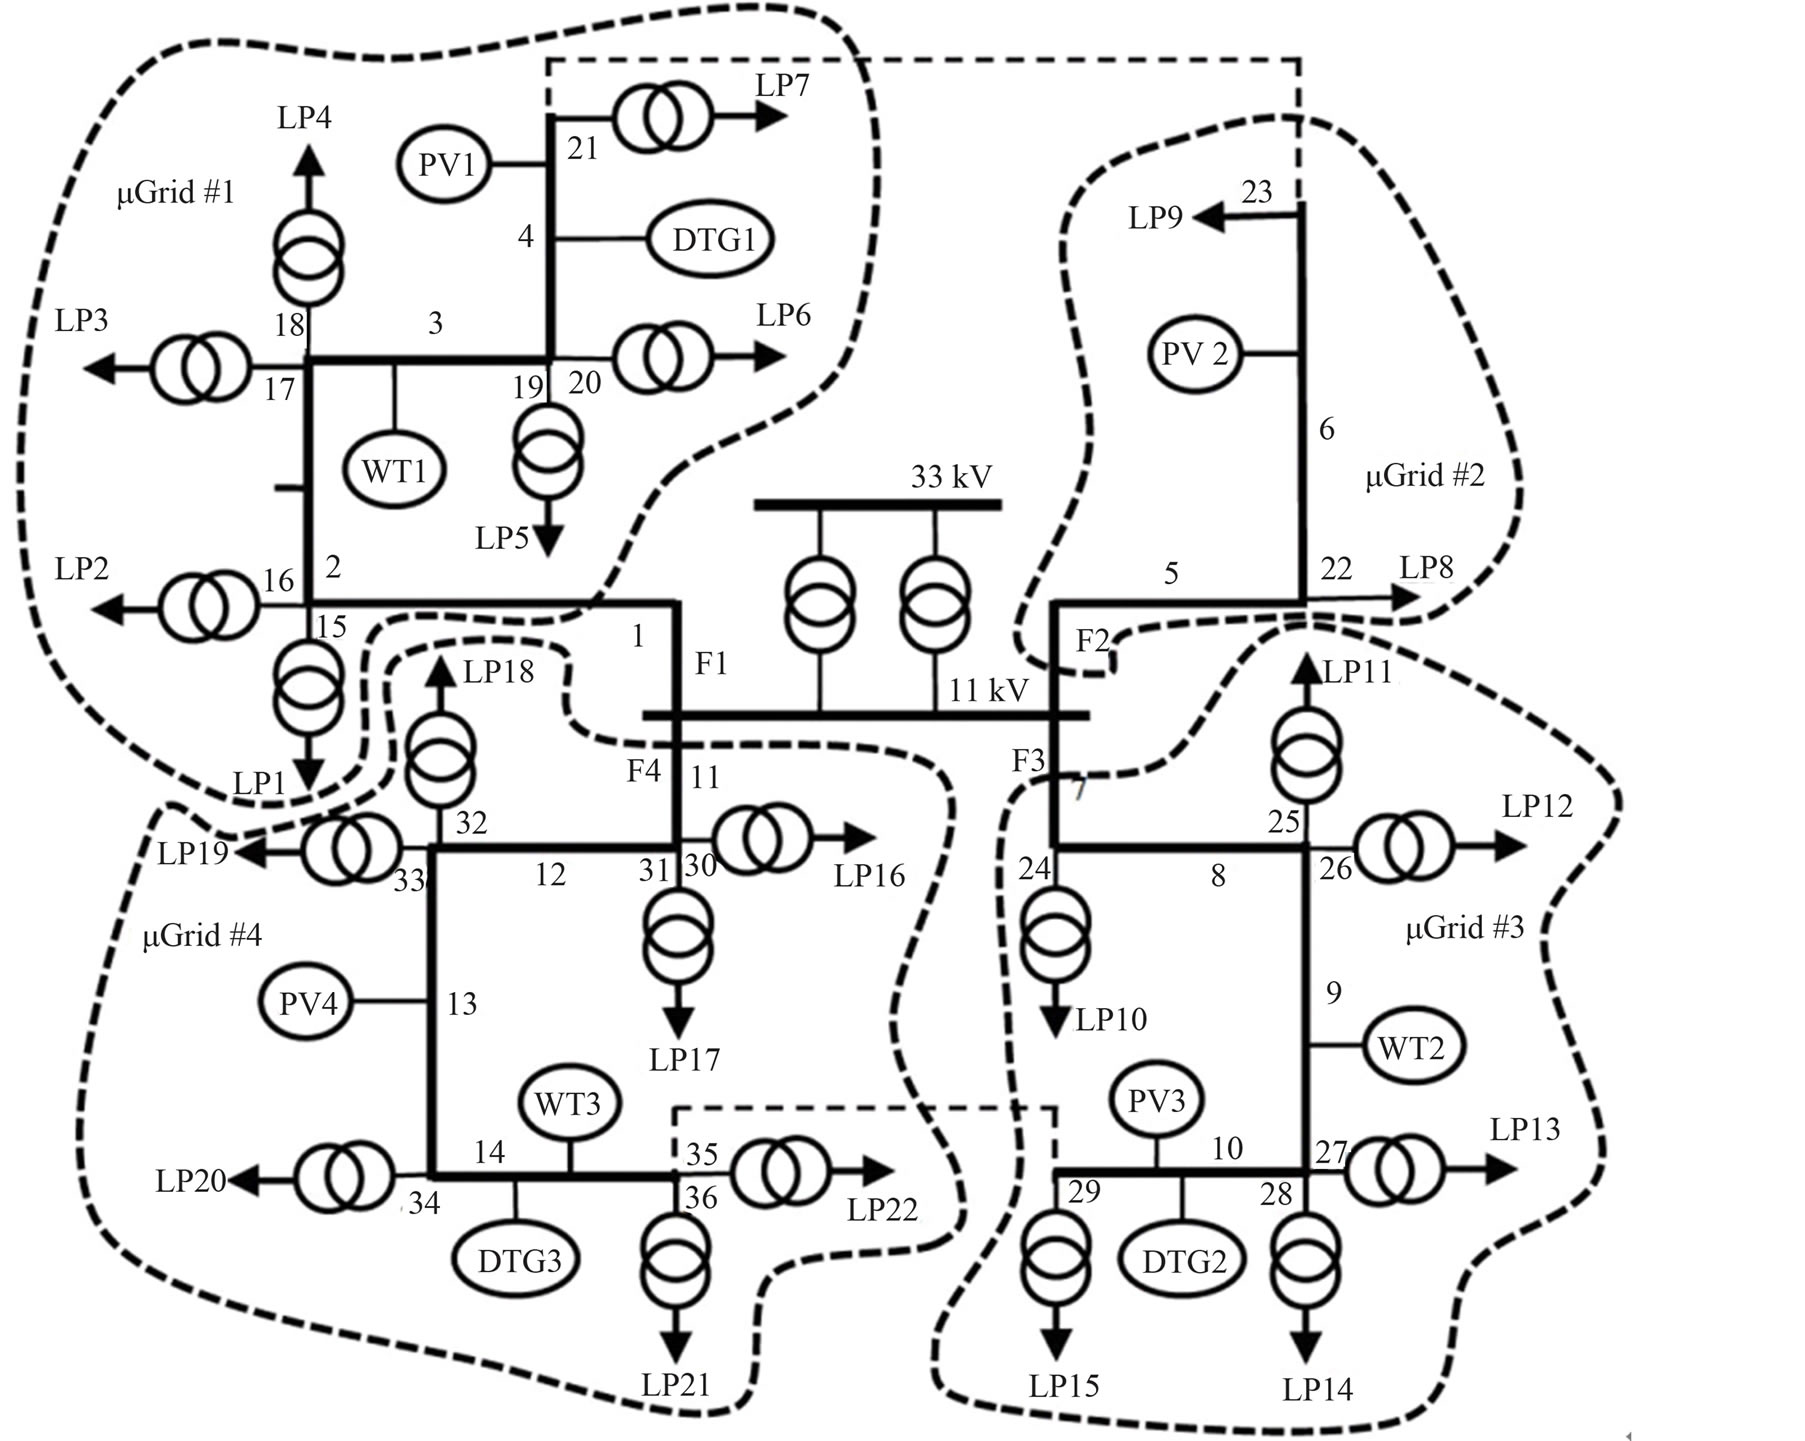
Figure 4. DistributionSystem for modified RBTS bus 2.
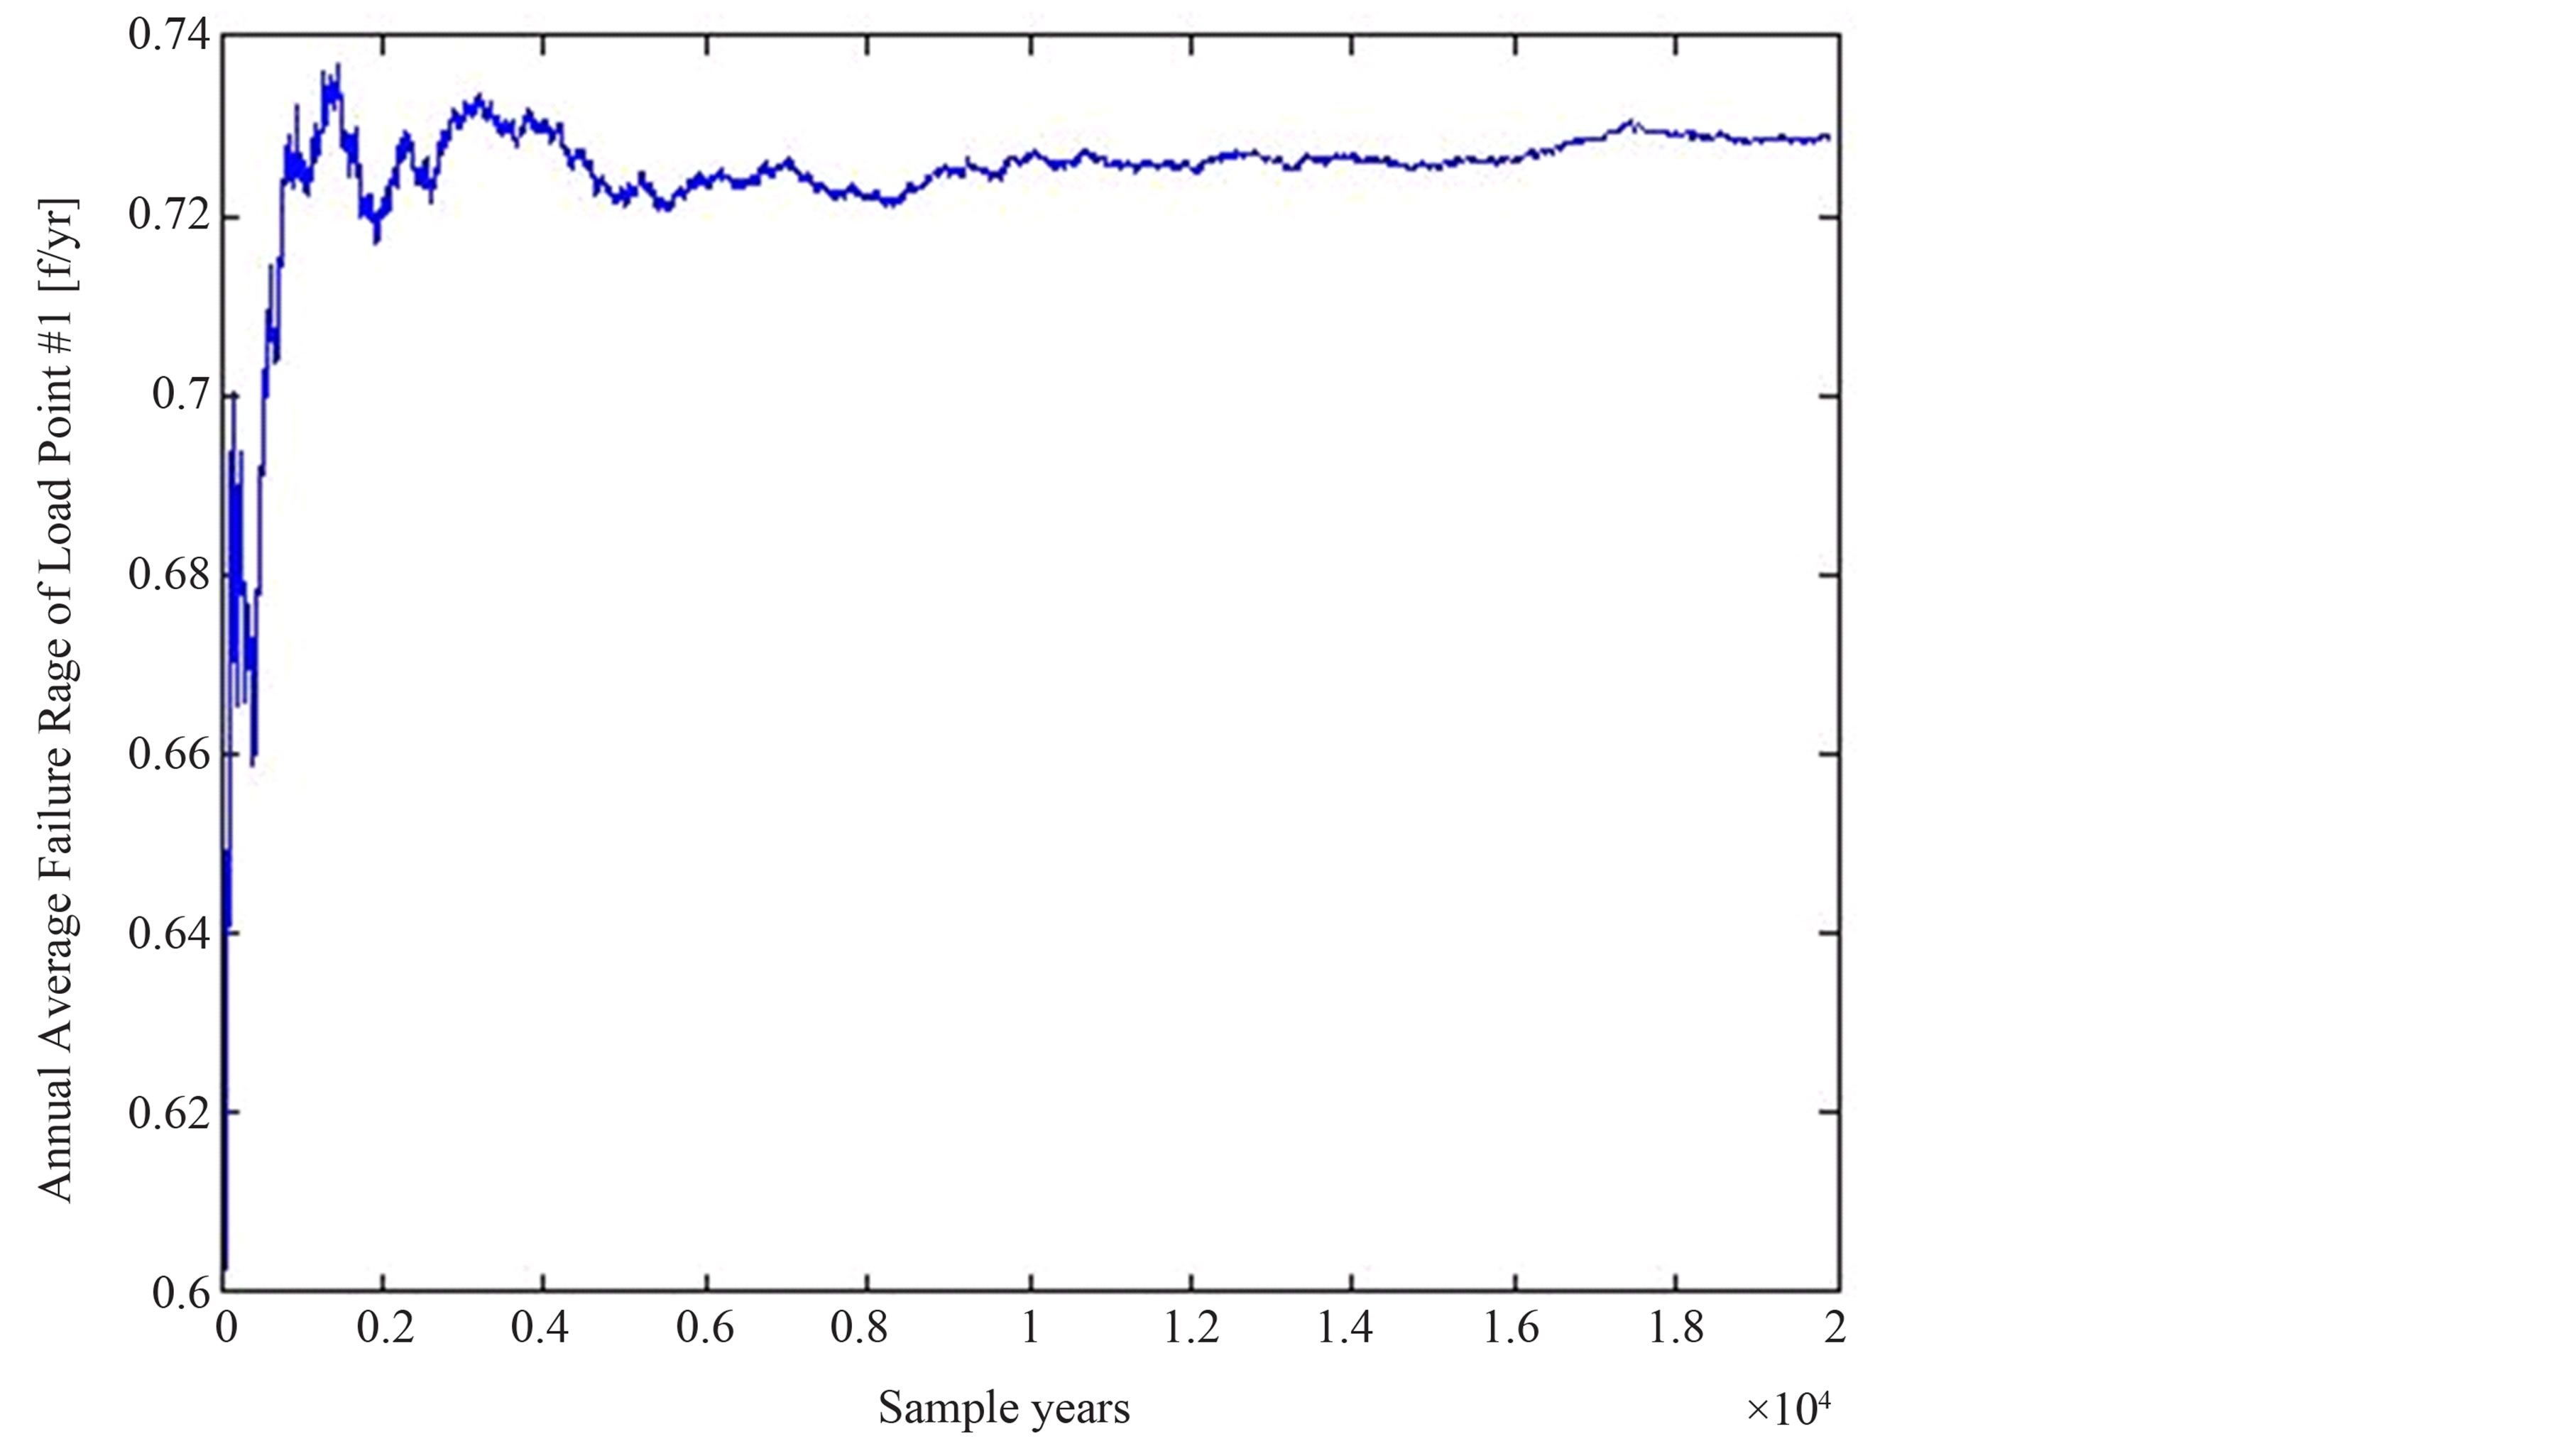
Figure 5. Annual average failure rate of load point #1.
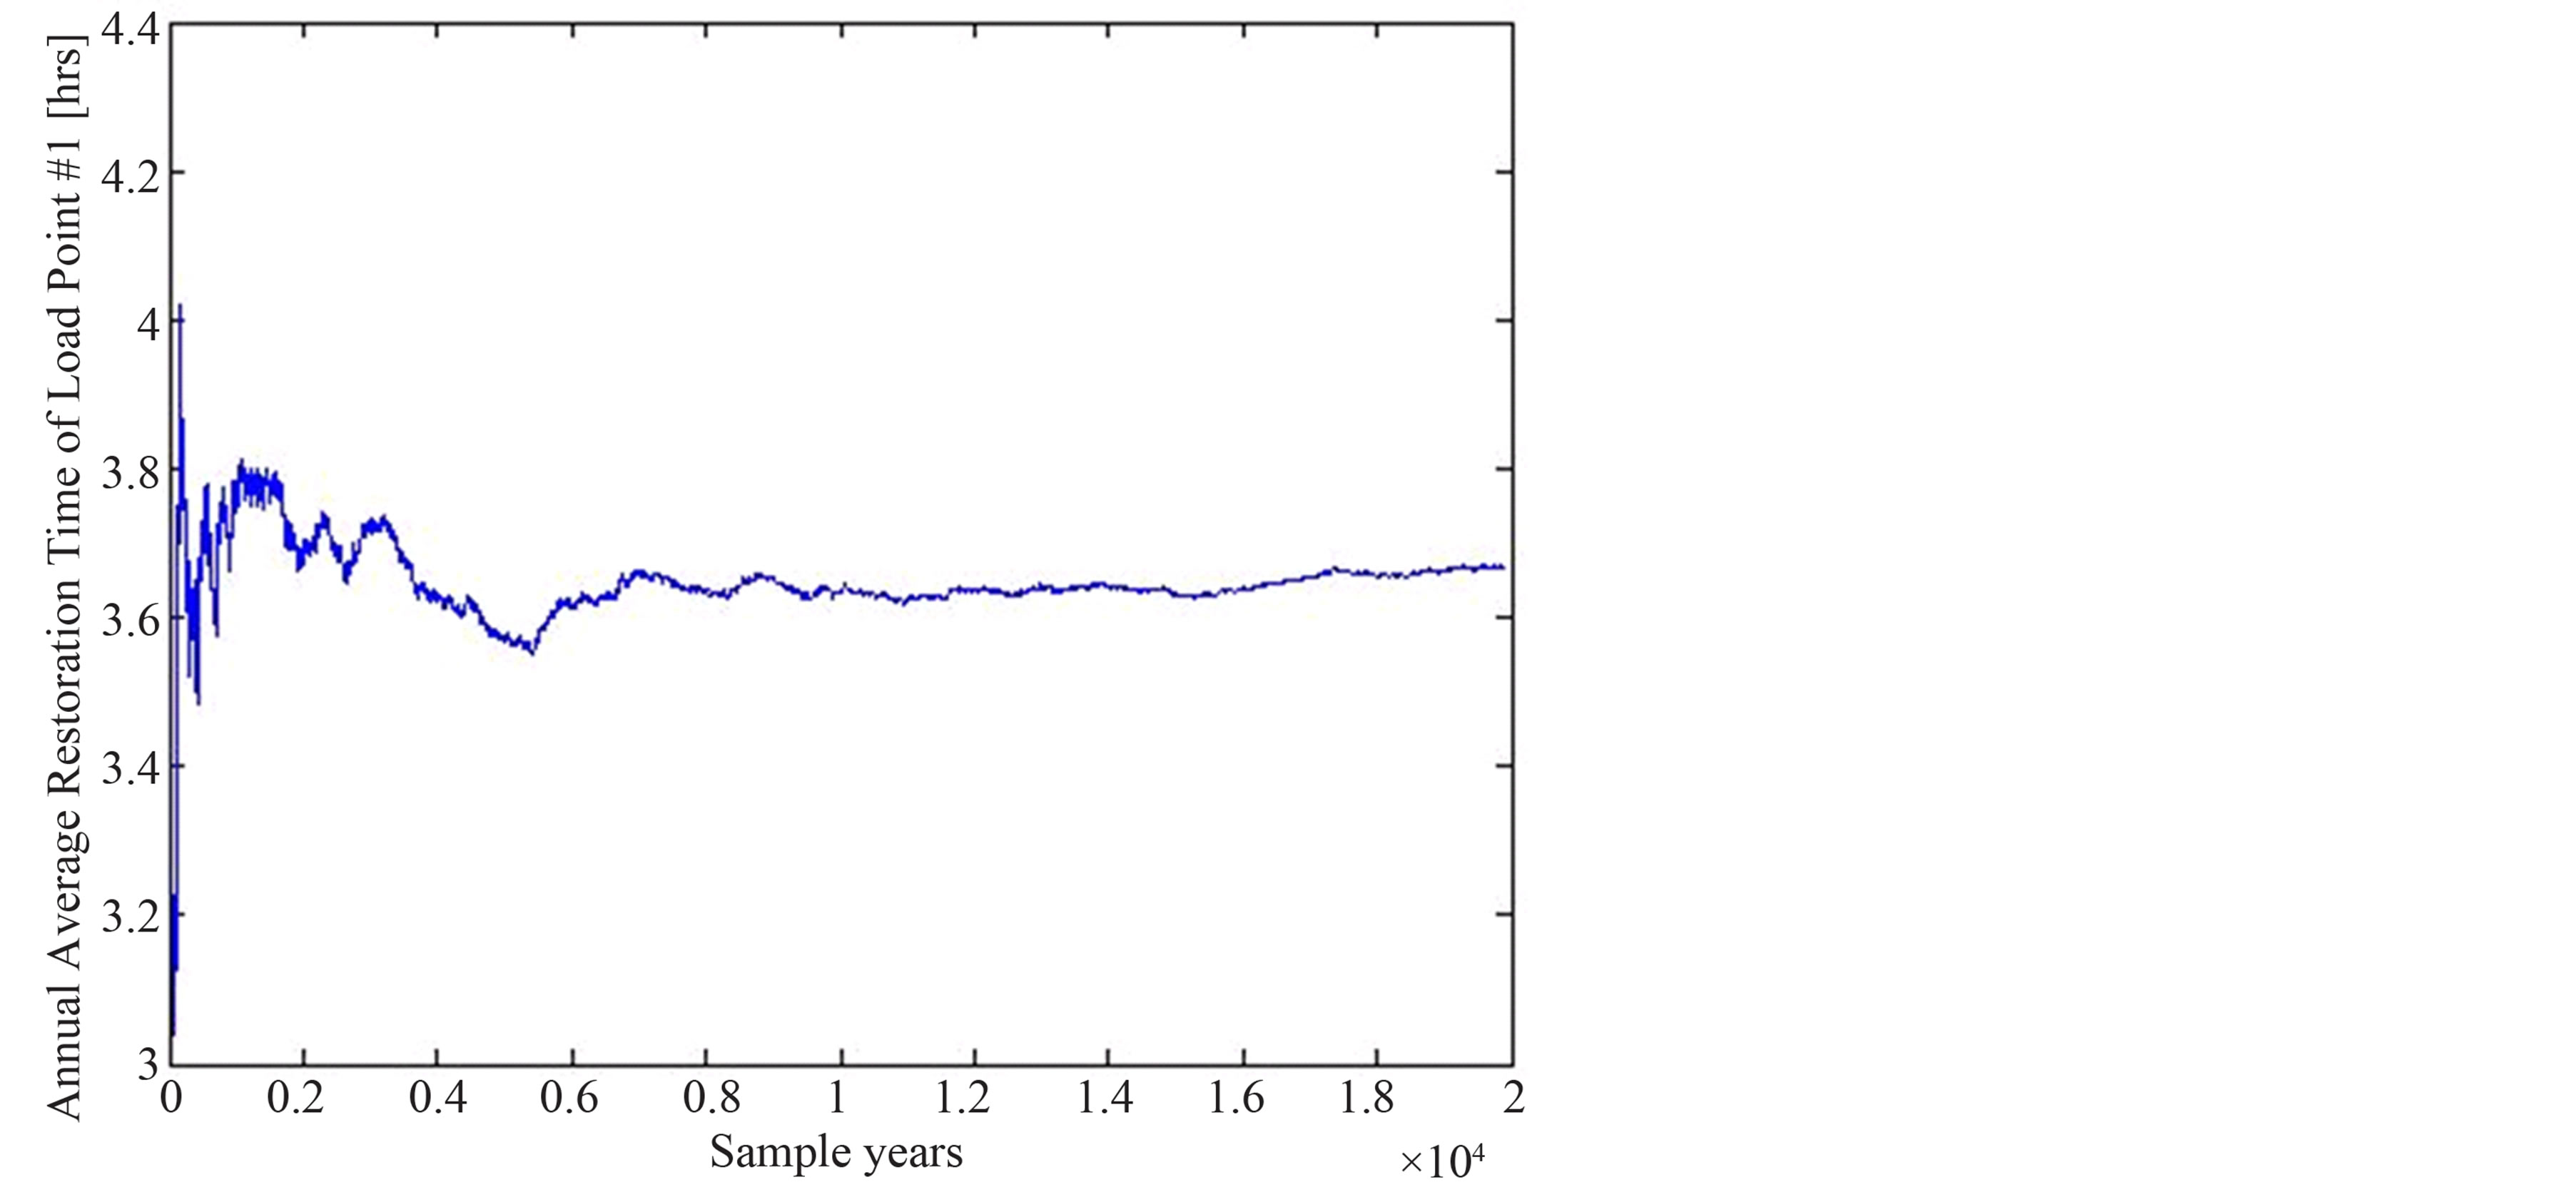
Figure 6. Annual average restoration time of load point #1.
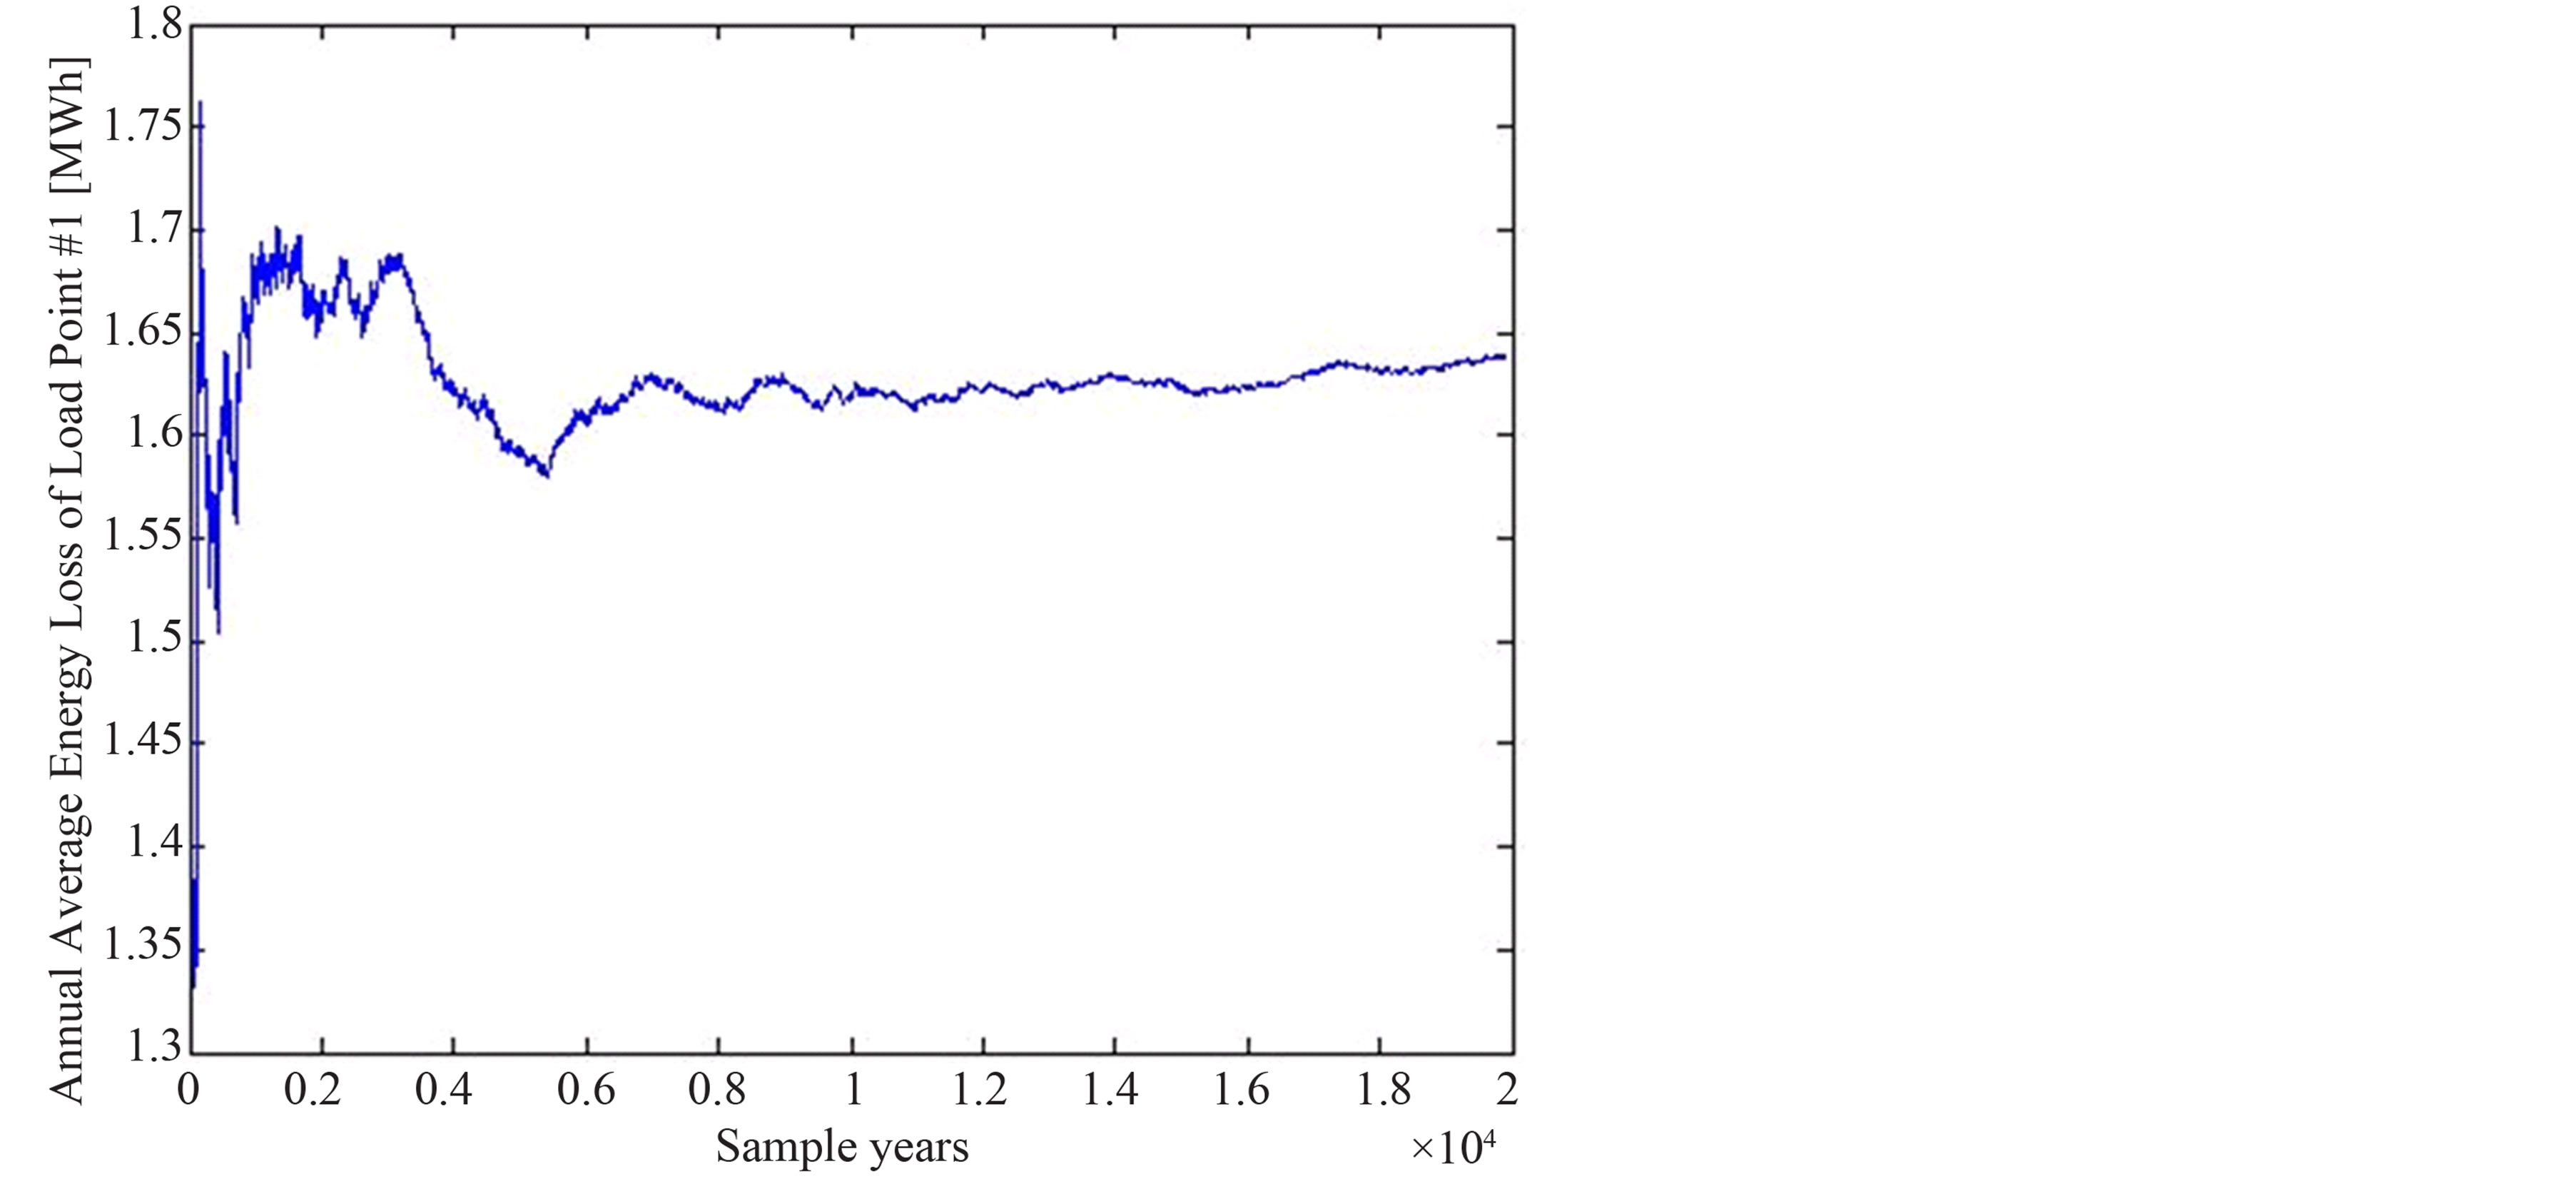
Figure 7. Average annual unsupplied energy to load point #1.
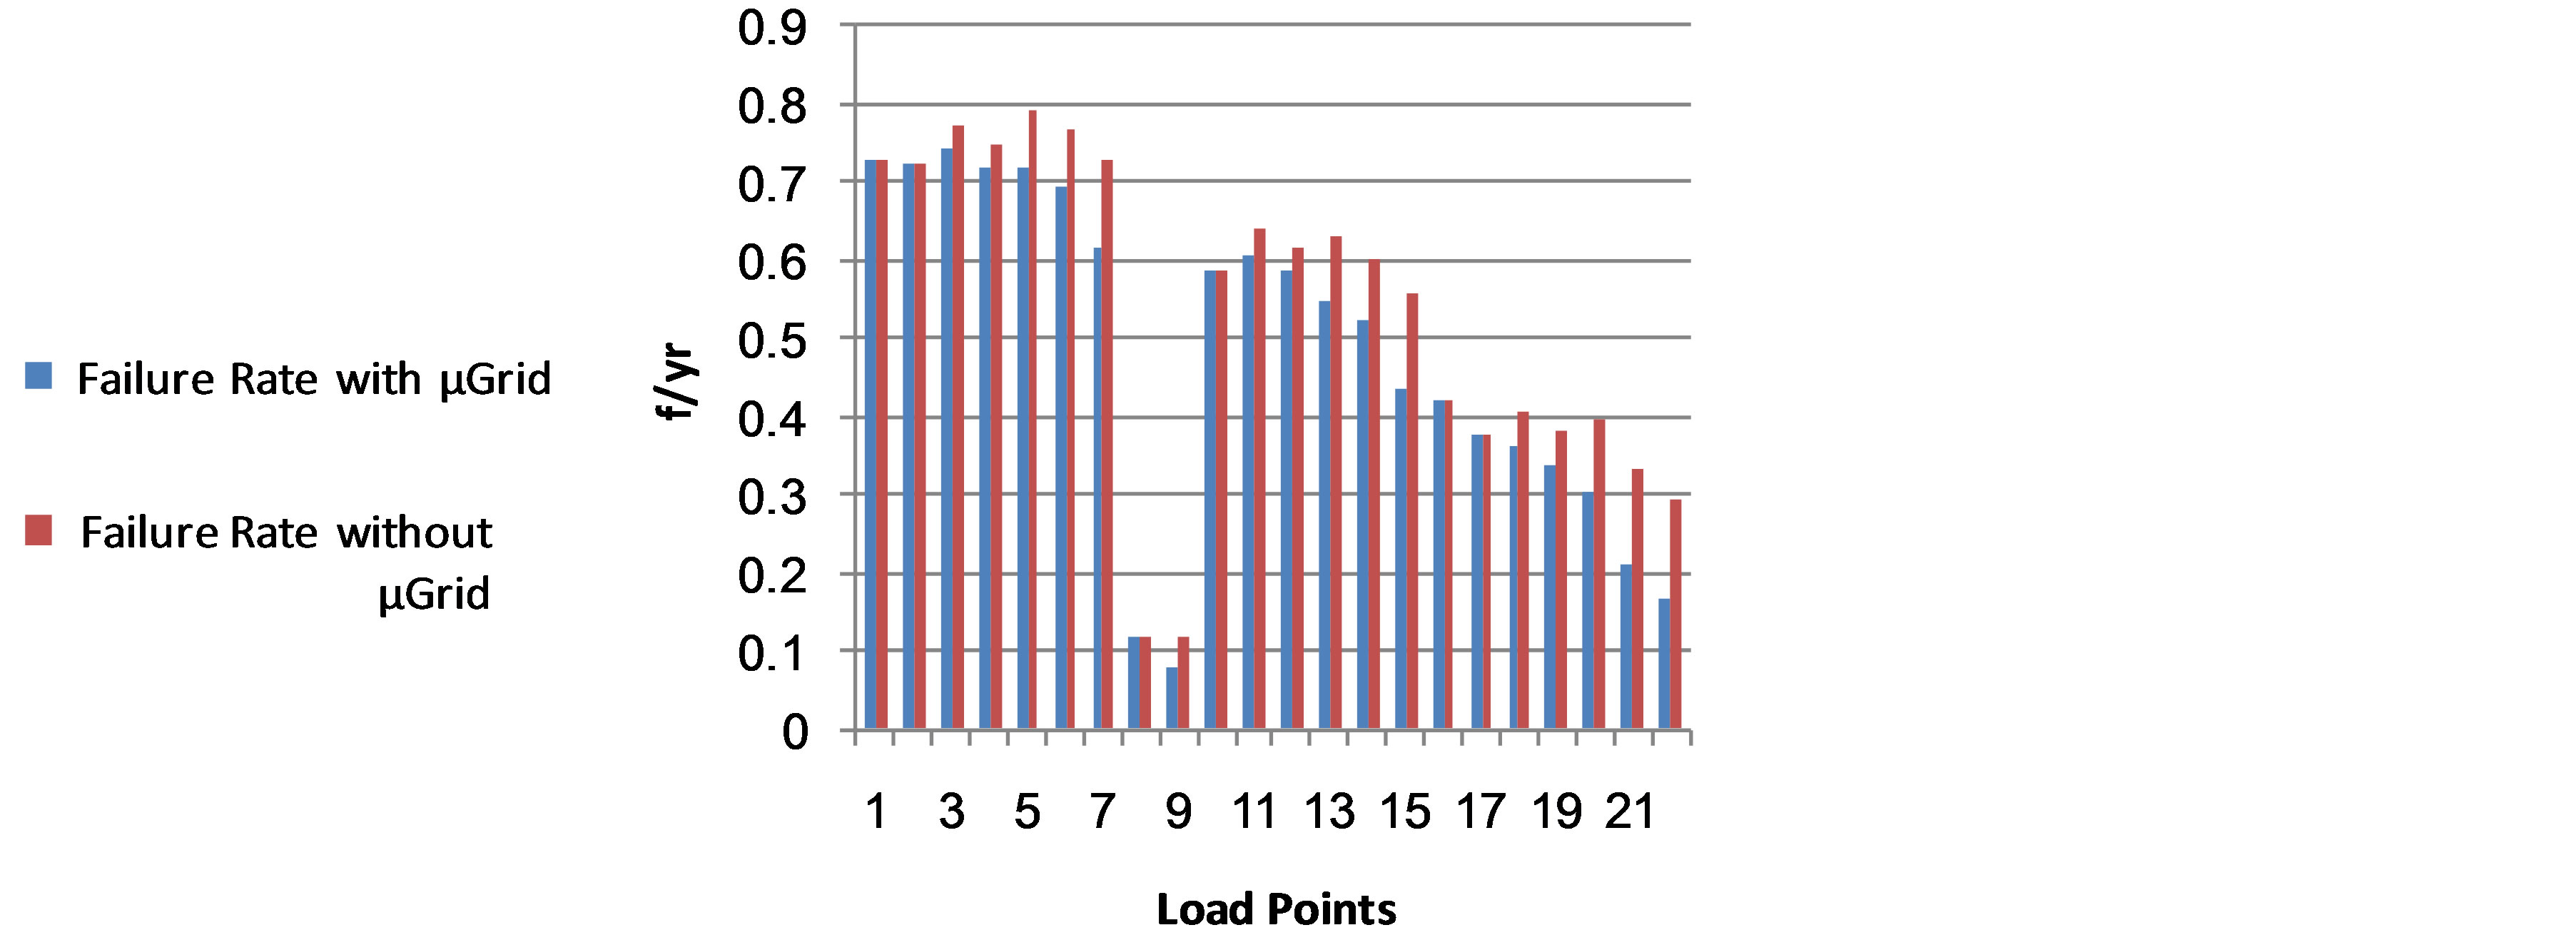
Figure 8. Annual average failure rate of all load points.
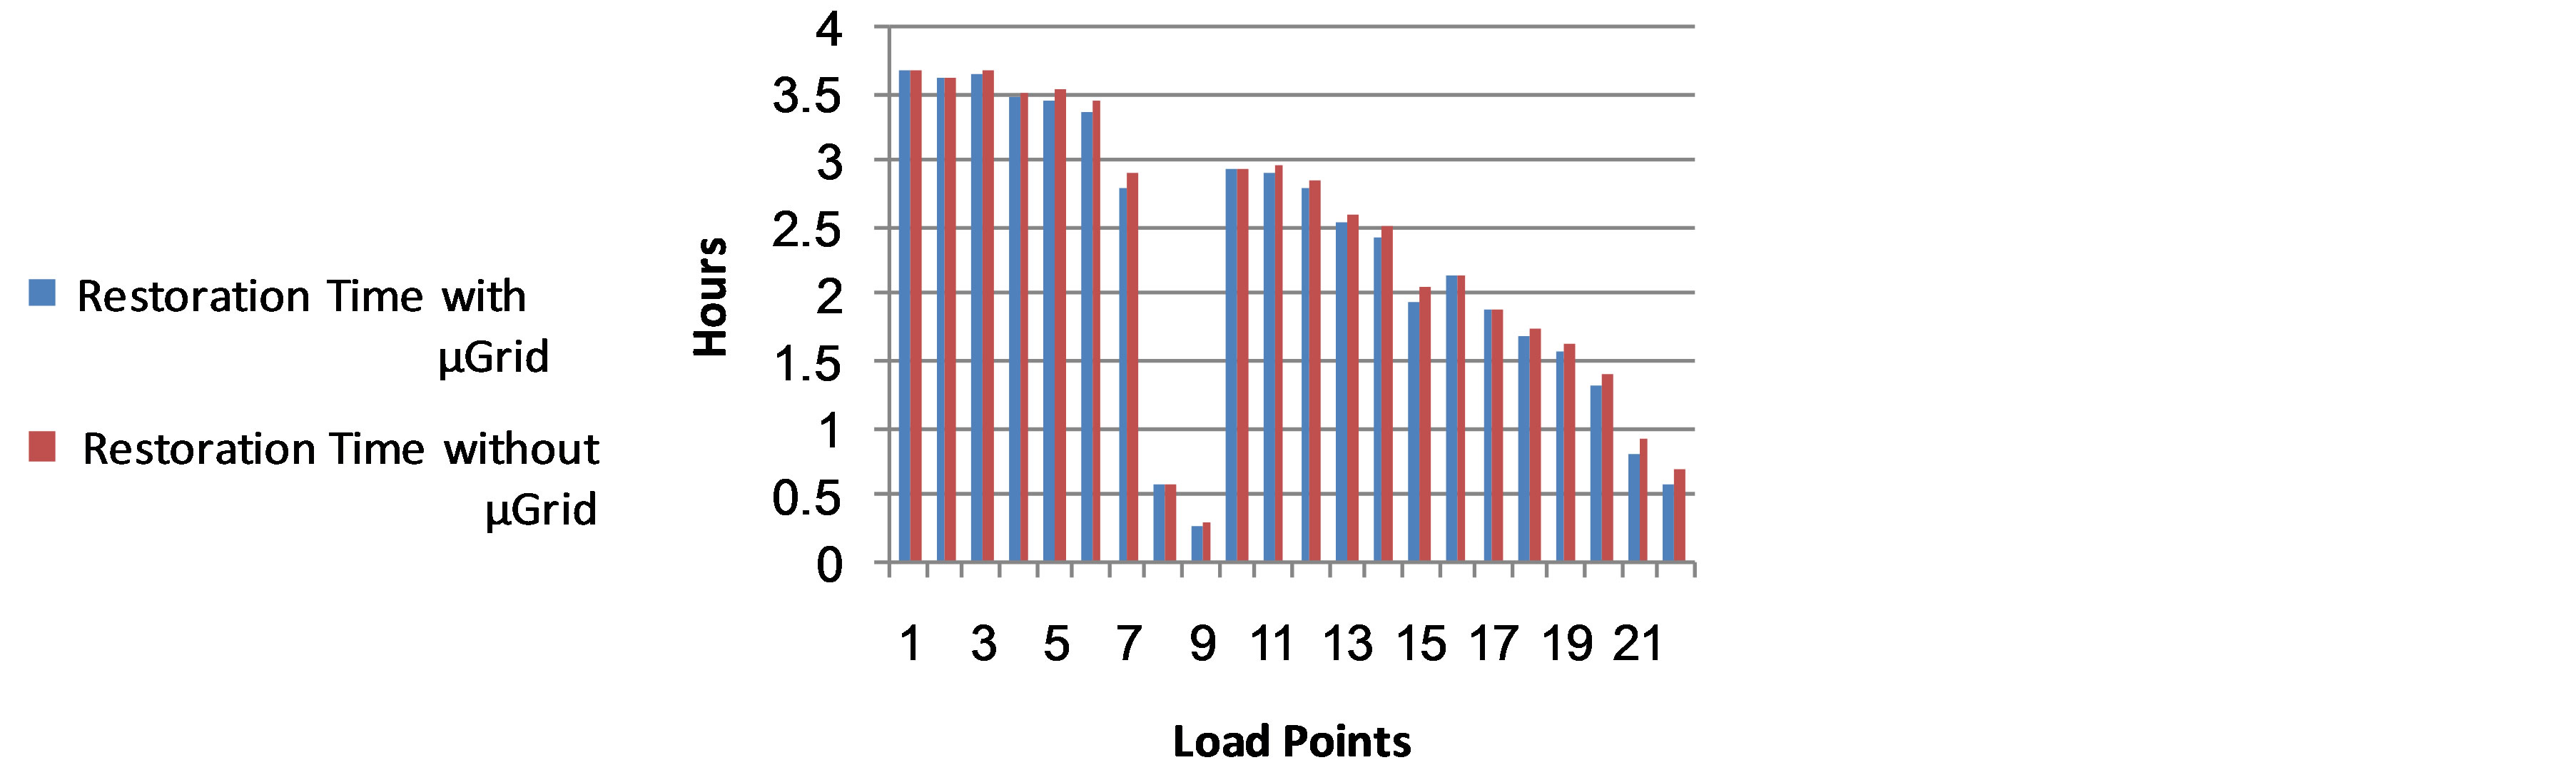
Figure 9. Annual average restoration time of all load points.
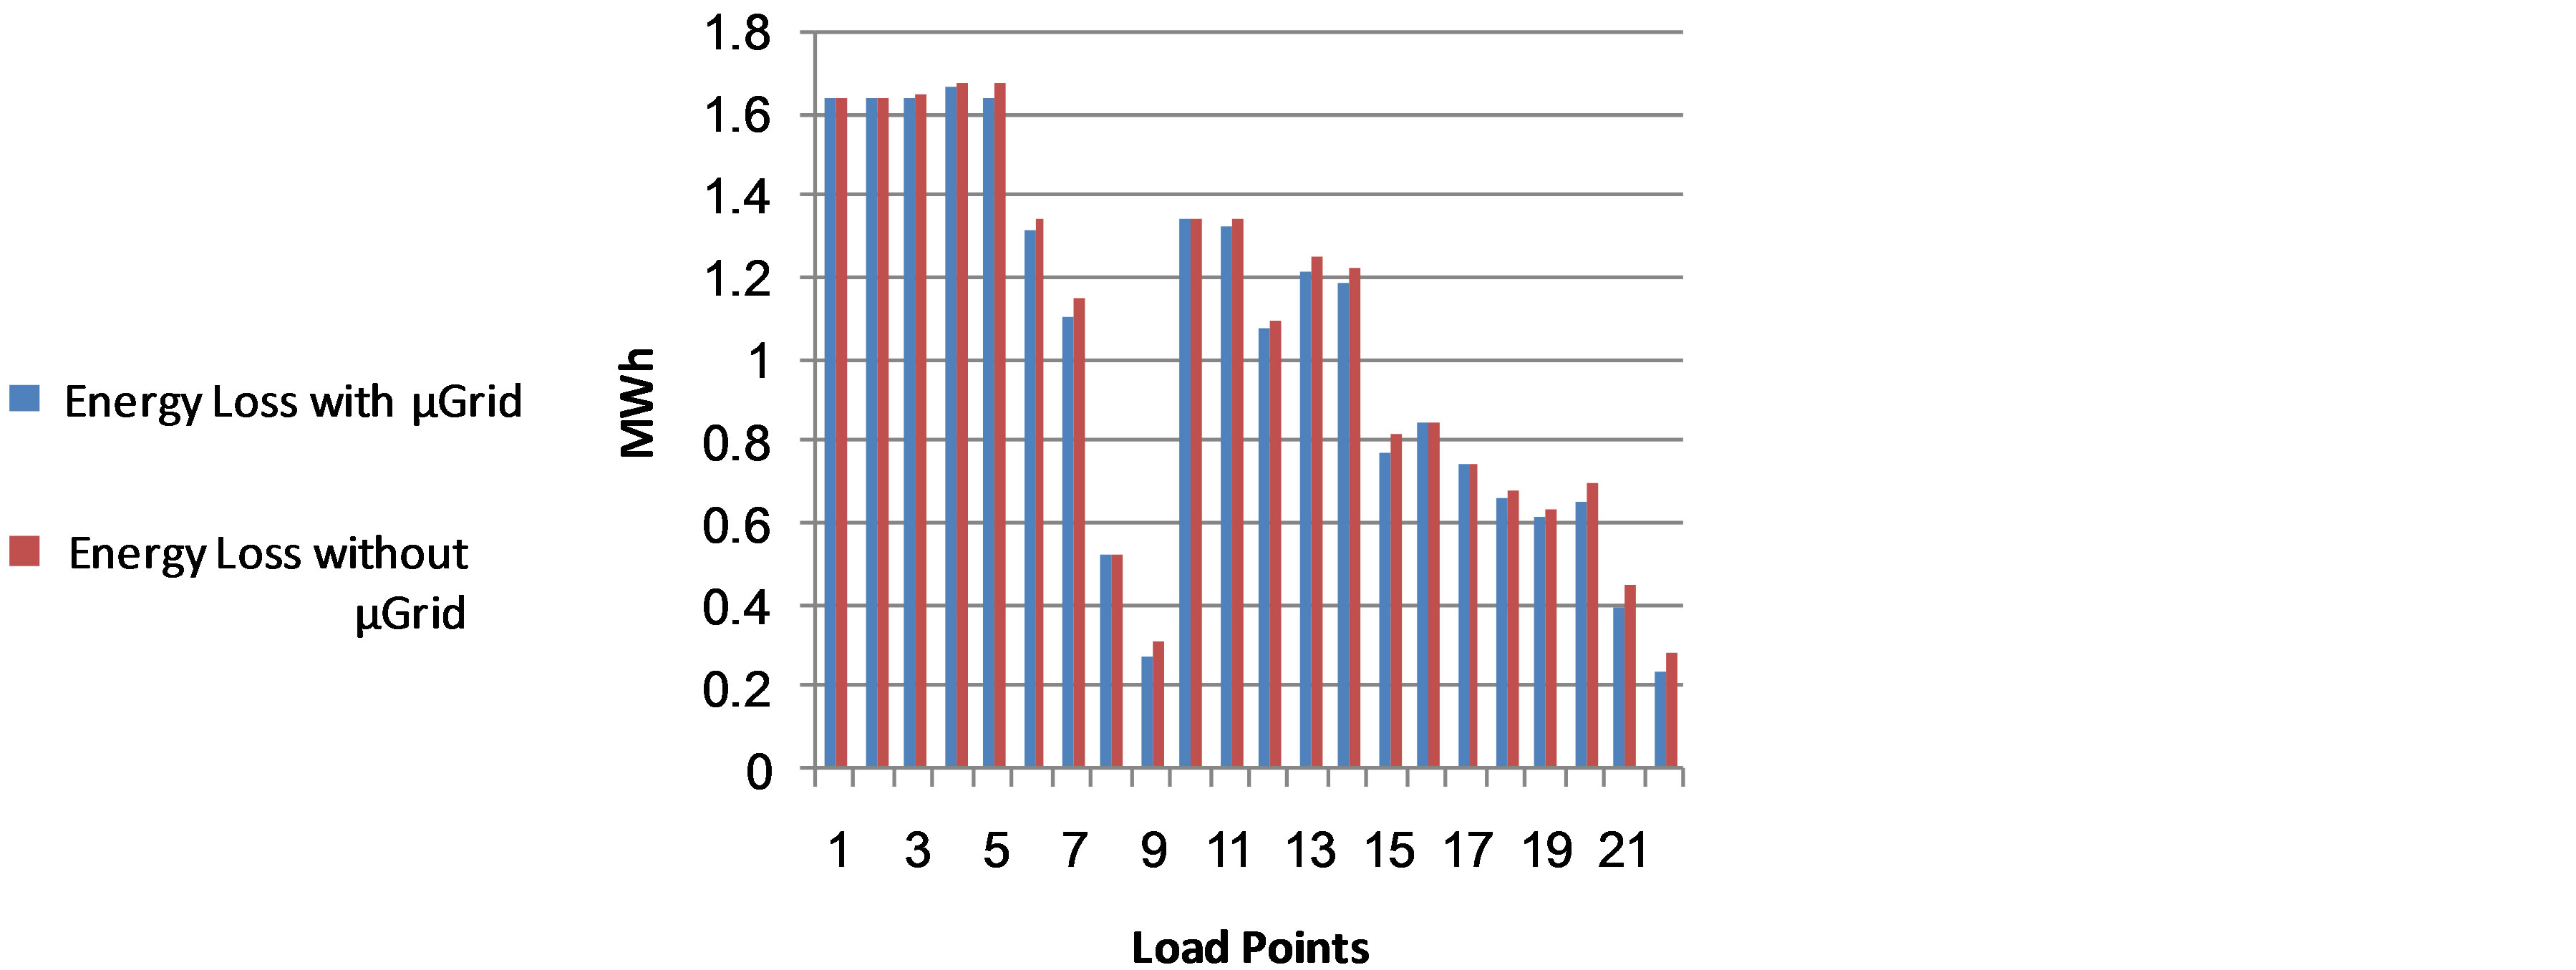
Figure 10. Annual average unsuppliedenergy to all load points.
Table 3. Reliability Indices of RBTS Bus 2.
the failure rates of loads on the short feeder (F2) are low compared to loads on the long feeders (F1, F3, F4). In RBTS Bus 2 without µ grids, it is obvious that the load points located at the end of the main feeder have high failure rates because permanent faults result in isolating these load points from the main source. On the other hand, load points located at the end of the main feeder within the µ grid have low failure rates. This reduction in failure rate in a µ grid is due to the excess generation capacity provided by the DGs and storage during the outage of the main sources. In systems with bidirectional power flows, two breakers must be coordinated to isolate the fault from both sides. Therefore, load points connected to the first section of the feeders are considered technically outside the boundary of the µ grids, Figure 8 demonstrates that there is no reduction in the average failure rate for the load points1, 2, 8, 10, 16 and 17. Average interruption time is a function of failure rates and average restoration time of network components. Therefore, all of the previous observations are applicable to Figure 9. All of the feeders in RBTS Bus 2 are connected to neighboring feeders through a normal operating point (meaning that the breakers are open in normal condition), which allows network operators to transfer the load in case of a failure on the main feeder. Transferring loads during the failure would result in less average interruption time. The average interruption time of load points located outside the boundary of the µ grid would not be affected by the DGs. In addition, the average interruption time of the load points connected to the first section of the µ grid pointes are supplied by the main grid (two breakers would open to interrupt the fault) or these load points cannot be restored when the first section failed. The average unsupplied energy of load point is a function of the average restoration time and the demand of each load point. Therefore all of the previous observations are applicable to Figure 10.
From the results, it is clear that the penetration of DGs in distribution networks can improve the reliability of distribution network by offering a backup source when the main source is not available. Hence with a total generation of 6 MW scheduled and 11 MW intermittent and a total load of 20 MW, we observe the reliability improvement as shown in Table 3. Based on Figures 8-10, we observe that reliability improvements associated in the presence of µ grids not only depends on the size of the DGs, but also on location and distribution of DGs. These results take into account random events and factors such as failures, variation in WT and PV output power and the repair time.
10. Conclusion
PV and WT stochastic models have been used to simulate the intermittency of the wind speed and solar insolation. To make the study more realistic, time varying load model have been developed. A Monte Carlo simulation has been used to evaluate reliability indices of RBTS Bus 2 with and without µ grids. The impact of islanded operation on distribution system reliability has been analyzed. The implementation of variable DGs such as PV and WT can positively influence the reliability of the system.
References
- Bae, I. and Kim, J. (2008) Reliability Evaluation of Customers in a Microgrid. IEEE Transactions on Power Systems, 23, 1416-1422. http://dx.doi.org/10.1109/TPWRS.2008.926710
- Li, Z., Xu, Q. and Li, Z. (2011) Reliability Analysis of Distributed System with DGs. 4th International Conference on Electric Utility Deregulation and Restructuring and Power Technologies (DRPT), China, 14-17.
- Atwa, Y. and El-Saadany, E. (2009) Reliability Evaluation for Distribution System with Renewable Distributed Generation during Islanded Mode of Operation. IEEE Transactions on Power Systems, 24, 572-581. http://dx.doi.org/10.1109/TPWRS.2009.2016458
- Chowdhury, A., Agarwal S. and Koval D. (2002) Reliability Modeling of Distributed Generation in Conventional Distribution System Planning and Analysis. 37th IEEE Industry Application Conference, Davenport, 13-18 October 2002, 1089-1094.
- Heydt, G. (2010) The Next Generation of Power Distribution Systems. IEEE Transactions on Smart Grid, 1, 225-235. http://dx.doi.org/10.1109/TSG.2010.2080328
- Cha, S., Jeon, D., Bea, I., Il-Ryon, L. and Kim J. (2004) Reliability Evaluation of Distribution System Connected Photovoltaic Generation Considering Weather Effects. 8th International Conference on Probabilistic Methods Applied to Power Systems, Iowa State University, Ames, 12-16 September 2004, 451-456.
- Khallat, M. and Rahman, S. (1986) A Probabilistic Approach to Photovoltaic Generator Performance Prediction. IEEE Transactions on Energy Conversion, 1, 34-40. http://dx.doi.org/10.1109/TEC.1986.4765731
- Lin, S., Han, M., Fan, R. and Hu, X. (2011) Configuration of Energy Storage System for Distribution Network with High Penetration of PV. IET Renewable Power Generation Conference (RPG 2011), Edinburgh, September 2011, 1-6.
- Liang, H.S., Su, J. and Liu, S.G. (2010) Reliability Evaluation of Distribution System Containing Microgrid. China International Conference of Electricity Distribution (CICED), China, September 2010, 1-6.
- Giorestto, P. and Utsurgoi, K. (1983) Development of a New Procedure for Reliability Modeling of Wind Turbine Generators. IEEE Transactions on Power Apparatus and Systems, 102, 134-143. http://dx.doi.org/10.1109/TPAS.1983.318006
- Jangamehetti, S. and Rau, V. (2001) Optimum Sitting of Wind Turbine Generators. IEEE Transactions on Energy Conversion, 16, 8-13. http://dx.doi.org/10.1109/60.911396
- Liu, S.G., Zhou, X.X., Fan, M.T. and Zhang, Z.P. (2006) Probabilistic Power Flow Calculation Using Sigma-Point Transform Algorithm. International Conference on Power System Technology, Chongqing, 22-26 October 2006, 1-5.
- Wu, Y.-C. and Chang, W.-F. (2002) Run-Time Reduction in Schur Complement Method Based Transmission Constrained Dispatch for Monte Carlo Production Cost. International Conference on Power System Technology, Kunming, 13-17 October 2002, 204-210.
- Billinton, R. and Wang, P. (1999) Teaching Distribution System Reliability Evaluation Using Monte Carlo Simulation. IEEE Transactions on Power Systems, 14, 397-403. http://dx.doi.org/10.1109/59.761856
- Talari, S. and Haghifam, M.R. (2013) The Impact of Load and Distributed Energy Resources Management on Microgrid Reliability. 22nd International Conference on Electricity Distribution, Stockholm, 10-13 June 2013.
- Qiao, L. (2013) A Summary of Optimal Methods for the Planning of Stand-Alone Microgrid System. Energy and Power Engineering, 5, 992-998. http://dx.doi.org/10.4236/epe.2013.54B190
- Abul’Wafa, A.R. (2011) Reliability/Cost Evaluation of a Wind Power Delivery System. Electric Power Systems Research, 81, 873-879. http://dx.doi.org/10.1016/j.epsr.2010.11.028
- Li, J., Zhang, B., Wang, J., Mao, C., Liu, Y., Wang, K., Duan, Y., Zheng, X. and Wan, L. (2010) Steady Security Risk Assessment Considering Uncertainties of Wind Power and Fault in Smart Grid. International Conference on Modeling, Identification and Control, Okayama, July 2010, 600-605.
- http://www.puc.texas.gov/
- Allan, R.N., Billinton, R., Sjarief, I., Goel, L. and So, K.S. (1991) A Reliability Test System for Educational Purposes Basic Distribution System Data and Results. IEEE Transactions on Power Systems, 6, 813-820. http://dx.doi.org/10.1109/59.76730
- Billinton, R. and Allan, R. (1996) Reliability Evaluation of Power Systems. Longmans, London Press, New York.