Smart Grid and Renewable Energy
Vol.5 No.2(2014), Article ID:42763,12 pages DOI:10.4236/sgre.2014.52004
Solar Energy Generation Using Agriculture Cultivated Lands
1Gujarat Energy Research and Management Institute, Gandhinagar, India; 2Medha College of Engineering, Bibinagar, India.
Email: harinarayana@germi.res.in, *srivasavi.kv@gmail.com
Copyright © 2014 T. Harinarayana, K. Sri Venkata Vasavi. This is an open access article distributed under the Creative Commons Attribution License, which permits unrestricted use, distribution, and reproduction in any medium, provided the original work is properly cited. In accordance of the Creative Commons Attribution License all Copyrights © 2014 are reserved for SCIRP and the owner of the intellectual property T. Harinarayana, K. Sri Venkata Vasavi. All Copyright © 2014 are guarded by law and by SCIRP as a guardian.
Received December 6th, 2013; revised January 6th, 2014; accepted January 13th, 2014
KEYWORDS
Energy; Shade; Farmer; Cultivation; Cities; Land
ABSTRACT
Generation of electricity using solar PV is picking up in India in a big way in recent years. It needs a clear direction such that it can optimally be utilized and the benefits, without being concentrated in a few locations, can reach the majority of poor population as well. Indian farmers, for the last few decades are affected in terms of availability of electrical power. The present study suggests the use of fertile and cultivated land with about 5 m elevated structure with solar panels. It creates shade on the crops. In the present study, the shade effect on the crops below the structure has been examined systematically through modeling studies. Different solar panel design configurations are suggested such that the crops or plants below, on the ground surface, can also be grown without any reduction in their yield. The effect of the elevated structure on the neighboring lands is also examined. It is shown that the present concept can easily be implemented in India, perhaps in the world, at all the locations such that power can be generated using farmer’s own land for his own benefit, perhaps with some profit to him. The present concept, if implemented, also reduces the huge cost involved in establishing the network of transmission and distribution lines.
1. Introduction
Among different forms of renewable energy, solar PV is growing at a very high rate of 30% - 40%. During 2006, the world annual solar PV production is close to 2 GW with 5 times increase in 2009 crossing 10 GW. The availability of free natural resource with matured technology, long term reliability are some of the factors why many countries have decided to go in a big way with major targets in the years to come [1,2]. For example, China is planning to generate 40 GW of electricity by 2015, while India just crossed 1 GW mark recently during 2013 with an aim to reach 20 GW grid connected and 2 GW off grid by the year 2022 [3,4]. If India decides to grow 9% GDP for the next 20 years, then the electrical power needs to be increased from the present generation of 212 GW to 1207 GW by the year 2031. This is nearly 5.7 times more electricity of present day generation. Out of 212 GW, 140 GW is coming from non-renewable energy resources, close to 69% and 65 GW is being produced from renewable resources, close to 31%. The renewable sources include hydro-power (40 GW), smallhydro (3.7 GW), bio-mass (1.26 GW), wind (19.8 GW), PV-solar (1.98 GW) [2]. In order to reach the target of 1207 GW of power by the year 2031, one needs to generate 838 GW from non-renewable sources and 371 GW from renewable sources. This is based on simple arithmetic of multiplication of all the power generation through different fuels by 5.7. This type of model demands huge amount of hydrocarbons including coal to be imported from other countries. It makes India always depend on other countries for energy needs. Thus this is not a smart solution.
In recent years, a few countries have taken a strong decision to generate their total energy demand only from renewable energy resources. For example, Scotland and Philippines are making concerted plans to meet their energy demand (above 50,000 MW) from renewable energy alone by the year 2020 [5,6]. Similarly Nigeria is planning in a big way to use the renewable energy [7]. In the direction of 100% renewable energy generation, India can generate large amount of solar PV power. With an assumption that 5 acres of land can produce approximately 1 MW of electricity, the total Indian land area can produce 32,499 GW of electricity. This means about 1/27th of the Indian land mass can generate our 2031 target of 1207 GW of electricity. This demands about 6 million acres of free land for placing the solar panels. This much free/waste land does not exist. In view of this, one needs to device innovative ways to use the existing land in a more effective way.
In this direction a couple of new ideas have been recently published [8,9]. One of the new concept [8] is based on the solar panels placed one above the other at a fixed height of about 3 m depending upon the dimensions of the solar panels. This way the area necessary for a single layer solar panel to generate, say X amount of energy, can generate 1.7X amount of energy using the same area. The roof-tops and various buildings and houses in the cities and towns can effectively and more economically be used from this concept. In another innovative idea, the concept of using the national road way network across India is suggested. In this research paper [9], through modeling studies, the use of national high way along Ahmadabad-Rajkot and also along Ahmedabad-Vadodara has been demonstrated.
In the present paper, another concept is introduced. As on today solar parks, solar farms, have been planned to establish at different locations where the land is un-used or barren. Due to increase in population, the availability of such land is only 6% (97 million acres). Additionally, such type of land is located far away from major cities, towns, industrial locations etc. This demands creation of long transmission lines from solar parks. Even if we create such large infrastructure, the use of power is concentrated towards industries and cities. In India most of the population lives in villages, far away from major cities and towns. Their main livelihood is through cultivation. This way most of our Indian farmers have been suffering from lack of electricity. This scenario has been continuing for the last several decades and little has been changed to improve the situation. The new concept discussed in this paper will provide one time solution that greatly helps the farmer in the villages on one hand and saving large expenditure on the development of huge infrastructure to the government on the other side. Our study is based on the use of fertile land. In this concept, the key issues involved in implementation are discussed and a road map is provided to increase energy generation and also to make the farmer community with comfort.
2. Methodology
The present study is carried out using PV-Syst software [10]. Details of the software program used in our study have been discussed in the previous papers [8,9]. In all the modeling studies, we have taken 1 acre (4047 sq m, nearly 63 × 63 m) of land in square shape as one unit. The schematic diagram shown in Figure 1 explains the configuration followed in the present study.
In our study the main theme is to estimate the effect of the shade on the crops at the ground surface due to the solar panels above the ground. The solar panels are placed on an elevated structure at 5 m above the ground. As it is well known to all that sunlight is the main source for good growth and health of all the plant life. For this purpose, different types of configuration are analyzed systematically through modeling studies and recommend a design for solar panels such that it has minimum effect on crops. Similar study has been carried out for green house cultivation [11,12]. Before explaining each case, the basic configuration of a typical case is described below.
Case 1: This is a typical case. In this case 36 solar panels are arranged in a row along 63 m with zero inclination (horizontal) with a total of 1944 solar panels covering one acre of land. There are 18 rows lie adjacent to the other along 63 m length wise. Each row contains a set of 3 solar panels. Such type of configuration helps to estimate the possible total potential of solar energy generation in any area (Figure 1). This configuration is fixed
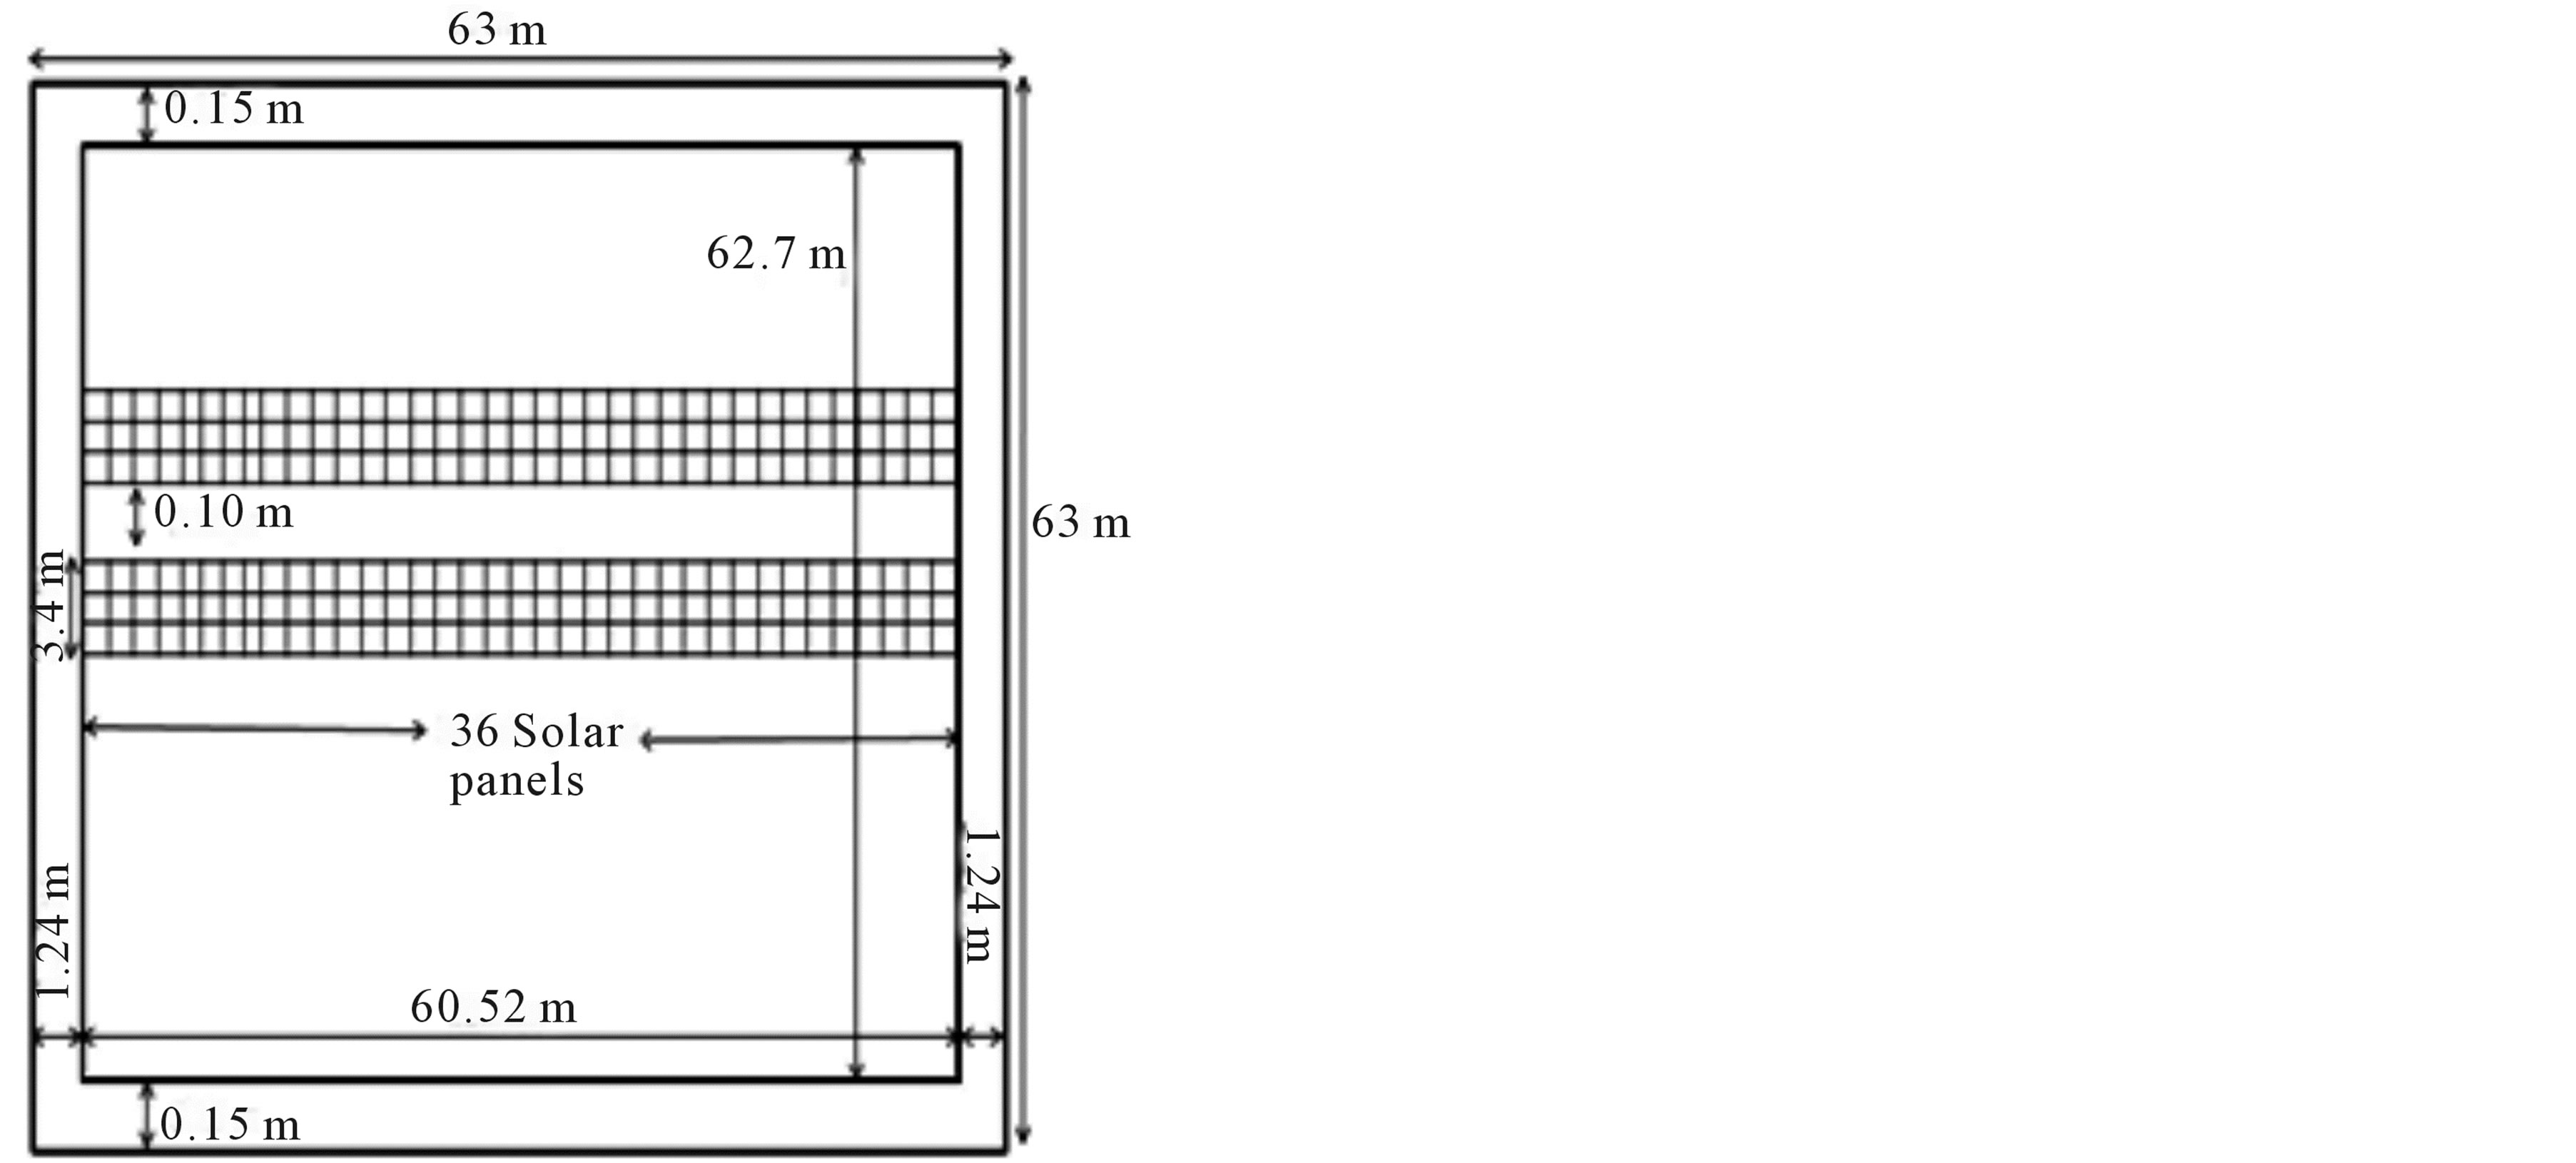
Figure 1. Typical field design of solar panels in one acre of land.
and the modeling is carried out for one acre of land in various locations. Initially, major cities are considered. Later the study has also been carried out by varying the latitude.
Firstly, the configuration in cities is described. The important parameters related to Ahmedabad City have been tabulated in Table 1.
For this purpose, parameters like latitude, longitude, average global irradiation, average temperature etc. for major cities are identified. The PV module parameters assumed for all the cities in all the cases are same and the details are described in Table 2.
The major cities considered in our study are Mumbai, Ahmedabad, New Delhi, Bangalore, Chennai, Hyderabad, Gowhati and Kolkata covering Maharashtra, Gujarat, Delhi, Karnataka, Tamil Nadu, Andhra Pradesh, Assam and West Bengal states respectively. As explained before, in our modeling one acre of land with solar panels distributed on the ground horizontally in flat condition is considered. Other parameters for different cities are tabulated in Table 3.
As mentioned before, the number solar panels placed in one acre of land in all the cities are fixed at 1944. Results are presented in the next section.
In a similar way, a study has also been made on the variation of solar energy generation with latitude. The first location chosen is the southernmost location of India—Kanyakumari—with 8.08˚N latitude, 77.57˚E longitude and 3 m altitude. The data of latitude, longitude and altitude for different locations are taken from google earth pro. ver. 7.0 [13]. We have computed the energy generation again restricting the area to 1 acre of land keeping all the solar panels in flat horizontal condition (Figure 2(a)) with fixed number of 1944 panels. By fixing the longitude as 77.57˚E and for every two degrees of latitude, the solar energy generation has been computed. This way, we have considered latitudes 8.08, 10, 12, 14, 16, 18, 20, 22, 24, 26, 28, 30 and 32 degrees. The station names given are L8, L10 etc. and other parameters are as shown in Table 4.
As explained earlier, in all our modeling studies the unit of land area considered is one acre. The different parameters for modeling are shown in Tables 1 and 2. More detailed analysis is made for allocation of one acre of land chosen in Ahmedabad in Gujarat, India. The average global solar radiation data considered for all the cities and different places of India is to compute the effect of shades during the years 1983-1993 [14]. Based on the dimension of the solar panels and tilt, the number of panels in one acre of land will vary. The parameter of
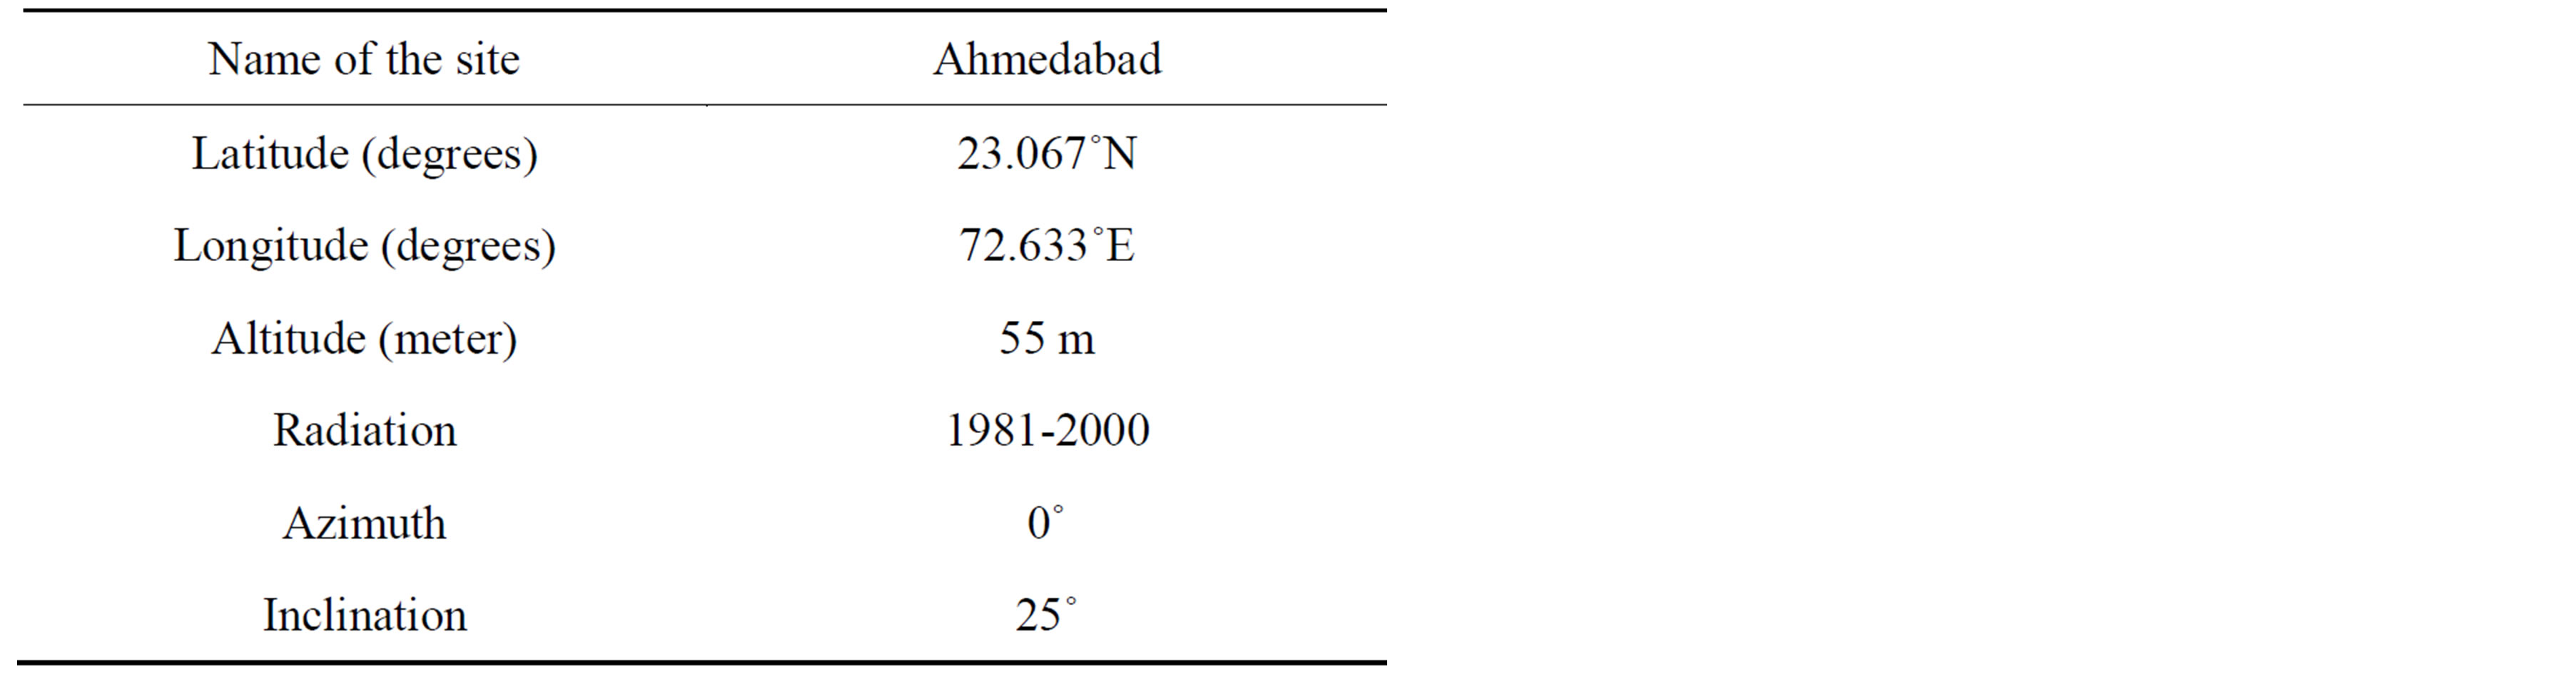
Table 1. Parameters of ahmedabad.
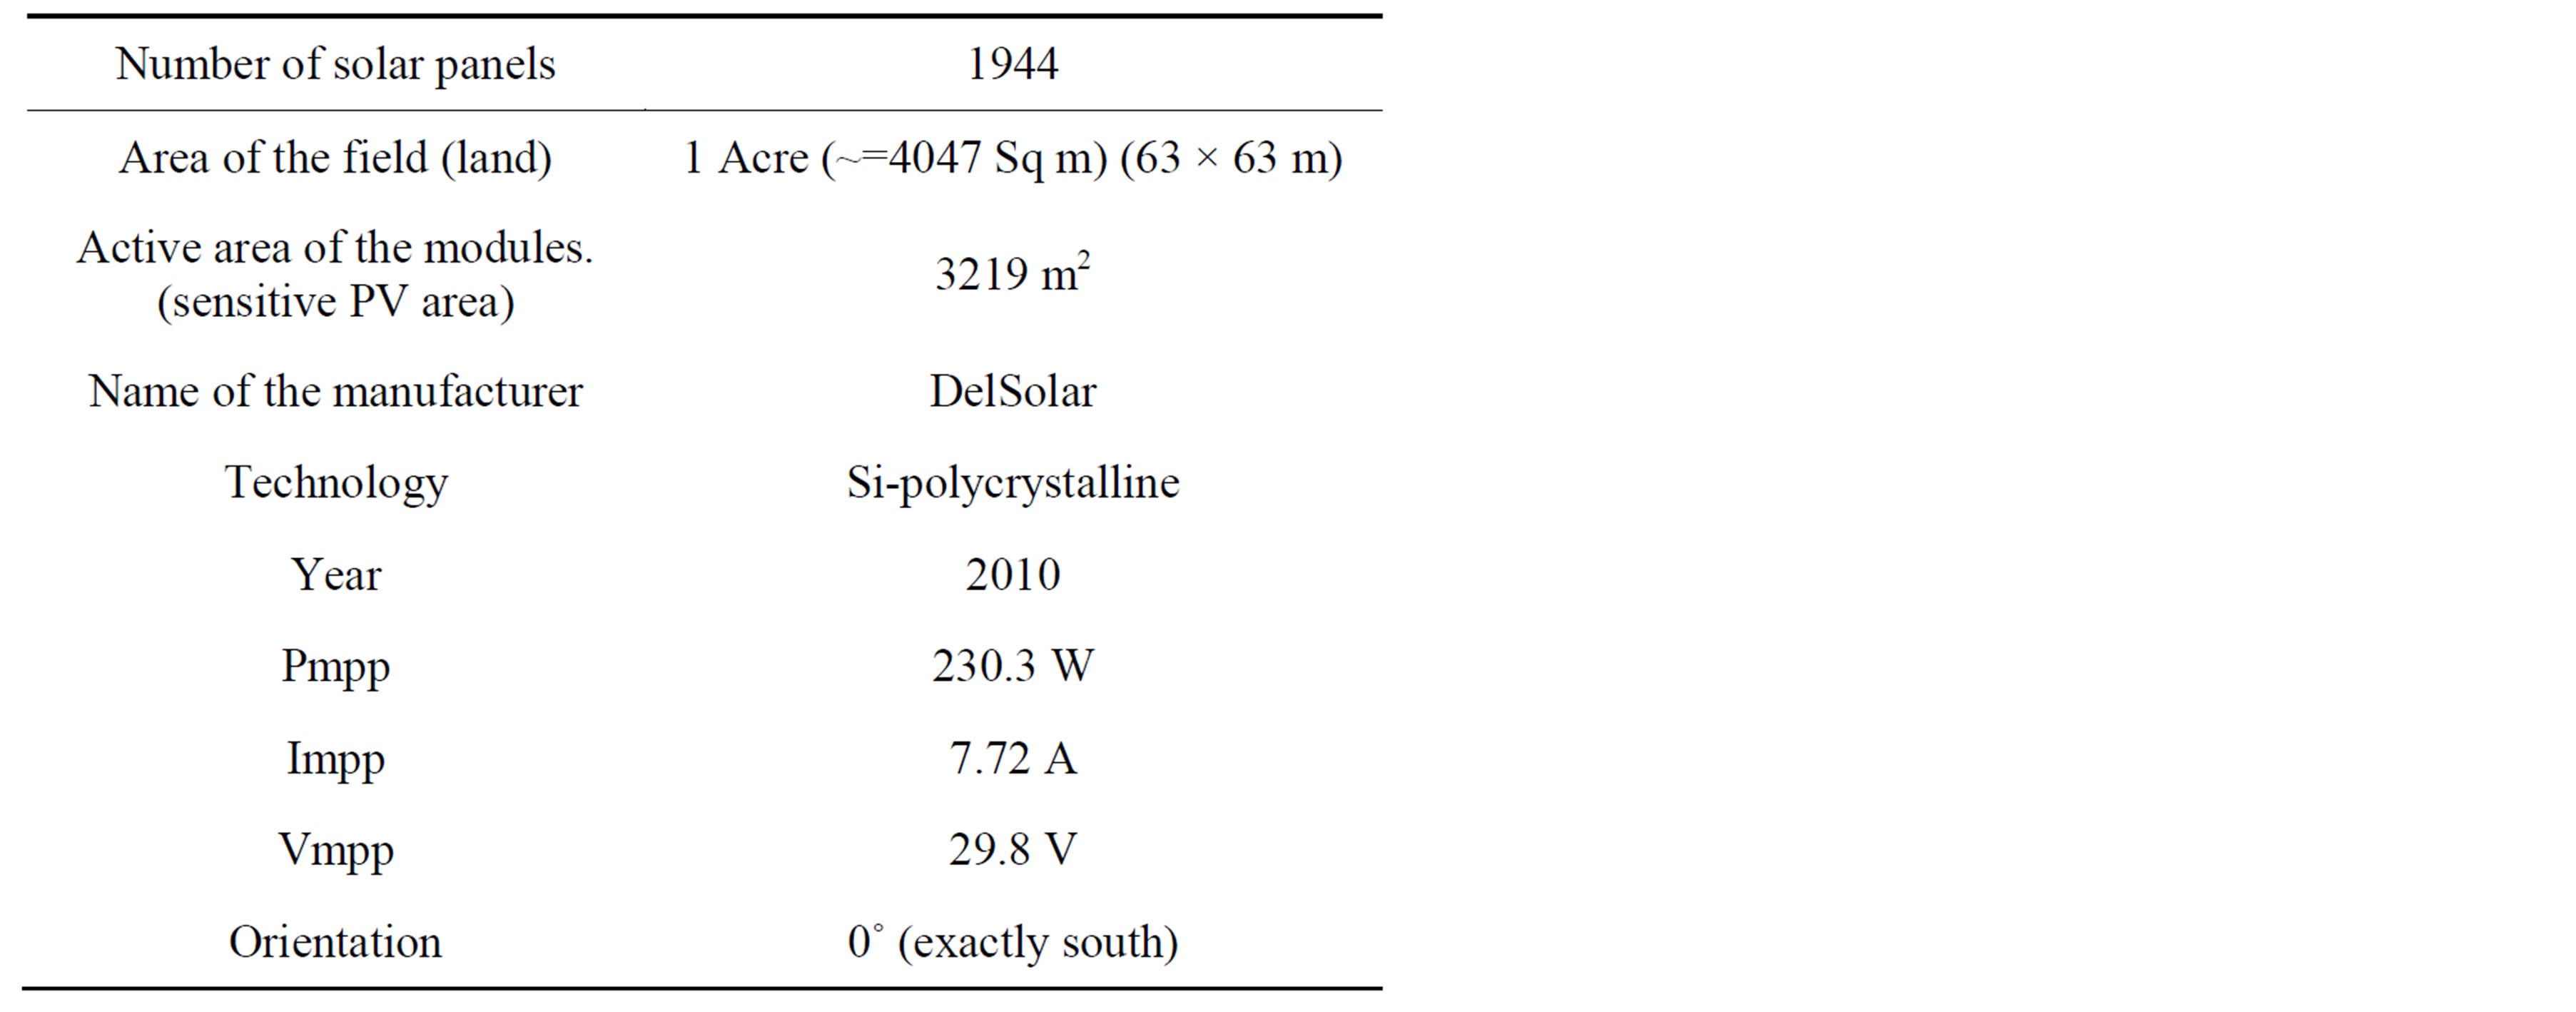
Table 2. PV module specifications.
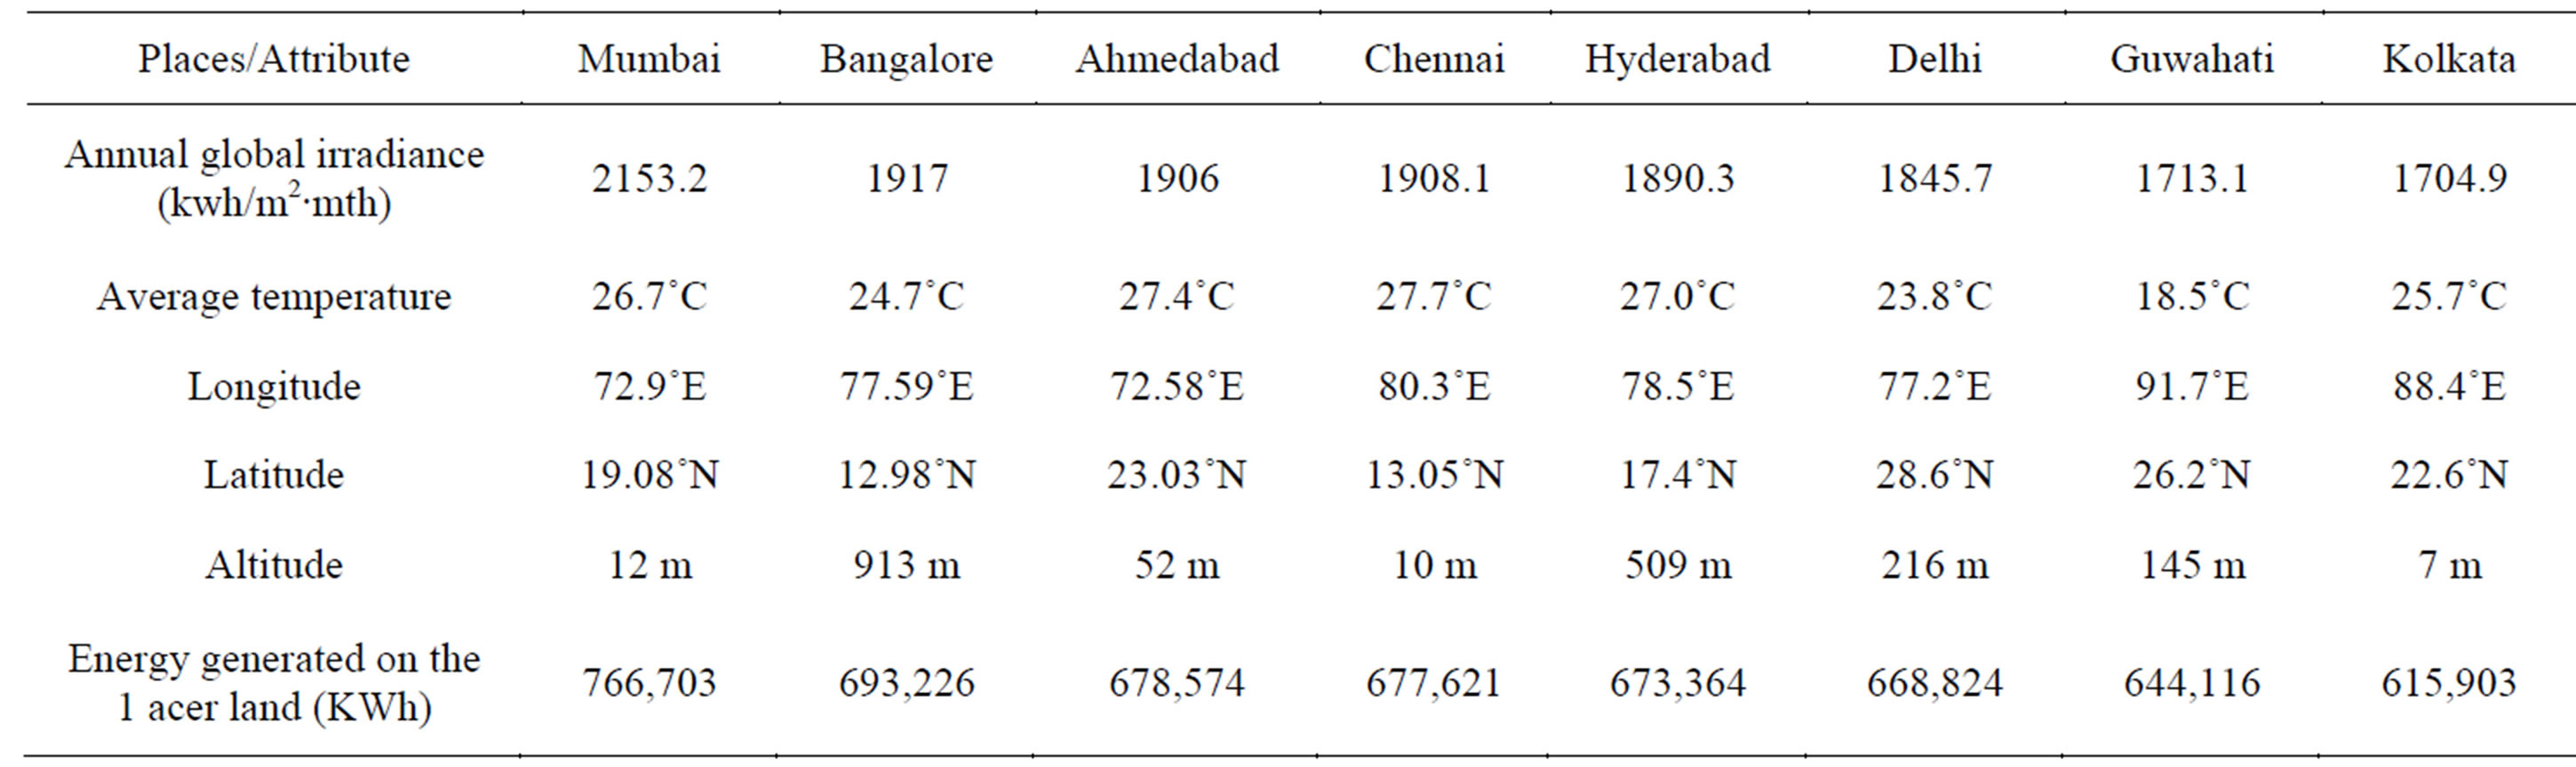
Table 3. Energy generation table for different cities.
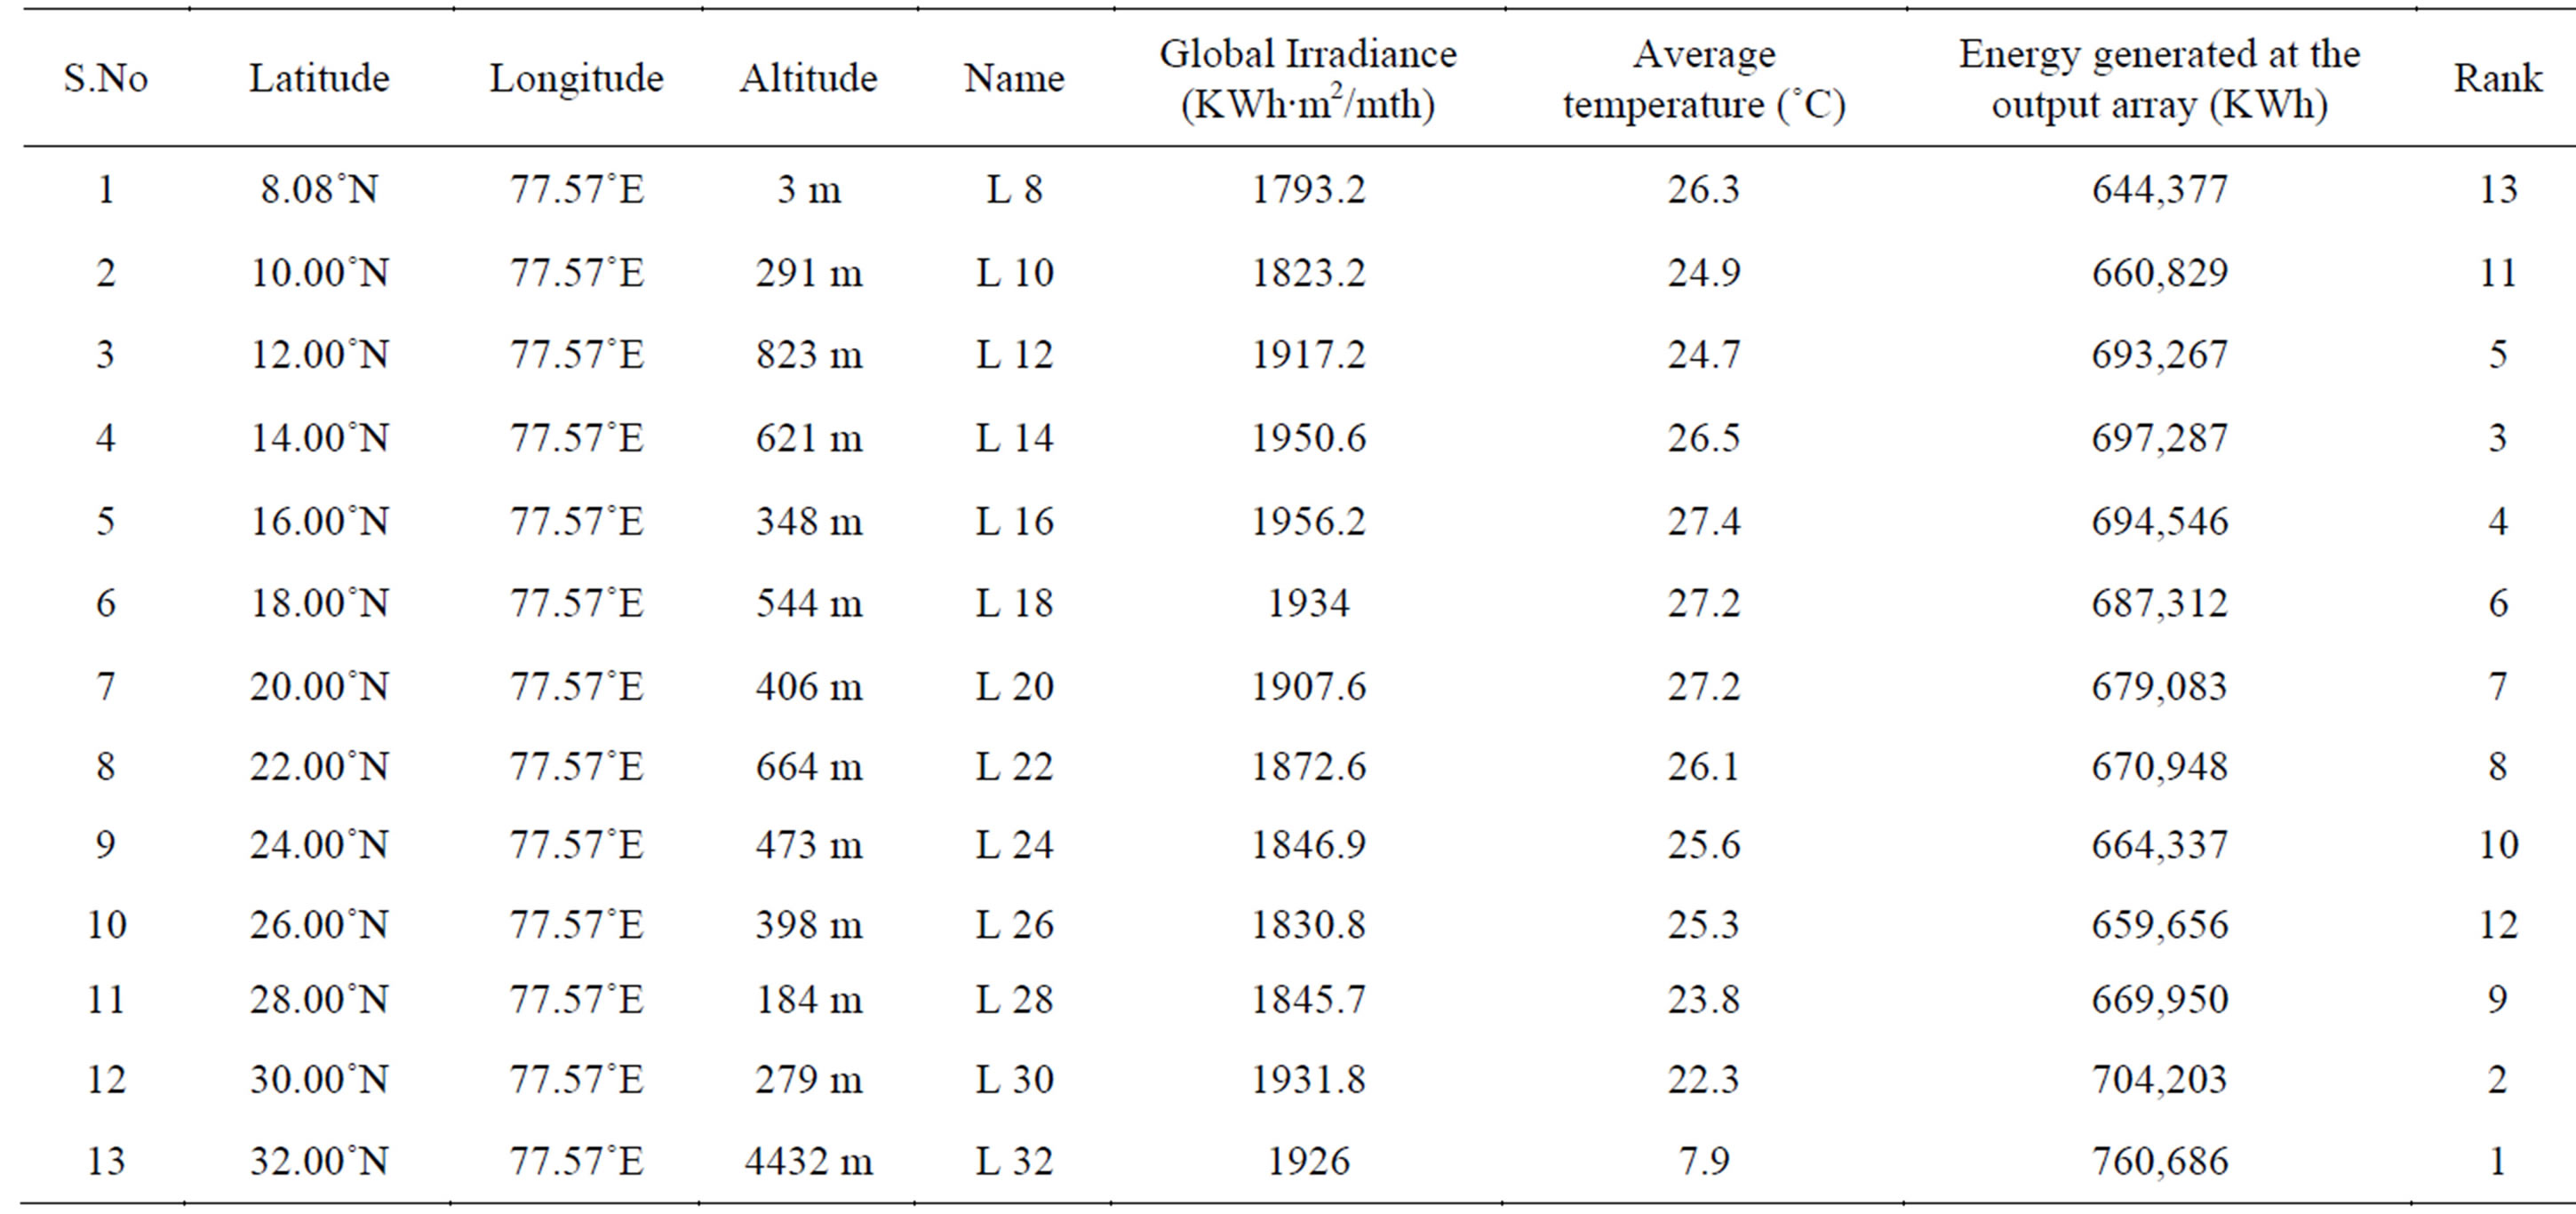
Table 4. Energy generation and average temperature at different latitudes.
solar panels used in each case is shown in Figure 2(b). More details are explained below for each configuration-case wise.
Case 2: In this case all the solar panels are arranged in a typical fashion at a location in Ahmedabad, Gujarat, India. The inclination of all the solar panel is fixed at 25˚ of acing south direction. Three different pitch values (3.8, 7.6 and 11.4 m) are assumed for computation. The pitch value is the distance between the adjacent rows of solar panels as shown in Figure 2(b). In case-2 to 9, the average global irradiation values for the year 1981 to 2000 as detailed in [8] are considered for computation.
Case 3: In this case, the solar panels are arranged like a chess board pattern as shown in Figure 2(c). Each square contains six solar panels (2 × 3). The solar panels are arranged in a square area facing south with 25˚ inclination in such a manner that there will be air gap between each square with same dimensions that of solar panels. The above (Figures 2(a)-(c)) three cases considered are carried to estimate the power generation with different solar panel configurations.
In the next three cases—cases 4, 5 and 6, analysis is made assuming the shade (blind) with the same dimension and configuration as that of solar panels but elevated at 5 m as considered in the previous three cases 1 to 3. On the ground, the solar panels lie in flat orientation with zero angle, as discussed in case-1 and also shown in Figures 2(d)-(f). Modelling on such type of configuration helps to estimate the amount of sunlight or solar radiation that falls on the ground below, once we place the solar panels above the ground. Since it is difficult to estimate the amount of sunlight that falls on the ground, we estimate the energy generation due to solar radiation. For the purpose of estimating the solar radiation, it is necessary to compute the energy generation on the panels. It is assumed that at a location, the energy generation is proportional to the solar radiation. This is a reasonable assumption as more solar radiation at a location, normally gives more solar energy and vice versa. The energy generation also depends on other parameters like temperature. Accordingly, modeling has been carried out for the following three cases also.
Case 4: In this case, blank (blind) shade with zero inclination is placed over the solar panels at a height of 5 m above the ground surface. The solar panels are arranged also with zero inclination with the same configuration on the ground surface as that of case 1. The configuration is presented as a schematic diagram in Figure 2(d).
Case 5: In this case, the solar panels lie on the ground with zero inclination while the shade or blind is located at 5 m above the ground. The blind shades are arranged in such a manner that is lined up in a row with 25˚ inclination with a separation of 3.8, 7.6 and 11.4 m between the rows. The idea here is to compute the solar radiation on the ground if we place the solar panels above the ground with the same configuration.
Case 6: In this case also the solar panels are arranged on the ground with zero inclination and the shade or blind is located above them at 5 m height. The configuration of the shade is like a chess board pattern. This means the shade panels are in one square and air gap with the same dimensions adjacent to it. In each square, a total of 6 panels are placed. The idea here is to compute
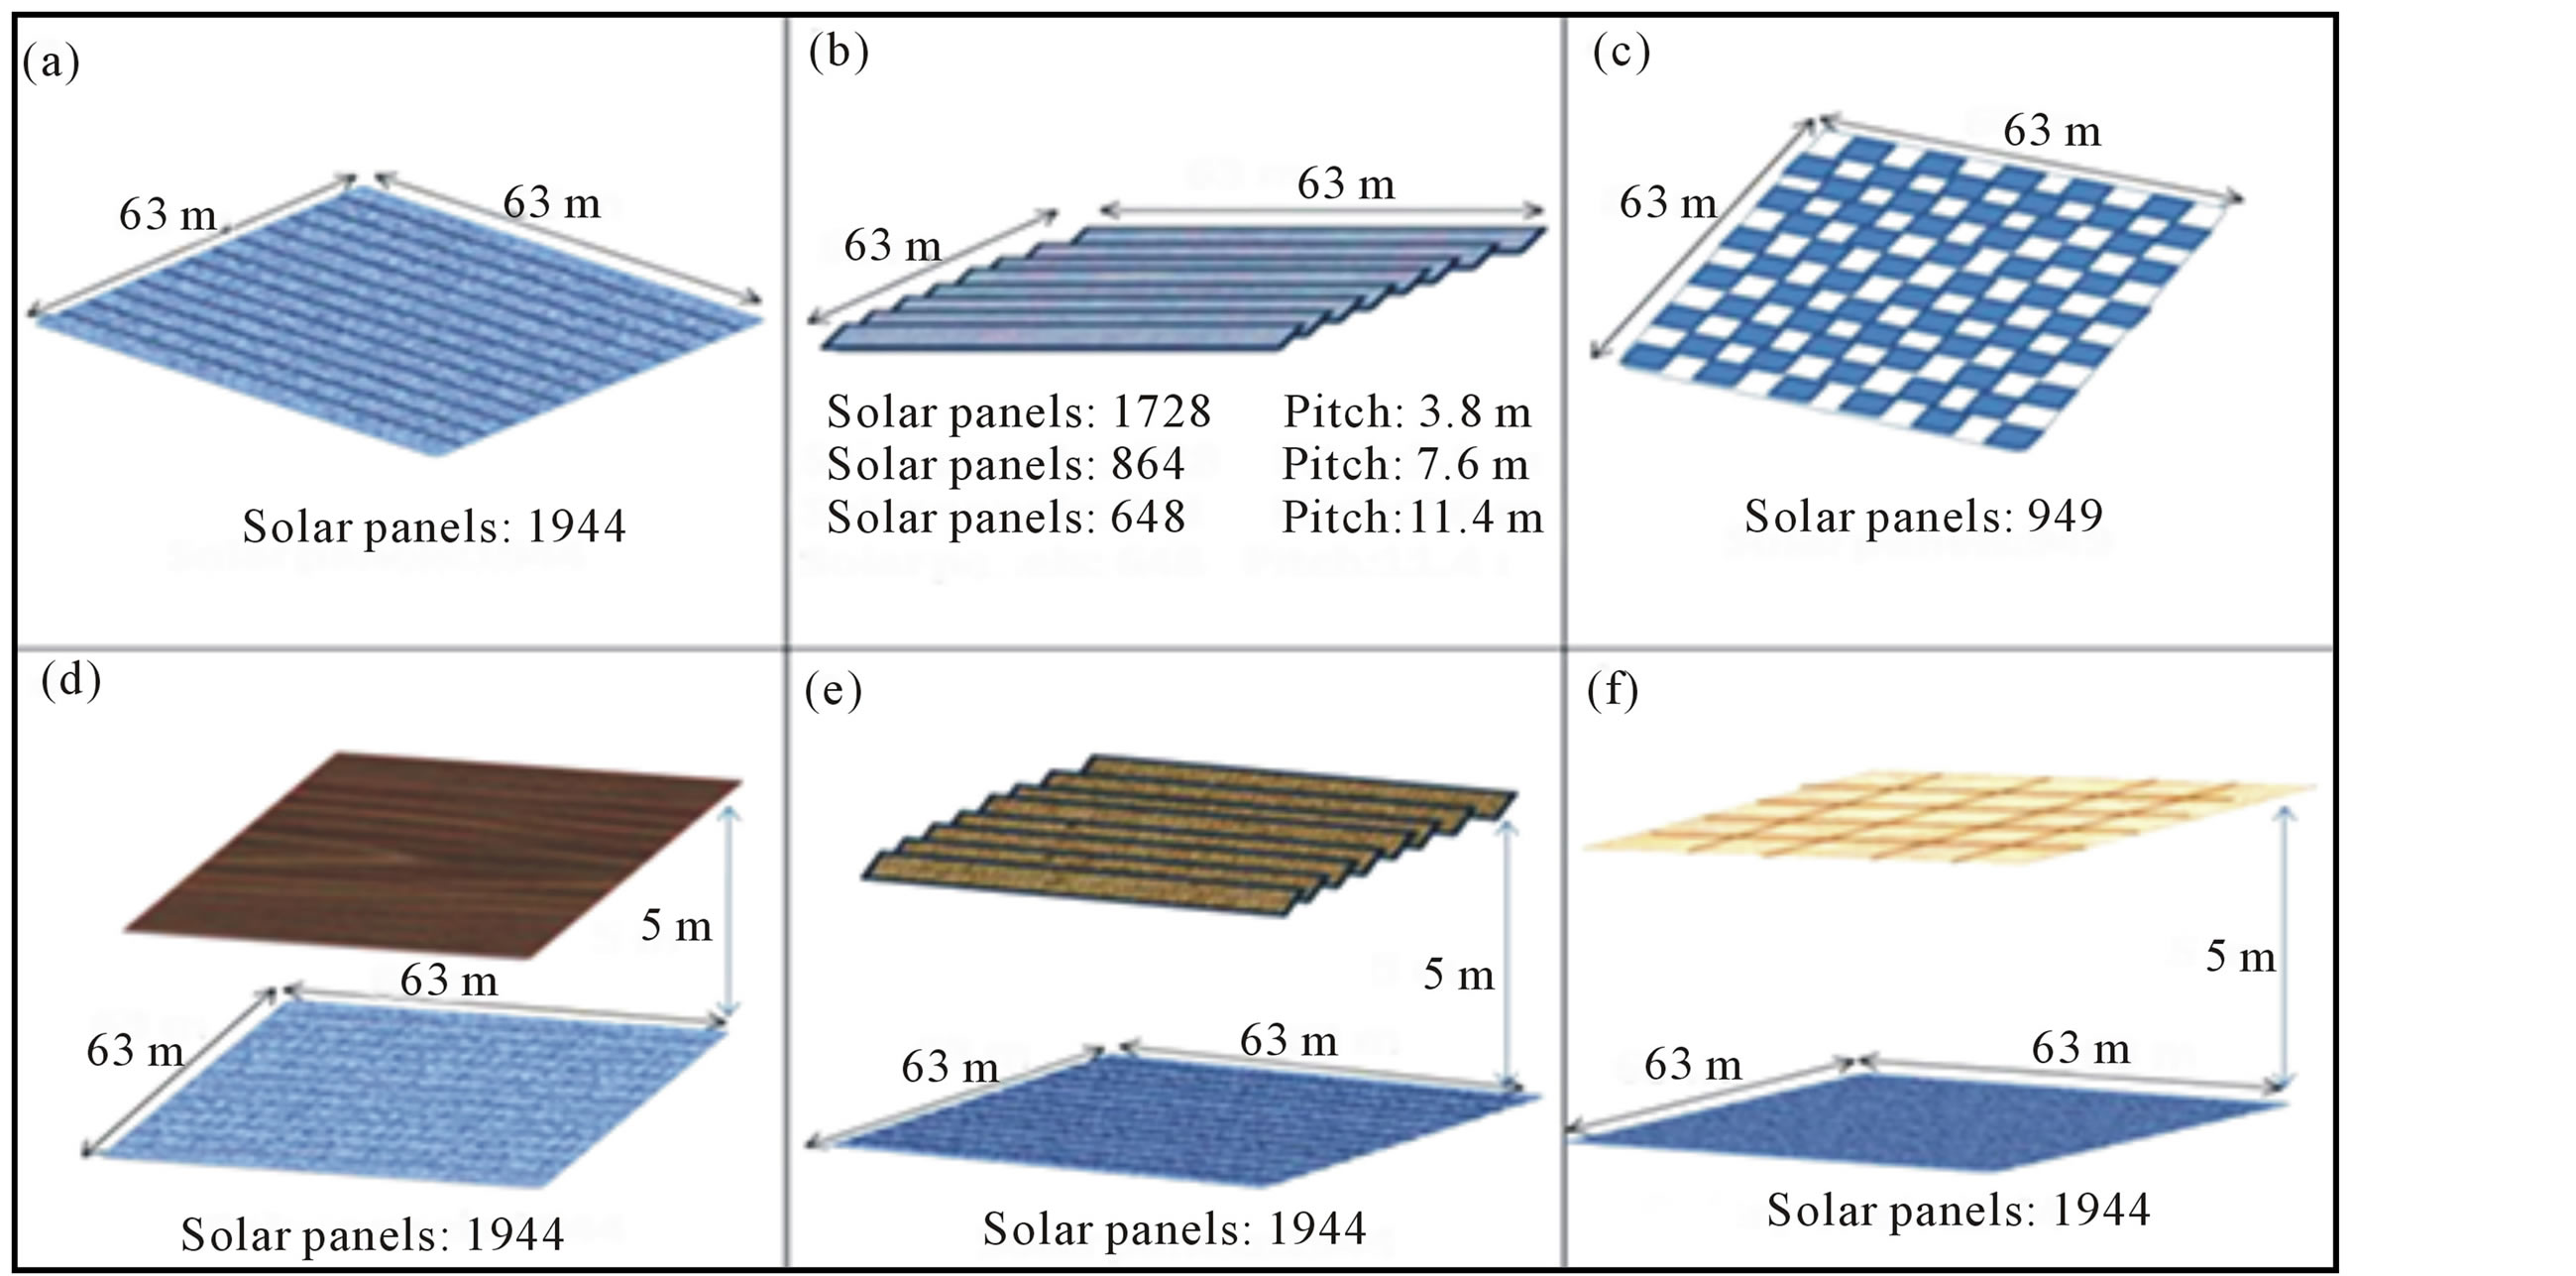
Figure 2. Schematic diagram for the cases “a” to “f”. (a) Solar panels (1944 number) placed on the ground with zero inclination. (b) Solar panels on the ground with 25˚ inclination with different pitch values (3.8/7.6/11.4 m). (c) Solar panels on the ground with 25˚ inclination like a chess board pattern. (d) Solar panels on the ground with zero inclination and shade of 5 meter above the ground with same dimensions as that of solar panels in case-a. (e) Solar panels on the ground with zero inclination and shade of 5 meter height with dimension of the shade similar to that of solar panels in the case-b. (f) Solar panels on the ground with zero inclination and shade of 5 meter height with dimension of the shade similar to that of solar panels in the case-c.
the energy generation which in turn gives information of the solar radiation on the ground if we place the solar panels above at 5 m with the same configuration.
The above three cases 4, 5 and 6 provide important data on the solar energy generation and in turn provide information on the solar radiation due to the shade that lie above the ground. By observing the amount of solar radiation that reaches the ground surface, one can decide the amount of sunlight received by different crops or plants. Based on the amount of solar radiation, one can decide on the type of configuration that can be used safely and profitably for the cultivation.
In all the above cases 1 to 6, we have concentrated on the computation of energy on different solar panel configurations and the effect of shade above the ground. This means we have computed the effects of different shades on the owner’s land (A in Figure 3). Since the land we are planning to install the solar panels are fertile and cultivated, it is likely that neighbor’s may object for such a construction. Their objection may be based on possible reduction of the yield from their crops due to the shade. This demands to estimate and provide scientific assessment due to solar panels arranged at 5 m height in a shed like structure on a particular land and it’s shade effect on the neighbor’s land. For this purpose, the shade analysis is continued on the neighbor’s land on all the directions. Different shade configuration as before is constructed at a height of 5 m on owners land (A in Figure 3).
Its effect on the neighbor’s land (B-I in Figure 3) of 1 acre is estimated by placing the flat solar panels with zero inclination on the ground surface. Such a configuration in different cases is explained below with varying pattern of shades as shown in Figures 3(a)-(c).
Case 7: In this case, continuous blind shade is created on 1 acre of land located 5 m above the ground surface with a configuration similar to case 4. The effect of this shade is computed on the neighbour’s land of 1 acre located in all directions such as north, south, east, west and also on all the corners—north east, north west, south east and south west directions as shown in Figure 3. For the purpose of quantifying the solar radiation due to shade, flat solar panels are created similar to case 1 on the neighbouring lands B-I.
Case 8: In this case, the shade is at a height of 5 m with configuration similar to configuration of solar panels of case 2 (Figure 2(b)). As before the effect of this shade is estimated on the neighboring lands in all directions.
Case 9: In this case, the shade is at a height of 5 m with a configuration similar to chess board pattern (see Figure 2(c)) similar to case-3. As before, it’s effect is computed in all the directions on the neighbouring lands.
3. Results
All the above cases, the shade effect on the solar energy generation gave important results over one acre of land below the shade and also on the neighbouring land. The results derived from modelling studies are described for each case in the following.
Case 1: As explained earlier, in this case, the solar energy generated is presented due to the solar panels arranged in flat orientation with zero inclination. The details of the results in the form of energy generation as a function of month are presented in Figure 4.
The modelling studies showed that at Mumbai, maximum annual energy (766,703 KWh) is generated and minimum energy is generated for the Kolkata city (615,897 KWh). This indicates that annual solar energy generation not only depends on global irradiation but also on the temperature and other parameters as well. In another study, variation of solar energy with latitude is estimated. It is observed that at a location L32 near latitude 32˚N and longitude 77.57˚E degrees, maximum annual energy with 760,686 KWh and the least is at Kanyakumari location with 644,377 KWh. These configurations are based on the global irradiation values for the year 1990. This indicates that solar energy depends on many factors such as global irradiation, temperature etc and may also be due to other parameters. It is known that solar panels perform better and yield more energy at
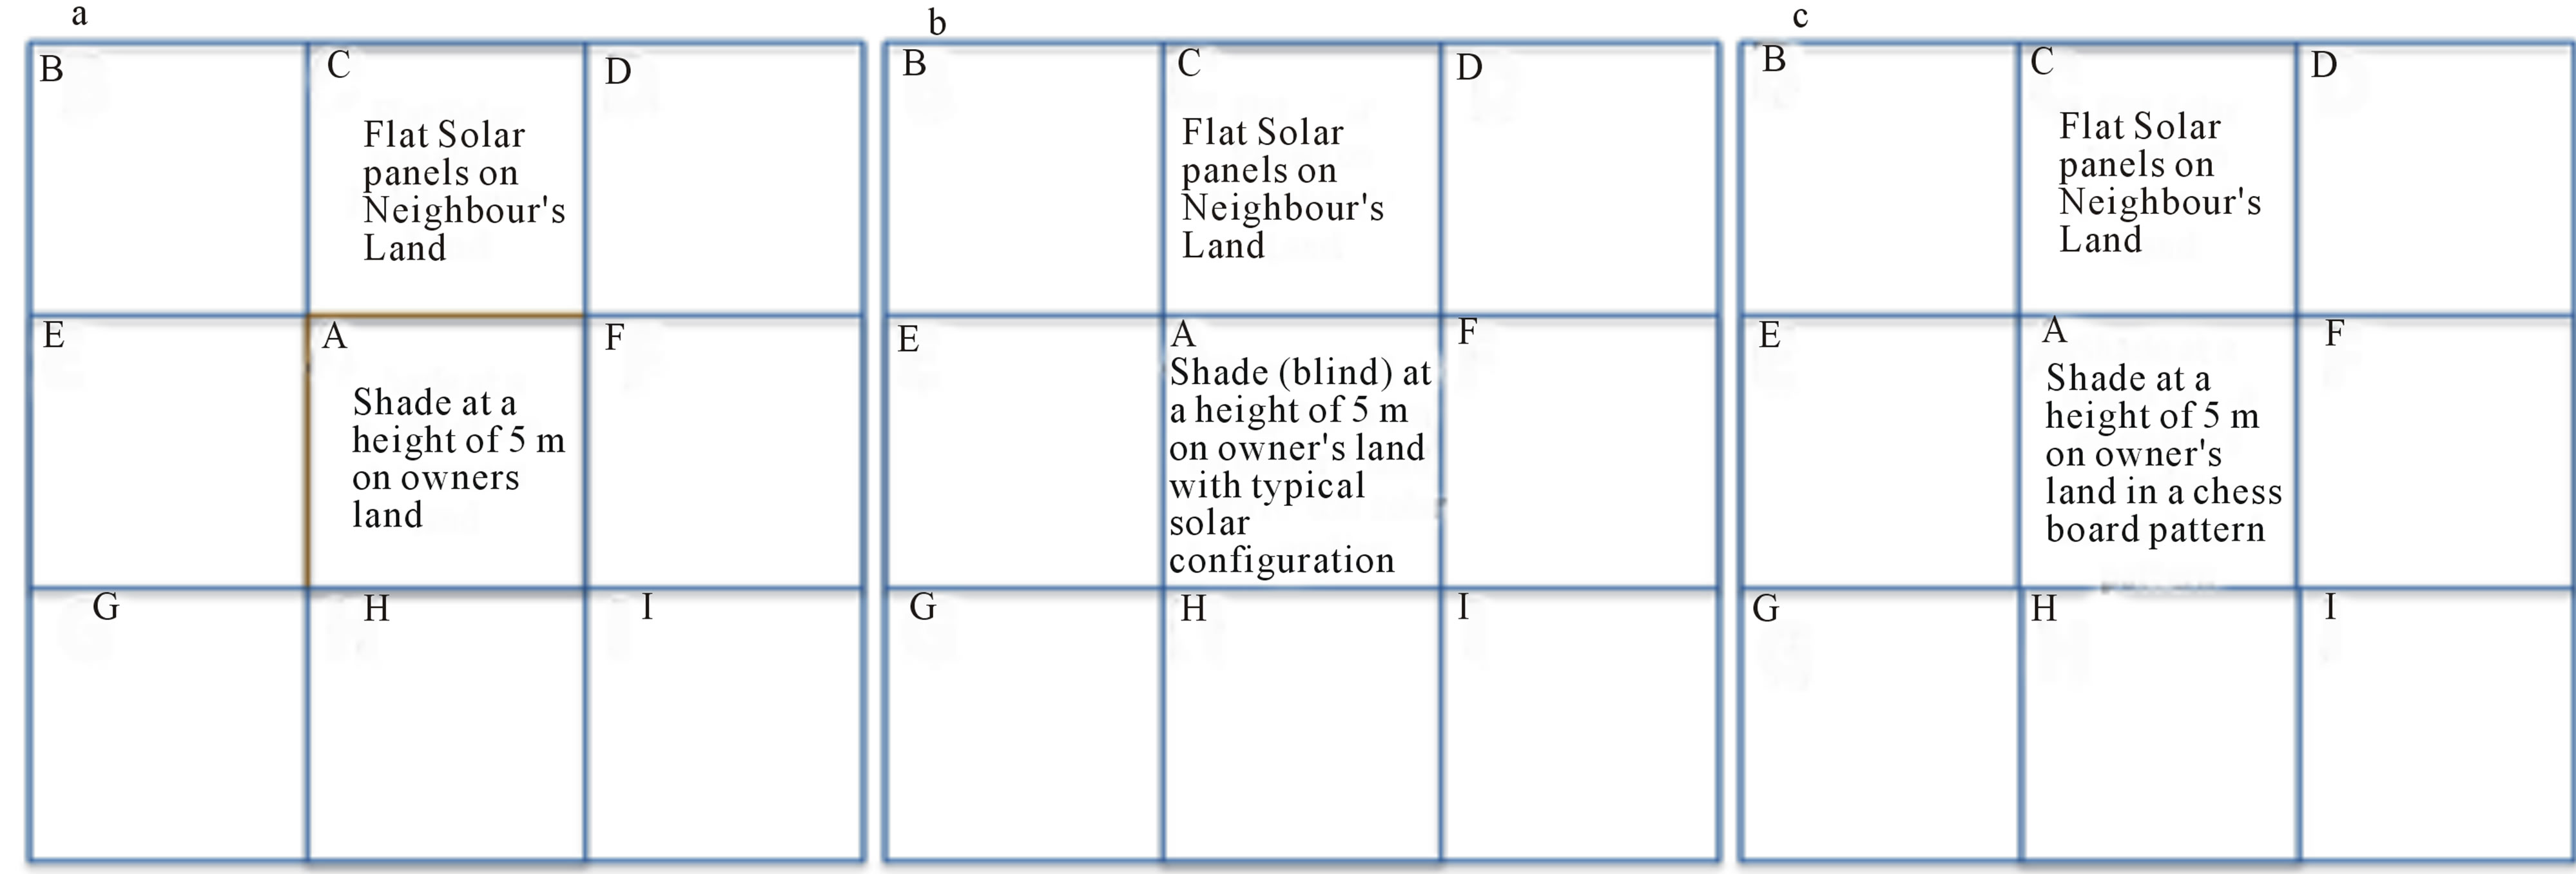
Figure 3. (a) Schematic diagram showing one acre of the land at the center (A) surrounded by eight acres of land towards north (C), south (H), west (E), east (F), north east (D), north west (B), south east (I), south west (G). The shade is in a similar fashion as that of case 4 (see Figure 2(d)). The solar panels similar to case 1 (2a) is placed on the lands “BCDEFGHI” to compute the effect of shade over land A over BCDEFGHI. (b) Similar to case-a except the height 5 meter shade over the land A in a similar pattern and configuration as in the case-5 (see Figure 2(e)). (c) Similar to case-a except the height 5 meter height in a pattern of chess board with alternate panels and air gap similar to the pattern as explained in the case-6 (see Figure 2(f)).
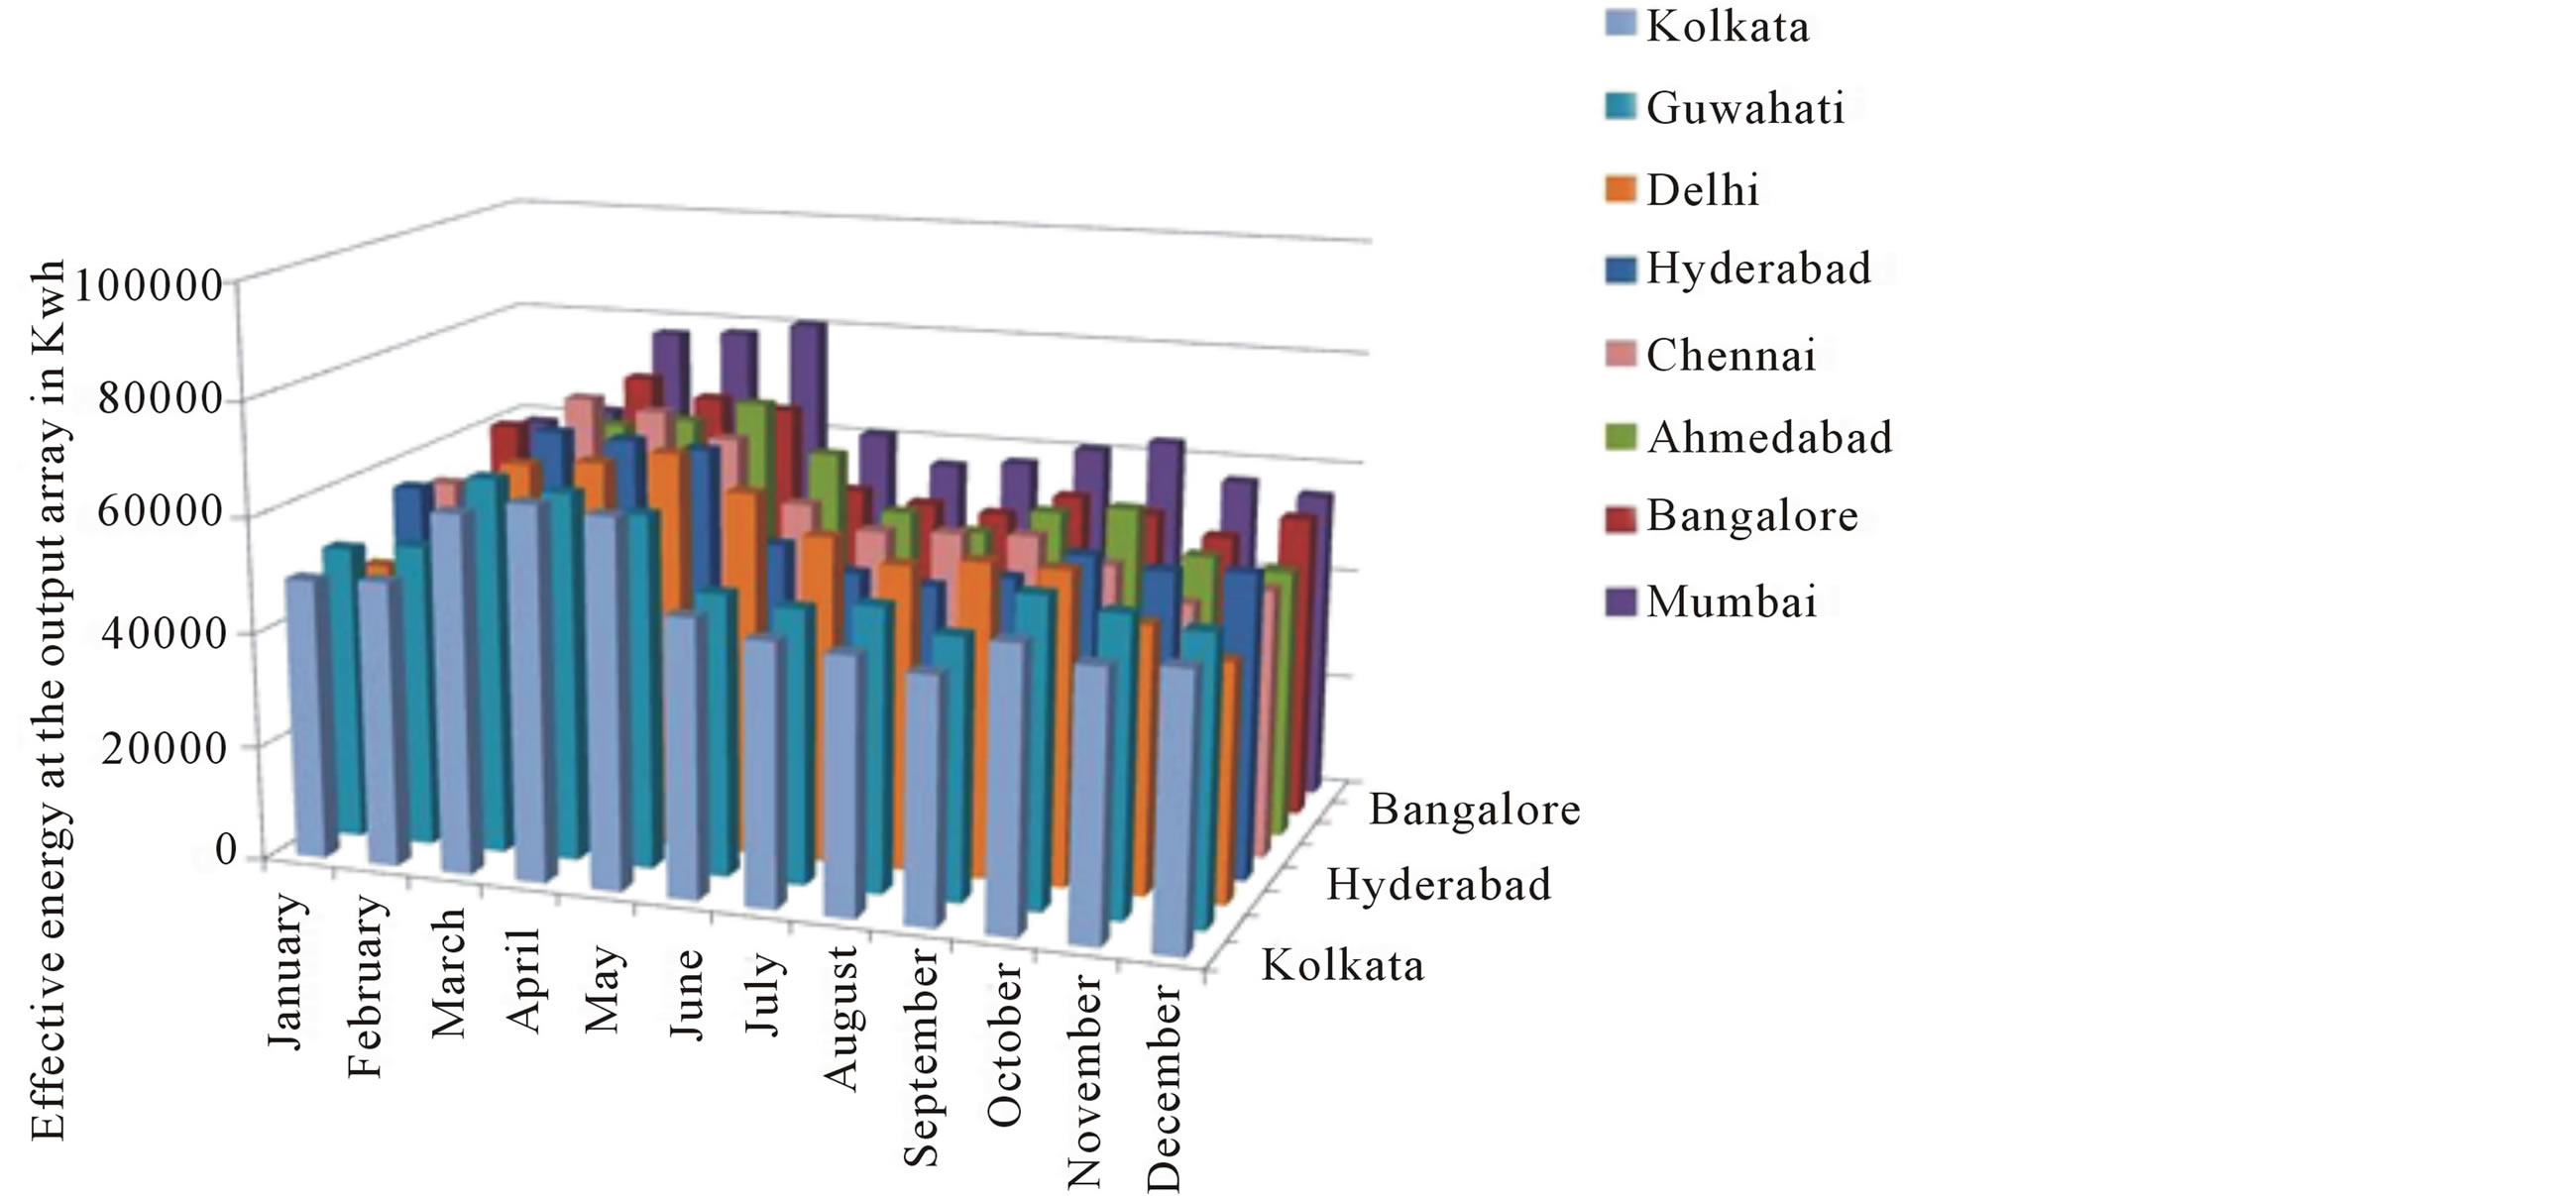
Figure 4. Annual solar energy generation graph-month wise for major cities in India. One acre of land with 1944 solar panels are placed with zero inclination in all the cities.
lower temperatures as compared to higher temperature locations.
Figure 5 shows the energy generation in one acre of land with varying latitude for each month. The changes in solar energy do not show linear trend with latitude. From the total annual energy values, the sequential order with increasing trend corresponds to the locations L8, L26, L10, L24, L28, L22, L20, L18,L12, L16, L14, L30 and L32 as shown in the figure.
In Figure 6, the total energy generation as a function of latitude is shown. The curve is not linear but contains two peaks—one at 32 degree latitude and the other at 14 degree latitude. This indicates that maximum solar energy generation is possible at high latitudes and close to mid latitudes of 12 - 18 with a peak at 14˚. It again indicates that solar energy generation not only depends on horizontal global irradiation, but also on other parameters like local temperature as well.
For other cases 2 to 9-described below, Ahmedabad location is chosen as a sample. Figure 7 shows variation of energy generation for different configurations without shade by varying the pitch value. The data considered is the average global radiation for the year 1990. It may be recalled that the main theme of our study is to generate electricity using cultivated agriculture land. For this purpose, it is important to find a relation between solar energy generation and global irradiation. This relation also helps to understand the sunlight variation due to shade. Here we assume the sunlight is directly proportional to global irradiation. This assumption is reasonable as the light is considered, as one form of radiation emanating from the Sun. It is observed that solar energy generation and global radiation are linearly related for Ahmedabad location (Figure 8).
Cases 2 and 3: In case-2, the solar panels are arranged in a typical fashion with 25˚ inclination as explained before. The energy generation month wise for pitch values of 3.8, 7.6 and 11.4 m are presented in Figure 7. In case- 3, the solar panels are arranged in a pattern similar to chess board and energy generation is shown in Figure 7. In this figure, the results of cases-1, 2 and 3 are presented for comparison. Maximum solar energy is observed for flat solar panels in one acre of land that contains1944 panels without shade followed by 1728 solar panels with pitch value 3.8 m, 949 panels distributed like chess board pattern, 864 panels with pitch value of 7.6 m and 648 panels for 11.4 m respectively. As expected more number of panels generate more energy. Flat solar panels has generated maximum energy followed by 3.8 m separated panels, checker type solar panels, 7.6 m pitch value and finally the least for 11.4 m pitch value solar panels.
Case 4, 5 and 6: In these cases, flat solar panels are kept on the ground surface and the effect of shade at 5 m height is kept with different patterns as shown in Figures 2(d)-(f). As explained before, the idea here is to estimate the reduction in energy generation due to shade which in turn provides information on the reduction of the sunlight on the land. Results derived for these cases are shown in Figure 9.
For the sake of comparison, solar panels without shade is also shown. It can been seen that there is a considerable decrease in solar energy generation on the ground for the blind located at 5 m height and also for 3.8 m separated blinds. The solar energy generation for 7.6 m and 11.4 m separated blinds have shown nearly equal values. Thus there is nearly 87% - 92% sunlight for case 4 as compared to no shade. In case 5, there will be 62% - 79% reduction of sunlight for 3.8 m distance blinds, 32% - 44% reduction for 7.6 m separated blinds, 21% - 28% for 11.4 m separated blinds. For case 6 the reduction in the sun-
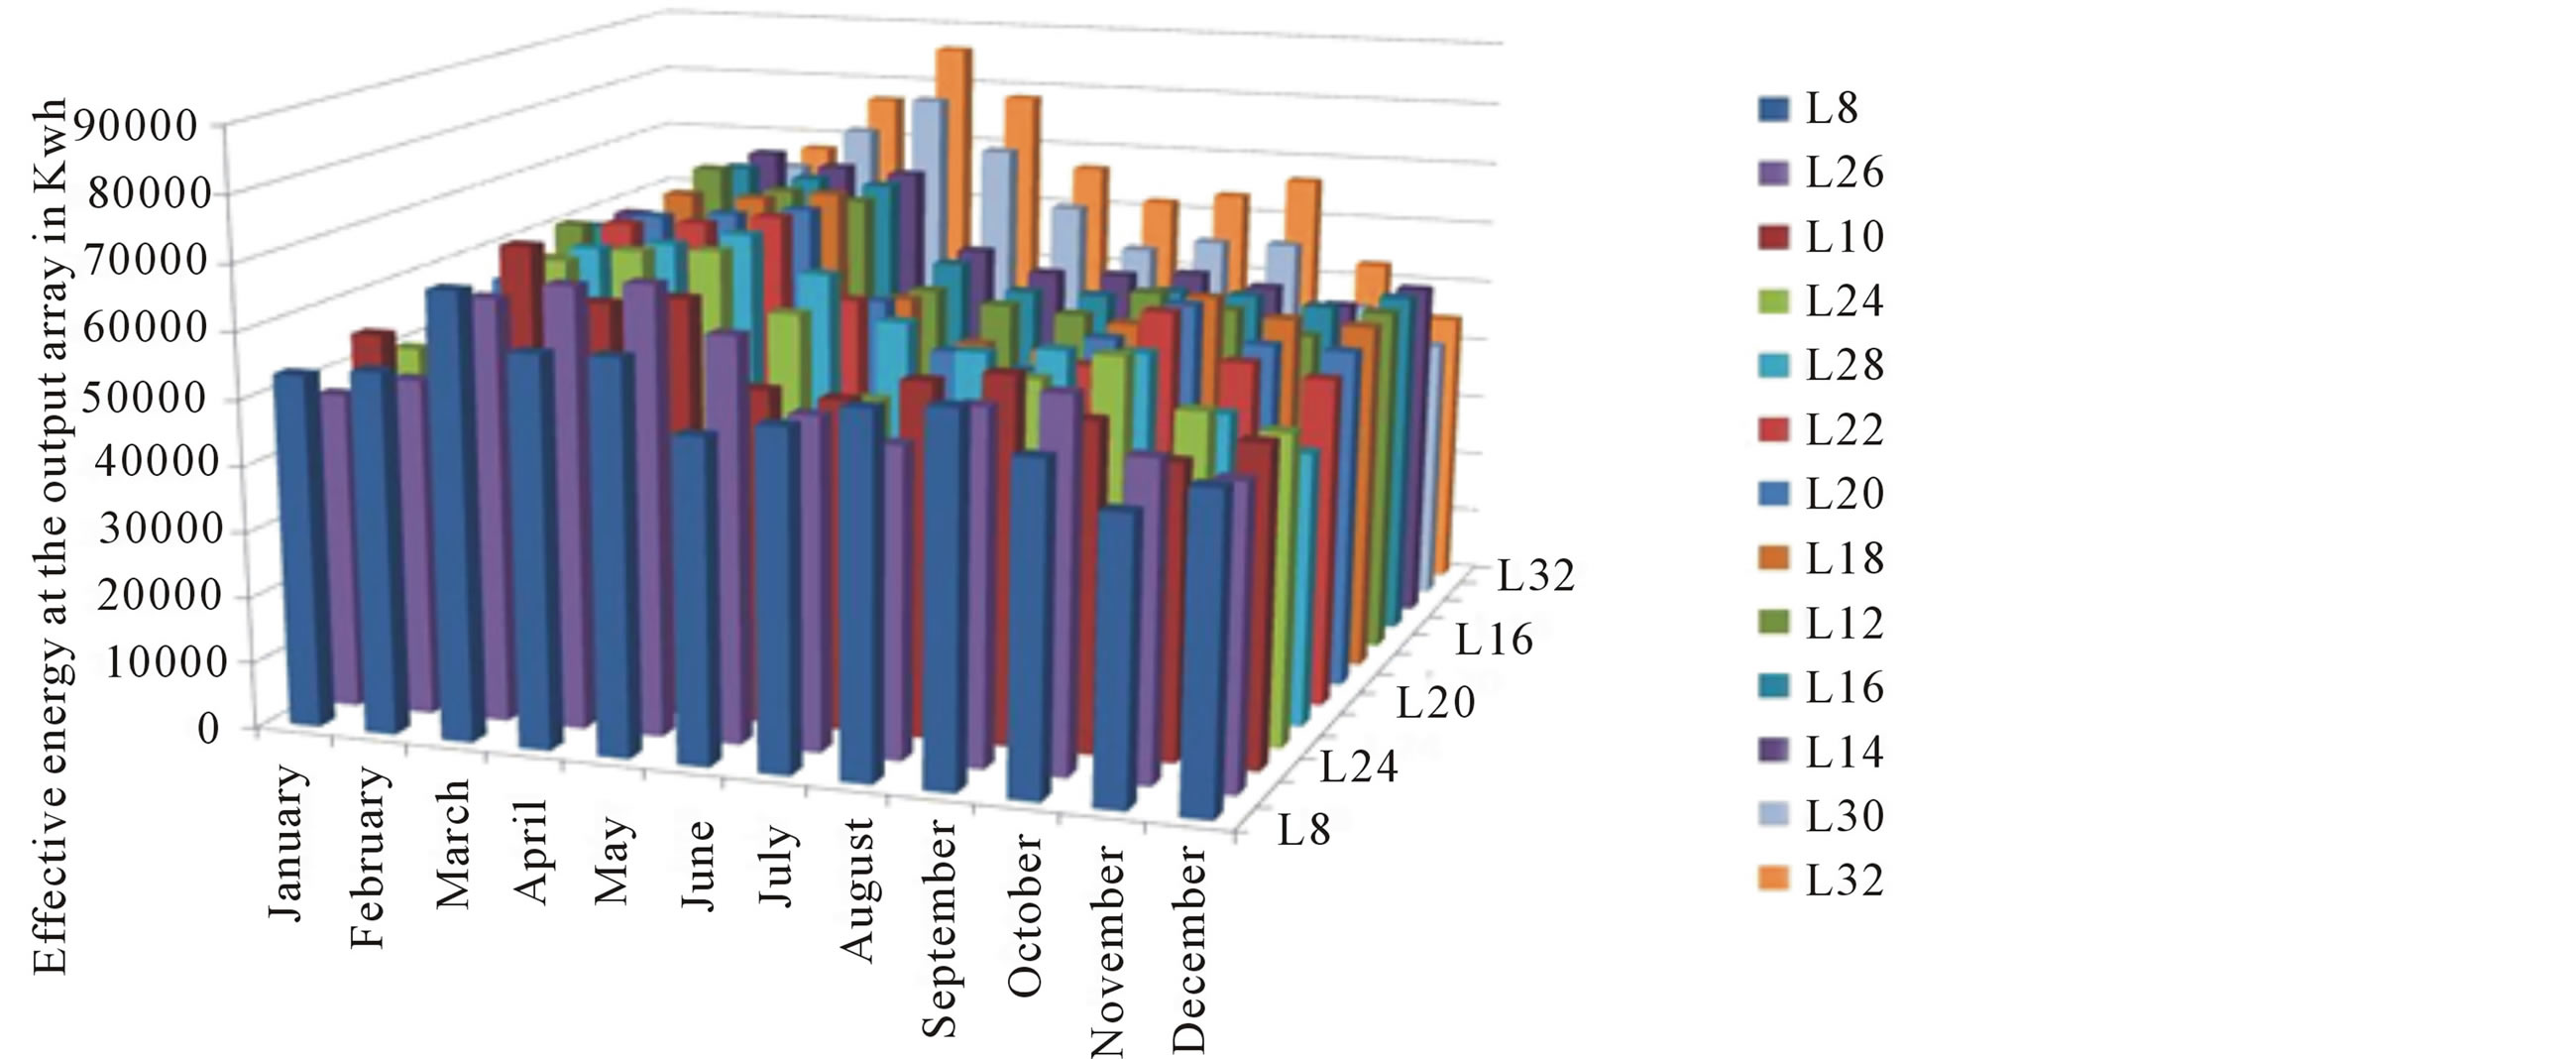
Figure 5. Annual solar energy generation graph month wise for different latitudes by fixing the longitude to 77.57 E (Kanyakumari location). One acre has 1944 solar panels with zero inclination in different latitudes.
light is 30% - 40%. The reduction values are as compared to no shade on the solar panels. This reduction in values is limited to mid-day period between 11 am to 2 pm. Thus one can safely use the solar panels with separation of 11.4 or 7.6 m or like chess pattern of solar panels without much loss on the yield of the crops.
Case 7, 8, 9: Modeling on the estimation of reduction of sunlight on the neighbors land in all the eight directions (north, south, east, west, north-east, north-west, south-east, south-west) if the owner has set up solar panels on his one acre of land as shown in Figure 10.
The annual variation of energy generation with solar panels oriented in horizontal direction on all the neighboring lands one at a time has been computed. The data considered for this computation is based on the global average radiation data the years 1981-2000 as described in [8,15].
The results derived in such a configuration can be divided into five sets of curves, namely a to e as shown in Figure 10 for each months. As can be seen the energy generation and represented by the curves a to e is distinctly different. The energy generation in group of curves represented by “a” in Figure 10 shows the effects of shade on the neighboring lands B-I due to the panels at 5 m height on land A. The curve “b” represents the energy generation on land A due to the effect of shade at 5 m height as before with rows of panels separated by 11.4 m. Similarly, curve “c” represents the energy generation on land A due to shade above in chess pattern and also the panels separated by 7.6 m. Curve “d” represents the effect of shade due to panels separated by 3.8 m. Finally, the curve “e” gives the result of energy generation if the shade is continuous without any gap between the rows of panels.
It is observed that there is almost nil reduction in solar energy generation on the neighboring lands in all directions for the continuous blind at 5 m height except one located towards the east and the west where the reduction is less than 2%. The same effect is seen for the blinds located at 5 m height and separated by 3.8 m, 7.6 m and chess board pattern configuration.
4. Discussion
India has a vast land, mostly being used for agriculture.
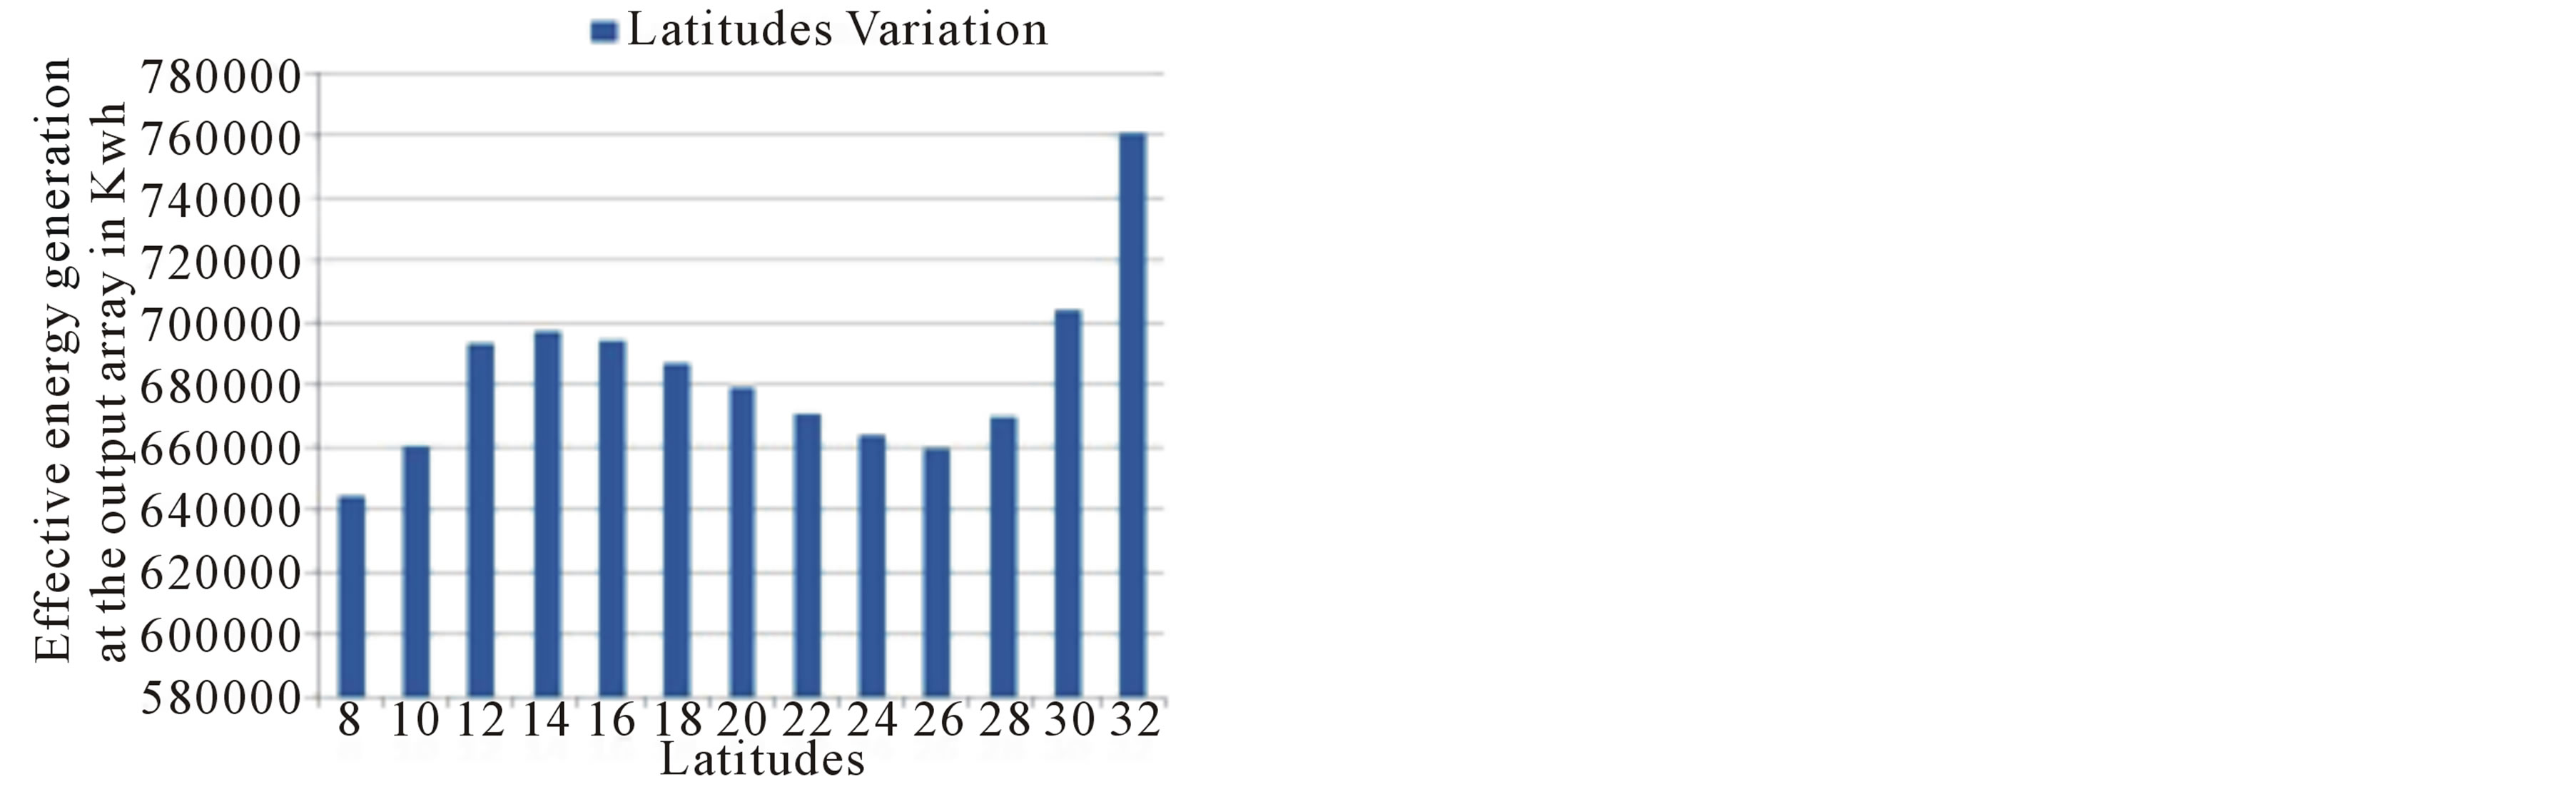
Figure 6. Total solar energy generation for the year 1990 with latitude variation. Two maxima can be seen, one at 14˚ and the other at 32˚N.
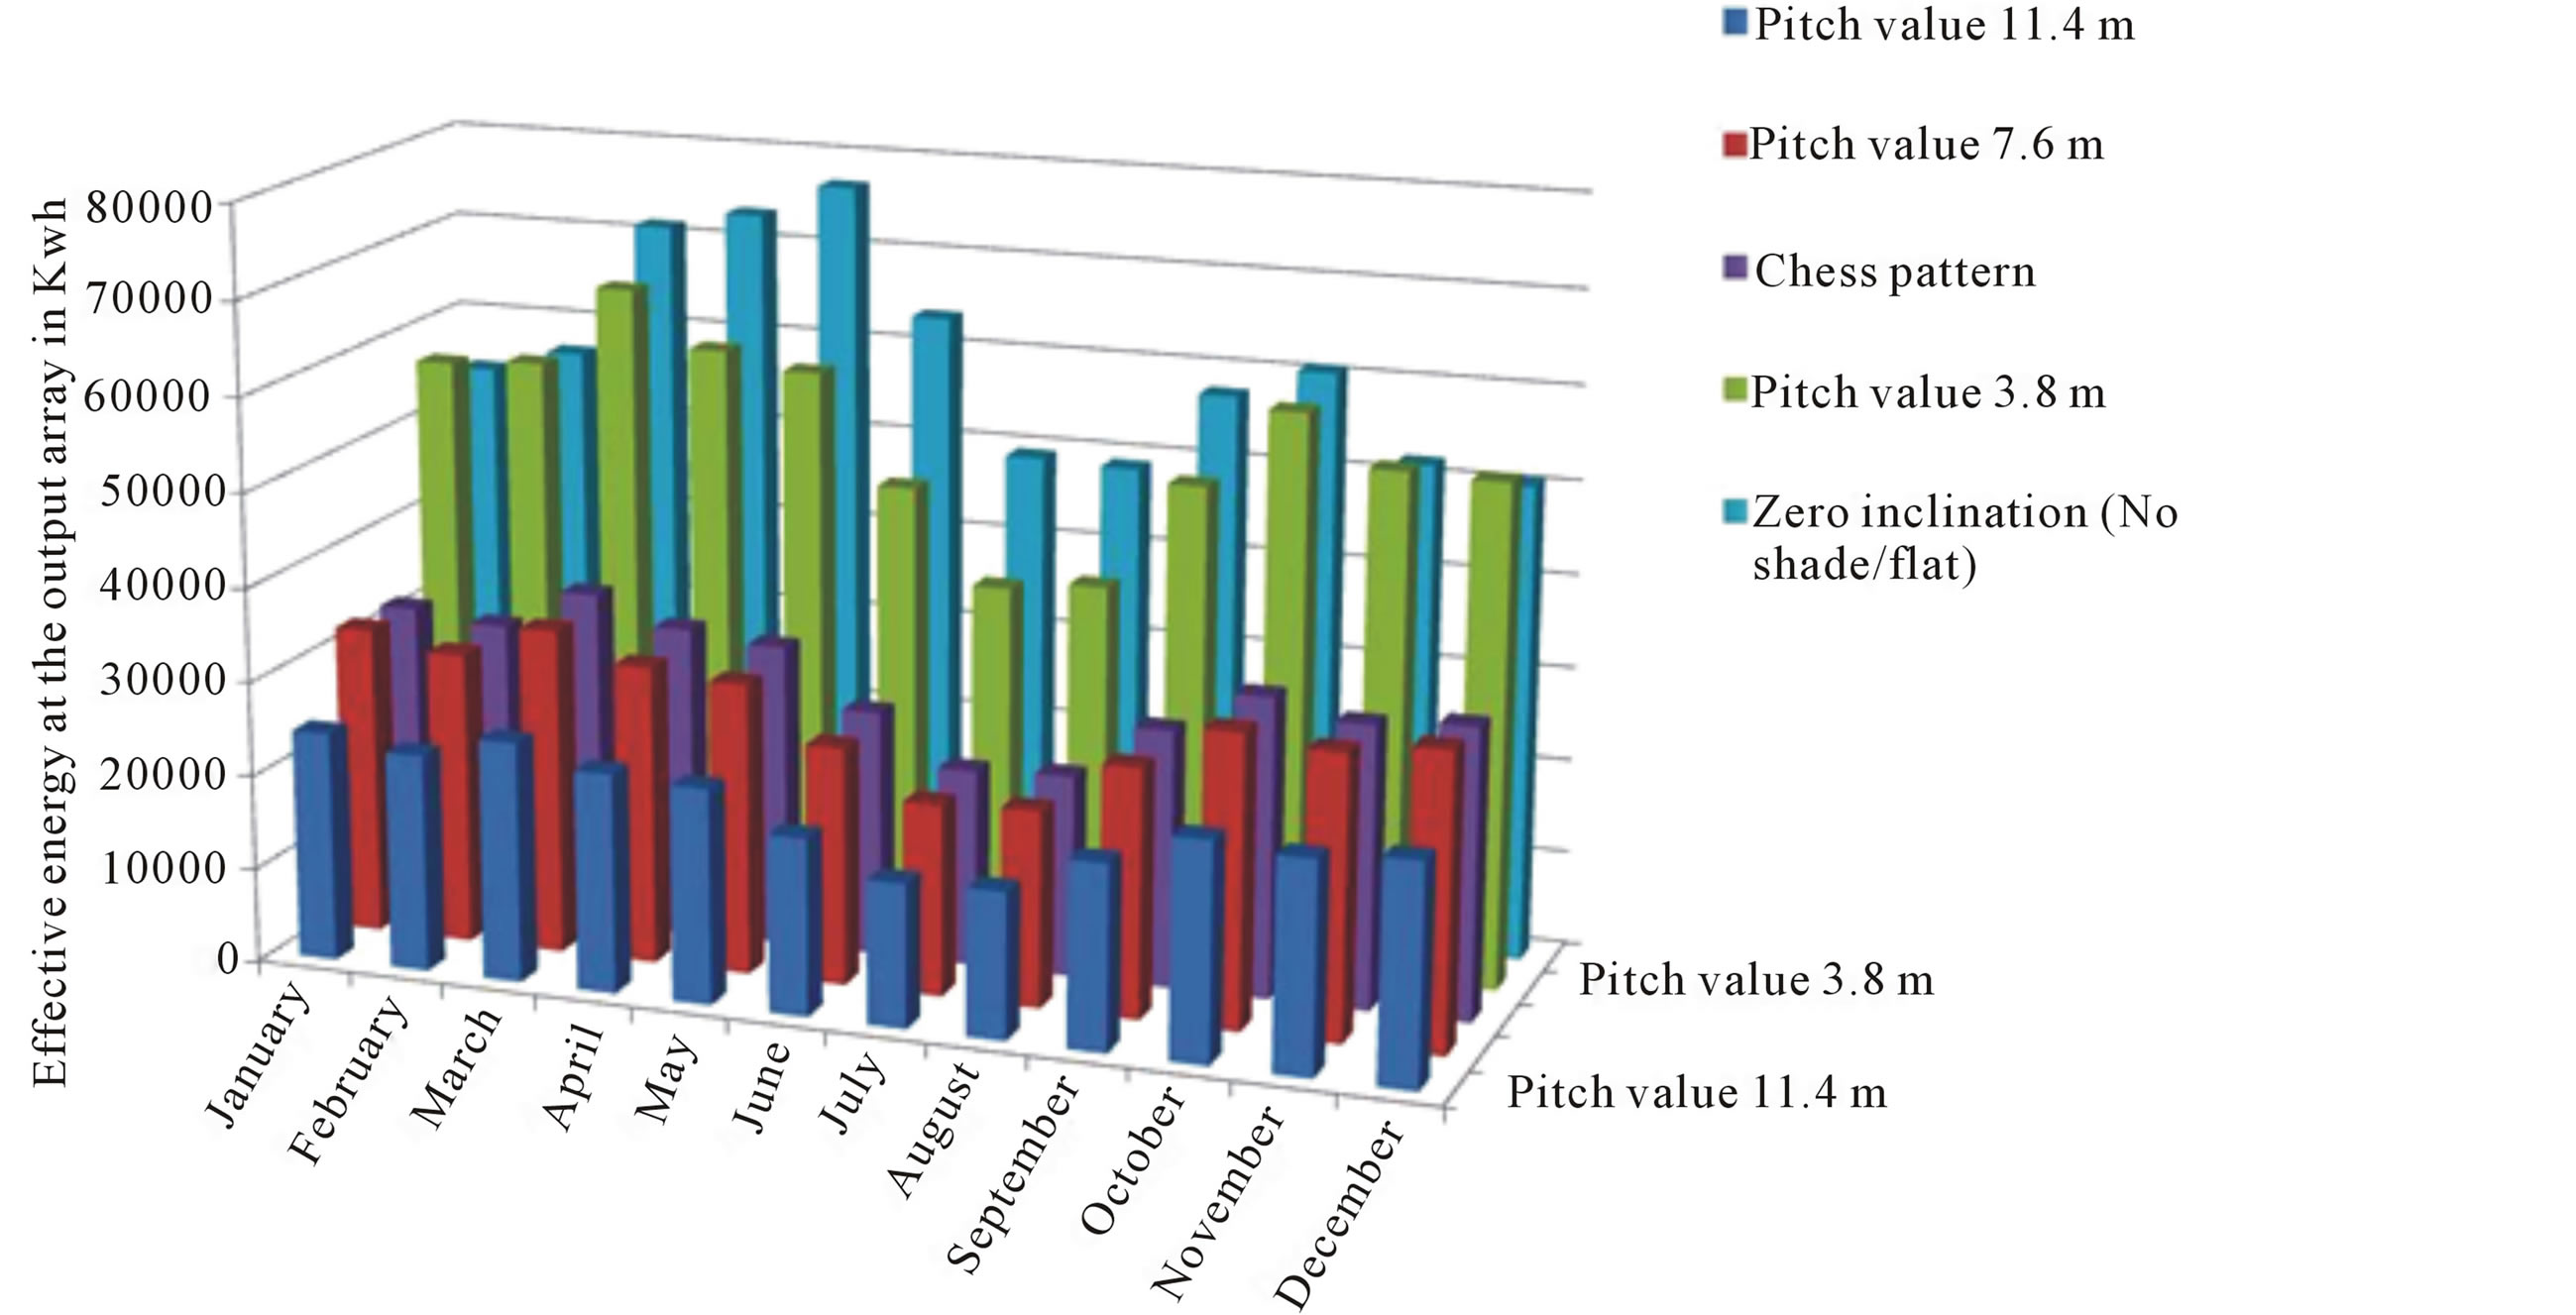
Figure 7. Annual solar energy generation—month wise for three cases—case-1, 2 and 3. Case-1 related to solar panels (1944 number) placed on the ground with zero inclination. Case-2 related to solar panels on the ground with 25˚ inclination with different pitch values of 3.8/7.6/11.4 m. Case-3 related to solar panels distributed on the ground with 25˚ inclination with chessboard like pattern.
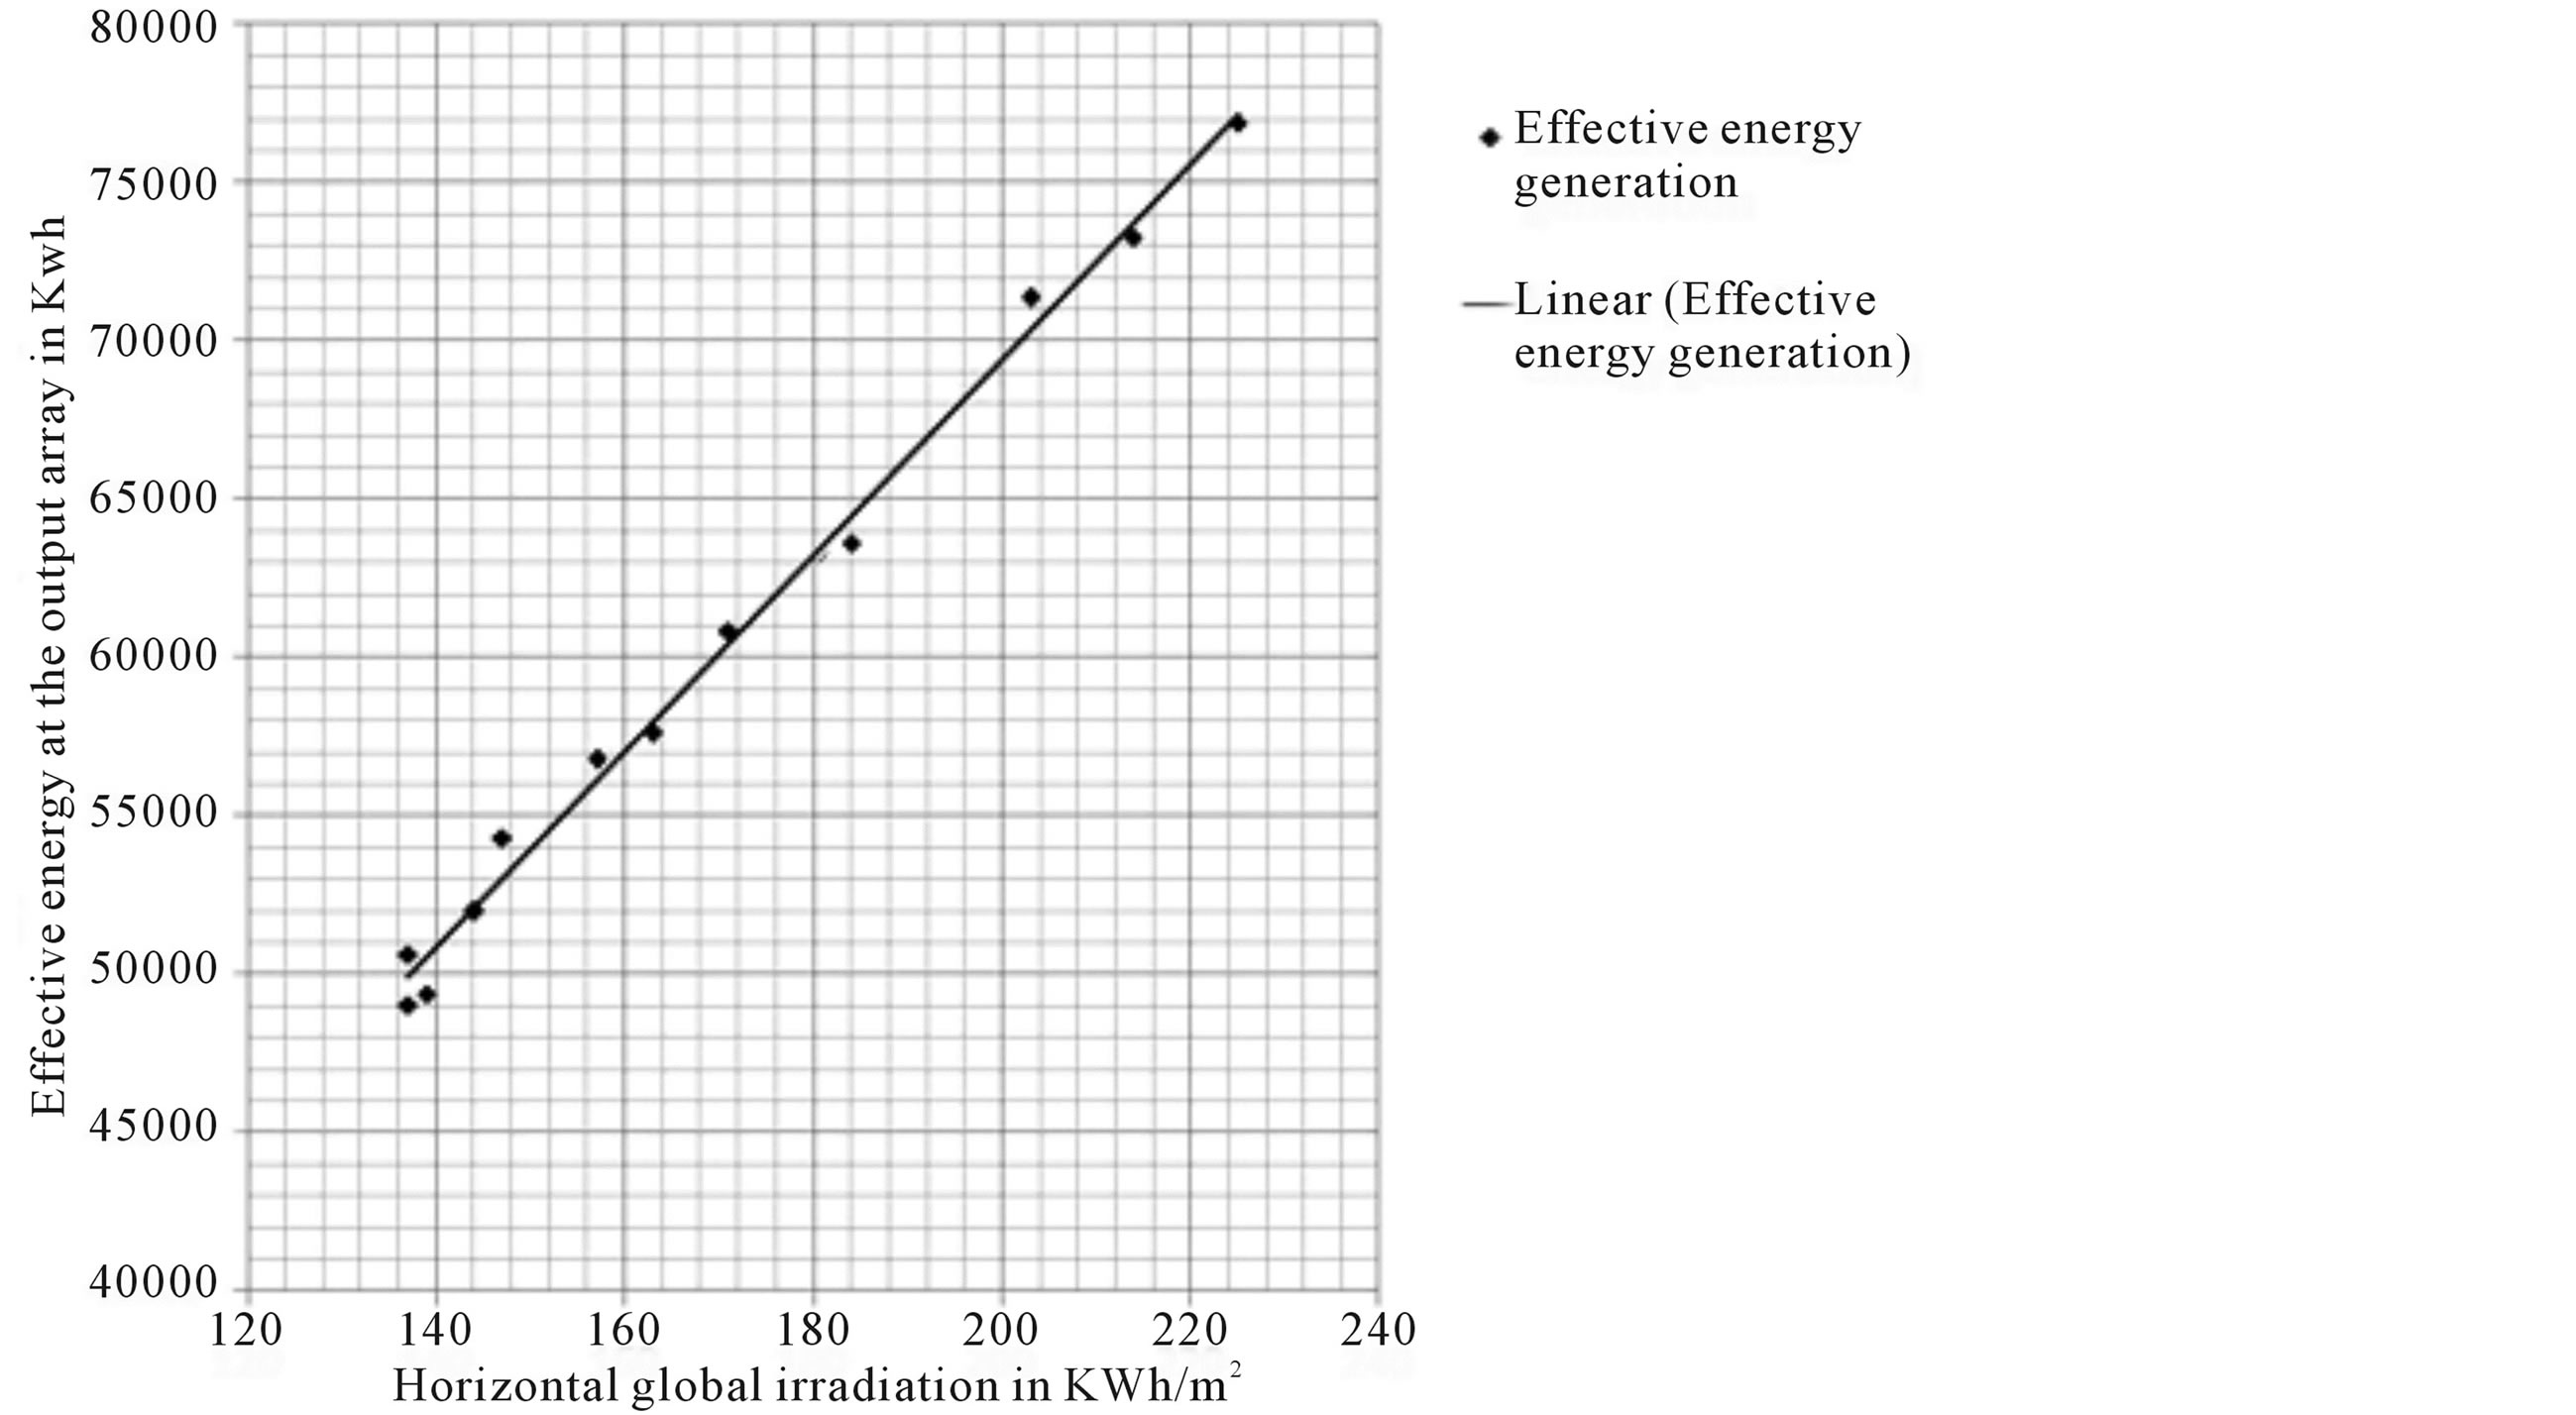
Figure 8. Effective energy of an array with horizontal global irradiation for the year 1990. A clear linear relation is observed between the two parameters.
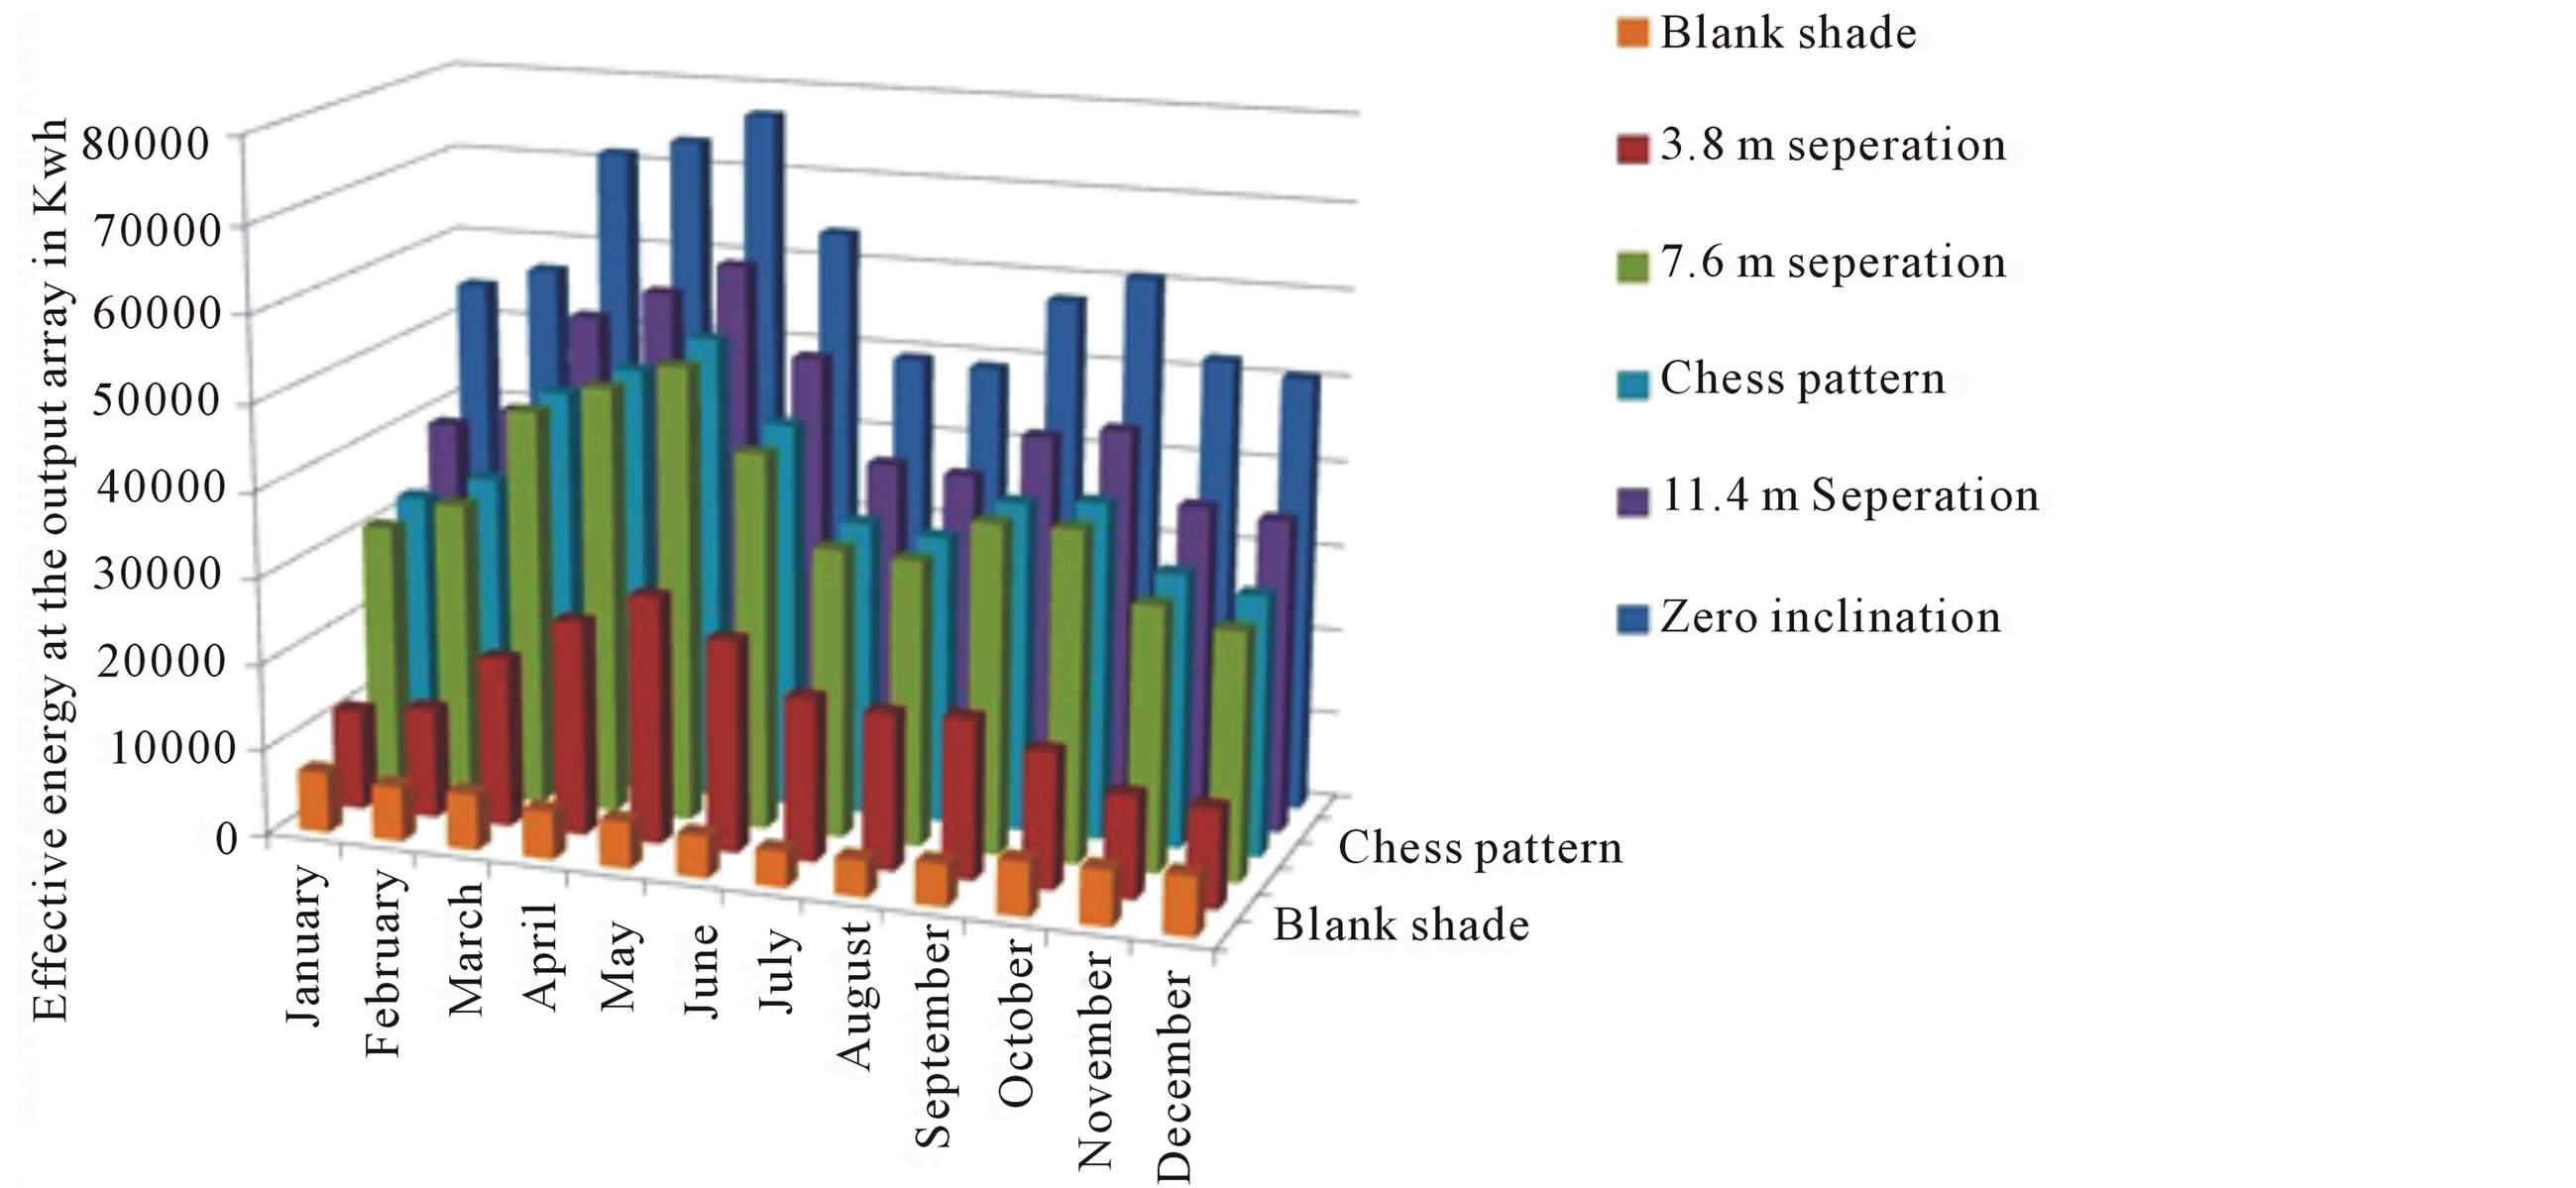
Figure 9. Annual energy generation-month wise for the cases 4, 5 and 6. Please also see Figures 2(d)-(f).
Majority of our villages are remotely located and devoid of electricity. Still more than 50% of our villages are not connected to power grid. For this purpose a new and affordable solution is provided through our present study as discussed in previous sections. The results presented due to different shades on the ground surface has clearly indicated that cultivable agricultural land can be used for production of solar energy without any serious ill-effects on the agricultural yield of any crop. A nominal decrease in solar radiation (sunlight) during mid day (20% to 25% reduction) on the plants, actually may increase the yield of the crop. The reasons for this are as follows. The reduction in the sunlight during the day is maximum close to the noon period. It is well documented and known that sunlight contains harmful ultraviolet A & B (UV-A & UV-B) rays. It starts reaching the earth surface between 11 am to 2 pm. It is proved by the agricultural scientists that reduction in UV helps the plants to grow well [16, 17]. Similarly a small reduction of 20% - 30% in temperature is also likely during the mid-day period. This small reduction will not affect the crops.
In our country south Indians eat rice as their staple food and majority of north Indians eat wheat as their staple food. For this purpose two states in each sector are chosen to study the global radiation and also the average temperature for different months [18]. For this purpose Andhra Pradesh, Tamil Nadu, are chosen in south India as majority of farmers grow rice in their fields and Uttar Pradesh and Punjab are chosen in north India as majority of farmers in these states grow wheat.
In Figure 11 the average temperature for the four different states are shown and in Figure 12 the average global irradiation are presented for each month. It is known that during April to September months majority of farmers grow rice crop in Andhra Pradesh and Tamil Nadu [19,20] and it is known that during October to March months, the wheat crop is grown in Uttar Pradesh and Punjab [21]. It is argued here that setting up of solar panels above the ground of the agricultural fields will actually helps to grow more due to reduction in UV-A and UV-B rays and slight reduction in temperature during mid-day in these states [22-24]. While these conclusions are based on the simulation studies, one need to make a real estimation during the crop season at representative location in rice fields of Andhra Pradesh and Tamil Nadu and, and also in Uttar Pradesh and Punjab. Experiments need to be conducted on crops using 11.4 m separated solar panels, 7.6 m separated solar panels and more importantly the chess board pattern like solar panels fixed at a height of 5 m above the cultivated land.
5. Conclusion
It is well known to all that most of our villages are suffering from lack of electricity. Due to this reason farmers are unable to get sufficient water for cultivation. It in-
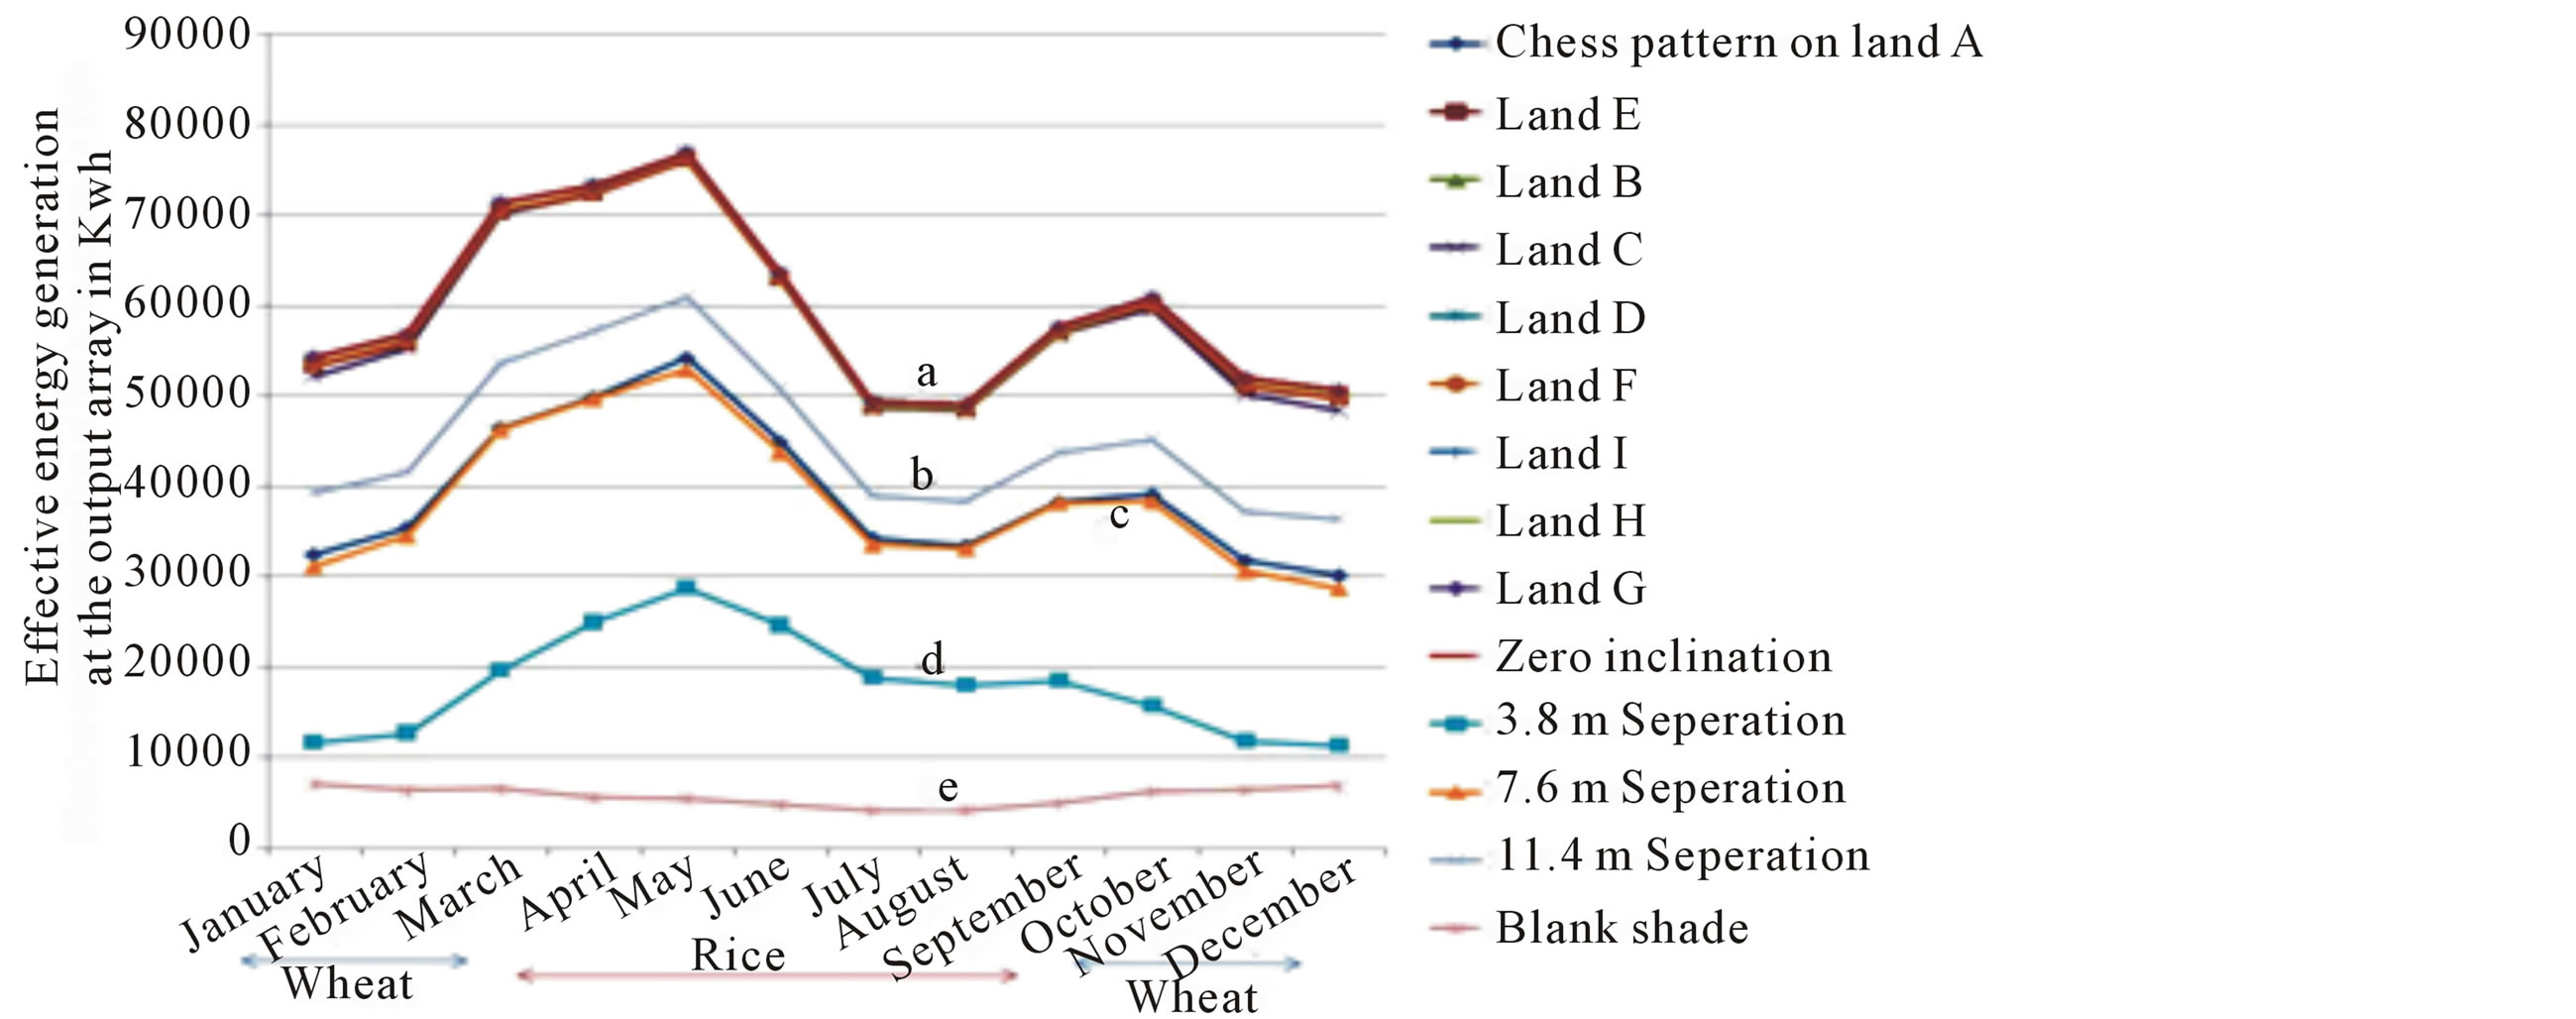
Figure 10. Annual solar energy generation month wise without shade on one acre of land in Ahmedabad region and for the shade over the lands ABCDEFGH and I. Land A has the solar panels (1944 numbers) with the shade at the height of 5 meters above the ground (see curve A). The set of curves shown B in the fig provide information of solar energy generation for the lands B to I due to the shade over the land A.
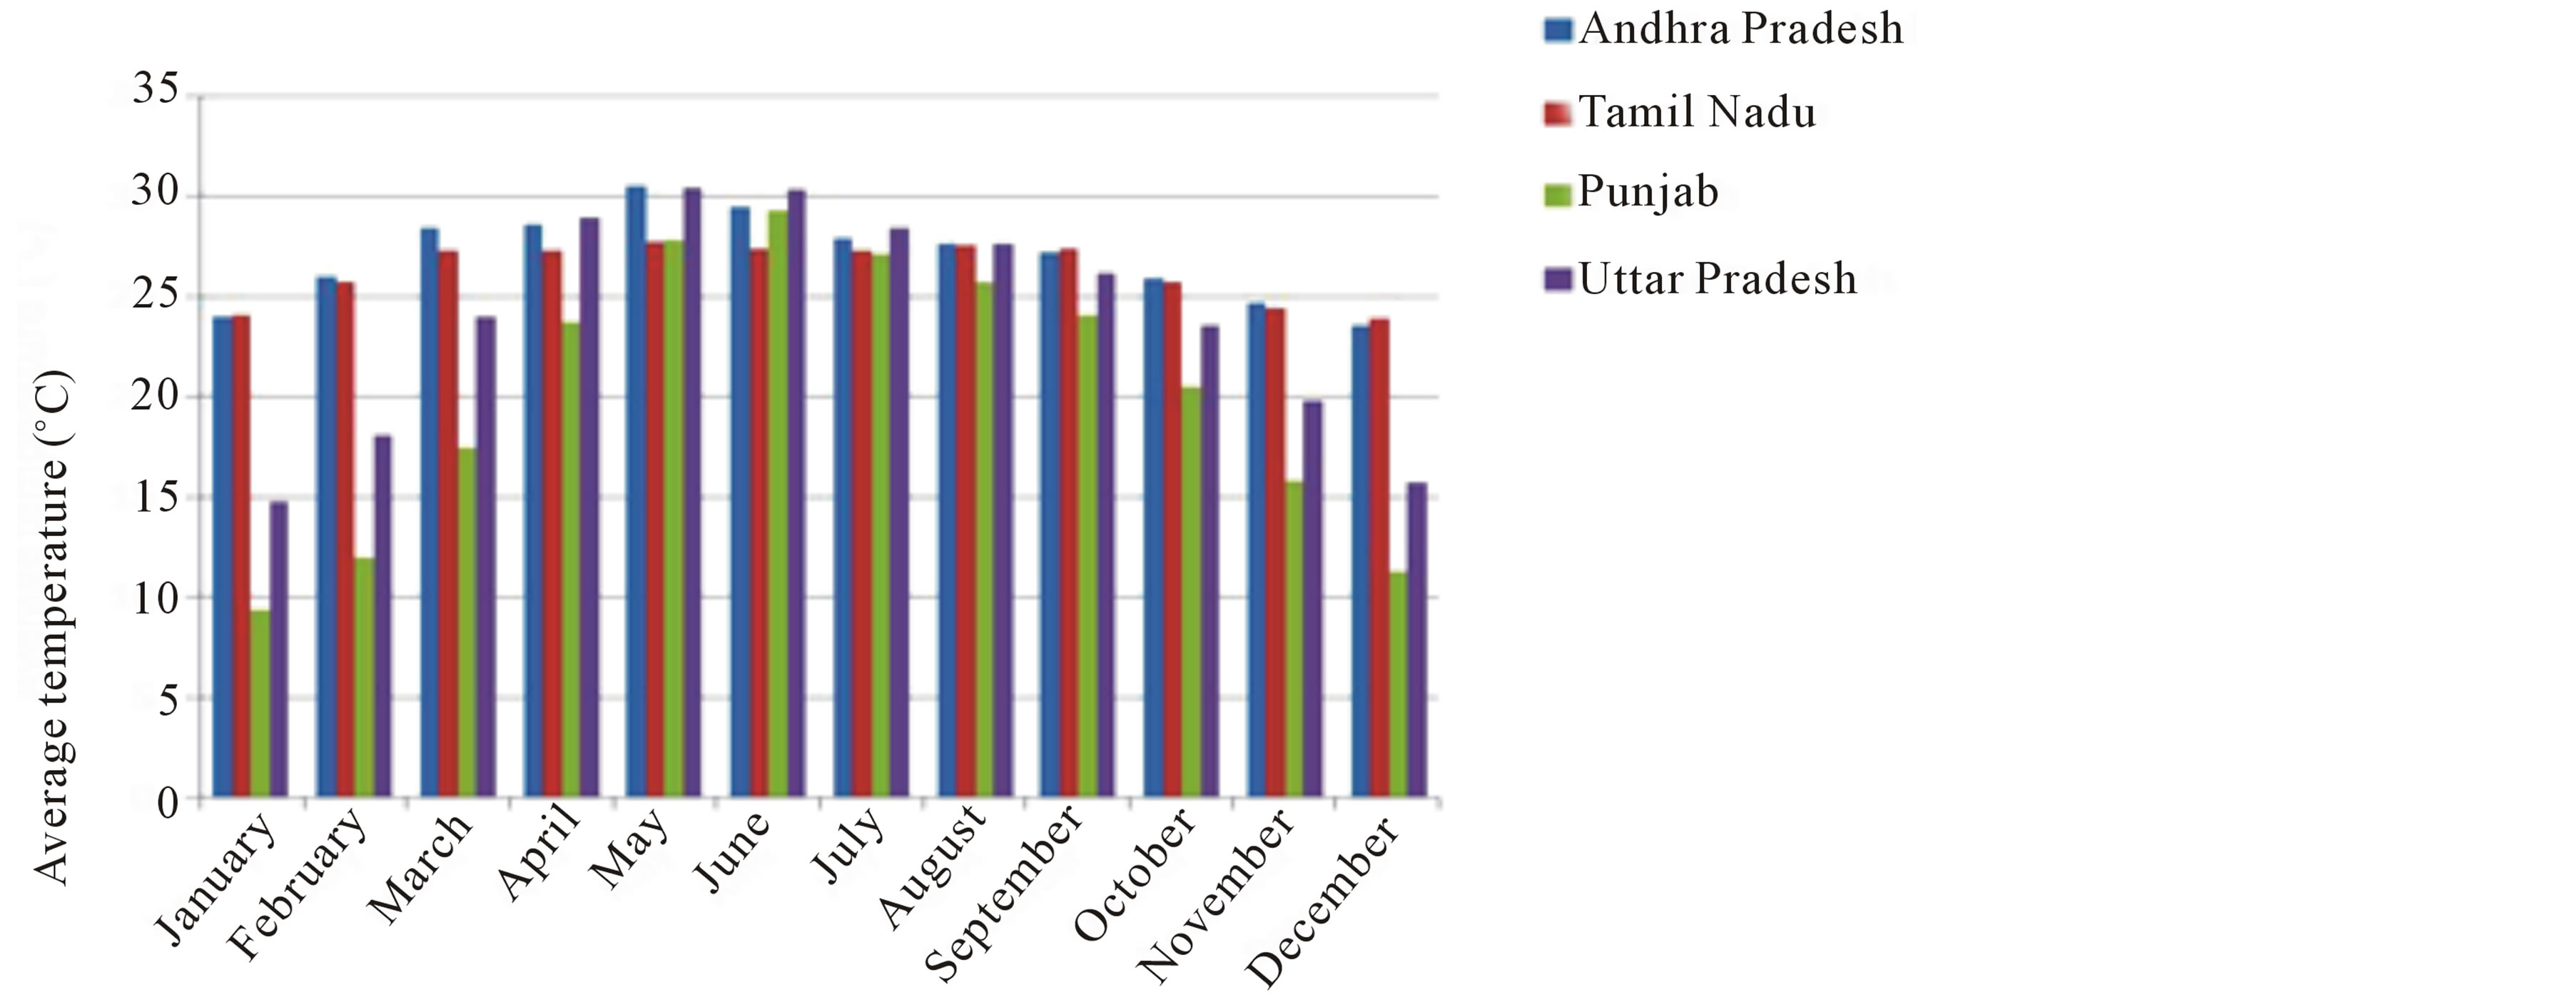
Figure 11. Annual average temperature shown in degree centigrade-month wise for four different representative states for rice (Andhra Pradesh and Tamil Nadu) and for wheat (Uttar Pradesh and Punjab).
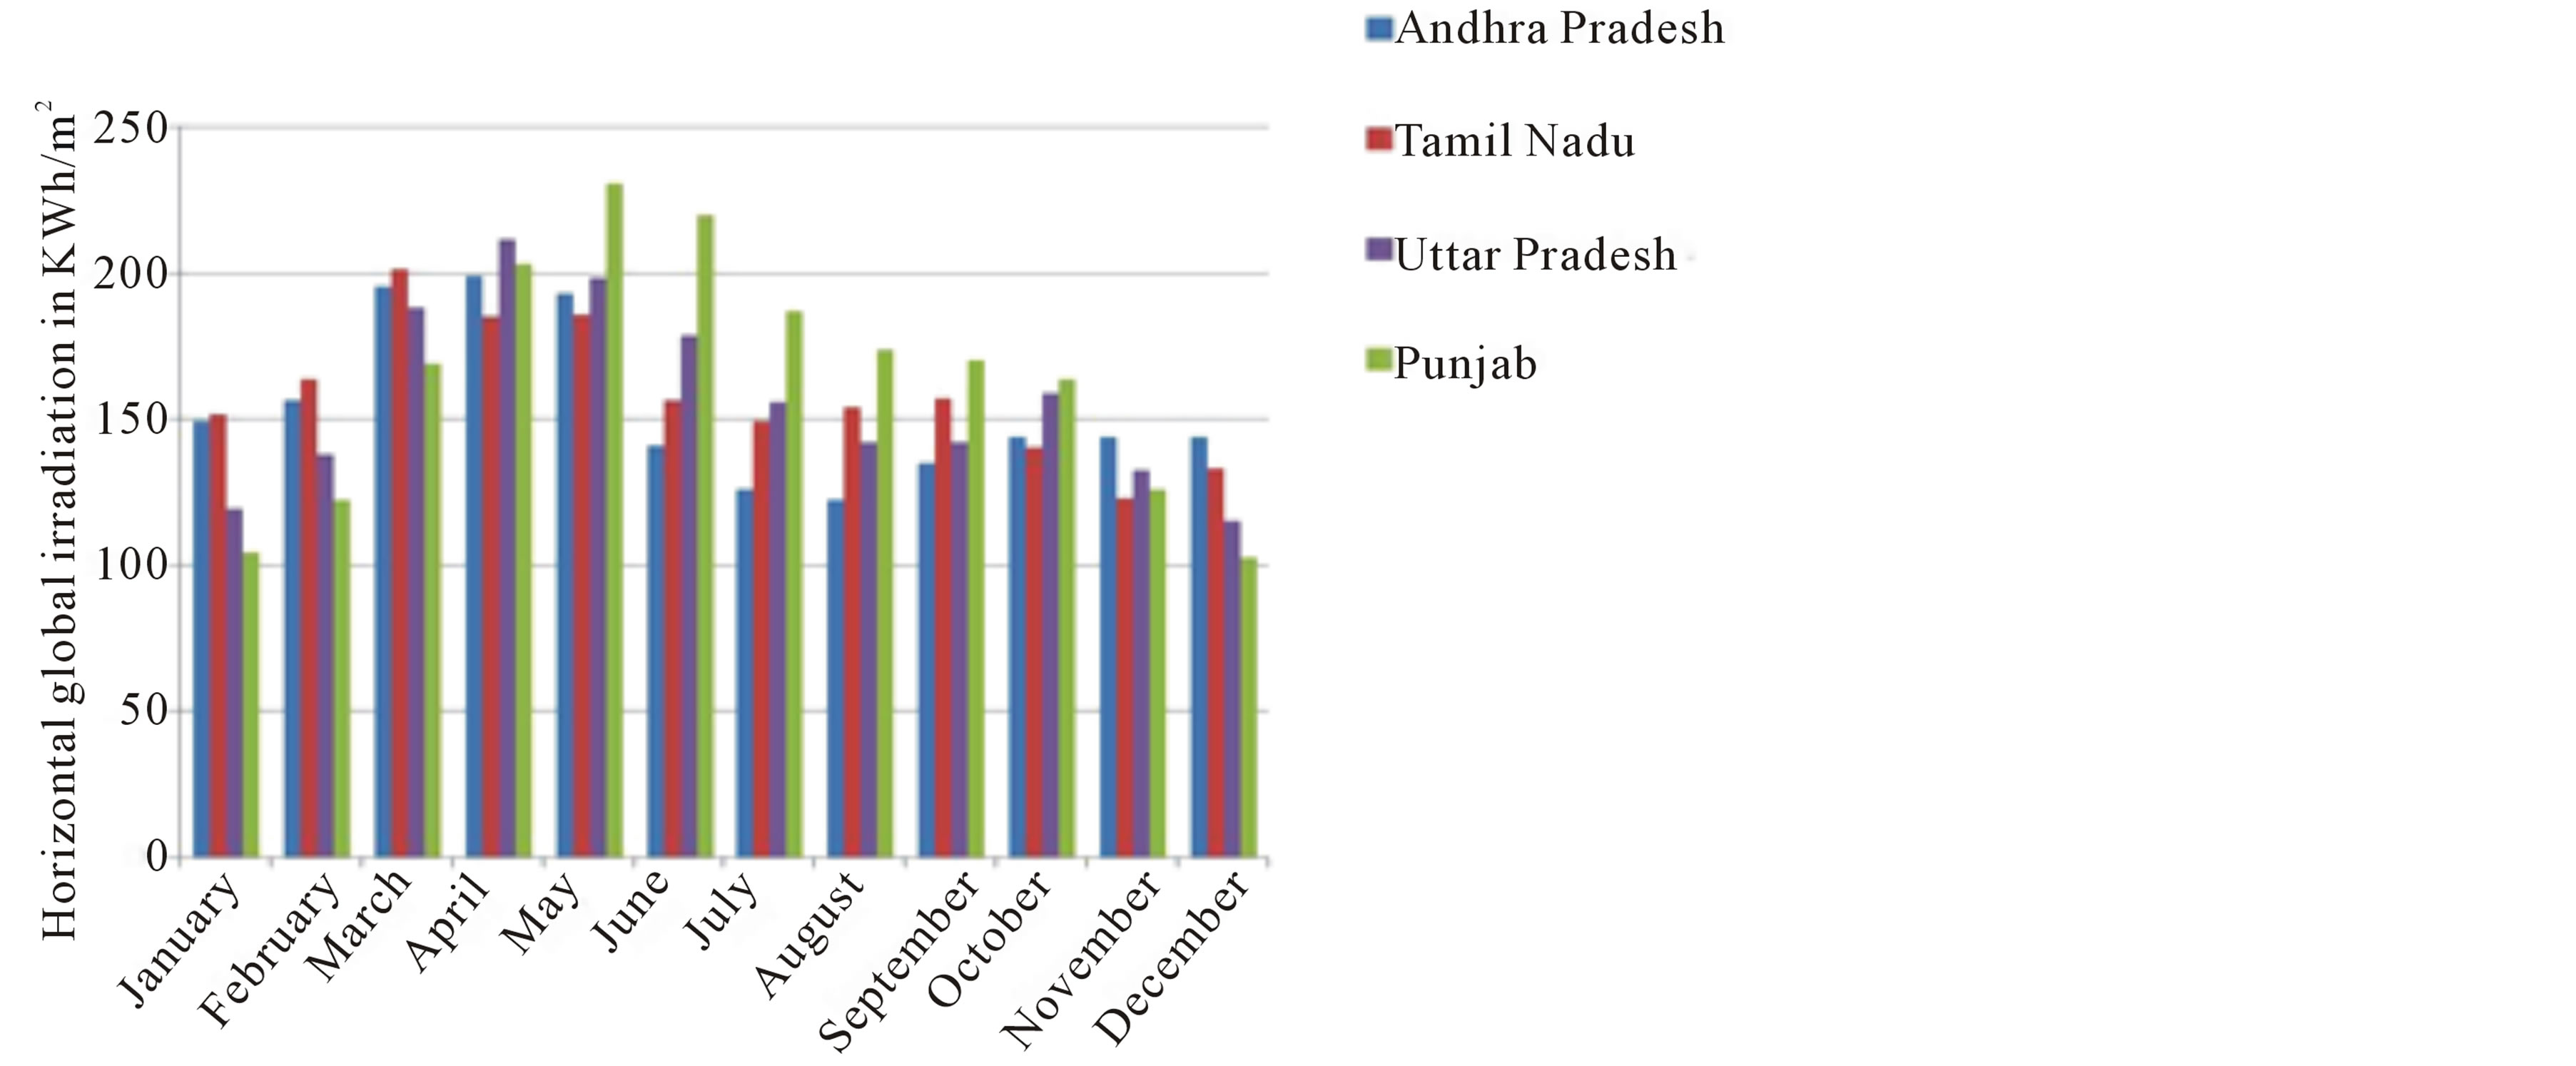
Figure 12. Annual horizontal global irradiation shown in KWh/m2. mth-month wise for 4 different representative states for rice (Andhra Pradesh and Tamil Nadu) and for wheat (Uttar Pradesh and Punjab).
volves huge expenditure for the governments to create infrastructure with transmission lines to remotely located villages. An affordable and innovative solution is presented in this paper to help major population of Indian community, namely the neglected farmer community. Through modeling studies, it is shown here that solar panels elevated at 5 m height above the cultivated land with 7.6, 11.4 m pitch values and also the solar panels arranged like chess board pattern with air gaps between the set of solar panels are more suitable. A reduction of 20% - 25% of sunlight for 11.4 m separated panels is observed. Similarly, 25% - 30% reduction for 7.6 m and chess pattern shades, 60% - 80% reduction for 3.8 m separated panels in Sunlight is inferred from modeling studies. Accordingly, it is recommended to install solar panels with 7.6 m or 11.4 m separation or chess board pattern is recommended as there will be small reduction in sunlight. Even this small reduction of sunlight on crops is limited to mid-day period and thus helps to reduce UV-A and UV-B radiation. It is expected that this reduction in sunlight near noon time may help the plant to grow more and give better yield. In fact, even if it affects, this can easily be rectified by placing the concave lenses in the air gaps between the solar panels to increase the sunlight. In any case, farmer is the most beneficiary as he will be using his land for dual purpose, namely, to continue the cultivation normally on the ground surface and also use his land to generate power that can be used by him for motor pumps to get water for the crops. The present idea, if implemented properly, our farmer community will be benefited for his cultivation and also help us to reach our goal of energy security. Another incentive to the farmer is that he can earn by lending his land for power generation. Thus it is a win-win situation for both the farmer and the power industry developer. The power generated from his land can be used by the farmer on priority. Excess energy from his land can be connected to the main power grid or to the micro grid such that his village is also benefitted.
Acknowledgements
We would like to thank all the scientists of solar group of GERMI for fruitful discussions. Special mention goes to Dr. Omkar Jani, Sri Sagar Agarvat, Sri Shailesh Patel, Sri Souvnik Roy. The second author would like to thank the Director, GERMI and Sri Prashant Gopiyani for selection, initiation and coordination of this project. We would like to thank Sri Tapan Ray, VCMT, GERMI and Sri D. J. Pandian, the Chairman, GERMI for their continuous encouragement to research.
REFERENCES
- A. D. Goswami, “India’s Solar Sunrise,” Renewable Energy Focus, Vol. 13, No. 2, 2012, pp. 28-30.
- K. Borah, S. Roy and T. Harinarayana, “Optimization in Site Selection of Wind Turbine for Energy Using Fuzzy Logic System and GIS—A Case Study for Gujarat,” Open Journal of Optimization, Vol. 2, No. 4, 2013, p. 116. http://dx.doi.org/10.4236/ojop.2013.24015
- Ministry of New and Renewable Energy, Government of India, “Jawaharlal Nehru National Solar Mission: Towards Building SOLAR INDIA,” 2009. http://www.mnre.gov.in/file-manager/UserFiles/mission_document_JNNSM.pdf
- A. Shankar, “The Gazette of India RESOLUTION: No.23/40/2004-R&R (Vol. II),” New Delhi, 2005. http://www.powermin.nic.in/whats_new/national_electricity_policy.htm
- “2020 Routemap for Renewable,” Energy in Scotland, The Scottish Government, p. 121. http://www.scotland.gov.uk/Resource/Doc/917/0118802.pdf
- “Philippines Plans to Reach 100% Renewable Energy within 10 Years,” 2013. http://www.the9billion.com/2013/07/01/philippines-plans-to-reach-100-renewable-energy-within-10-years/
- S. Oyedepo, “Efficient Energy Utilization as a Tool for Sustainable Development in Nigeria,” International Journal of Energy and Environmental Engineering, Vol. 3, 2012, p. 11.
- P. Sharma and T. Harinarayana, “Enhancement of Energy Generation from Two Layer Solar Panels,” International Journal of Energy and Environmental Engineering, Vol. 3, 2012, p. 12. http://dx.doi.org/10.1186/2251-6832-3-12
- P. Sharma and T. Harinarayana, “Solar Energy Generation Potential along National Highways,” International Journal of Energy and Environmental Engineering, Vol. 4, 2013, p. 16. http://dx.doi.org/10.1186/2251-6832-4-16
- University of Geneva, “User’s Guide, PVsyst Contextual Help,” 1994-2010. www.pvsyst.com
- F. M. Ali-Nezhad and H. Eskandari, “Effect of Architectural Design of Greenhouse on Solar Radiation Interception and Crops Growth Conditions,” International Journal of Agriculture and Crop Sciences, Vol. 4, No. 3, 2012, pp. 122-127.
- S.-C. Lee, et al., “Effect of Far-Infrared Radiation and Heat Treatment on the Antioxidant Activity of Water Extracts from Peanut Hulls,” Food Chemistry, Vol. 94, No. 4, 2006, pp. 489-493. http://dx.doi.org/10.1016/j.foodchem.2004.12.001
- Google Earth pro v7.02013. http://www.google.com/enterprise/mapsearth/products/earthpro.html
- Pv Syst. Software, “NASA-SSE Satellite Data,” Release 6, 1983-1993.
- Global Meteorological Database, “Meteonorm, Switzerland,” version 6.1.0.23, 2012. www.metonorm.com
- S. V. Krupa and H. J. Jager, “Adverse Effects of Elevated Levels of Ultraviolet (UV)-B Radiation and Ozone (O3) on Grop Growth and Productivity,” Natural Resources Management and Environment Department, 1996. http://www.fao.org/docrep/w5183e/w5183e09.htm
- F. Bazzaz and W. Sombroek, “Global Climate Change and Agricultural Production,” Chapter 7—Adverse Effects of Elevated Levels of Ultraviolet UV (B) Radiation and Ozone on Crop Growth and Productivity, No. W5183, John Wiley & Sons Ltd., 1996. http://www.fao.org/docrep/W5183E/W5183E00.htm
- A Report on Agoro Metorology, “Temperture and Plant Growth,” TNAU Agritech Portal, Tamilnadu Agricutlral University, Coimbatore, 2013. http://www.agritech.tnau.ac.in/agriculture/agri_agrometeorology_temp.html
- C. Cheralu, “Status Paper on Rice in Andhra Pradesh,” 2013. http://www.rkmp.co.in/sites/default/files/ris/rice-state-wise/Rice%20State%20Wise%20Andhra%20Pradesh_0.pdf
- Rice in Tamil Nadu, “Main Regions and Seasons,” 2013. http://advanceagripractice.in/crop-locations/rice-in-tamilnadu/
- “TNAU Agritech Portal: Crop Improvement,” Seasons, 2013. http://www.acx.in/crop/wheat.html
- A. Balasubramainam, “Microclimate and Its Utilization in Indian Farming,” ILEIA, Vol. 3, No. 3, 1987, p. 9.
- C. Campillo, R. Fortes and M. H. Prieto, “Solar Radiation Effect on Crop Production,” Chapter 11, 2010, pp. 167- 194. www.intechopen.com
- V. Janet and P. K. Sharma, “Photo Inhibition and Photosynthetic Acclimation of Rice Plants Grown under Different Light Intensities and Photo Inhebited under Field Conditions,” Indian Journal of Biochemistry & Biophysics, Vol. 46, 2009, pp. 253-260.
NOTES
*Corresponding author.