Smart Grid and Renewable Energy
Vol.4 No.6(2013), Article ID:36572,13 pages DOI:10.4236/sgre.2012.46050
A Realistic ICT Network Design and Implementation in the Neighbourhood Area of the Smart Grid
![]()
School of Computer Science, The University of Manchester, Manchester, UK.
Email: pourmirz@cs.man.ac.uk, john.brooke@manchester.ac.uk
Copyright © 2013 Zoya Pourmirza, John M. Brooke. This is an open access article distributed under the Creative Commons Attribution License, which permits unrestricted use, distribution, and reproduction in any medium, provided the original work is properly cited.
Received June 1st, 2013; revised July 1st, 2013; accepted July 8th, 2013
Keywords: Smart Grid; ICT Network; Neighbourhood Area Network; Communication Architecture; Monitoring and Control; Software Architecture
ABSTRACT
The Smart Grid has three main characteristics, which are to some degree antagonistic. These characteristics are: provision of good power quality, energy cost reduction and improvement in the reliability of the grid. The need to ensure that they can be accomplished together demands a much richer ICT monitoring and control network than the current system. In this paper we particularly investigate the design and deployment of the ICT system in the urban environment, specifically in a university campus that is embedded in a city, thus it represents the Neighbourhood Area Network (NAN) level of the Smart Grid. In order to design an ICT infrastructure, we have introduced two related architectures: namely communications network architecture and a software architecture. Having access to the characteristics of a real NAN guides us to choose appropriate communication technologies and identify the actual requirements of the system. To implement these architectures at this level we need to gather and process information from environmental sensors (monitoring e.g. temperature, movement of people and vehicles) that can provide useful information about changes in the loading of the NAN, with information from instrumentation of the Power Grid itself. Energy constraints are one of the major limitations of the communication network in the Smart Grid, especially where wireless networking is proposed. Thus we analyse the most energy efficient method of collecting and sending data. The main contribution of this research is that we propose and implement an energy efficient ICT network and describe our software architecture at the NAN level, currently very underdeveloped. We also discuss our experimental results. To our knowledge, no such architectures have yet been implemented for collecting data which can provide the basis of Decision Support Tools (DSTs).
1. Introduction
In recent years the conventional power grid faces difficulties due to the lack of intelligence, energy crisis and environmental degradation. Consideration of these issues led to the birth of the Smart Grid. According to the US Department of Energy (DOE) [1] desirable characteristics of the Smart Grid have been identified as; self-healing, consumer friendly, reliable with good power quality, and resistant to cyber-attack. It should also be able to accommodate all the storage and generation options and facilitate new service and markets. The Smart Grid proposes to accomplish the mentioned goals by incorporating Information and Communication Technology (ICT) in the power network to bring more intelligence to the Grid. Intelligence here addresses the ability to monitor and control a range of industrial appliances and functional components to optimize energy generation and consumption [2].
The Smart Grid can be viewed as resembling the internet [3]. Instead of uploading and downloading data, customers upload and download electricity. Rather than using a modem representing the data usage, the customers have smart meters indicating the electricity they use or generate and the price accordingly.
As mentioned earlier, the Smart Grid is the integration of a power network and a communication network to meet the future needs of energy. A power Grid, responsible for transmitting the energy from generation point to the customers, consists of three layers; generation, transmission, and distribution. Similarly, the current proposal for the communication network, responsible for collecting and routing data between different sectors in power Grid, has three layers; Wide Area Network (WAN), Neighbourhood Area Network (NAN), and Home Area Network (HAN) [4]. The WAN covers the generation, transmission, and distribution network of the power Grid. The NAN and HAN covers the rest of the distribution grid ending in the consumer premises.
Until now most research has focused on monitoring and controlling at the WAN and HAN levels. By contrast we have particularly investigated the monitoring of the NAN, and describe how it is being implemented in a test bed of monitoring devices installed in a 6.6 kV sub-Grid on a university campus. Until now it is not understood how a NAN functions as a Grid, thus NANs are controlled from higher levels. Our research aims to provide such monitoring architecture at the NAN level of the Grid.
In this paper we have considered two related architecture within the ICT in frastructure, namely communication network architecture and a software architecture. The former encompasses the networking aspects of the NAN and considers energy efficiency of the communication system. The proposed architecture is based on hybrid communication technologies which integrate sensing, computation and decision-making to enable control and prediction of the future state of the sub-Grid in the realtime. A Wireless Sensor Network (WSN) is considered as an essential component of the monitoring function. The WSN is responsible for monitoring and collecting real-time data from the field. It will send live data to a NAN Control Unit (NCU) to provide more accurate prediction. These sensors are envisaged to be battery powered and have power shortage problems. Our communication network design is targeted towards the solution of two key problems. The first is the energy constraint problem of general WSN. The second problem addresses the weaknesses of a centralized architecture where data collected from the entire system are stored at a sub-Grid database, where controls are applied.
The second architecture is the software architecture, this describes how we will process and analyse data gathered by the communication system. This is the architecture that will be responsible for the control of the NAN and for integrating different NANs to provide information to higher layers of the Grid.
Three key points of our approach are: firstly we distinguish the communication architecture and software architecture. Secondly we address how monitoring and data processing needs in a NAN could be met. Thirdly we are deploying our architecture in a real NAN environment namely The University of Manchester campus sub-Grid. This is similar to the size and complexity of a NAN in an urban distribution Grid.
The remainder of this paper is organized as follows: Section 2 presents the background research. Section 3 presents our proposed communication architecture and issues of its deployment on the actual experimental test bed. Section 4 surveys available communication technologies and describes our choices. Section 5 discusses the software architecture and analyses its response in a series of emergency scenarios. Finally, section 6 summarises the current status of our work.
2. Background
In this section, we discuss the available intelligent monitoring in place and general issues of what needs to be added to the power Grid to convert it to the Smart Grid.
We have applied principles from the theory of distributed computing systems, such as locality (attempting to process information locally as much as possible), scalability, fault tolerance, and minimisation of communication. We have utilised work on monitoring and control of other types of distributed networks, such as water distribution Grids [5-7]. The water distribution Grid in the UK has a modular structure, being divided into District Metered Areas (DMAs) that can be controlled in isolation from the rest of the network. A DMA is similar to the size of a NAN in the electrical distribution grid. An example of the water grid that uses sensor data for monitoring purpose is the Neptune project1. Our work extends this approach to the electrical Grid where the monitoring systems take account of much more rapid changes in the state of the network (seconds rather than hours).
Another similar study [8] describes the flood monitoring system which allows the integration of the WSN and the remote fixed-network for computationally-intensive tasks and as well as performing on-site grid computation to support timely prediction and flood warning. This system is able to adapt to different network topology and switch from low power physical network to high power consumption physical network. These adaptations are based on awareness of data about the internal system. However, monitoring the external environment also offers useful information that can support better adaptation of the system. In our proposed ICT architecture we have utilised both internal information such as electrical attributes and external information such as weather, light, and other environmental data to support better control of the NAN.
In electrical distribution grid, the SCADA (Supervisory Control and Data Acquisition) that provides communication infrastructure across the electrical grid from 11 kV to 132 kV is used as the intelligent monitoring system in place. Yang et al. [9] explained the implementation of SCADA in the Distribution Network Operators (DNOs). This system contains a master terminal and many Remote Telemetry Units (RTUs). The RTUs are responsible to gather network measurements from the grid and transmit commands to control devices, and the master node. The master node is located at the control centre of the DNO and is in charge of processing and storing the received data. There can be a heterogeneous communication channels and various physical medium between the RTUs and the master terminal. In this system the up-to-date data are sent every 10 - 20 seconds to the control centre, which means it cannot provide continues data delivery and real-time applications. Therefore, in our architecture, the substation data are sensed and transmitted 1 to 4 times a second. Moreover, some control functions for DNO management require low latency such as millisecond to several second. While the SCADA supports operations from few seconds to a few hundred second [10]. Additionally, it has been observed that SCADA has limited data update rate from few hundred bits per second to few thousand bits per second [11]. These facts make SCADA inappropriate to support realtime applications and fast acting control functions. The other limitation of this system is that it fails to monitor the whole sub-Grid, and only monitors the critical areas of the network.
Our architecture, like others such as [2,11] uses sensor networks instead of SCADA. We propose to collect three sources of information: from the environment, from the electrical network and from consumption data via metering.
If all this information across the whole Grid is collected at a single database, we face the problem of information overflow. Thus we adapt clustering methods developed in studies of sensor networks [12-14]. Further more, we follow recent studies in the Smart Grids [9,15, 16] in developing distributed control at the NAN level.
Published surveys of available communication technology [17,18], confirmed our initial analysis that it is not feasible to use one single technology for the whole grid and heterogeneous communication technologies should be provided. Since we do not assume that sensors can necessarily be powered from the power network itself energy efficiency is a major driver in the design of our communication architecture. This assumption was confirmed in the practical implementation decisions we made in developing the University campus NAN monitoring.
3. Communication Network Architecture Design
We now analyse the communication architecture in terms of networking aspects and energy efficiency.
3.1. Related Work
In our design, energy efficiency is a prime driver. We have also used a combination of centralized and distributed approach. By contrast [19] proposed the Gossip algorithm which is a distributed approach to provide fault tolerance and guarantee the delivery of the messages. Gossiping can provide robust communication for the subGrids and it is a good choice when the global view of the network is not available or the real-time data is not needed. Therefore it is not the optimal solution for our proposed architecture since we know the topology of our test bed. Knowing the addresses of the devices and using direct communication will prevent hand shaking before establishing connections. This will result in consuming less communication energy. Moreover, time to fulfill thorough message dissemination in Gossip algorithm depends on the graph connectivity, whereas in our architecture we need to support real-time data.
The design of a client server architecture for the Smart Grid using TCP/IP for information transmission has been discussed in [20]. The first difference between this design and our proposed design is that they have not considered the monitoring and control of the NAN in detail. The other main difference is in the design of the server side of the architecture which has a central controller containing a database, whereas we have proposed an architecture utilising distributed data centres communicating in a peer to peer fashion.
Aalamifar et al. [21] use the network simulator-2 to propose a three layer hierarchical communication architecture as an economic architecture for the smart grid utilising power line communication technology. The difference between this work and our proposed architecture is the integration of hierarchical and peer-to-peer architecture which will be discussed later in this section. Moreover, in reality we have experience that a hybrid communication technology (wired and wireless) should be used to improve the reliability of the communication network in the electrical grid.
Another three layer ICT architecture has been proposed [22], which utilities various communication technologies within and between each layer of the architecture. These three layers are AMR networks layer, AMI networks layer, and AMI + networks. Then they have classified the communication network into Consumer Premises Networks (CPNs), Neighbourhood Area Network (NAN), Access Area Network, Backhaul Network, Core and Office Network, and External Access Networks. The main difference between our communication network design and this research is that in this research the substation monitoring is located in the core network, whereas our substation monitoring is located in the NAN which offers information that has not previously been collected. The other difference is that in our architecture we are not only monitoring the electrical attributes which are collected through smart meters and substation monitoring devices, but also we are collecting information about external systems such as environmental data.
Another study [23] suggested three layers architecture for an ICT in the Smart Grid. The first layer is the local area network (WLAN) utilising Wi-Fi to provide communication inside the data centres and between metering devices to the next layer. The second layer is metro network (WMAN) using WiMAX providing the communication between data centres and transmission substations to the utility generators. The final layer is the wide area network (WAN) utilising fibre optic between utility generators and the data centre utility control. The energy efficiency of the communication system is not considered in this research.
A recent work published in 2013 proposes a hybrid network architecture integrating a wired infrastructure, WSN, and a PLC for the Smart Grid [24]. It is divided into three subsystem; data acquisition subsystem, communication subsystem, and supervisory control subsystem. The difference between our architecture and other communication architectures in the Smart Grid is that we are particularly linking it to the area in the sub-Grid, where we are concerning about the energy efficiency of the communication system. Although the mentioned research has considered the energy efficiency of the radio transmission in to account by putting the nodes into sleep mode after each transmission, but they did not propose an optimal network topology in terms of energy efficiency [25] and energy efficient communication system [26] which is believed to be a vital requirement for the ICT network of the Smart Grid.
Having studied the available literature on this subject, we noticed that no other research has considered energy efficiency of the communication architecture in detail and have therefore proposed an energy efficient communication architecture. Moreover they have not distinguished the communication architecture from the software architecture. This is important, since each communication architecture can be implemented in different software architectures. Therefore designing and implementing both of these architectures which are part of an integrated system for the NAN in the Smart Grid is necessary.
3.2. Principles of a Communication Architecture
Our architecture is being implemented on the medium voltage power network of the University of Manchester campus which owns its own distribution grid. This allows us to check our design on real equipment, real data, and input from experts in power engineering.
Our architecture (Figure 1) is a modular architecture that combines the peer-to-peer and hierarchical architectures, tailored to hybrid communication technologies for transmitting data. It contains five layers that cooperate to provide four main functions of monitoring, data movement, data storage and control. The meaning of layers here is different to that used in Section 3.1 since all the layers are now within a NAN. The layers refer to different functions in the total information-processing network. The reason that five layers map onto four functions is that the lowest three layers are three different sensor nets (c.f. Section 1) that all represent the same monitoring function. The remaining two layers represent the two functions of data storage and control and the fourth function refers to the connectivity between the layers, thus is not represented as a layer itself. This layered architecture is designed to address modularity, scalability, fault tolerance, energy efficiency and future proofing against changes in networking technology as follows. Modularity: since each layer can be considered as a separate component (module) which are connected together to represent the whole system. Scalability: since we are able to add or remove each of these layers (modules) without affecting the whole architecture. Fault tolerance: we prevent the single point of failure caused by the centralized architecture and move to a more distributed architecture. Energy efficiency: Given that the energy for data transmission is higher than energy for data computation [27], by reducing the transmission range and adding more computation unit such as CHs or other sub-layers to the system we may achieve an energy efficient architecture. Future proofing: the design is conceived at an abstract level independent from particular communication technologies.
This system is designed for the future intelligent power grid, in that it is able to incorporate different control strategies at various level of the NAN. The first three layers are mainly responsible for sensing, measuring and collecting data. The other two layers present the database and control layers responsible for computing, storing, visualising, and controlling the NAN.
3.3. Implementation on a Campus Sub-Grid
Figure 1 also shows the deployment of a communication architecture based on the principles discussed in the previous section. The actual physical distribution of the sensor networks and the substations determines the detail of the communication patterns between the layers. The first layer of the architecture consists of smart meters monitoring system, which are the gateway from the HAN to the NAN and are used to monitor the building level data. These devices are located in all the buildings in our campus test bed, transmitting data every 30 minutes. They are already connected to the power network and transmit data through wired connections to the data base layer. These monitoring devices provide information about power usage and permit the management of the power generation and consumption. These data can be integrated by the real-time energy prices to offer effec-
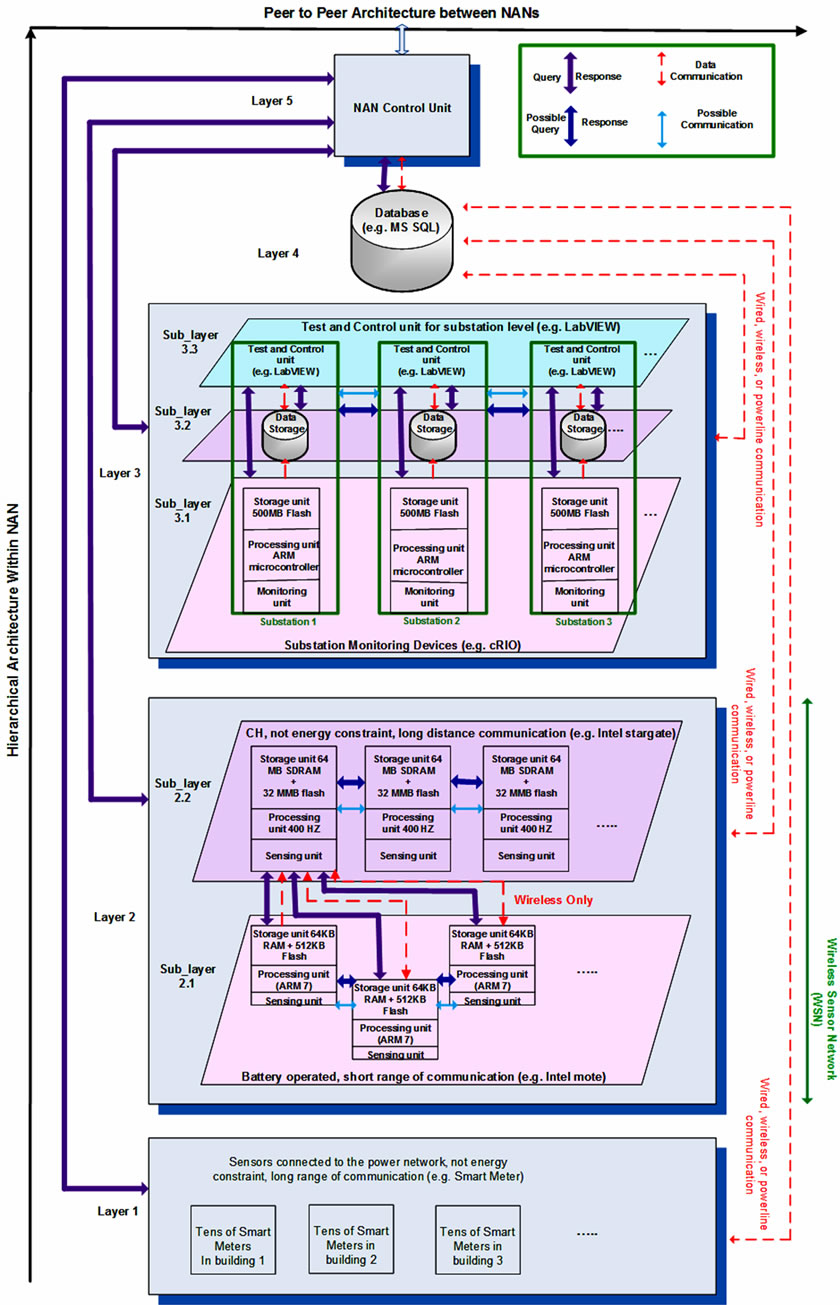
Figure 1. The Communication Network Architecture in the NAN. The substation layer is responsible to monitor 3 phases (voltages, currents, active power, reactive power, power factors, apparent power), & frequency. The street level monitoring is responsible to monitor environmental attributes such as temperature, humidity, light, cable health and so on. The building level monitoring is responsible to monitor heat, steam, gas, water and electricity consumption of each building.
tive demand response control beneficial both for energy consumers and providers.
The second layer of the architecture is composed of hundreds of sensors situated in the street areas. These monitoring systems implemented at the street level is a wireless sensor network which is used to monitor the environmental data such as temperature, light, and humidity, which are being logged every second. These environmental data are important for understanding the response of system to variables such as number of people, weather, temperature, humidity and so on. Moreover, they can help in controlling the power grid since they can provide information that can be used to anticipate demand and improve control actions. A range of applications of the WSN in the distribution network are identified in [28]. The sensors in sub-layer 2.1 run on batteries and are able to alert when they run low on battery power. The battery life with a 1% duty cycle would be 6 months [29]. Due to the energy constraint drawback of WSN, we intend to reduce their energy consumption. As a result cluster based communication algorithm for WSN has been selected as a method of communication in the field to offer energy efficiency. Consequently, these sensors are grouped into clusters, sending their data directly to the Cluster Head (CH).
The CHs (sub-layer 2.2) are responsible for transmiting the received data to the database via wireless LAN or cellular technology. In order to evaluate the WSN of the proposed architecture, we extended the WSN query processing engine called TinyDB [30] by adding a Smart Grid component to it. Thus now we are able to simulate the environmental data, receive live data in response to the queries, and feed the received data to another source of computation to apply real-time system control.
One difference between TinyDB and traditional database is that when we post a query to the sensors with TinyDB installation we receive the real-time data instead of receiving archived data in reply. Given that sensors are battery-powered devices, we tend to reduce power consumption in the system as much as possible. A typical strategy of power-efficient in-network Processing algorithm minimizes the communication cost by applying filtering and aggregation inside the sensor network and provides routing of data from a physical environment to a pc. The reason why we select TinyDB over the other query processing systems is that, not only it does contain the same features of a conventional query processing (such as join, select, project, and aggregate information), but also it provides functionality for minimizing power consumption by using acquisitional techniques. Acquisitional Query Processing (ACQP) (Madden et al., 2005) focuses on both conventional techniques as well as the new features of query processing. These new features focus on when, where, and how often data are sampled and send to a query processing operator. In contrast to conventional passive systems, power consumption of queries can be minimized by focusing on the location and cost of data acquisition.
The third layer consists of eleven 6.6 kV substations that are equipped with sixteen monitoring systems shown in Figure 2. They are implemented by a reconfigurable real-time control and acquisition system called Compact RIO (cRIO) (sub-layer 3.1), data storage (sub-layer 3.2), control unit (sub-layer 3.3), and a router to relay the data to the higher level. The Control unit (sub-layer 3.3) is the LabVIEW [31,32] program which is responsible for applying control over the substations only. The substations with one transformer are equipped with one cRIO, whereas substations with two transformers are supplied with two cRIOs. The cRIO [33] in each box is composed of the FPGA module, real-time controller, reconfigurable I/O module, and external expansion chassis. These cRIOs are running at 1 Hz to 4 Hz, thus we are receiving one to four samples per second, measuring three phases voltages, currents, active powers, power factors, voltage’s spectrums (eight channels for each phase) and current spectrums (eight channels) and frequency which can be used for identification of the fault at this level, power quality analysis, and many more applications. The data monitored by cRIO will be saved in the data storage (sub-layer 3.2) so if we lose communication we can collect data manually from the substation. These monitoring boxes are connected to the power network and are able to communicate via FTP and TCP for transmitting live data to the higher layers using wired and wireless technologies such as GPRS. Both wired and wireless technologies are used to prevent data loss, if one of the links goes down there exists another communication media for data transmission. Moreover, to avoid data loss, the collected data should be stored locally in the cRIO memory and transferred once a day to the database layer. Subsequently, the live data will be sent, from cRIO to the fourth
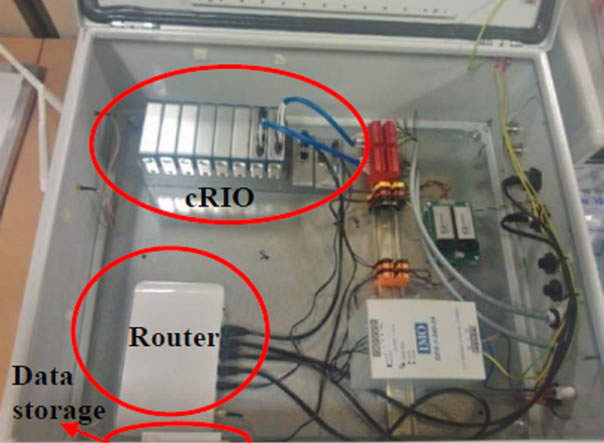
Figure 2. The monitoring box in the substation.
layer (Database) via TCP/IP or wireless communication. In future these substations should be able to communicate in order to apply better control by coordinating their decisions and preventing the conflicting scenarios.
The fourth layer is the DB layer that will store the aggregated data received from layers below, and feed the NCU (fifth layer) with collected data.
The NCU that is the top layer will apply control over the entire neighbourhood area. It can access sensing units directly in emergency situations, or indirectly through the DB layer in normal conditions. Given that better monitoring will result in more efficient control over the system, we have developed a GIS enhanced display of the network [34]. This visualization tool is located at the fifth layer.
It is helpful for engineers to utilize the visualization tool in order to track and discover the faulty part of the grid and take remedial actions.
Figure 1 illustrates these idea applied to one NAN. Numerous such NANs would be joined to monitor and control an entire sub-Grid. We consider one such NAN namely a university campus area as part of a wider urban sub-Grid. Since each NAN can take optimal decisions for its own region, which is not necessarily the optimal decision for the whole network, another layer of communication is added over the top layer to make each individual NAN aware of the state of the other NANs, and enable them coordinate their decisions.
The proposed architecture has the following advantages. Firstly it will prevent single point of failure. In case one NAN goes down, it doesn’t affect the rest of the network. Also, considering that in the second layer of the architecture, the normal sensors are very much correlated, the failure of one sensor will not severely affect the whole NAN. The CHs are responsible for collecting and sending the gathered data to the DB, the death of a CH will result in losing all the data collected from its cluster member sensors, and might impair the communication. In order to prevent such a communication failure in the NAN, the visualization tool is able to send notification when it is not receiving the data from each individual sensor for a predefined time. Thus the operators will reckon that either the CH is down or the communication path is faulty. Meanwhile if the CH is down, the cluster member sensors in the sub-layer 2.1 will transmit their data to the neighboring CH via either multi-hop or direct communication if the neighbor CH is in the transmission range of the sensor. If the CH communication path to the DB is down, the CH will transmit its received data to the neighboring CH who will be responsible to send its own cluster data and its neighbor cluster data to the DB. Secondly, by using clustering in the monitoring layer we have shown in previous work that we can reduce the energy on communications between resource constrained sensors [25].
4. Smart Grid Communication Technologies
We now discuss how we made technology choices to address the two problems mentioned in Section 1. Initially, power line communication (PLC) seemed to be the best option, since the cables are already there and there will be no deployment cost. Also the energy constraint problem of the WSN could be prevented. But due to two fundamental shortcomings, PLC was rejected. Firstly advanced noise filtering and error correction mechanism is required in PLC [35]. The noise filtering is a major problem, particularly when we want to collect fine-grained information at high cadence. Secondly if we rely on the power line to communicate with, we cannot monitor the areas with cable breakage or some other faults in the field. Thirdly there is alack of standardization between different vendors. Finally disturbances in the distribution line and switching off the distribution line will lead to changes in communication routing [18].
Another option is a satellite system, but due to cost and signal delay it is not the best available option. Fiber optics offer high bandwidth, large communication distance, low latency, and they are expected to be cost efficient in the long run, but due to the high cost of installing them in key areas of the electrical network, we consider they are not the best current option [18]. Our investigation for this project shows that what drives the cost up is the cost of actual installation of networks. Radio communication uses cheap components, they are easy to install, and can provide communication to any geographical area with poor access, therefore they were chosenIt is considered [18] that wireless can be used either for communications in the substation, or over longer path such as between substations or between enterprise and the substation. Radio communications are not disturbed by electro magnetic interference from the electric and magnetic fields in each substation, making them very suitable for substation monitoring. Among various wireless communication technologies, each individual technology seems to be suitable for specific applications in the Smart Grid. As an example Zig Bee (IEEE 802.15.4) operating on various unlicensed frequency bands with 20 - 250 Kbps data rate, covering 10 - 100 m, is suitable for home area networks [17]. Infrared-based transmission is only suitable for home and indoor applications due to its drawback that can easily get absorbed by rain and dust, and because of its short coverage [36].
Wireless LAN (IEEE 802.11a, b, g, n, i), WiMAX (802.16), cellular technology, and Mobile Broadband Wireless Access (IEEE 802.20) are appropriate for wide area network applications and in the proposed architecture they are suitable for providing the communication between the WSN and NCU. Bluetooth (802.15.1) has low power, short-range coverage between 1 to 100 m with extended antenna, and 721 Kbps data rate. Considering the fact that the bandwidth requirements for the NAN is between 100 to 500 Kbps [37], Bluetooth seems to be a good candidate for monitoring applications in a HAN and NAN. However, Bluetooth is less secure compared to other standards, and interferes with IEEE 802.11 [17]. Despite these drawbacks of Bluetooth its low power requirements fit the need for communication between street level sensors. Additionally, Bluetooth is able to integrate well with mobile phones used by engineers in the field.
5. Software Architecture
In addition to the communication network architecture, the system requires us to design a software architecture to process data and store data and to evaluate control decisions. These two architectures (communication architecture and software architecture) are part of an integrated design for the ICT of the Smart Grid.
5.1. Proposed Software Architecture
In designing a software architecture for the ICT in the NAN sub-Grid, we choose to componentize the NAN system into interacting sub-systems. Utilising cluster based communication and componentizing the ICT network monitoring of the NAN results in a scalable architecture that can cope with future implementations and additions to the system.
The software architecture design shown in Figure 3 contains a server side and a client side. The server side itself has 3 layers, namely an infrastructure layer, a persistence layer, and an application layer. The infrastructure layer is itself componentized into three monitoring levels, each relating to a specific section of the NAN in the distribution sub-Grid including building level, street level, and substation level monitoring as described earlier.
The persistence layer contains a local database which stores all the data received from the infrastructure layer, and a database connectivity module which use an interface to connect to the next layer which is the application layer. The backup strategy embedded in this level will enhance the preservation of the data. Moreover it will accommodate the ever-increasing volume of data produced by the infrastructure layer.
The application layer is a NET application which is able to connect to the outside world, and send HTTP request and respond to the client side.
On the client side we have used technologies such as ASPX, CSS, JavaScript, Ajax, and Google Maps API to visualise the collected data that can then be viewed by the Grid operator.
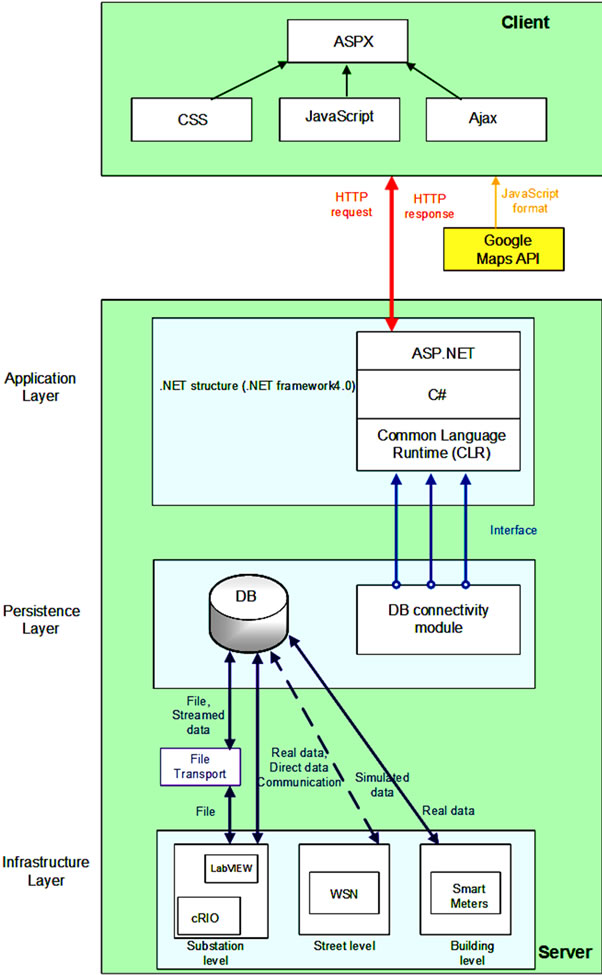
Figure 3. Software architecture.
5.2. Deployment of the Software Architecture
The Client side of the architecture and also the Application layer and persistence layer of the Server side have been fully implemented and being used. The monitoring system of the Building level and Substation level in the Infrastructure layer are also installed and the software system has been implemented. Therefore, the Persistence layer is receiving real data from these two monitoring levels. The Figures 4 and 5 show the real data being monitored by our system.
The Street level monitoring sensors are not yet available, hence we have extended the TinyDB and used TOSSIM [38], the WSN simulator, to simulate the environmental data being monitored by this level. Although TOSSIM is a more complex simulation compared to abstract simulations, but it enables users to take their implementation and run it on the actual mote. This feature motivates us to select TOSSIM over other existing simulations. Therefore, we are able to run and test our prototype implementation on the real physical environment as well as laboratory-based environment. As the result the
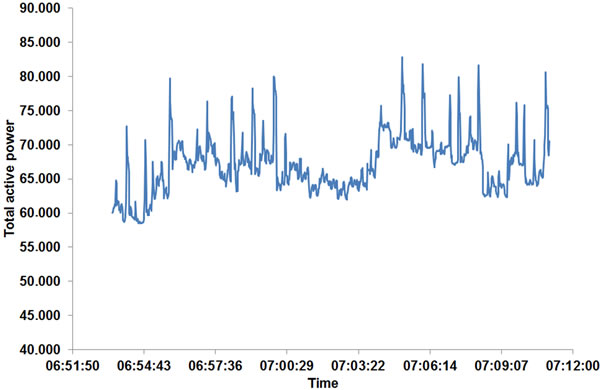
Figure 4. Example of real data captured from Substation level monitoring, showing Total Active Power from 6:53:26 to 7:11:02 on 24th April 2013.
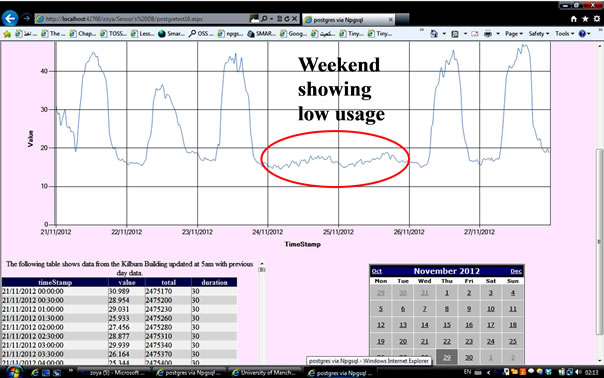
Figure 5. Example of real data captured from Building level monitoring during one week from 21st November 2012 to 28th November 2012.
Persistence layer is receiving simulated data from the Street level monitoring. The Figure 6 shows the simulation data, simulated by TOSSIM.
According to our knowledge this is the first software architecture introduced and implemented for the NAN in the distribution sub-Grid which could integrate various level of monitoring from building level to the street level and finally the substation level, and apply monitoring and control over the collected data at such level.
5.3. Emergency Scenarios
Handling the emergency scenarios in the NAN plays an important role in preventing the catastrophic failure of the larger area. To show how the architecture can respond we have identified three possible emergency scenarios and proposed a solution for them, this is not intended to be an exhaustive list but to show the principles of the software design.
The first emergency scenario is when the individual sensors go down. In normal situation this might affect the routing of the system. In the server side of our proposed architecture, if the individual sensor in each of monitor-

Figure 6. Example of simulation data from Street level monitoring, showing that we have used a periodic random generator number.
ing goes down, it will not affect the routing of the whole system, because each individual sensor has direct communication instead of multi-hop communication to their CH.
A second scenario (Figure 7) is to lose the persistence layer. The application will alert the user if it is not receiving data from the DB for a specific time. This means either the DB component or the links to and from the DB is down. In this case we are losing both the historical data stored in the DB, and the live data. To recover the historical data we have built a temporary DB in the application layer to save data for the past 4 weeks, and start deleting from the oldest data as the new data come in. To recover the live data we are able to change the destination of the program which is extracting data from the sensors. Therefore instead of transmitting data to the DB, we can set the destination to the developed application. Thus we can receive live data in the application and then visualise them even if the DB or the links to the DB is down.
A third emergency scenario (Figure 8) is when the values of the monitored electrical data exceed a warning thres hold. In this case our application can alert the operator of the Grid who is behind the screen in the control room. The application will also use a component to send SMS to the engineers in the field. Moreover it will use the web services to send alert to the engineers and other neighbouring areas, this will inform the other areas of the fault happening in a specific area, and will prevent conflicting actions. The other advantages of using both the SMS service and the web service is that in the critical times when the network is busy, using the other system can assure the reception of the alarm in a reasonable amount of time.
At the end the idea behind implementing these emergency scenarios is that utilising the effective ICT architecture which can cope with the failure situations will
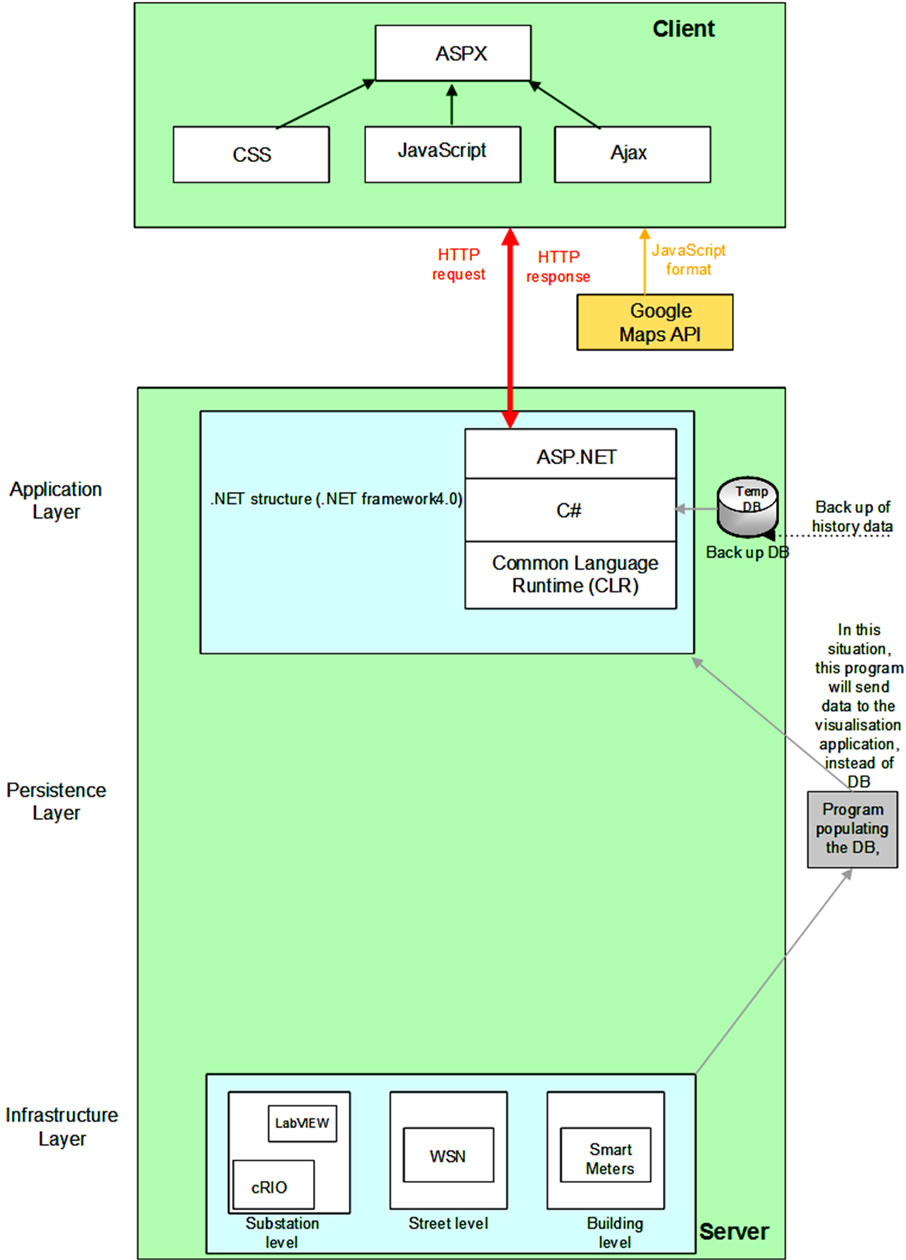
Figure 7. Persistence layer is down.
enable the grid to take intelligent decisions in a timely manner and prevent series of failure.
6. Conclusions
In this paper we have focused on the NAN level of the electrical network where monitoring has not previously been deployed. We have surveyed the various communication technologies, and find the most appropriate choices for this specific section of the grid. We have described the design and implementation of an energy efficient communication network architecture on a real test bed, namely a sub-Grid covering a large university campus and presents how we collect data at this level. Moreover, we have discussed how we have designed and implemented a software architecture which is responsible to offer intelligence to our system.
The key contribution of our work is that it can deliver the information from the building levels, environmental conditions, and finally from the power grid below 6.6 kV which remains unknown until now. It will deliver the collected data to the experts and demonstrates what is happening in the lower voltage network that will consequently offer better control over the grid. According to our knowledge there is no previous architecture that
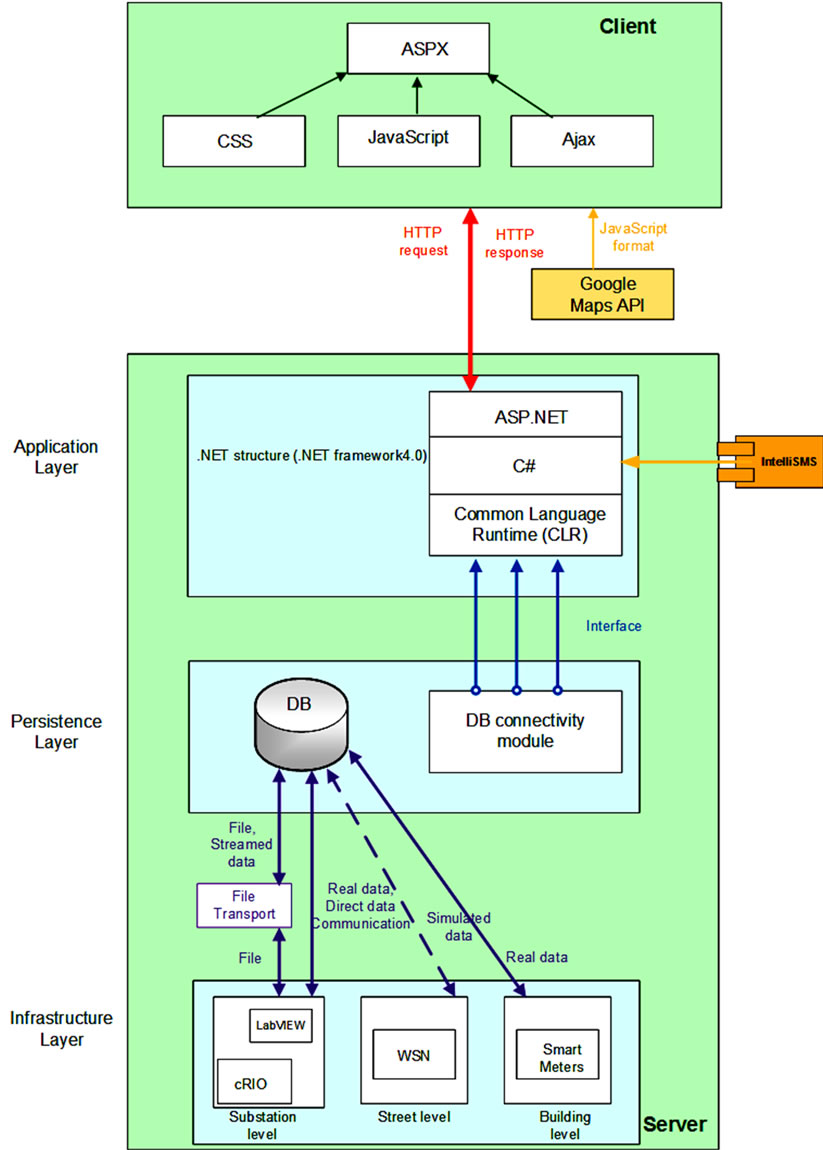
Figure 8. Using text messages for alerting the users.
could integrate all these information as a whole system for this level of the electrical Grid. A further stage of this research is to investigate control strategies, for the NAN level of the Grid, to further the decentralised control of the whole Grid.
REFERENCES
- J. Miller, S. Pullins and S. Bossart, “The Modern Grid,” US Department of Energy, Office of Electricity Delivery and Energy Reliability, Bartlesville, 2008.
- N. Kayastha, D. Niyato, E. Hossain and Z. Han, “Smart Grid Sensor Data Collection, communication, and Networking: A Tutorial,” Wireless Communications and Mobile Computing, 2012, pp. 1-33. doi:10.1002/wcm.2258
- M. Daoud and X. Fernando, “On the Communication Requirements for the Smart Grid,” Energy and Power Engineering, 2011, pp. 53-60.
- Y. Rong, Z. Yan, S. Gjessing, Y. Chau, X. Shengli and M. Guizani, “Cognitive Radio Based Hierarchical Communications Infrastructure for Smart Grid,” Network, IEEE, Vol. 25, No. 5, 2011, pp. 6-14. doi:10.1109/MNET.2011.6033030
- K. Khan, R. Haines and J. M. Brooke, “A Distributed Computing Architecture to Support Field Engineering in Networked Systems,” Proceedings of the 2010 International Conference on Complex, Intelligent and Software Intensive Systems, Krakow, 2010, pp. 54-61.
- J. Machell, S. R. Mounce and J. B. Boxall, “Online ModElling of Water Distribution Systems: A UK Case Study,” Drinking Water Engineering and Science, Vol. 2, 2010, pp. 279-294.
- I. Stoianov, L. Nachman, S. Madden and T. Tokmouline, “PIPENETa Wireless Sensor Network for Pipeline Monitoring,” Proceedings of the 6th International Conference on Information Processing in Sensor Networks, Cambridge, 25-27 April 2007, pp. 264-273.
- D. Hughes, P. Greenwood, G. Blair, G. Coulson, P. Grace, F. Pappenberger, P. Smith and K. Beven, “An Experiment with Reflective Middleware to Support Grid-Based Flood Monitoring,” Concurrency and Computation: Practice and Experience, Vol. 20, No. 11, 2008, pp. 1303-1316. doi:10.1002/cpe.1279
- Q. Yang, J. A. Barria and T. C. Green, “Communication Infrastructures for Distributed Control of Power Distribution Networks,” IEEE Transactions on Industrial Informatics, Vol. 7, No. 2, 2011, pp. 316-327. doi:10.1109/TII.2011.2123903
- D. A. Roberts, “Network Management Systems for Active Distribution Networks—A Feasibility Study,” SP Power Systems Ltd, Scottish Power Plc., Scotland, 2004.
- M. Qiu, W. Gao, M. Chen, J. W. Niu and L. Zhang, “Energy Efficient Security Algorithm for Power Grid Wide Area Monitoring System,” IEEE Transactions On Smart Grid, Vol. 2, No. 4, 2011, pp. 715-723. doi:10.1109/TSG.2011.2160298
- A. A. Abbasi and M. Younis, “A Survey on Clustering Algorithms for Wireless Sensor Networks,” Computer Communication, Vol. 30, No. 14-15, 2007, pp. 2826-2841.
- V. Raghunathan, C. Schurgers, S. Park and M. B. Srivastava, “Energy Efficient Design of Wireless Sensor Nodes,” Wireless Sensor Networks, Kluwer Academic Publishers, Norwel, 2004.
- M. A. Youssef, M. F. Younis and K. A. Arisha, “Performance Evaluation of an Energy-Aware Routing Protocol for Sensor Networks,” 2003.
- A. Chuang and M. McGranaghan, “Functions of a Local Controller to Coordinate Distributed Resources in a Smart Grid,” Power and Energy Society General Meeting— Conversion and Delivery of Electrical Energy in the 21st Century, Pittsburgh, 20-24 July 2008, pp. 1-6.
- R. E. Brown, “Impact of Smart Grid on Distribution System Design,” Power and Energy Society General Meeting— Conversion and Delivery of Electrical Energy in the 21st Century, 2008, pp. 1-4.
- P. P. Parikh, M. G. Kanabar and T. S. Sidhu, “Opportunities and Challenges of Wireless Communication Technologies for Smart Grid Applications,” Power and Energy Society General Meeting, Minneapolis, 25-29 July 2010, pp. 1-7.
- D. E. Nordell, “Communication Systems for Distribution Automation,” Transmission and Distribution Conference and Exposition, Chicago, 2008, pp. 1-14.
- A. Krkoleva, V. Borozan, A. Dimeas and N. Hatziargyriou, “Requirements for Implementing Gossip Based Schemes for Information Dissemination in Future Power Systems,” 2nd IEEE PES International Conference and Exhibition on Innovative Smart Grid Technologies (ISGT Europe), Manchester, 5-7 December 2011, pp. 1-7.
- M. Ali, M. Zakariya, M. Asif and A. Ullah, “TCP/IP Based Intelligent Load Management System in Micro-Grids Network Using MATLAB/Simulink,” Energy and Power Engineering, Vol. 4, No. 4, 2012, pp. 283-289. doi:10.4236/epe.2012.44038
- F.Aalamifar, H. S. Hassanein and G. Takahara, “Viability of Powerline Communication for the Smart Grid,” 2012 26th Biennial Symposium on Communications (QBSC), Kingston, 28-29 May 2012, pp. 19-23.
- B. Al-Omar, A. R. Al-Ali, R. Ahmed and T. Landolsi, “Role of Information and Communication Technologies in the Smart Grid,” Journal of Emerging Trends in Computing and Information Sciences, Vol. 3, No. 5, 2012, pp. 707-716.
- M. Wiboonrat, “Next Generation Data Center Design under Smart Grid,” 4th International Conference on Ubiquitous and Future Networks (ICUFN), Phuket, 2012, pp. 103-108.
- F. Salvadori, C. S. Gehrke, M. D. Campos, P. S. Sausen and A. C. Oliveira, “A Hybrid Network Architecture Applied to Smart Grid,” International Journal of Computing and Network Technology, Vol. 1, No. 1, 2013, pp. 67-81. doi:10.12785/ijcnt/010104
- Z. Pourmirza and J. M. Brooke, “The Wireless Sensor Network and Local Computational Unit in the Neighbourhood Area Network of the Smart Grid,” International Conference on Sensor Networks (SENSORNETS), Barcelona, 19-21 February 2013, pp. 84-88.
- Z. Pourmirza and J. M. Brooke, “Data Reduction for an ICT Network in the Smart Grid,” The 9th International Conference on Intelligent Environments, Athens, 18-19 July 2013, pp. 224-227.
- W. R. Heinzelman, A. Chandrakasan and H. Balakrishnan, “Energy-Efficient Communication Protocol for Wireless Microsensor Networks,” Proceedings of the 33rd Hawaii International Conference on System Sciences, Hawaii, 2000, pp. 1-10. doi:10.1109/HICSS.2000.926982
- Z. Pourmirza and J. M. Brooke, “The Monitoring Network Architecture in the Neighbourhood Area of the Smart Grid,” Salford Postgraduate Annual Research Conference (SPARC), Salford, 30-31 May 2012, pp. 1-4.
- R. Kling, “Intel Research mote,” Intel Corporation Research, Santa Clara, 2003.
- S. R. Madden, M. J. Franklin, J. M. Hellerstein and W. Hong, “TinyDB: An Acquisitional Query Processing System for Sensor Networks,” ACM Transactions on Database Systems, Vol. 30, No. 1, 2005, pp. 122-173. doi:10.1145/1061318.1061322
- National Instruments, “What Is NI LabVIEW?” 2011. http://www.ni.com/labview/whatis
- LabVIEW, “LabVIEW Fundamentals,” National Instruments Corporation, Austin, 2007.
- National Instrumrnts, “NI CompactRIO—Reconfigurable Control and Acquisition System, 2011. http://www.ni.com/compactrio/whatis
- Z. Pourmirza and J. M. Brooke, “Monitoring and Visualising a Neighbourhood Area Sub-Grid,” SMARTGREENS 2013-2nd International Conference on Smart Grids and Green IT Systems, Aachen, 9-10 May 2013. pp. 127-131.
- S. Galli, A. Scaglione and Z. Wang, “Power Line Communications and the Smart Grid,” 1st IEEE International Conference on Smart Grid Communications, Gaithersburg, 4-6 October 2010, pp. 303-308.
- Y. Tan, Y. Shi, Y. Chai, G. Wang, J. Liu, J. Wang, N. Li, and Z. Chen, “Research and Validation of the Smart Power Two-Way Interactive System Based on Unified Communication Technology,” Advances in Swarm Intelligence, Springer Berlin/Heidelberg, Berlin, 2011.
- P. Rengaraju, L. Chung-Horng and A. Srinivasan, “Communication Requirements and Analysis of Distribution Networks Using WiMAX Technology for Smart Grids,” 8th International Wireless Communications and Mobile Computing Conference (IWCMC), Cyprus, 27-31 August 2012, pp. 666-670.
- P. Levis and N. Lee, “TOSSIM: A Simulator for TinyOS Networks,” University of Berkeley, Berkeley, 2003.
NOTES
1http://www.shef.ac.uk/neptune/projectdetails